
Semi-Correlations for the Simulation of Dermal Toxicity


Abstract
1. Introduction
2. Materials and Methods
2.1. Data
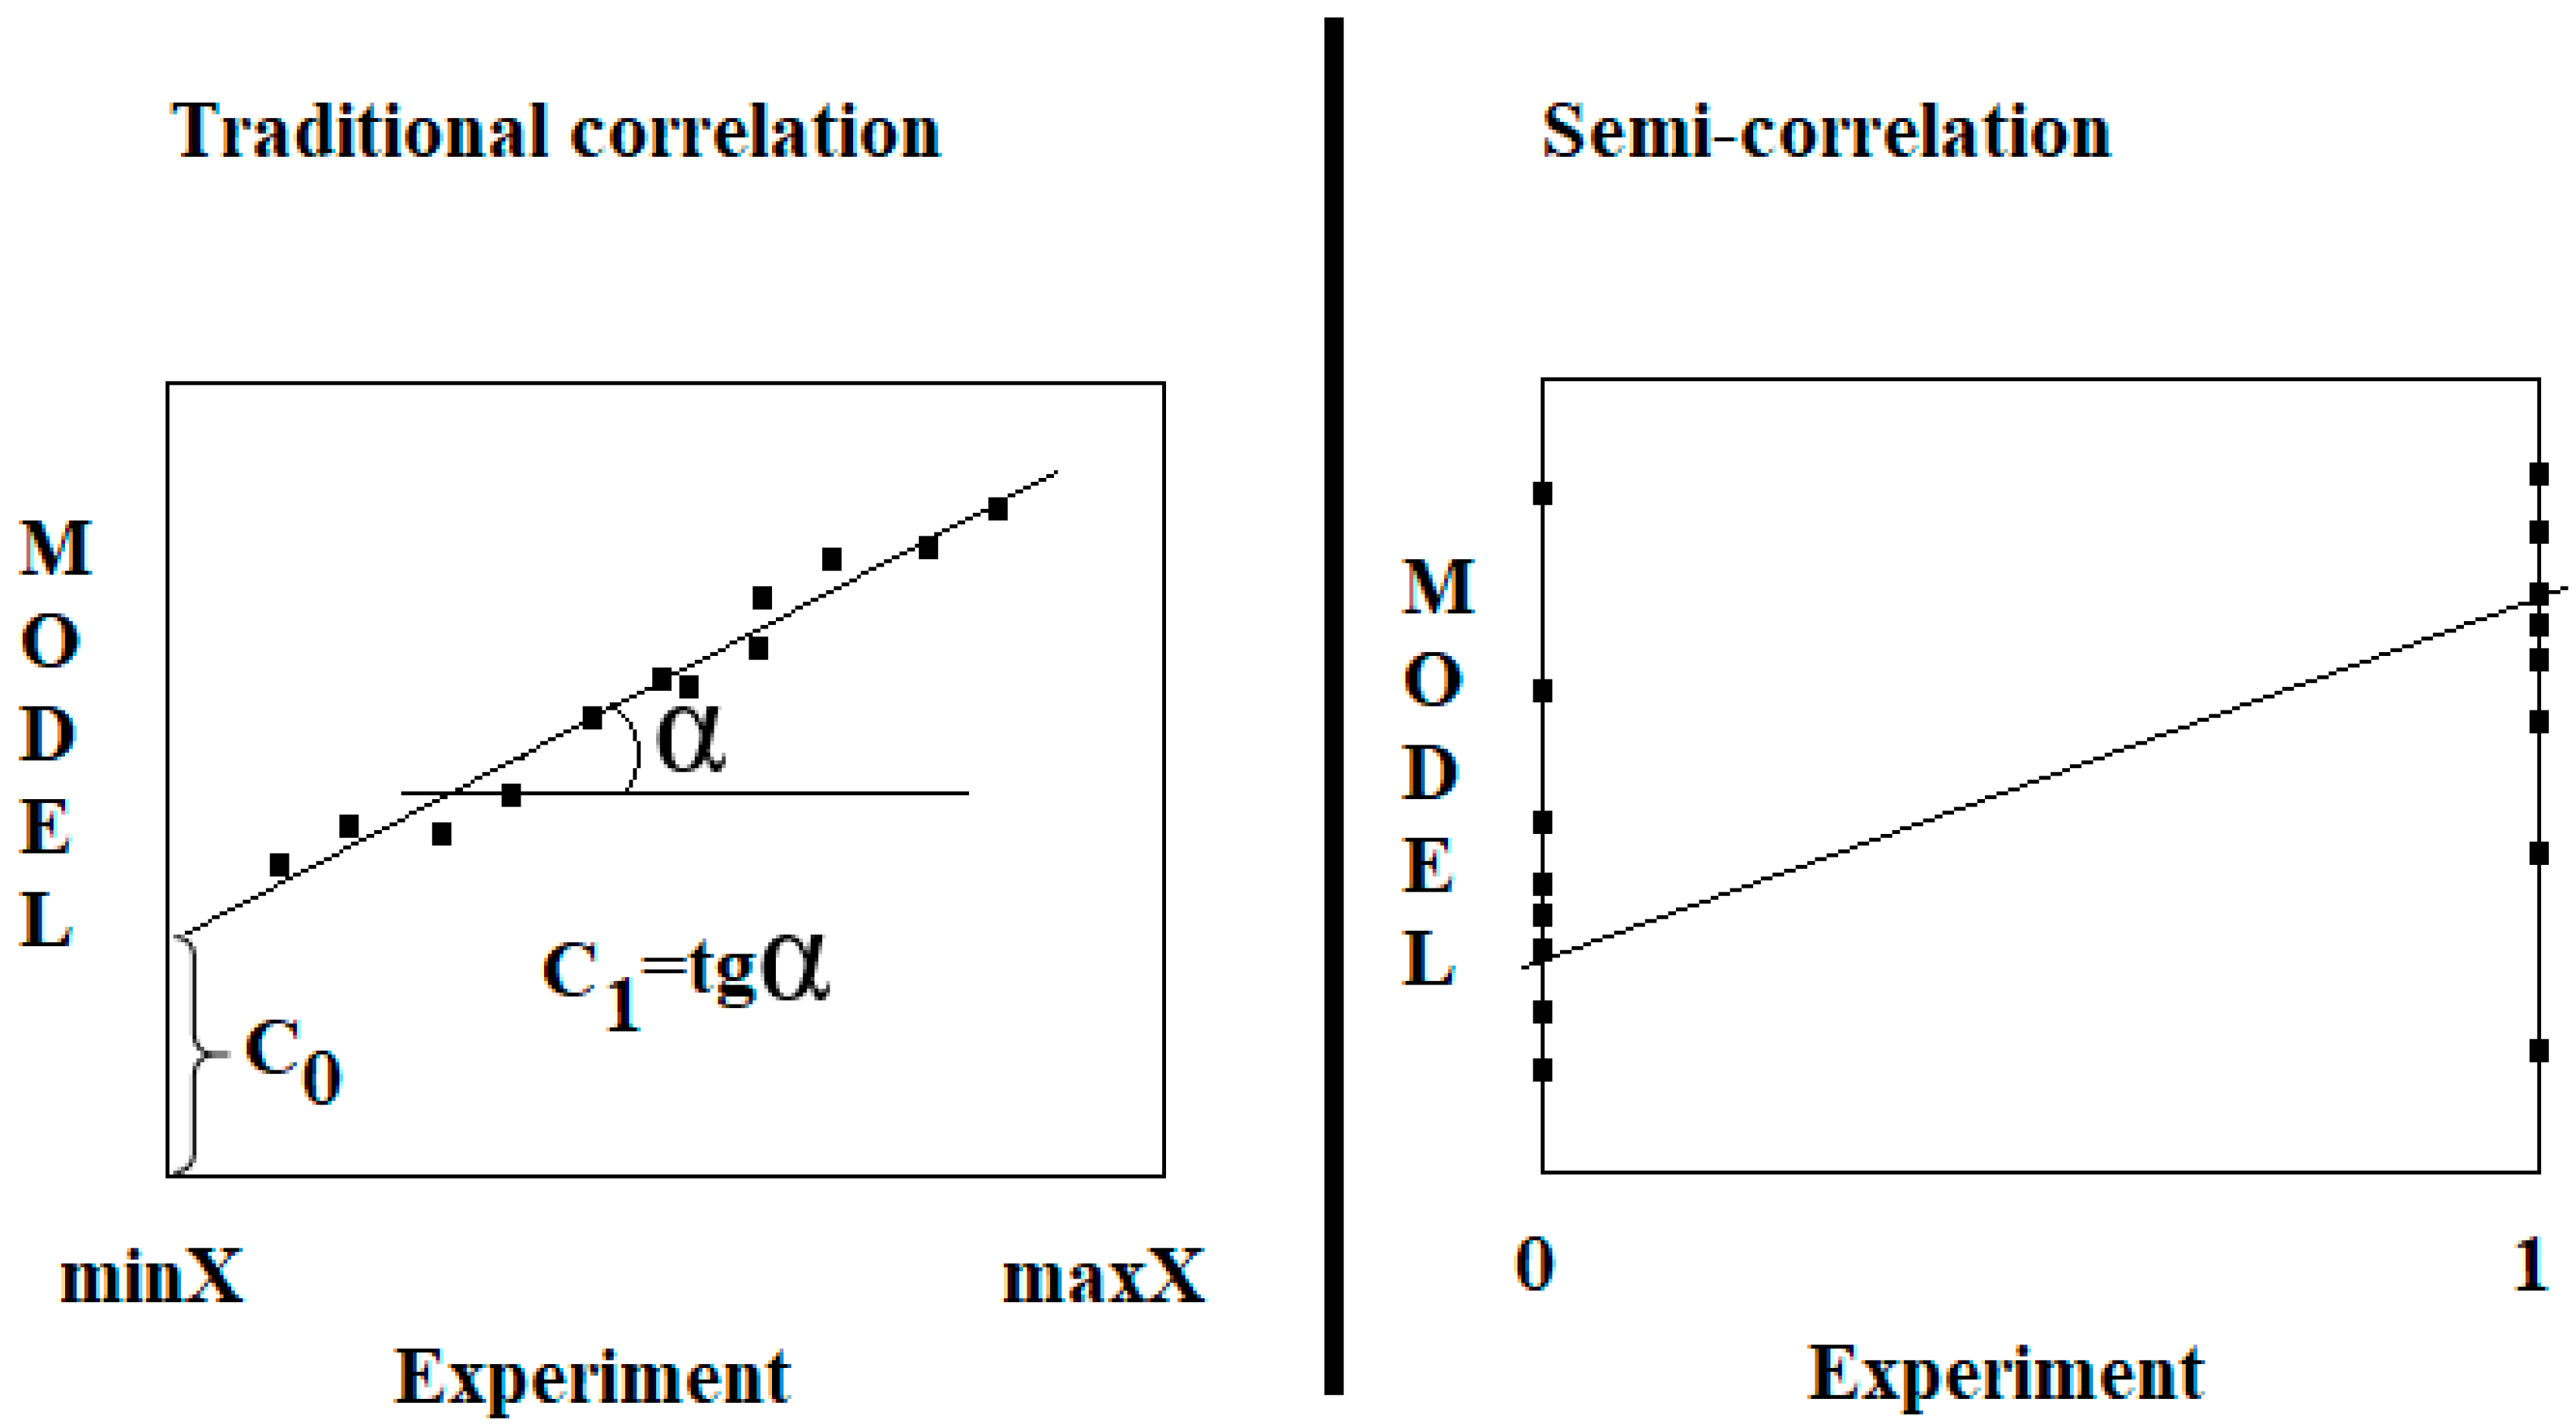
2.2. Model
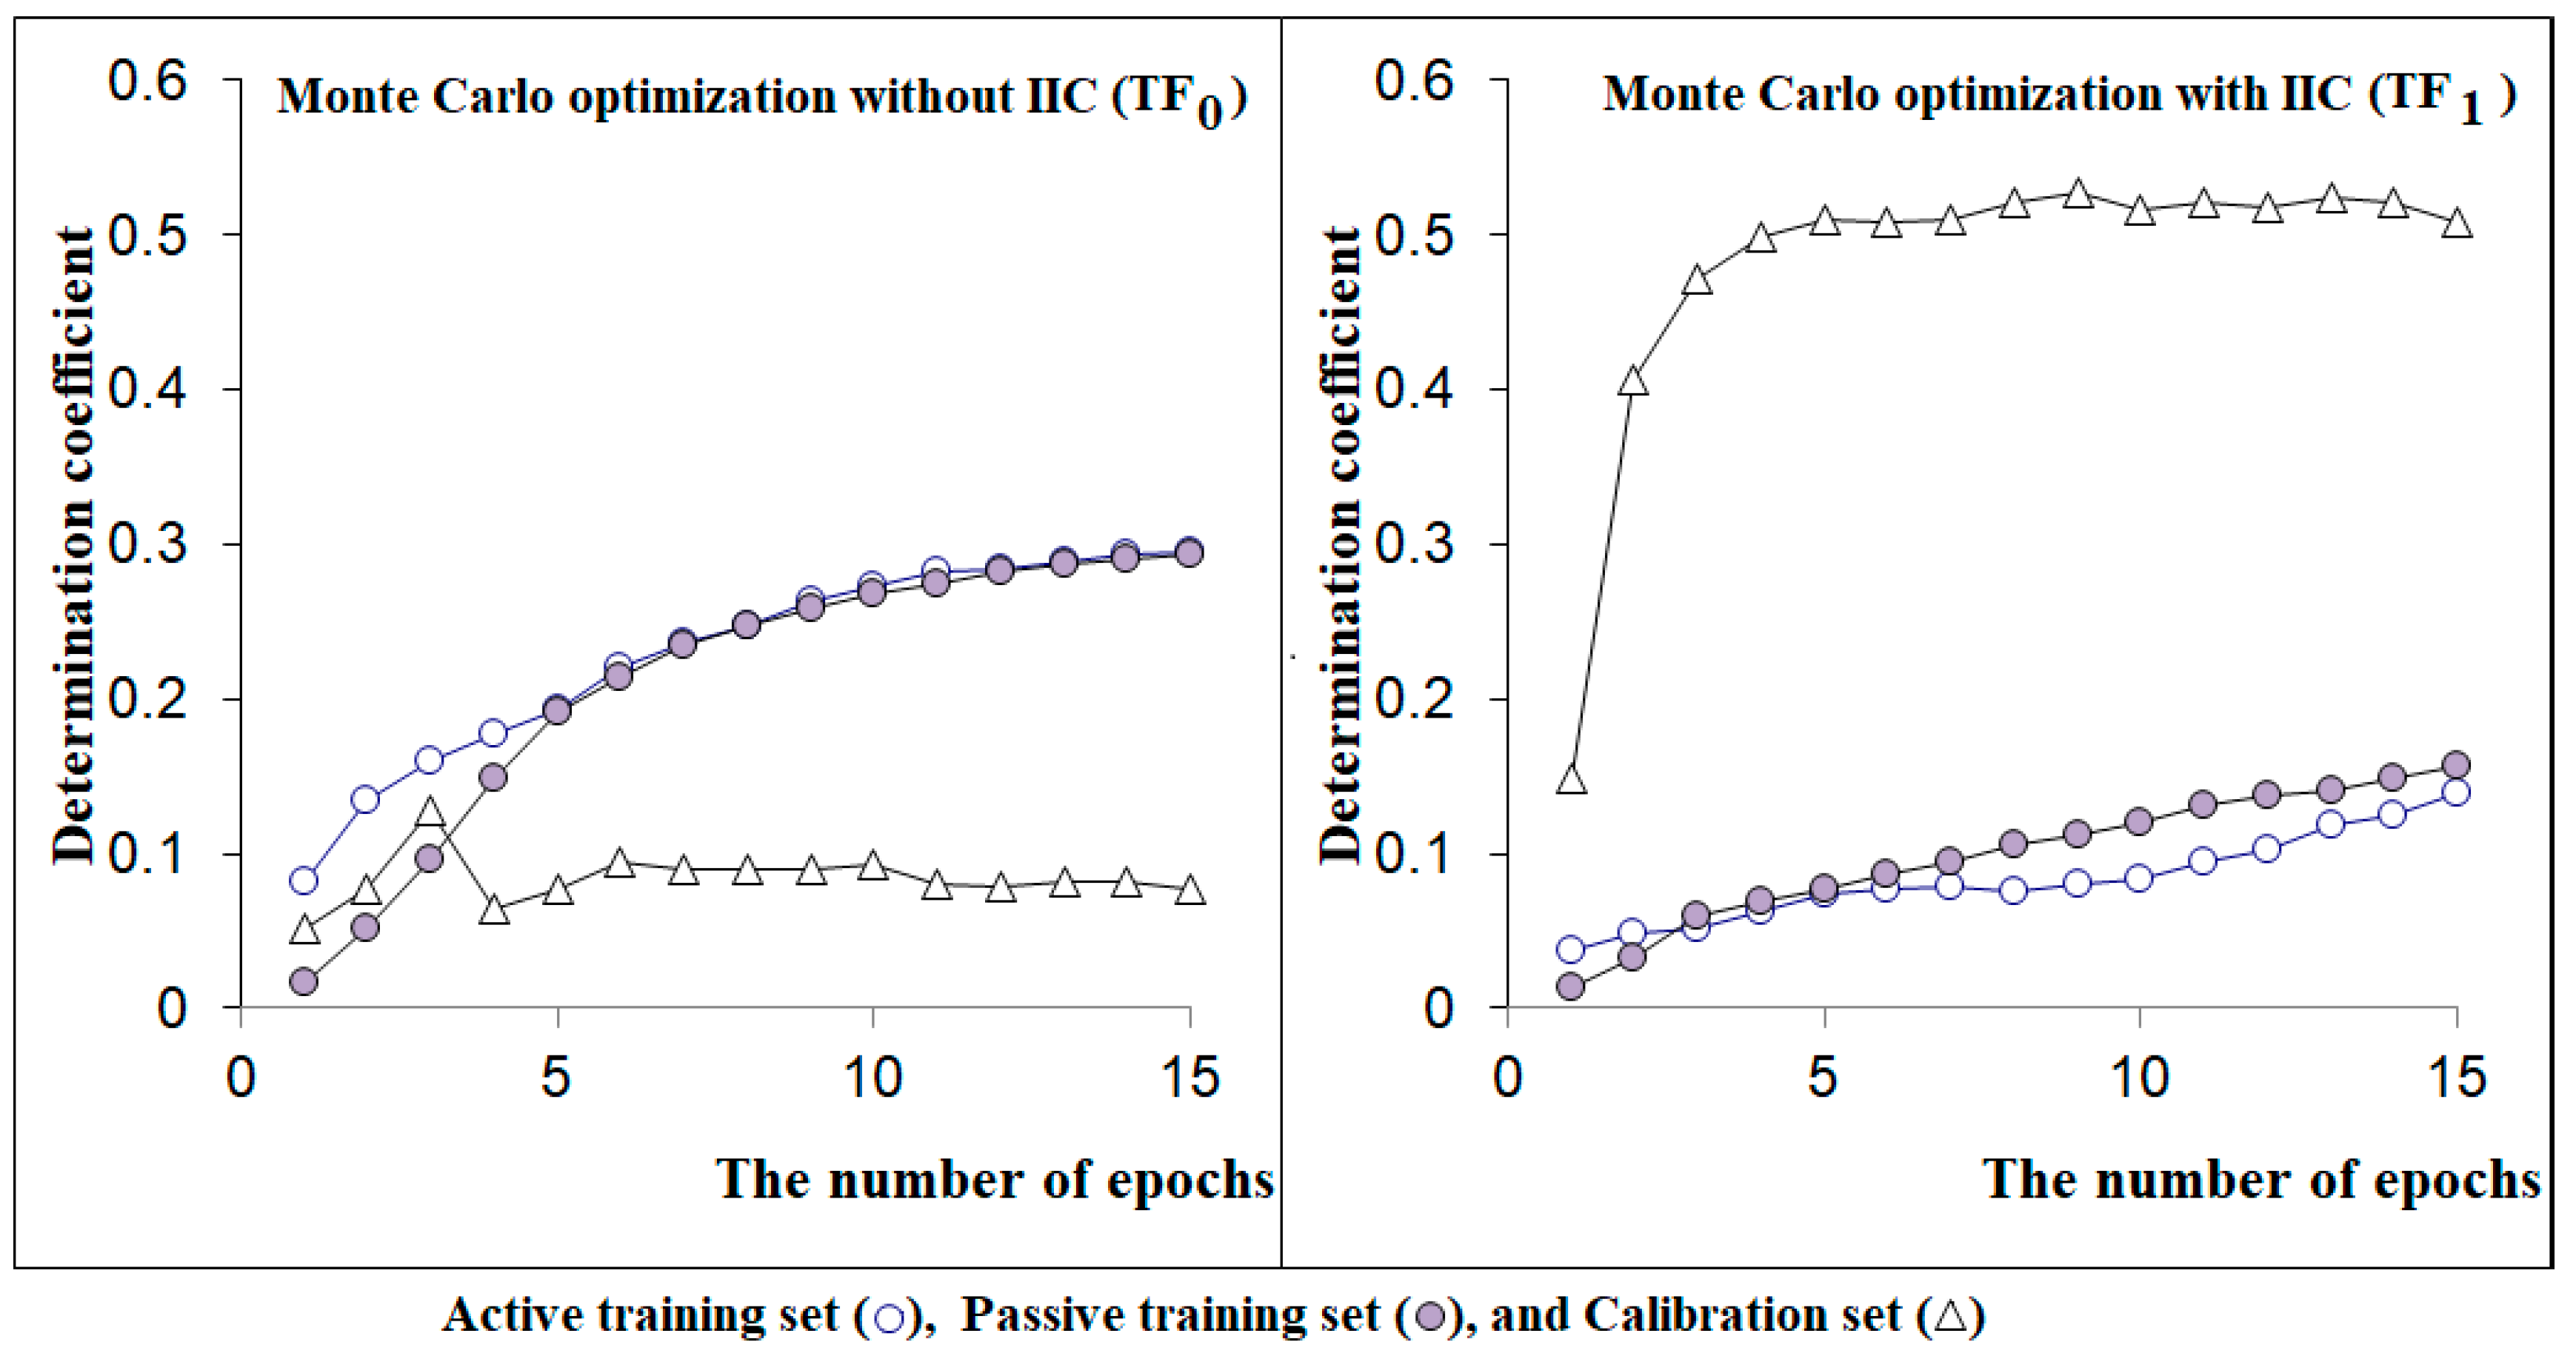
2.3. Monte Carlo Optimization
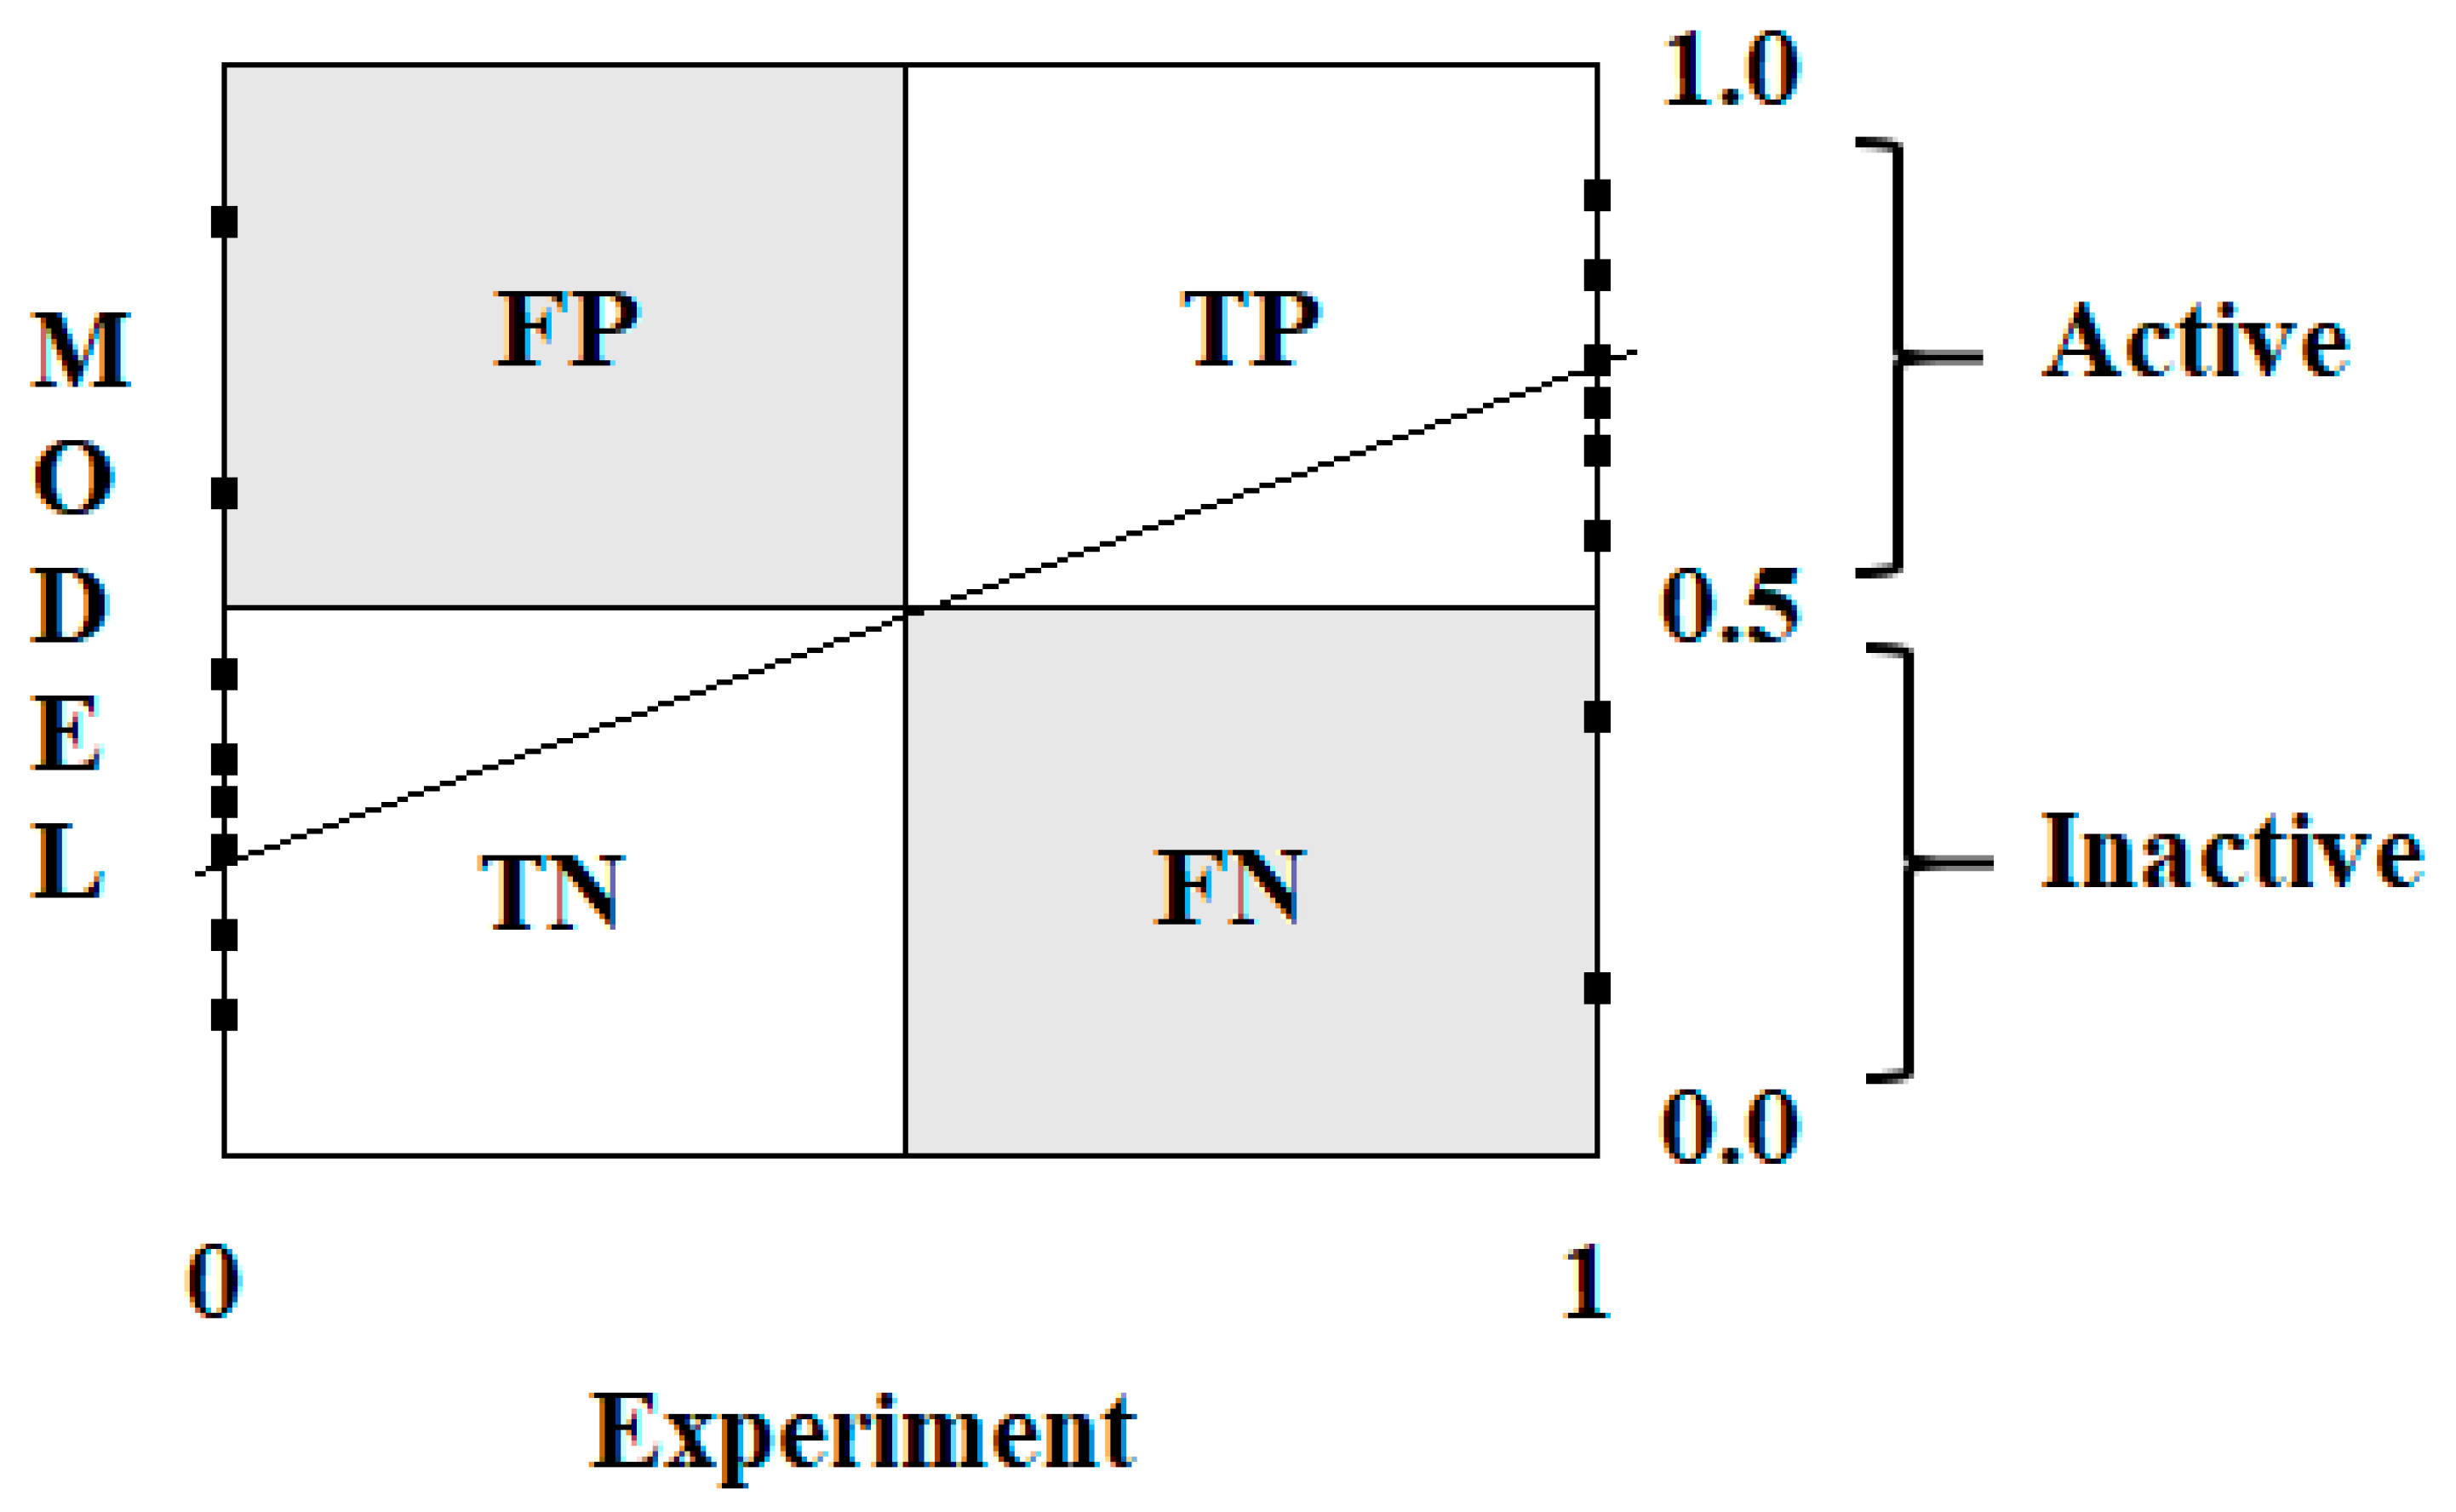
2.4. Applicability Domain
2.5. Mechanistic Interpretation
- (i)
- Codes that have a positive value for the correlation weight in all runs. These are promoters of endpoint increase;
- (ii)
- Codes that have a negative value for the correlation weight in all runs. These are promoters of endpoint decrease;
- (iii)
- Codes that have both negative and positive values for the correlation weight in different runs of the optimization. These are codes with unclear roles (one cannot classify these features as promoters of increase or decrease for the endpoint).
3. Results
4. Discussion
5. Conclusions
Supplementary Materials
Author Contributions
Funding
Institutional Review Board Statement
Informed Consent Statement
Data Availability Statement
Conflicts of Interest
References
- Ma, X.; Fu, X.; Wang, T.; Zhuo, L.; Zou, Q. GraphADT: Empowering interpretable predictions of acute dermal toxicity with multi-view graph pooling and structure remapping. Bioinformatics 2024, 40, btae438. [Google Scholar] [CrossRef]
- Lou, S.; Yu, Z.; Huang, Z.; Wang, H.; Pan, F.; Li, W.; Liu, G.; Tang, Y. In silico prediction of chemical acute dermal toxicity using explainable machine learning methods. Chem. Res. Toxicol. 2024, 37, 513–524. [Google Scholar] [CrossRef] [PubMed]
- Belsito, D.; Bickers, D.; Bruze, M.; Calow, P.; Greim, H.; Hanifin, J.M.; Rogers, A.E.; Saurat, J.H.; Sipes, I.G.; Tagami, H. A toxicologic and dermatologic assessment of cyclic and non-cyclic terpene alcohols when used as fragrance ingredients. Food Chem. Toxicol. 2008, 46 (Suppl. S11), S1–S71. [Google Scholar] [CrossRef]
- Kumar, S.; Nikam, Y.P.; Baruah, S.; Kushari, S.; Ghose, S.; Prasad, S.K.; Das, A.; Banu, Z.W.; Kalita, J.; Laloo, D. Safety profile assessment of standardized root extract of Potentilla fulgens in Wistar rats: Acute and sub-acute dermal toxicity study. J. Appl. Pharm. Sci. 2024, 14, 138–147. [Google Scholar] [CrossRef]
- Dattaray, D.; Roy, P.; Chakraborty, J.; Mandal, T.K. Evaluation of acute and subacute dermal toxicity of antibacterial bioactive glass-infused surgical cotton gauze in Wistar rats. Drug Chem. Toxicol. 2024, 47, 1–12. [Google Scholar] [CrossRef]
- Aswathy, A.A.; Shibin, F.P.; Maya, M.; Sasidharan, S.; Radha, R.K. Acute dermal toxicity study of flower essential oil from Etlingera fenzlii (Kurz.) K. Schum. in Wistar albino rats. Res. J. Biotechnol. 2023, 18, 126–130. [Google Scholar] [CrossRef]
- Pengiran, H.; Kamaldin, J.B.; Leo, B.F.; Sabri, N. Evaluating the acute dermal toxicity and skin irritation of the temephos impregnated cellulose nanofiber intended for mosquito larvicide. J. Health Transl. Med. 2023, 1, 194–201. [Google Scholar] [CrossRef]
- van der Kamp, S.; Elliott, C. Increasing confidence in waiving dermal toxicity studies: A comparison of oral and dermal acute data with alternative approaches for agrochemicals and products. Regul. Toxicol. Pharmacol. 2021, 121, 104865. [Google Scholar] [CrossRef]
- Friday, A.; Abalaka, M.E.; Halimat, A.; Builders, P.F. Gas chromatography-mass spectrometry analysis, druggability and in-silico dermatopharmacokinetics screening of mitracarpus scaber extract. J. Phytomedicine Ther. 2024, 23, 1607–1618. [Google Scholar] [CrossRef]
- Christian Fischer, B.; Harrison Foil, D.; Kadic, A.; Kneuer, C.; König, J.; Herrmann, K. Pobody’s Nerfect: (Q)SAR works well for predicting bacterial mutagenicity of pesticides and their metabolites, but predictions for clastogenicity in vitro have room for improvement. Comput. Toxicol. 2024, 30, 100318. [Google Scholar] [CrossRef]
- Pawar, G.; Madden, J.C.; Ebbrell, D.; Firman, J.W.; Cronin, M.T.D. In silico toxicology data resources to support read-across and (Q)SAR. Front. Pharmacol. 2019, 10, 561. [Google Scholar] [CrossRef]
- Weininger, D. Smiles. 3. Depict. Graphical depiction of chemical structures. J. Chem. Inf. Comput. Sci. 1990, 30, 237–243. [Google Scholar] [CrossRef]
- Toropova, A.P.; Toropov, A.A. CORAL: Binary classifications (active/inactive) for drug-induced liver injury. Toxicol. Lett. 2017, 268, 51–57. [Google Scholar] [CrossRef] [PubMed]
- Iovine, N.; Toropova, A.P.; Toropov, A.A.; Roncaglioni, A.; Benfenati, E. Models for the No-Observed-Effect Concentration (NOEC) and maximal half-effective concentration (EC50). Toxics 2024, 12, 425. [Google Scholar] [CrossRef]
- Borba, J.V.B.; Alves, V.M.; Braga, R.C.; Korn, D.R.; Overdahl, K.; Silva, A.C.; Hall, S.U.S.; Overdahl, E.; Kleinstreuer, N.; Strickland, J.; et al. STopTox: An in silico alternative to animal testing for acute systemic and topical toxicity. Environ. Health Perspect. 2022, 130, 027012–1. [Google Scholar] [CrossRef]
- Box, G.E.P. Science and statistics. J. Am. Stat. Assoc. 1976, 71, 791–799. [Google Scholar] [CrossRef]
- Toropova, A.P.; Toropov, A.A.; Benfenati, E.; Gini, G. Co-evolutions of correlations for QSAR of toxicity of organometallic and inorganic substances: An unexpected good prediction based on a model that seems untrustworthy. Chemom. Intell. Lab. Syst. 2011, 105, 215–219. [Google Scholar] [CrossRef]
- Ahmadi, S.; Lotfi, S.; Hamzehali, H.; Kumar, P. A simple and reliable QSPR model for prediction of chromatography retention indices of volatile organic compounds in peppers. RSC Adv. 2024, 14, 3186–3201. [Google Scholar] [CrossRef]
- Soleymani, N.; Ahmadi, S.; Shiri, F.; Almasirad, A. QSAR and molecular docking studies of isatin and indole derivatives as SARS 3CLpro inhibitors. BMC Chem. 2023, 17, 32. [Google Scholar] [CrossRef]
- Rani, P.; Chahal, S.; Priyanka; Kumar, P.; Singh, D.; Sindhu, J. Structural attributes driving λmax towards NIR region: A QSPR approach. Chemom. Intell. Lab. Syst. 2024, 252, 105199. [Google Scholar] [CrossRef]
- Kumar, P.; Kumar, A.; Sindhu, J.; Lal, S. Quasi-SMILES as a basis for the development of QSPR models to predict the CO2 capture capacity of deep eutectic solvents using correlation intensity index and consensus modelling. Fuel 2023, 345, 128237. [Google Scholar] [CrossRef]
- Tajiani, F.; Ahmadi, S.; Lotfi, S.; Kumar, P.; Almasirad, A. In-silico activity prediction and docking studies of some flavonol derivatives as anti-prostate cancer agents based on Monte Carlo optimization. BMC Chem. 2023, 17, 87. [Google Scholar] [CrossRef]
- Goyal, S.; Rani, P.; Chahar, M.; Hussain, K.; Kumar, P.; Sindhu, J. Analysis of good and bad fingerprint for identification of NIR based optical frameworks using Monte Carlo method. Microchem. J. 2024, 196, 109549. [Google Scholar] [CrossRef]
- Vukomanović, P.; Stefanović, M.; Stevanović, J.M.; Petrić, A.; Trenkić, M.; Andrejević, L.; Lazarević, M.; Sokolović, D.; Veselinović, A.M. Monte Carlo optimization method based QSAR modeling of placental barrier permeability. Pharm. Res. 2024, 41, 493–500. [Google Scholar] [CrossRef]
- Bagri, K.; Kapoor, A.; Kumar, P.; Kumar, A. Hybrid descriptors–conjoint indices: A case study on imidazole-thiourea containing glutaminyl cyclase inhibitors for design of novel anti-Alzheimer’s candidates. SAR QSAR Environ. Res. 2023, 34, 361–381. [Google Scholar] [CrossRef]
- Fuadah, Y.N.; Pramudito, M.A.; Firdaus, L.; Vanheusden, F.J.; Lim, K.M. QSAR Classification modeling using machine learning with a consensus-based approach for multivariate chemical hazard end points. ACS Omega 2024, 9, 50796–50808. [Google Scholar] [CrossRef]
- Luechtefeld, T.; Marsh, D.; Rowlands, C.; Hartung, T. Machine learning of toxicological big data enables read-across structure activity relationships (RASAR) outperforming animal test reproducibility. Toxicol. Sci. 2018, 165, 198–212. [Google Scholar] [CrossRef]
- Bernard, A. Chlorination products: Emerging links with allergic diseases. Curr. Med. Chem. 2007, 14, 1771–1782. [Google Scholar] [CrossRef]
- Fan, J.; Song, W.; Wang, Y.; Li, S.; Zhang, C.; Wang, X.; Yang, X. An in-depth review of the dermal toxicity of T-2 toxin: Clinical symptoms, injury mechanisms, and treatment approach. Food Chem. Toxicol. 2024, 193, 114986. [Google Scholar] [CrossRef]
- Larnac, E.; Montoni, A.; Haydont, V.; Marrot, L.; Rochette, P.J. Lipid peroxidation as the mechanism underlying polycyclic aromatic hydrocarbons and sunlight synergistic toxicity in dermal fibroblasts. Int. J. Mol. Sci. 2024, 25, 1905. [Google Scholar] [CrossRef]
- Wu, Z.; Li, J.; Ma, P.; Li, B.; Xu, Y. Long-term dermal exposure to diisononyl phthalate exacerbates atopic dermatitis through oxidative stress in an FITC-induced mouse model. Front. Biol. 2015, 10, 537–545. [Google Scholar] [CrossRef]
- Liang, Y.; Zhang, H.; Cai, Z. New insights into the cellular mechanism of triclosan-induced dermal toxicity from a combined metabolomic and lipidomic approach. Sci. Total Environ. 2021, 757, 143976. [Google Scholar] [CrossRef]

| Split | Set * | Sens | Spec | Acc | MCC | TN | TP | FP | FN | All |
|---|---|---|---|---|---|---|---|---|---|---|
| 1 | A | 0.6526 | 0.6875 | 0.6702 | 0.3404 | 62 | 66 | 30 | 33 | 191 |
| P | 0.6744 | 0.7944 | 0.7409 | 0.4730 | 58 | 85 | 22 | 28 | 193 | |
| C | 0.6630 | 0.8061 | 0.7368 | 0.4749 | 61 | 79 | 19 | 31 | 190 | |
| V | 0.6239 | 0.7407 | 0.6737 | 0.3613 | 68 | 60 | 21 | 41 | 190 | |
| 2 | A | 0.8229 | 0.7604 | 0.7917 | 0.5845 | 79 | 73 | 23 | 17 | 192 |
| P | 0.7755 | 0.7957 | 0.7853 | 0.5710 | 76 | 74 | 19 | 22 | 191 | |
| C | 0.7727 | 0.7864 | 0.7801 | 0.5583 | 68 | 81 | 22 | 20 | 191 | |
| V | 0.7900 | 0.7333 | 0.7632 | 0.5245 | 79 | 66 | 24 | 21 | 190 | |
| 3 | A | 0.7579 | 0.8144 | 0.7865 | 0.5734 | 72 | 79 | 18 | 23 | 192 |
| P | 0.7364 | 0.7317 | 0.7344 | 0.4643 | 81 | 60 | 22 | 29 | 192 | |
| C | 0.7340 | 0.6875 | 0.7105 | 0.4219 | 69 | 66 | 30 | 25 | 190 | |
| V | 0.7711 | 0.8224 | 0.8000 | 0.5935 | 64 | 88 | 19 | 19 | 190 | |
| 4 | A | 0.7708 | 0.8105 | 0.7906 | 0.5817 | 74 | 77 | 18 | 22 | 191 |
| P | 0.6346 | 0.8023 | 0.7105 | 0.4385 | 66 | 69 | 17 | 38 | 190 | |
| C | 0.6907 | 0.6915 | 0.6911 | 0.3822 | 67 | 65 | 29 | 30 | 191 | |
| V | 0.6941 | 0.7103 | 0.7031 | 0.4025 | 59 | 76 | 31 | 26 | 192 | |
| 5 | A | 0.8125 | 0.7660 | 0.7895 | 0.5792 | 78 | 72 | 22 | 18 | 190 |
| P | 0.7157 | 0.8778 | 0.7917 | 0.5970 | 73 | 79 | 11 | 29 | 192 | |
| C | 0.5275 | 0.7374 | 0.6368 | 0.2713 | 48 | 73 | 26 | 43 | 190 | |
| V | 0.6452 | 0.8889 | 0.7708 | 0.5529 | 60 | 88 | 11 | 33 | 192 | |
| 6 | A | 0.8000 | 0.7684 | 0.7842 | 0.5687 | 76 | 73 | 22 | 19 | 190 |
| P | 0.7976 | 0.7593 | 0.7760 | 0.5528 | 67 | 82 | 26 | 17 | 192 | |
| C | 0.7667 | 0.7200 | 0.7421 | 0.4861 | 69 | 72 | 28 | 21 | 190 | |
| V | 0.8053 | 0.6835 | 0.7552 | 0.4919 | 91 | 54 | 25 | 22 | 192 | |
| 7 | A | 0.7604 | 0.7708 | 0.7656 | 0.5313 | 73 | 74 | 22 | 23 | 192 |
| P | 0.8023 | 0.6442 | 0.7158 | 0.4476 | 69 | 67 | 37 | 17 | 190 | |
| C | 0.6374 | 0.4400 | 0.5340 | 0.0788 | 58 | 44 | 56 | 33 | 191 | |
| V | 0.6055 | 0.5854 | 0.5969 | 0.1892 | 66 | 48 | 34 | 43 | 191 | |
| 8 | A | 0.7474 | 0.7732 | 0.7604 | 0.5208 | 71 | 75 | 22 | 24 | 192 |
| P | 0.7473 | 0.7778 | 0.7632 | 0.5253 | 68 | 77 | 22 | 23 | 190 | |
| C | 0.5729 | 0.7684 | 0.6702 | 0.3479 | 55 | 73 | 22 | 41 | 191 | |
| V | 0.6800 | 0.7582 | 0.7173 | 0.4385 | 68 | 69 | 22 | 32 | 191 | |
| 9 | A | 0.7128 | 0.7188 | 0.7158 | 0.4315 | 67 | 69 | 27 | 27 | 190 |
| P | 0.7723 | 0.7419 | 0.7577 | 0.5145 | 78 | 69 | 24 | 23 | 194 | |
| C | 0.5612 | 0.5217 | 0.5421 | 0.0830 | 55 | 48 | 44 | 43 | 190 | |
| V | 0.5281 | 0.6238 | 0.5789 | 0.1524 | 47 | 63 | 38 | 42 | 190 | |
| 10 | A | 0.8105 | 0.8387 | 0.8245 | 0.6493 | 77 | 78 | 15 | 18 | 188 |
| P | 0.8481 | 0.8716 | 0.8617 | 0.7173 | 67 | 95 | 14 | 12 | 188 | |
| C | 0.6800 | 0.7553 | 0.7165 | 0.4359 | 68 | 71 | 23 | 32 | 194 | |
| V | 0.7130 | 0.7558 | 0.7320 | 0.4658 | 77 | 65 | 21 | 31 | 194 |
| Split | Set * | Sens | Spec | Acc | MCC | TN | TP | FP | FN | All |
|---|---|---|---|---|---|---|---|---|---|---|
| 1 | A | 0.6421 | 0.6458 | 0.6440 | 0.2879 | 61 | 62 | 34 | 34 | 191 |
| P | 0.6279 | 0.6542 | 0.6425 | 0.2809 | 54 | 70 | 37 | 32 | 193 | |
| C | 0.9239 | 0.8776 | 0.9000 | 0.8012 | 85 | 86 | 12 | 7 | 190 | |
| V | 0.8349 | 0.8765 | 0.8526 | 0.7050 | 91 | 71 | 10 | 18 | 190 | |
| 2 | A | 0.6875 | 0.6875 | 0.6875 | 0.3750 | 66 | 66 | 30 | 30 | 192 |
| P | 0.7245 | 0.7634 | 0.7435 | 0.4879 | 71 | 71 | 22 | 27 | 191 | |
| C | 0.9205 | 0.8738 | 0.8953 | 0.7919 | 81 | 90 | 13 | 7 | 191 | |
| V | 0.9000 | 0.8000 | 0.8526 | 0.7057 | 90 | 72 | 18 | 10 | 190 | |
| 3 | A | 0.6211 | 0.7320 | 0.6771 | 0.3553 | 59 | 71 | 26 | 36 | 192 |
| P | 0.6273 | 0.7073 | 0.6615 | 0.3312 | 69 | 58 | 24 | 41 | 192 | |
| C | 0.9149 | 0.8646 | 0.8895 | 0.7801 | 86 | 83 | 13 | 8 | 190 | |
| V | 0.9277 | 0.8411 | 0.8789 | 0.7627 | 77 | 90 | 17 | 6 | 190 | |
| 4 | A | 0.6771 | 0.7263 | 0.7016 | 0.4038 | 65 | 69 | 26 | 31 | 191 |
| P | 0.5769 | 0.7907 | 0.6737 | 0.3720 | 60 | 68 | 18 | 44 | 190 | |
| C | 0.9072 | 0.8511 | 0.8796 | 0.7599 | 88 | 80 | 14 | 9 | 191 | |
| V | 0.8706 | 0.9065 | 0.8906 | 0.7781 | 74 | 97 | 10 | 11 | 192 | |
| 5 | A | 0.7292 | 0.7447 | 0.7368 | 0.4738 | 70 | 70 | 24 | 26 | 190 |
| P | 0.6569 | 0.7778 | 0.7135 | 0.4357 | 67 | 70 | 20 | 35 | 192 | |
| C | 0.7692 | 0.7677 | 0.7684 | 0.5366 | 70 | 76 | 23 | 21 | 190 | |
| V | 0.8495 | 0.8889 | 0.8698 | 0.7394 | 79 | 88 | 11 | 14 | 192 | |
| 6 | A | 0.7053 | 0.7368 | 0.7211 | 0.4423 | 67 | 70 | 25 | 28 | 190 |
| P | 0.6905 | 0.7222 | 0.7083 | 0.4109 | 58 | 78 | 30 | 26 | 192 | |
| C | 0.8889 | 0.8900 | 0.8895 | 0.7785 | 80 | 89 | 11 | 10 | 190 | |
| V | 0.9115 | 0.8734 | 0.8958 | 0.7849 | 103 | 69 | 10 | 10 | 192 | |
| 7 | A | 0.6354 | 0.6354 | 0.6354 | 0.2708 | 61 | 61 | 35 | 35 | 192 |
| P | 0.6395 | 0.6731 | 0.6579 | 0.3118 | 55 | 70 | 34 | 31 | 190 | |
| C | 0.9011 | 0.8900 | 0.8953 | 0.7905 | 82 | 89 | 11 | 9 | 191 | |
| V | 0.8624 | 0.9024 | 0.8796 | 0.7589 | 94 | 74 | 8 | 15 | 191 | |
| 8 | A | 0.6000 | 0.7320 | 0.6667 | 0.3350 | 57 | 71 | 26 | 38 | 192 |
| P | 0.7473 | 0.7071 | 0.7263 | 0.4540 | 68 | 70 | 29 | 23 | 190 | |
| C | 0.9063 | 0.8842 | 0.8953 | 0.7907 | 87 | 84 | 11 | 9 | 191 | |
| V | 0.9500 | 0.8791 | 0.9162 | 0.8333 | 95 | 80 | 11 | 5 | 191 | |
| 9 | A | 0.7021 | 0.6771 | 0.6895 | 0.3793 | 66 | 65 | 31 | 28 | 190 |
| P | 0.7426 | 0.6882 | 0.7165 | 0.4315 | 75 | 64 | 29 | 26 | 194 | |
| C | 0.9388 | 0.7935 | 0.8684 | 0.7425 | 92 | 73 | 19 | 6 | 190 | |
| V | 0.8427 | 0.8614 | 0.8526 | 0.7041 | 75 | 87 | 14 | 14 | 190 | |
| 10 | A | 0.6632 | 0.7097 | 0.6862 | 0.3732 | 63 | 66 | 27 | 32 | 188 |
| P | 0.7468 | 0.6789 | 0.7074 | 0.4203 | 59 | 74 | 35 | 20 | 188 | |
| C | 0.8600 | 0.7979 | 0.8299 | 0.6598 | 86 | 75 | 19 | 14 | 194 | |
| V | 0.8796 | 0.8953 | 0.8866 | 0.7720 | 95 | 77 | 9 | 13 | 194 |
| SMILES Attribute | CWs Probe 1 | CWs Probe 2 | CWs Probe 3 | CWs Probe 4 | CWs Probe 5 | NA * | NP | NC | dk (Equation (16)) |
|---|---|---|---|---|---|---|---|---|---|
| C...C...(... | 0.4282 | 1.1484 | 0.6594 | 0.7111 | 0.8434 | 89 | 88 | 95 | 0.0003 |
| c...1...c... | 0.3818 | 1.6982 | 0.0302 | 0.3192 | 1.1050 | 87 | 81 | 89 | 0.0004 |
| C...(...=... | 0.3031 | 0.2886 | 0.9226 | 0.1488 | 0.1215 | 74 | 78 | 74 | 0.0001 |
| 1...c...(... | 0.6079 | 0.2321 | 0.0176 | 0.1939 | 0.4596 | 50 | 55 | 45 | 0.0006 |
| Cl.......... | 0.4025 | 1.4493 | 1.2160 | 0.3778 | 0.4965 | 44 | 34 | 44 | 0.0009 |
| O...C...C... | 0.8311 | 0.1321 | 0.3925 | 0.5969 | 0.5581 | 43 | 37 | 63 | 0.0020 |
| c...(...O... | 0.8902 | 0.7246 | 0.9960 | 1.0199 | 0.6417 | 43 | 36 | 35 | 0.0007 |
| N...C....... | 1.6906 | 2.3710 | 1.4314 | 1.4542 | 0.9820 | 41 | 62 | 47 | 0.0014 |
| (...Cl..(... | 0.5734 | 0.1407 | 1.4143 | 0.4497 | 0.2051 | 35 | 25 | 36 | 0.0012 |
| C...(...(... | 0.6726 | 1.1731 | 1.2948 | 0.8587 | 1.4233 | 33 | 28 | 22 | 0.0014 |
| N...(...C... | 1.5790 | 0.6892 | 0.4159 | 1.6733 | 1.1905 | 31 | 35 | 27 | 0.0008 |
| c...O....... | 0.9687 | 0.8699 | 0.9720 | 1.4256 | 1.0048 | 27 | 20 | 34 | 0.0019 |
| =...C...(... | 0.9270 | 0.6279 | 0.6237 | 0.7499 | 1.2820 | 21 | 39 | 23 | 0.0022 |
| C...#....... | 0.9110 | 0.7571 | 0.8295 | 0.8373 | 0.6587 | 19 | 15 | 13 | 0.0013 |
| C...C...=... | 1.7071 | 1.8631 | 0.7322 | 0.8255 | 1.1005 | 19 | 24 | 16 | 0.0014 |
| C........... | −0.2116 | −0.5459 | −0.4764 | −0.4084 | −0.1354 | 183 | 186 | 184 | 0.0000 |
| (........... | −0.1254 | −0.7692 | −0.3606 | −0.2885 | −0.3416 | 164 | 165 | 173 | 0.0002 |
| =........... | −0.6579 | −0.1147 | −0.3085 | −0.2914 | −0.2637 | 111 | 129 | 139 | 0.0008 |
| N...(....... | −0.9757 | −0.4264 | −0.3162 | −0.6883 | −0.5884 | 51 | 57 | 52 | 0.0004 |
| Cl..(....... | −0.3343 | −0.2207 | −0.8490 | −0.5057 | −0.1271 | 36 | 30 | 41 | 0.0011 |
| S........... | −0.8896 | −0.6718 | −1.0932 | −1.1870 | −0.0093 | 28 | 32 | 52 | 0.0023 |
| (...c...(... | −0.7161 | −0.3445 | −0.7610 | −0.8026 | −0.9100 | 18 | 17 | 25 | 0.0014 |
| N...C...(... | −1.4065 | −1.3928 | −0.4576 | −0.8499 | −0.6631 | 18 | 25 | 17 | 0.0013 |
| n........... | −0.5006 | −0.4051 | −0.5518 | −0.2254 | −0.2566 | 18 | 21 | 18 | 0.0005 |
| N...#....... | −1.6835 | −1.7643 | −1.1689 | −1.7475 | −1.4276 | 15 | 12 | 10 | 0.0014 |
| n...c....... | −0.9213 | −0.1947 | −0.6151 | −1.1517 | −0.2367 | 15 | 16 | 15 | 0.0002 |
| c...1...(... | −1.0012 | −2.0611 | −2.2902 | −1.1616 | −1.6373 | 13 | 21 | 14 | 0.0017 |
| =...(...(... | −0.2949 | −0.2031 | −0.5799 | −0.8272 | −0.2128 | 10 | 17 | 23 | 0.0027 |
| S...=....... | −1.0649 | −0.1770 | −0.5255 | −1.5191 | −2.6799 | 10 | 11 | 26 | 0.0036 |
| n...1....... | −1.2993 | −0.6785 | −0.5283 | −0.8285 | −0.8261 | 9 | 14 | 9 | 0.0016 |
Disclaimer/Publisher’s Note: The statements, opinions and data contained in all publications are solely those of the individual author(s) and contributor(s) and not of MDPI and/or the editor(s). MDPI and/or the editor(s) disclaim responsibility for any injury to people or property resulting from any ideas, methods, instructions or products referred to in the content. |
© 2025 by the authors. Licensee MDPI, Basel, Switzerland. This article is an open access article distributed under the terms and conditions of the Creative Commons Attribution (CC BY) license (https://creativecommons.org/licenses/by/4.0/).
Share and Cite
Toropov, A.A.; Toropova, A.P.; Roncaglioni, A.; Benfenati, E. Semi-Correlations for the Simulation of Dermal Toxicity. Toxics 2025, 13, 235. https://doi.org/10.3390/toxics13040235
Toropov AA, Toropova AP, Roncaglioni A, Benfenati E. Semi-Correlations for the Simulation of Dermal Toxicity. Toxics. 2025; 13(4):235. https://doi.org/10.3390/toxics13040235
Chicago/Turabian StyleToropov, Andrey A., Alla P. Toropova, Alessandra Roncaglioni, and Emilio Benfenati. 2025. "Semi-Correlations for the Simulation of Dermal Toxicity" Toxics 13, no. 4: 235. https://doi.org/10.3390/toxics13040235
APA StyleToropov, A. A., Toropova, A. P., Roncaglioni, A., & Benfenati, E. (2025). Semi-Correlations for the Simulation of Dermal Toxicity. Toxics, 13(4), 235. https://doi.org/10.3390/toxics13040235