Abstract
In recent years, combined pollution of PM2.5 and O3 has emerged as a major constraint on improvement of air quality in urban China. This study investigates Binzhou, an industrial–agricultural city within the Beijing–Tianjin–Hebei air pollution transport corridor. Based on air quality monitoring and socioeconomic data from 2019 to 2024, we analyze the temporal variations, driving mechanisms, and economic effects of PM2.5-O3 compound pollution. Results show that the annual mean PM2.5 concentrations decreased initially and then increased, while O3 levels exhibited a fluctuating increase. Seasonal patterns were distinct: PM2.5 pollution was more severe in autumn and winter, and O3 dominated in spring and summer. The number of compound pollution days decreased from 24 in 2019 to 12 in 2024, with a notable concentration in spring (March–May), accounting for 40–54% of the annual total, highlighting this period as critical for coordinated control. Correlation analysis revealed a weak positive association between PM2.5 and O3 in spring, summer, and autumn (strongest in summer) but a weak negative correlation in winter. Economic development demonstrated a phased decoupling from pollution: Binzhou’s GDP grew by 38.6% cumulatively during the study period, while compound pollution days declined, with significant decoupling in 2020 and 2022. However, pollution rebounded with economic recovery. Key drivers identified include coal combustion and industrial emissions, while industrial restructuring and regional joint prevention policies have contributed to pollution mitigation. This study provides scientific support for formulating differentiated air quality strategies tailored to seasonal and regional characteristics, thereby supporting both clean air and high-quality development.
1. Introduction
Under the dual pressures of global climate change and rapid urbanization, synergistic atmospheric pollution, particularly from fine particulate matter (PM2.5) and ozone (O3), has become as a critical barrier to improving urban environmental quality and public health [1,2]. This challenge is especially acute in heavily polluted regions such as Beijing–Tianjin–Hebei (BTH) and its surroundings, where combined PM2.5 and O3 pollution poses severe threats to ecological stability and public health [3]. Although the regional collaborative “2 + 26” cities initiative launched in 2017 has significantly reduced PM2.5 concentrations through industrial restructuring, emission controls, and joint policies [4,5], substantial spatial and temporal heterogeneity in pollution distribution remains. Certain cities in southern Hebei, Henan, and Shandong provinces—including Binzhou, Dezhou, and Liaocheng—continue to exhibit high PM2.5 levels [3]. As a major industrial base in Shandong and a key node in the BTH air pollution transmission corridor, Binzhou significantly influences both local air quality and regional pollutant transport. Therefore, it represents a critical case for investigating composite pollution dynamics.
Existing research shows that the interaction between PM2.5 and O3 is influenced by seasonal variations, meteorological conditions, and regional transport. For instance, their correlation typically shifts from negative in spring to positive in summer, primarily due to intensified photochemical activity. In winter, this relationship is further influenced by stagnant atmospheric conditions [6]. Regional studies—such as those in the Yangtze River Delta, Fen-Wei Plain, and Jiangxi Province—also reveal significant spatial variations in pollution patterns, governed by meteorological and complex physicochemical processes [7,8,9]. These geographical differences highlight the necessity of region-specific studies. Binzhou exemplifies such regional uniqueness: influenced by heavy industry, geographic location, and agricultural activities, it exhibits a summer pattern dominated by O3 (exceedance rate 63.3%) with a distinct inland-increasing spatial gradient, shifting to PM2.5-dominated pollution in autumn and winter (exceedance rate ~20%) [10]. This contrasts with other regions, such as the dual spring peaks in Baoding [11] and winter-topography-related amplified PM2.5 in the Fen-Wei Plain [12].
However, significant gaps persist in understanding the driving mechanisms and systemic characteristics of PM2.5-O3 pollution in multi-source cities like Binzhou. Previous studies have predominantly examined megacities and large urban agglomerations. Consequently, the complex interplay of industrial, transportation, agricultural, and meteorological factors in medium-sized urban nodes within air pollution corridors. Quantitative studies in other locales—such as Baoding, where humidity and CO dominate PM2.5 and temperature/radiation control O3—highlight the region-specificity of key drivers. The role of mobile-source NO2 in secondary aerosol formation and ozone competitive chemistry further underscores the need for localized mechanistic analysis [13]. Studies at a smaller urban scale, such as in Yishui County [14], confirm that pollution compositions and drivers can differ markedly from those in larger cities. This evidence reinforces the necessity of tailored studies in underrepresented yet strategically important areas such as Binzhou [15].
Therefore, this study utilizes high-resolution monitoring and socioeconomic data from 2019–2024 to systematically investigate the spatio-temporal evolution, interaction relationships, and multi-dimensional driving mechanisms of PM2.5-O3 pollution in Binzhou. Using integrated quantitative and qualitative approaches, we evaluate the contributions from local industry, transportation, agricultural emissions, meteorological conditions, and regional transport. A preliminary assessment of environmental and health impacts is also provided. The findings aim to support the design of precise, differentiated control strategies such as optimizing seasonal emission reductions and cross-regional coordination for Binzhou and similar cities. The ultimate goal is to facilitate the synergistic reduction in both pollutants and strengthening regional green development in the Yellow River Basin context.
2. Materials and Methods
2.1. Data Sources and Processing
The pollutant data used in this study were obtained from the national public environmental data platform (https://www.aqistudy.cn/historydata/monthdata.php (accessed on 10 January 2025)). Daily concentrations of major air pollutants from January 2019 to December 2024 were collected, encompassing a total of 72 observation points (12 months each year). Data quality and measurement procedures comply with the Technical Specification for Ambient Air Quality Index (Trial) (HJ 633-2012) [16]. Seasons were defined according to the Ambient Air Quality Standards (GB 3095-2012) [17]: spring (March–May), summer (June–August), autumn (September–November), and winter (December–February). Socio-economic and emission-related data, including economic indicators and pollutant discharge statistics, were sourced from the Shandong Statistical Yearbook and the Binzhou Statistical Yearbook.
2.2. Definition of Compound Pollution
Building on existing research and in accordance with both the Ambient Air Quality Standards (GB 3095-2012) and the WHO Global Air Quality Guidelines (2021), this study defines PM2.5-O3 compound pollution events. Considering the characteristically low O3 concentrations during cold seasons, a day is defined as exhibiting PM2.5-O3 compound pollution if the daily average PM2.5 concentration exceeds 75 μg/m3 and the maximum daily 8-h average ozone concentration (O3-8 h) exceeds 100 μg/m3. Regionally, a compound pollution event is declared when three or more cities within a defined seven-city cluster simultaneously meet the compound pollution criteria on the same day.
2.3. Gray Relational Analysis
The GRA method was conducted following the foundational principles of gray system theory originally established by Deng (1982) [18], was employed to assess multi-factor relationships within partially uncertain systems-often denoted as “gray systems”. This method evaluates the degree of similarity between a reference sequence (e.g., a target environmental quality indicator) and comparative sequences (e.g., socio-economic or emission factors) based on the geometric proximity of their data curves. Greater similarity indicates a stronger influence of the factor on the target variable.
The key steps of GRA are described in the following sections.
2.3.1. Data Normalization
Let the reference sequence be and the comparative sequences be , where . To eliminate dimensional differences, each sequence is normalized using the following formula:
2.3.2. Calculation of Gray Relational Coefficient
The gray relational coefficient between and at the -th point is calculated as:
where is the discrimination coefficient, set as 0.5 in this study to balance the influence of extreme values.
2.3.3. Calculation of Gray Relational Grade
The overall gray relational grade between and is obtained by averaging the relational coefficients:
In this study, GRA was applied to quantify the correlations between socio-economic and pollutant emission factors and three categories of environmental quality indicators: ambient air quality, surface water quality, and acoustic environment quality. The input variables for GRA included the following: (1) Reference sequences: concentrations of PM2.5, O3-8 h, NO2, and SO2. (2) Comparative sequences: regional GDP (Y1), industrial electricity consumption (Y2), population density (Y3), industrial energy consumption (Y4), agricultural output value (Y5), motor vehicle ownership (Y6), annual precipitation (Y7), and construction area of buildings (Y8). The analysis aims to identify key driving factors and their relative impacts, providing a systematic basis for prioritizing policy interventions.
3. Results and Discussion
3.1. The Overall Trend of Air Quality Changes in Binzhou City over the Past Six Years
3.1.1. Overall Pollution Changes
From 2019 to 2024, air pollution in Binzhou showed a fluctuating trend (Figure 1). A marked decline in NO2 concentrations occurred between 2020 and 2021, coinciding with the widespread restrictions on traffic flow and industrial production imposed during the COVID-19 pandemic [19]. These measures directly reduced emissions from key NO2 sources like motor vehicles and industrial processes. This finding consistent with studies by Le et al. (2020) [20], who reported similar emission reductions during pandemic lockdowns in other Chinese cities. However, in contrast to the decrease in NO2, O3 concentrations increased during this period, a phenomenon attributed to enhanced solar radiation and elevated atmospheric oxidizability [21]. This observation supports Kou et al.’s (2023) [21] conclusion that reduced primary pollutant (e.g., NO) can weaken the ozone “titration effect” (NO + O3 → NO2 + O2), thereby promoting O3 accumulation even under emission control measures.
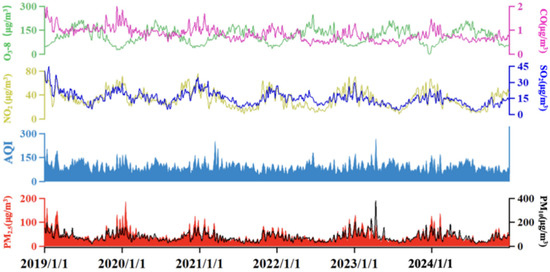
Figure 1.
Long-term temporal variations in key air pollutants in Binzhou city from 2019 to 2024.
During the pandemic, restrictions on industry and transport significantly reduced PM2.5 emissions, resulting in lower concentrations. However, after economic activities resumed in late 2022, NO2 and O3 concentrations rebounded due to increased anthropogenic emissions-particularly of O3 precursors (NOX and VOCs). PM2.5 concentrations also rose sharply in 2023 but fell in 2024 following targeted pollution control policies such as the “Blue Sky Project.” This trend highlights the effectiveness of policy interventions in mitigating pollution and aligns with Zheng et al. (2018) [22], who highlighted the critical role of clean air actions in preventing post-pandemic pollutant rebound.
To further contextualize the improvements in air quality, Table 1 reveals a gradual increase in the proportion of “Good” air quality days from 2019 to 2022, alongside a decrease in “Unhealthy for Sensitive Groups” “Very Unhealthy” and “Hazardous” days. This trend aligns with Giani et al.’s (2023) [23], who reported short-term air quality benefits from pandemic-related emission reductions. From 2022 to 2024, the proportion of “Good” days fluctuated but stabilized overall. However, “Unhealthy” days temporarily rebounded in 2023, likely because of resumed industrial production. Notably, the lack of a significant deterioration in 2024 highlights the success of Binzhou’s long-term environmental governance measures, including regional joint prevention and control [21].

Table 1.
The number of days with air quality grades and their Proportions in Binzhou city from 2019 to 2024.
Table 1 quantifies these trends by detailing air quality grades over the six-year period. The data show that “Moderate” and “Unhealthy for Sensitive Groups” days accounted for 51% and 26% of the total, respectively. Meanwhile, heavily polluted days (Unhealthy and above) from 16% in 2019 to 7% in 2024. The number of “Good” days increased by 59% (from 34 to 54 days), a trend that outpaces the national average for industrial cities in the Beijing–Tianjin–Hebei (BTH) corridor [3]. A notable exception occurred in 2023, when “Good” days decreased to 45 (12%), a decline likely caused by increased road dust from post-pandemic transportation recovery. This finding reveals the vulnerability of air quality to rapid economic recovery and underscores the need for sustained control measures, consistent with Li et al.’s (2021) [24] research on the decoupling of economic growth and pollution.
The monthly Air Quality Index (AQI) variation further reveals seasonal air quality patterns (Figure 1). While the overall trend remained stable, AQI values were consistently lower in summer, benefiting from favorable diffusion conditions and precipitation [25]. Conversely, winter exhibited higher AQI levels due to increased coal combustion for heating and stable atmospheric conditions [26]. This seasonal pattern is consistent with observations in other northern Chinese cities, such as Baoding and Urumqi [12,25], but Binzhou’s unique position in the BTH transmission corridor led to more pronounced AQI spikes during regional pollution episodes (e.g., March 2021, AQI = 141). Targeted control measures-including dust control, industrial emission reductions, and mobile source management-contributed to a significant air quality improvement. For instance, PM2.5 concentrations reached 39 μg/m3 and the “Excellent” air quality rate attained 53.1% in the first eight months of 2023. By 2024, daily pollutant emissions had decreased by over 10% compared to previous years, with a 30% reduction during autumn and winter-a result that demonstrates the efficacy of Binzhou’s differentiated control strategies.
3.1.2. Characteristics of the Pollution Season
Compound pollution events in Binzhou showed strong seasonal clustering, with nearly all occurrences concentrated in spring, autumn, and winter, and almost none in summer (Table 2). Spring was the most critical season, accounting for 40–54% of annual compound pollution days-for example, 54% in 2019 and 50% in 2021. This proportion is higher than that observed in other Beijing–Tianjin–Hebei (BTH) corridor cities, such as Baoding, where spring exhibits dual PM2.5 and O3 peaks [12], or the Fen–Wei Plain, where PM2.5 dominates in winter [9]. Figure 2 illustrates these seasonal pollutant variations, and this distinct pattern highlights the need for region-specific springtime control measures in Binzhou.
Table 2.
Average values of major pollutants in Binzhou city from 2019 to 2024 in different seasons.
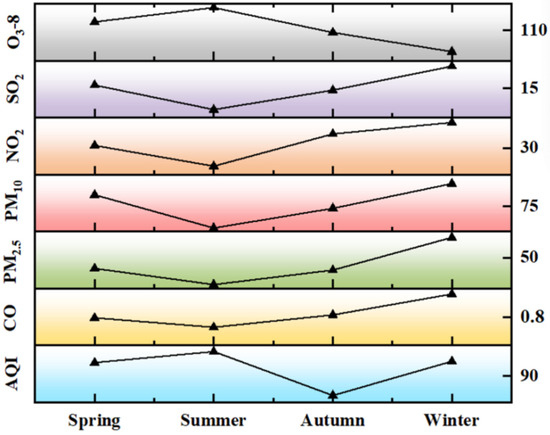
Figure 2.
Seasonal variations in different pollutants in Binzhou city from 2019 to 2024.
Autumn compound pollution remained relatively stable (4–7 days/year), while winter days showed a downward trend, stabilizing at 1–4 days after 2020. The primary pollutant also shifted with the seasons: O3 dominated in summer (average 159.60 μg/m3, far exceeding the national secondary standard of 100 μg/m3), while PM2.5 was the primary pollutant in autumn and winter. Intense solar radiation and high temperatures in summer promoted photochemical reactions, driving O3 formation. This mechanism is consistent with Qin et al.’s (2025), who reported that heatwaves enhance O3 formation through temperature-induced VOC emissions [27]. In contrast, PM2.5 and PM10 concentrations reached their annual minima during summer (27.20 μg/m3 and 49.22 μg/m3, respectively), due to wet deposition and favorable diffusion [28].
Winter PM2.5 concentrations (66.98 μg/m3) were 2.46 times higher than in summer, exceeding the national standard by 91%-a result attributed to coal-fired heating and stable atmospheric conditions, mechanism also extensively documented in the severe haze episodes over central and eastern China [29]. Winter also recorded the highest concentrations of SO2 (20.37 μg/m3) and CO (1.04 mg/m3), reinforcing the significant role of fossil fuel combustion. These results are consistent with Wang et al.’s (2014) analysis of winter haze in central and eastern China [29]. However, Binzhou exhibited higher PM2.5 levels than those reported in the earlier study, a difference likely attributable to its stronger industrial and agricultural emissions.
Autumn functioned as a transitional period, with PM2.5 and NO2 concentrations rising and O3 declining. The average PM2.5 concentration (39.46 μg/m3) was slightly lower than in spring. In contrast, NO2 levels (38.07 μg/m3) were the second highest annually, a pattern likely resulting from increased industrial and transportation emissions coupled with poorer atmospheric dispersion. Meanwhile, O3 concentrations (104.60 μg/m3) remained above the standard, indicating ongoing photochemical activity despite cooler temperatures.
Spring in Binzhou exhibited a “double high” pattern of PM10 and O3 pollution. PM10 concentrations averaged 88.51 μg/m3, a level surpassed only by winter levels, which reflects the influence of frequent dust events. Concurrently, O3 concentrations rose to 128.07 μg/m3, driven by intensified solar radiation [30]. PM2.5 levels (40.84 μg/m3) were comparable to autumn, likely due to the secondary pollution of dust and local pollutants [31]. This synergistic PM-O3 pollution represents a distinctive feature of Binzhou’s spring, setting it apart from other regions in the BTH corridor.
The seasonal variations in major pollutants followed distinct patterns. PM2.5 concentrations were highest in winter (66.98 μg/m3), followed by spring (40.84 μg/m3) and autumn (39.46 μg/m3), and lowest in summer (27.20 μg/m3). In contrast, O3 showed an opposite trend, peaking in summer (159.60 μg/m3) and reaching its lowest level in winter (62.19 μg/m3). NOX concentrations were highest in winter (44.69 μg/m3) and lowest in summer (19.46 μg/m3). Both SO2 and CO exhibited pronounced winter peaks (20.37 μg/m3 and 1.04 mg/m3, respectively), reflecting the substantial impact of coal combustion for heating. PM10 levels were highest in winter (101.79 μg/m3), with elevated spring concentrations (88.51 μg/m3) due to frequent dust events.
The driving mechanisms of O3 pollution are strongly influenced by precursor emissions (NOx and VOCs) and meteorological conditions, particularly in spring and summer. Key chemical reactions governing O3 formation include the photolysis of NO2, which is the primary initiator:
NO2 + hν(λ < 420 nm) → NO + O(3P)
O(3P) + O2→O3
NO + O3 → NO2 + O2
However, the resulting O3 can be rapidly titrated by NO, forming a null cycle: NO + O3 → NO2 + O2 accumulation occurs only in the presence of volatile organic compounds (VOCs). The hydroxyl radical (OH) initiates VOC oxidation pathways that convert NO to NO2 without consuming O3:
VOC + OH → RO2
RO2·+ NO → RO·+ NO2
This reaction sequence is critical as it regenerates NO2, allowing for further O3 production upon its photolysis, thereby leading to net O3 accumulation [30]. High temperatures and intense solar radiation in spring and summer act as powerful catalysts for these processes. Elevated temperatures not only accelerate the kinetics of photochemical reactions but also promote the biogenic emissions of highly reactive VOCs, such as isoprene, from vegetation. Furthermore, recent evidence suggests that high temperatures can directly enhance emissions of anthropogenic VOCs, further fueling ozone production, particularly during heatwave events [27] Concurrently, strong solar radiation provides the essential photon flux for NO2 photolysis and enhances OH radical concentrations, thereby intensifying the overall oxidative capacity of the atmosphere and facilitating rapid O3 production [21].
The sensitivity of O3 formation to its precursors exhibits a strong seasonal and regional pattern. During summer, the high baseline levels of NOx in some urban areas often push the photochemical regime from NOx-sensitive to VOC-sensitive [32]. In a VOC-sensitive regime, reducing NOx emissions may be ineffective or even lead to a paradoxical increase in O3 (a phenomenon known as the “NOx disbenefit effect”), whereas controlling VOC emissions becomes the more effective strategy [33]. This underscores the critical need for targeted VOC control in Binzhou, especially during the high-O3 season, to mitigate the escalating ozone pollution.
Overall, most pollutant concentrations peaked in winter and reached their lowest levels in summer. In contrast, ozone (O3-8 h) showed an inverse pattern, with its highest concentration in summer, followed by spring, and lower levels in autumn and winter. Consistently, the Air Quality Index (AQI) was highest during winter and lowest in summer. Summer’s intense solar radiation and high temperatures strongly favor ozone formation [27], a process also promoted by the enhanced sunlight characteristic of spring. In autumn and winter, weakened solar radiation weakens, and temperatures suppress photochemical activity, reducing ozone formation [34]. In contrast, SO2, NO2, PM10, PM2.5, and CO all peak in winter, followed by autumn, with lower concentrations in spring and summer. This pattern results from increased coal combustion for heating and higher energy demand in winter, coupled with stable atmospheric conditions and frequent temperature inversions that trap pollutants [29]. Autumn exhibits a transitional pattern, with rising emissions from early heating and industrial activity. Conversely, spring and summer benefit from greater precipitation—which removes pollutants through wet deposition—and more favorable conditions for atmospheric dispersion [28]. The Air Quality Index (AQI) mirrors these trends, with the lowest values in summer and the highest in winter. Summer’s generally better air quality stems from lower primary pollutant levels and effective removal by rain and atmospheric mixing. However, high temperatures and strong radiation during this season promote ozone formation via photochemistry [35].
Binzhou’s warm temperate monsoonal climate further modulates these patterns. Spring brings strong, dry winds that aid pollutant dispersion, though increased sunlight also favors ozone production. In autumn and winter, heating and other energy-intensive activities elevate emissions, while cold, dry, and stable atmospheric conditions inhibit dispersion, resulting in higher AQI values.
3.1.3. The Changing Trends of NO2 and SO2
As key indicators of industrial and mobile source emissions, NO2 and SO2 play critical roles in forming secondary PM2.5 and O3. Understanding their temporal trends is essential for understanding pollution dynamics. Figure 3 shows a significant decline in SO2 concentrations from 19.37 μg/m3 (2019) to 11.19 μg/m3 (2024), a 42.2% reduction-with the largest drop (21%) occurring in 2023. This decline is attributed to Binzhou’s “coal-to-gas/electricity” projects and the elimination of small coal-fired boilers, which align with national efforts to reduce coal combustion emissions [22]. In contrast, NO2 concentrations decreased by 28.3%, from 40.29 μg/m3 to 28.89 μg/m3, albeit with some fluctuations, and reached a new low in 2024. This decrease is linked to the installation of SCR/SNCR denitrification systems in local industries, a measure also observed in other industrial cities [22].
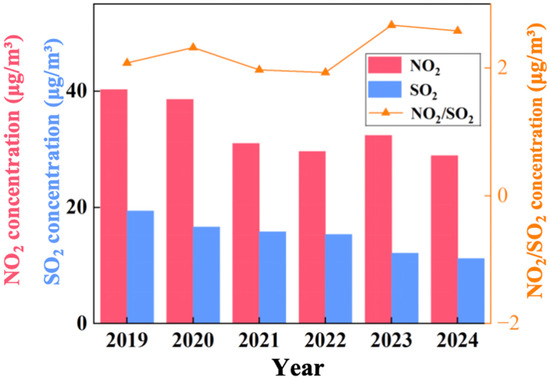
Figure 3.
Temporal variations of NO2, SO2 concentrations and NO2/SO2 ratio in Binzhou city from 2019 to 2024.
The NO2/SO2 ratio increased from 2.08 (2019) to 2.58 (2024), indicating a shift in dominant pollution sources. This trend reflects the growing contribution of mobile sources (which primarily emit NO2), relative to industrial coal combustion (a major SO2 source). The rising importance of mobile emissions is consistent with the growth in motor vehicle ownership in Binzhou, particularly diesel trucks, as also documented in broader studies of on-road emissions in China [13]. During the pandemic (2020–2021), NO2 levels dropped sharply due to traffic restrictions but rebounded after 2022 as economic activity recovered. In contrast, SO2 concentrations increased at a slower rate during the recovery phase, reflecting the sustained impact of clean energy policies. This divergence underscores the need for more targeted control measures focused on mobile sources to effectively reduce NO2 pollution.
3.2. The Current Situation of Combined Pollution of PM2.5 and O3
3.2.1. PM2.5 Concentration Characteristics
PM2.5, a primary pollutant in winter and key component of compound pollution, shows clear temporal variations that are critical for understanding air quality trends in Binzhou. Figure 1 also displays the monthly variation in PM2.5 concentrations, with distinct seasonal patterns: higher concentrations in winter (e.g., January 2020, 105.52 μg/m3) and lower concentrations in summer. The winter maximum results from coal-fired heating and stable meteorological conditions [29], while the summer minimum is due to wet deposition [28]. Box plot analysis (Figure 4) further indicates a gradual decline in both median and mean PM2.5 concentrations from 2019 to 2024. The distribution of data also became more concentrated over this period, reflecting improved stability in air quality. This downward trend aligns with national PM2.5 reduction targets [5] but exceeds the average reduction observed in other BTH corridor cities [3], reflecting Binzhou’s effective industrial restructuring and emission controls policies.
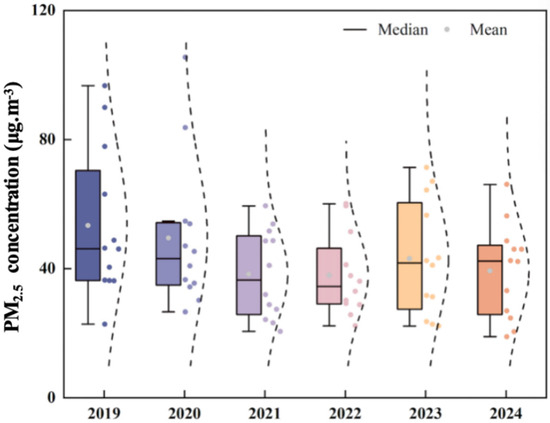
Figure 4.
Box plot of PM2.5 concentration variation in Binzhou city from 2019 to 2024.
PM2.5 concentrations in 2021 were lower than in 2019–2020, reflecting the continued influence of pandemic-related emission reductions and the shutdown of highly polluting industries. However, a temporary rebound occurred in 2023, which coincided with increased industrial activity and a 4.2% rise in coal consumption reported in Shandong’s energy statistics. This rebound highlights the persistent challenge of maintaining pollution control during economic recovery-a finding that supports Li et al.’s (2021) [24] research on the decoupling of GDP and pollution.
3.2.2. O3 Reacts with Photochemical Reactions
O3 serves as the primary pollutant in summer and a major component of spring compound pollution. Its dynamics are strongly influenced by photochemical processes and precursor emissions. Monthly O3 concentrations followed a clear pattern (Figure 5), characterized by high pre-pandemic levels, a decline during the pandemic, and a rebound thereafter. Summer peaks-such as 196.6 μg/m3 in June 2019 and 185.43 μg/m3 in June 2022 were driven by intense photochemical reactions [27]. In contrast, winter minima (e.g., January 2020, 36.77 μg/m3) result from weak solar radiation. The pandemic period (2020–2021) saw a temporary O3 decline due to reduced precursor emissions, a phenomenon observed across China during the lockdown period [36]. but concentrations rebounded post-2022 with the recovery of industrial and transportation activities. By 2024, O3 concentrations remained at a high level, due to abundant precursors (NOX and VOCs) and favorable meteorological conditions-consistent with Qin et al.’s (2025) [27] prediction of increased urban O3 in heatwaves.
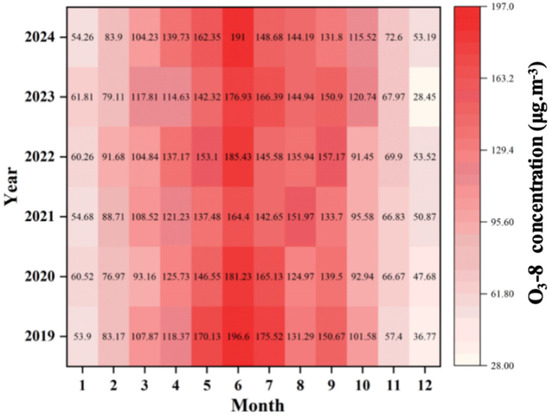
Figure 5.
Monthly variation of O3 concentration in Binzhou city from 2019 to 2024.
The box plot (Figure 6) shows a gradual increase in median and mean O3 concentrations from 2019 to 2024. Data dispersion also increased during this period, reflecting greater variability influenced by the interplay of anthropogenic emissions and meteorological conditions. This trend is a cause for concern, as long-term exposure to high O3 concentrations increases the risk of respiratory and cardiovascular diseases [37], and the substantial health impacts of persistent air pollution in China are well-recognized [38]. Moreover, Binzhou experiences more severe O3 pollution than other BTH corridor cities [3], underscoring the urgency of implementing targeted VOC and NOX control measures.
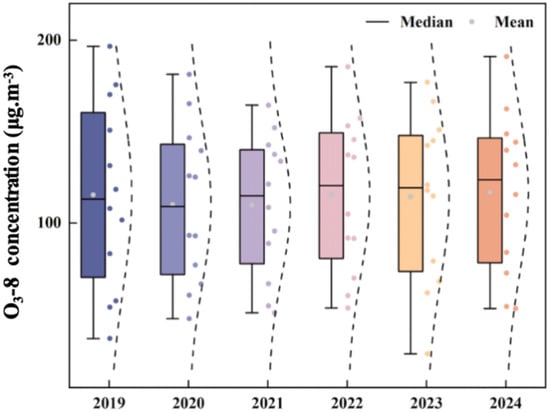
Figure 6.
Box plot of O3-8 concentration variation in Binzhou city from 2019 to 2024.
3.2.3. Combined Pollutions of PM2.5 and O3
The co-occurrence of PM2.5 and O3 pollution poses unique challenges for air quality management due to their frequently conflicting control requirements. As shown in Table 3, compound pollution days exhibited a fluctuating but overall decline from 24 days in 2019 to 12 days in 2024, representing a 50% reduction. This decline is attributed to Binzhou’s refined pollution control measures, such as early intervention in heavy pollution events and precise source control [39], consistent with the regional “2+26” cities joint prevention initiative [4]. However, the rebound in 2021 (20 days) and 2023 (14 days) underscores the vulnerability of compound pollution to economic recovery—a finding that complements He et al.’s (2025) [11] observations of PM2.5-O3 double-high pollution in Baoding during periods of high industrial activity.
Table 3.
The number of days of compound pollution in different seasons in Binzhou city from 2019 to 2024.
While conducting the above research, Figure 7 illustrates the seasonal correlation between PM2.5 and O3: weak positive correlations were observed in spring (r = 0.06), summer (r = 0.15), and autumn (r = 0.09), while a weak negative correlation occurred in winter (r = −0.02). The strongest positive correlation in summer results from vigorous photochemical reactions that generate both O3 and secondary PM2.5 [27], combined with stable meteorological conditions favoring pollutant accumulation. This finding is consistent with Li et al.’s (2024) [6]. However, the higher summer correlation in Binzhou highlights the additional influence of local industrial emissions.
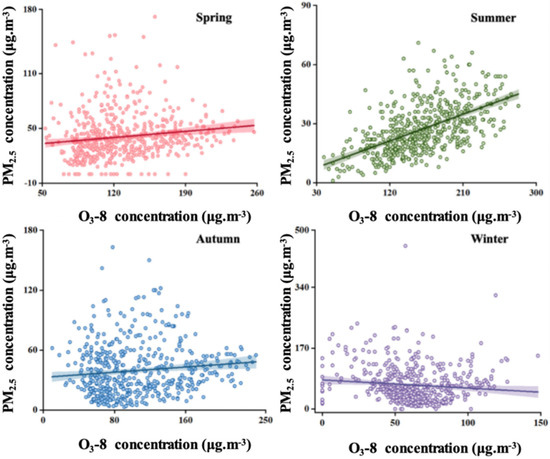
Figure 7.
Relationship between PM2.5 and O3 concentrations in different seasons of Binzhou city from 2019 to 2024.
The weak positive correlation observed in spring arises from competing influences: increased solar radiation promotes O3 formation, while dust events introduce exogenous PM2.5 [31]. In winter, the negative correlation results from suppressed O3 production due to reduced photochemical activity, alongside elevated PM2.5 emissions from coal combustion. Although this pattern has been documented in other northern Chinese cities [29], it is less pronounced in Binzhou, likely due to the greater relative contribution of industrial sources to PM2.5.
3.3. Key Drivers Identified by Gray Relational Analysis
3.3.1. The Characteristics of Compound Pollution Based on the Background of GDP Growth
Understanding the relationship between economic growth and pollution is critical for sustainable development. Figure 8 presents the GDP growth trajectory of Binzhou from 2019 to 2024 alongside the variation in the number of PM2.5-O3 compound pollution days. The city’s economy grew continuously during this period: GDP increased from 245.7 billion yuan in 2019 to 340.5 billion yuan in 2024, representing cumulative growth of 38.6% and an average annual growth rate of approximately 6.7%. Concurrently, the number of compound pollution days exhibited a fluctuating downward trend, decreasing from 24 days in 2019 to 12 days in 2024-a 50% reduction. This inverse trend suggests a phased “decoupling” between economic growth and air pollution in Binzhou, which aligns with the broader research conclusions of Li et al. (2021) [24] regarding the decoupling relationship between pollutants and GDP in key air pollution control regions of China. It further validates the critical role of targeted environmental policies in facilitating this decoupling process.
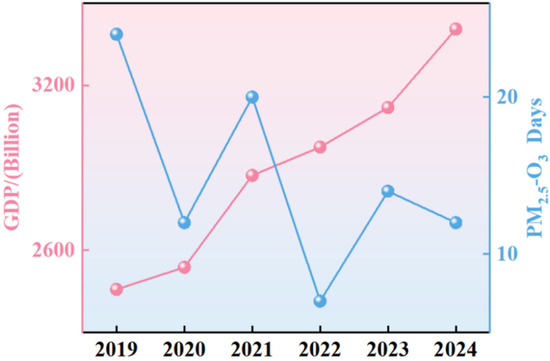
Figure 8.
Temporal trends of GDP and PM2.5-O3 days in Binzhou city from 2019 to 2024.
Specifically, significant decoupling occurred in 2020 and 2022, with GDP growing by 3.3% and 3.6%, respectively, in these years. In 2022, strict implementation of staggered production measures during autumn and winter effectively counterbalanced the additional pollutant emissions from economic activities. This allowed simultaneous economic growth and substantial pollution reduction, demonstrating how temporary, targeted emission controls can reconcile economic development with environmental protection. These findings provide empirical support for policy-driven decoupling mechanisms [40]. In contrast, weak decoupling characterized in 2021 and 2023. These years saw high economic growth (13.2% in 2021 and 4.8% in 2023) but also notable pollution rebounds, with compound pollution days increasing by 67% and 100%, respectively. The 2023 rebound was partly driven by expanded export manufacturing, which increased energy demand and coal consumption by 4.2% according to Shandong’s energy statistics. The 2021 rebound on the other hand, was primarily attributed to retaliatory industrial production following the relaxation of pandemic restrictions and unfavorable meteorological conditions for pollutant diffusion [20], highlighting the significant economic and environmental pressures posed by the energy-intensive industrial structure [41]. These two distinct decoupling scenarios illustrate the complex challenge of balancing economic growth and environmental quality in industrial cities like Binzhou, particularly during rapid economic recovery.
Between 2019 and 2024, the interaction between GDP growth and compound pollution days in Binzhou evolved through distinct phases. In early 2020, despite a slight GDP increase compared to 2019 (amidst global pandemic-induced economic contractions), the number of compound pollution days decreased significantly. This was largely due to the reduction in anthropogenic pollution sources, such as decreased vehicle emissions and lower emissions from polluting enterprises, resulting from the early pandemic control measures [23]. The year 2021 saw a strong GDP rebound driven by economic stimulus policies. However, rapid recovery in energy-intensive sectors like chemicals and electrolytic aluminum sharply increased industrial emissions. Consequently, compound pollution days rose to 22-an increase of 9 days from 2020. After 2021, Binzhou strengthened environmental protection efforts, including restricting high-pollution industries in line with dual-carbon goals, which helped curb the growth of pollution days. The minor increase in compound pollution days during 2022–2023 coincided with economic recovery, higher industrial capacity utilization, and increased coal consumption, which raised pollutant emissions [22]. By 2024, Binzhou achieved significant economic growth while simultaneously improving air quality. This positive development was closely associated with the city’s investments in clean industries, technological upgrades in polluting enterprises, and the implementation of policies such as the “Action Plan for Continuous Improvement of Air Quality”. These measures demonstrate that through proactive structural adjustments and technological innovation, industrial cities can achieve sustainable development characterized by both economic growth and environmental improvement.
3.3.2. Gray Relational Analysis of the Key Influencing Factors of Ecological Environment Air Quality
The GRA results for PM2.5 show a clear structure of influencing factors, with correlation degrees ranging from 0.42 to 0.70 (Figure 9). Industrial electricity consumption (Y2) ranked highest (0.70), exceeding industrial energy consumption (Y4, 0.67) by 4.5%. This finding underscores the dominant role of industrial electricity use in driving PM2.5 emissions—likely due to Binzhou’s reliance on energy-intensive industries (e.g., electrolytic aluminum, chemicals), where electricity consumption is tightly linked to both primary PM2.5 emissions and precursor (SO2, NOX) release [22]. Population density (Y3, 0.67) and industrial energy consumption (Y4, 0.67) formed the second tier, with a negligible correlation difference (0.001). This reflects the synergistic effect of urbanization and industrialization: population agglomeration increases demand for industrial products and residential energy use, while industrial energy consumption directly emits PM2.5 [42]. Building construction area (Y8, 0.61) and motor vehicle ownership (Y6, 0.57) constitute the third tier, with a 6.7% correlation gap—indicating that infrastructure construction (a source of construction dust) has a stronger impact on PM2.5 than transportation emissions in Binzhou. This contrasts with studies in megacities like Beijing [6], where mobile sources are more prominent, highlighting the unique pollution structure of medium-sized industrial cities. Notably, agricultural output value (Y5, 0.54) and regional GDP (Y1, 0.53) exhibit weak correlations, with GDP ranking 7th. This unexpected result may reflect Binzhou’s industrial structure: the city’s GDP growth is driven by low-emission sectors (e.g., high-tech manufacturing) in recent years, while traditional agriculture (a potential source of dust and straw-burning emissions [43]) has a declining contribution to PM2.5. Annual precipitation (Y7, 0.42), the only natural factor, showed the lowest correlation, which is consistent with Wang et al. (2014) [29], who noted that anthropogenic emissions dominate PM2.5 in northern Chinese cities, outweighing the pollutant-scavenging effect of precipitation.
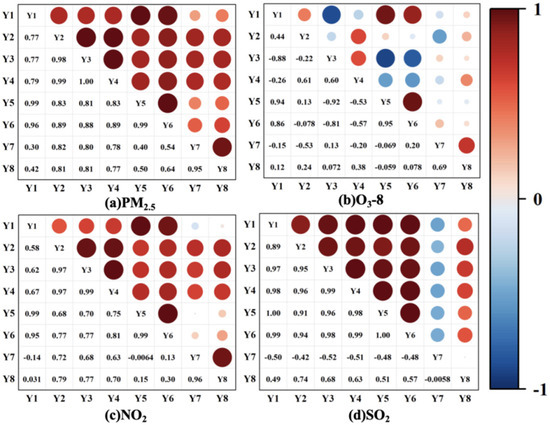
Figure 9.
Gray correlation analysis of major pollutants in Binzhou city. Note: Y1 to Y8, respectively, represent regional GDP, industrial electricity consumption, population density, industrial energy consumption, agricultural output value, motor vehicle ownership, annual precipitation, and construction area of buildings.
For O3-8 h, the correlation degrees of influencing factors were ranked as follows: industrial energy consumption (Y4, 0.92) exhibited the strongest correlation, followed by population density (Y3, 0.90), industrial electricity consumption (Y2, 0.88), motor vehicle ownership (Y6, 0.80), building construction area (Y8, 0.78), agricultural output value (Y5, 0.72), regional GDP (Y1, 0.71), and annual precipitation (Y7, 0.47). The exceptionally high correlation of industrial energy consumption (Y4) with O3-8 h (0.92)—far exceeding that in PM2.5 analysis—highlights the critical role of industrial precursor emissions (NOX, VOCs) in O3 formation [27]. Motor vehicle ownership (Y6, 0.80) ranked fourth, indicating that while transportation contributes to O3, its impact is muted compared to industrial sources-contrasting with studies in Baoding [12], where traffic-related NOX dominates O3 precursor emissions. This difference underscores the need for region-specific O3 control strategies: Binzhou should prioritize industrial VOC/NOX reduction, whereas larger cities may focus more on mobile sources. Annual precipitation (Y7, 0.47) showed the weakest correlation, confirming that meteorological factors such as temperature and solar radiation influence O3 concentrations more strongly than precipitation [21].
The GRA results for NO2 show a clear hierarchy of correlation degrees (0.46–0.77), with industrial electricity consumption (Y2, 0.77) ranking first. This aligns with Binzhou’s industrial structure: energy-intensive industries (e.g., coal-fired power plants, steel) use electricity for production processes and are major NOX emitters, even with SCR/SNCR denitrification equipment [22]. Population density (Y3) and industrial energy consumption (Y4) tie for second (0.74), reflecting the synergistic effect of population agglomeration (increased transportation and residential energy use) and industrial activity on NO2 emissions [13]. Construction area showed a relatively strong correlation, suggesting that construction machinery emissions contribute more significantly to NO2 in Binzhou than on-road vehicles—a pattern not previously documented in other BTH corridor cities [3]. In contrast, agricultural output value (Y5, 0.59) and regional GDP (Y1, 0.58) demonstrated weak correlations. This likely reflects both the minimal NO2 emissions from agricultural activities and the ongoing decoupling between economic growth and high-emission industries [24]. Annual precipitation (Y7, 0.46) showed the weakest influence, supporting the established understanding that natural factors play a limited role in NO2 variations within human-dominated environmental systems [44].
For SO2, industrial electricity consumption (Y2, 0.72) showed the strongest correlation, confirming that industrial activity-particularly coal-fired electricity generation-serves as the primary SO2 source [22]. Population density (Y3, 0.72) and industrial energy consumption (Y4, 0.71) formed a second tier, with a correlation difference of less than 0.02. This reflects the synergy between urbanization and industrial coal use in driving SO2 emissions, as population concentration increases residential heating demand [29]. Building construction area (Y8, 0.68) and motor vehicle ownership (Y6, 0.61) rank in the middle, indicating moderate contributions from construction (e.g., coal use in on-site heating) and transportation (negligible for SO2, consistent with low sulfur in diesel fuel [13]). Agricultural output value (Y5, 0.57) and regional GDP (Y1, 0.56) show weak correlations, with GDP ranking seventh. This likely results from Binzhou’s ongoing transition toward low-sulfur industries such as high-tech manufacturing in its economic structure [24]. Annual precipitation (Y7, 0.52) is the weakest natural factor, but its correlation exceeds 0.5, suggesting that wet deposition has a minor but measurable influence on SO2 concentrations-a finding consistent with Zhang (2023) [28].
4. Conclusions
This study systematically analyzed the temporal variations, interactions, and key drivers of major air pollutants, particularly PM2.5 and O3, in Binzhou-an industrial and agricultural city situated within the Beijing–Tianjin–Hebei pollution transport corridor of the Yellow River Basin. Using high-resolution monitoring and socioeconomic data from 2019 to 2024, several key findings emerge. PM2.5 concentrations declined then rebounded, reaching their highest levels in winter owing to heating demand and stagnant atmospheric conditions. In contrast, O3 levels fluctuated but trended upward, peaking in summer as a result of photochemical activity. The number of compound pollution days fell by 50% over the study period, with most occurring in spring (March–May), identifying this season as a critical period for coordinated control. Seasonal correlation analysis revealed weak positive PM2.5-O3 associations in spring, summer, and autumn, strongest in summer, and a weak negative correlation in winter. These patterns reflect the influence of meteorological conditions and precursor emissions on pollutant interactions.
Gray relational analysis highlighted industrial electricity consumption and population density as dominant factors influencing PM2.5, while industrial energy consumption showed the strongest association with O3 formation. The study also observed a phased decoupling between economic growth and pollution levels. Meanwhile, the study contributes to the literature by delineating season-specific pollution dynamics and key socio-economic drivers in a medium-sized industrial city within a regional transport corridor, thereby addressing a critical research gap as the relationship between urban form, pollution, and their drivers can be distinctly different from those in megacities [45]. These results support the development of differentiated control strategies: prioritizing PM2.5 reduction in winter through clean heating and improved dispersion management, focusing on O3 precursors in summer, and implementing coordinated measures in spring. Future research should combine high-temporal-resolution monitoring with chemical transport modeling to better understand short-term pollution formation pathways and precursor sensitivity. Such approaches would strengthen the evidence base for synergistic pollution reduction and sustainable urban development in similar regional contexts.
Author Contributions
Conceptualization, Y.X. and X.J.; methodology, Y.X. and J.W.; software, Y.X., Y.L. and Y.Z.; validation, Y.X., J.W. and Y.Z.; formal analysis, M.Z.; investigation, Y.X. and X.J.; resources, Y.X. and X.J.; data curation, Y.X. and J.W.; writing-original draft preparation, Y.X.; writing—review and editing, Y.X., Y.N., Y.Z. and X.J.; visualization, Y.X.; supervision, X.J.; project administration, X.J.; funding acquisition, X.J. All authors have read and agreed to the published version of the manuscript.
Funding
This research was supported by Shandong Provincial Natural Science Foundation (ZR2024QD160, ZR2023QD151, ZR2025QC405), National Natural Science Foundation of China (42307127, 42307143), Young Talent of Lifting engineering for Science and Technology in Shandong, China (SDAST2025 QTA079), and the Ph.D. Research Startup Foundation of Shandong University of Aeronautics (2023Y46, Y47, Y48).
Institutional Review Board Statement
Not applicable.
Informed Consent Statement
Not applicable.
Data Availability Statement
The pollutant data used in this study were obtained from the national public environmental data platform (https://www.aqistudy.cn/historydata/monthdata.php (accessed on 10 January 2025)). Socio-economic data were sourced from the Shandong Statistical Yearbook and the Binzhou Statistical Yearbook.
Conflicts of Interest
The authors declare no conflicts of interest. The funders had no role in the design of the study; in the collection, analyses, or interpretation of data; in the writing of the manuscript; or in the decision to publish the results.
References
- Chen, X.; Shao, S.; Tian, Z.; Xie, Z.; Yin, P. Impacts of air pollution and its spatial spillover effect on public health based on China’s big data sample. J. Clean. Prod. 2017, 142, 915–925. [Google Scholar] [CrossRef]
- Chen, Z.; Wang, J.N.; Ma, G.X.; Zhang, Y.S. China tackles the health effects of air pollution. Lancet 2013, 382, 1959–1960. [Google Scholar] [CrossRef]
- Jing, Q.; Sheng, L.F.; Zhang, W.H.; An, X.D. Characteristics of PM2.5 and O3 pollution and related meteorological impacts in ‘2+26’ cities of Beijing-Tianjin-Hebei and its surrounding areas from 2018 to 2021. Res. Environ. Sci. 2023, 36, 875–886. [Google Scholar]
- Yang, B.X. Spatiotemporal evolution of PM2.5 pollution in the ‘2+26’cities under regional joint governance. China Acad. J. 2024, 37, 1100–1110. [Google Scholar]
- Kang, N.; Wang, R.; Li, P.; Xue, T.; Liu, J.; Wan, W.; Gong, J.; Zhang, S.; Zhu, T. Beyond the halving commitment: China can do more to achieve clean air for global health. Innovation 2025, 6, 100996. [Google Scholar] [CrossRef]
- Li, S.; Yu, D.; Shi, C.; Zhao, N.; Xu, X.; Lu, S. Correlation analysis of PM2.5 and O3 in different types of urban forests in Beijing. Res. Environ. Sci. 2024, 37, 536–544. [Google Scholar]
- Hong, Y.; Ma, Y.J.; Su, C.C.; Wang, Y.F.; Ren, W.H.; Wang, J.K.; Wang, D.D.; Xu, X.B. Analysis of the Relationship between O3 and PM2.5 and the Main Factors Controlling Air Pollution in Shenyang. Res. Environ. Sci. 2024, 37, 455–468. [Google Scholar]
- Cheng, Y.; Dai, H.; Cheng, S.; Li, L.; Tong, H.; Li, J. Assessment of the Pollution Characteristics of PM2.5 and O3, Their Health Effects and Economic Losses in the Yangtze River Delta Region. Res. Environ. Sci. 2025, 38, 497–509. [Google Scholar]
- Jiang, L.; Liu, Y.S.; Yang, Y.J. Spatiotemporal Features of PM2.5 and O3 Pollution from 2015 to 2023 and Their Correlation with Meteorological Factors in Jiangxi Province. Res. Environ. Sci. 2025, 38, 460–472. [Google Scholar]
- Ning, Q.; He, M.; Ji, Y.Y.; Yin, H.; Li, J.D.; Shang, F.Y.; Zhang, K.; Yang, Y.J.; Li, H.; Gao, R.; et al. Characteristics and formation of complex air pollution and sources of VOCs in the Yellow River Delta region. Res. Environ. Sci. 2024, 37, 439–454. [Google Scholar]
- He, S.; Wang, C.; Cheng, S. Characteristics and Influencing Factors of PM2.5-O3 Double High Combined Pollution in Baoding City. Environ. Sci. 2025, 46, 1–14. [Google Scholar]
- Li, J.H.; Yan, Q.; Zhang, Z.Z.; Du, X.H.; Wei, P.; Xiao, T.Y.; Zhang, W.J. Optimization Analysis of Governance Scenarios under Constraints of Mid-and Long-Term Winter Targets for PM2.5 in Fen-Wei Plain. Res. Environ. Sci. 2024, 37, 963–974. [Google Scholar]
- Liu, X.; Chen, P.; Huang, C.; Wang, T.; Niu, T.; Li, M.; Li, R.; Wu, H.; Qu, Y. Study on the NO2 pollution and its connection with PM2.5 and O3 in Dazhou based on source apportionment. Atmos. Pollut. Res. 2025, 16, 102645. [Google Scholar] [CrossRef]
- Ma, J.; Hopke, P.K.; Zhu, X. PM2.5 pollution in a typical county of Northern China: Implications for air quality management. Atmos. Pollut. Res. 2025, 16, 102470. [Google Scholar] [CrossRef]
- Zhang, Y.L.; Cao, F. Fine particulate matter (PM2.5) in China at a city level. Sci. Rep. 2015, 5, 14884. [Google Scholar] [CrossRef] [PubMed]
- HJ 633-2012; Technical Specification for Ambient Air Quality Index (Trial). Ministry of Ecology and Environment of the People’s Republic of China: Beijing, China; China Environmental Science Press: Beijing, China, 2012.
- GB 3095-2012; Ambient Air Quality Standards. Ministry of Environmental Protection of the People’s Republic of China: Beijing, China, 2012.
- Deng, J. Control problems of grey systems. Syst. Control Lett. 1982, 1, 288–294. [Google Scholar]
- Huang, X.; Ding, A.; Gao, J.; Zheng, B.; Zhou, D.; Qi, X.; Tang, R.; Wang, J.; Ren, C.; Nie, W.; et al. Enhanced secondary pollution offset reduction of primary emissions during COVID-19 lockdown in China. Natl. Sci. Rev. 2021, 8, nwaa137. [Google Scholar] [CrossRef]
- Le, T.; Wang, Y.; Liu, L.; Yang, J.; Yung, Y.L.; Li, G.; Seinfeld, J.H. Unexpected air pollution with marked emission reductions during the COVID-19 outbreak in China. Science 2020, 369, 702–706. [Google Scholar] [CrossRef]
- Kou, W.; Gao, Y.; Zhang, S.; Cai, W.; Geng, G.; Davis, S.J.; Wang, H.; Guo, X.; Cheng, W.; Zeng, X.; et al. High downward surface solar radiation conducive to ozone pollution more frequent under global warming. Sci. Bull. 2023, 68, 388–392. [Google Scholar] [CrossRef]
- Zheng, B.; Tong, D.; Li, M.; Liu, F.; Hong, C.; Geng, G.; Li, H.; Li, X.; Peng, L.; Qi, J.; et al. Trends in China’s anthropogenic emissions since 2010 as the consequence of clean air actions. Atmos. Chem. Phys. 2018, 18, 14095–14111. [Google Scholar] [CrossRef]
- Giani, P.; Castruccio, S.; Anav, A.; Howard, D.; Hu, W.; Crippa, P. Short-term and long-term health impacts of air pollution reductions from COVID-19 lockdowns. Lancet Planet. Health 2023, 7, 491–500. [Google Scholar]
- Li, J.; Hou, L.; Wang, L.; Tang, L. Decoupling analysis between economic growth and air pollution in key regions of air pollution control in China. Sustainability 2021, 13, 6600. [Google Scholar] [CrossRef]
- Liu, J.; Wang, M.; Deng, J.; Chen, X.; Tang, X.; Zeng, L. Temporal and Spatial Evolution Patterns of AQI, Particulate Matter, and Ozone in Shandong Province and Key Influencing Factors. Res. Environ. Sci. 2023, 36, 273–284. [Google Scholar]
- Zhang, Y.; Xiao, G.J.; Liu, Y.; Li, X.Y.; Chen, Z.X.; Tao, Y. Characteristics of low-altitude atmospheric inversion and its influence on air pollutant concentration in Urumqi. J. Chengdu Univ. Inf. Technol. 2023, 38, 208–213. [Google Scholar]
- Qin, M.; She, Y.; Wang, M.; Wang, H.; Chang, Y.; Tan, Z.; An, J.; Huang, J.; Yuan, Z.; Lu, J.; et al. Increased urban ozone in heatwaves due to temperature-induced emissions of anthropogenic volatile organic compounds. Nat. Geosci. 2025, 18, 50–56. [Google Scholar] [CrossRef] [PubMed]
- Zhang, G.Q. Analysis of Influencing Factors and Evolution Trend Prediction of Atmospheric PM2.5 and O3 Pollution in Chang-Zhu-Tan Urban Agglomeration. Master’s Thesis, Hunan University of Science and Technology, Xiangtan, China, 2023. [Google Scholar]
- Wang, Y.; Yao, L.; Wang, L.; Liu, Z.; Ji, D.; Tang, G.; Zhang, J.; Sun, Y.; Hu, B.; Xin, J. Mechanism for the formation of the January 2013 heavy haze pollution episode over central and eastern China. Sci. China Earth Sci. 2014, 57, 14–25. [Google Scholar] [CrossRef]
- Li, K.; Jacob, D.J.; Liao, H.; Shen, L.; Zhang, Q.; Bates, K.H. Anthropogenic drivers of 2013--2017 trends in summer surface ozone in China. Proc. Natl. Acad. Sci. USA 2019, 116, 422–427. [Google Scholar] [CrossRef] [PubMed]
- Cheng, Y.; Zheng, G.; Wei, C.; Mu, Q.; Zheng, B.; Wang, Z.; Gao, M.; Zhang, Q.; He, K.; Carmichael, G.; et al. Reactive nitrogen chemistry in aerosol water as a source of sulfate during haze events in China. Sci. Adv. 2016, 2, e1601530. [Google Scholar] [CrossRef]
- Sillman, S. The relation between ozone, NOx and hydrocarbons in urban and polluted rural environments. Atmos. Environ. 1999, 33, 1821–1845. [Google Scholar] [CrossRef]
- Wang, P.; Chen, Y.; Hu, J.; Zhang, H.; Ying, Q. Source apportionment of secondary organic aerosol in China using a regional source-oriented chemical transport model and comparing to the CMAQ-VBS. Atmos. Chem. Phys. 2017, 17, 9355–9376. [Google Scholar]
- Wang, H.; Liu, Y.; Chen, X.; Gao, Y.; Qiu, W.; Jing, S.; Wang, Q.; Lou, S.; Edwards, P.M.; Huang, C.; et al. Unexpected Fast Radical Production Emerges in Cool Seasons: Implications for Ozone Pollution Control. Natl. Sci. Open 2022, 1, 20220013. [Google Scholar] [CrossRef]
- Li, M.; Huang, X.; Yan, D.; Lai, S.; Zhang, Z.; Zhu, L.; Lu, Y.; Jiang, X.; Wang, N.; Wang, T.; et al. Coping with the concurrent heatwaves and ozone extremes in China under a warming climate. Sci. Bull. 2024, 69, 2938–2947. [Google Scholar] [CrossRef] [PubMed]
- Tong, L.; Liu, Y.; Meng, Y.; Dai, X.; Huang, L.; Luo, W.; Yang, M.; Pan, Y.; Zheng, J.; Xiao, H. Surface ozone changes during the COVID-19 outbreak in China: An insight into the pollution characteristics and formation regimes of ozone in the cold season. J. Atmos. Chem. 2023, 80, 103–120. [Google Scholar] [CrossRef] [PubMed]
- Zeng, X.G.; Ruan, F.F.; Peng, Y.Y. Health effects’ spatial distribution analysis of PM2.5 pollution in China based on spatial grid scale. China Environ. Sci. 2019, 39, 2624–2632. [Google Scholar]
- Zheng, S.; Pozzer, A.; Cao, C.X.; Lelieveld, J. Long-term (2001–2012) concentrations of fine particulate matter (PM2.5) and the impact on human health in Beijing, China. Atmos. Chem. Phys. 2015, 15, 5715–5725. [Google Scholar] [CrossRef]
- He, W.; Zhang, W.J.; Wang, S.L.; Chai, F.H.; Li, H.; Zhang, J.Q.; Wang, H.; Hu, J. Effects and Improvement Suggestions on Air Pollution Joint Prevention and Control Mechanism in Beijing-Tianjin-Hebei Region. Res. Environ. Sci. 2019, 32, 1696–1703. [Google Scholar]
- Wang, Q.; Su, M. Drivers of decoupling economic growth from carbon emission—An empirical analysis of 192 countries. J. Clean. Prod. 2020, 242, 118561. [Google Scholar]
- Wu, R.; Dai, H.; Geng, Y.; Xie, Y.; Masui, T.; Liu, Z. Economic impacts from PM2.5 pollution-related health effects in China’s road transport sector: A provincial-level analysis. Environ. Int. 2016, 95, 152–159. [Google Scholar]
- Hao, Y.; Liu, Y.M. The influential factors of urban PM2.5 concentrations in China: A spatial econometric analysis. J. Clean. Prod. 2016, 112, 1443–1453. [Google Scholar] [CrossRef]
- Zhong, F.Q.; Su, Q.T.; Zhou, R.J.; Yi, M.J.; Wu, Q.Z.; Yan, Y. Impact of crop straw burning on urban air quality based on WRF-Chem simulations. Clim. Environ. Res. 2017, 22, 149–161. [Google Scholar]
- Xu, B.; Lin, B. Regional differences of pollution emissions in China: Contributing factors and mitigation strategies. J. Clean. Prod. 2015, 103, 226–238. [Google Scholar] [CrossRef]
- Liu, Y.; Wu, J.; Yu, D.; Ma, Q. The relationship between urban form and air pollution depends on seasonality and city size. Environ. Sci. Pollut. Res. 2018, 25, 15554–15567. [Google Scholar] [CrossRef] [PubMed]


Disclaimer/Publisher’s Note: The statements, opinions and data contained in all publications are solely those of the individual author(s) and contributor(s) and not of MDPI and/or the editor(s). MDPI and/or the editor(s) disclaim responsibility for any injury to people or property resulting from any ideas, methods, instructions or products referred to in the content. |
© 2025 by the authors. Licensee MDPI, Basel, Switzerland. This article is an open access article distributed under the terms and conditions of the Creative Commons Attribution (CC BY) license (https://creativecommons.org/licenses/by/4.0/).