Article

Robotic and On-Flow Solid Phase Extraction Coupled with LC-MS/MS for Simultaneous Determination of 16 PPCPs: Real-Time Monitoring of Wastewater Effluent in Korea

1
Korea Institute of Civil Engineering and Building Technology, 283 Goyangdar-Ro, Goyang-Si 411-712, Republic of Korea
2
Civil & Environmental Engineering, Korea University of Science & Technology, 217 Gajung-to Yuseong-gu, Daejeon 305-333, Republic of Korea
3
CentumTech Incorporation, 82 Hwagok-ro 68-gil, Deungchon 1-dong, Seoul 07566, Republic of Korea
*
Author to whom correspondence should be addressed.
Toxics 2025, 13(10), 899; https://doi.org/10.3390/toxics13100899
Submission received: 19 September 2025 / Revised: 14 October 2025 / Accepted: 17 October 2025 / Published: 20 October 2025

Highlights

What are the main findings?
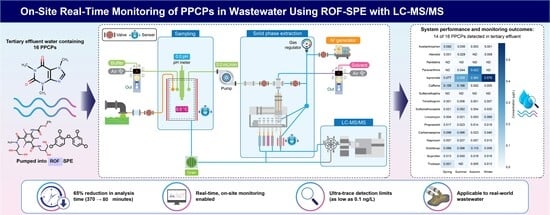
  • A fully automated robotic on-flow SPE system enables the real-time LC–MS/MS monitoring of 16 PPCPs in wastewater effluent directly on site.
  • The system autonomously performs sampling, filtration, pH adjustment, extraction, and direct LC–MS/MS injection on site.
  • Long-term field operation (12 months) demonstrated a >70 % reduction in analysis time vs. offline SPE with sub-ng/L detection limits.
What is the implication of the main finding?
  • These results show that a fully automated, on-site robotic and on-flow SPE–LC–MS/MS system can continuously monitor trace PPCPs in wastewater with high throughput.
  • This advancement signals a paradigm shift toward real-time, autonomous environmental monitoring, facilitating smarter, more efficient water quality management and rapid pollution response.

Abstract

Pharmaceuticals and personal care products (PPCPs) are recognized as emerging contaminants of concern, even at ultra-trace concentrations. However, the current detection systems are prohibitively expensive and typically rely on labor-intensive, lab-based workflows that lack automation in sample pretreatment. In this study, we developed a robotic and on-flow solid-phase extraction (ROF-SPE) system, fully integrated with online liquid chromatography-tandem mass spectrometry (LC-MS/MS), for the on-site and real-time monitoring of 16 PPCPs in wastewater effluent. The system automates the entire pretreatment workflow—including sample collection, filtration, pH adjustment, solid-phase extraction, and injection—prior to seamless coupling with LC–MS/MS analysis. The optimized pretreatment parameters (pH 7 and 10, 12 mL wash volume, 9 mL elution volume) were selected for analytical efficiency and cost-effectiveness. Compared with conventional offline SPE methods (~370 min), the total analysis time was reduced to 80 min (78.4% reduction), and parallel automation significantly enhanced the throughput. The system was capable of quantifying target analytes at concentrations as low as 0.1 ng/L. Among the 16 PPCPs monitored at a municipal wastewater treatment plant in South Korea, only sulfamethazine and ranitidine were not detected. Compounds such as iopromide, caffeine, and paraxanthine were detected at high concentrations, and seasonal variation patterns were also observed This study demonstrates the feasibility of a fully automated and on-site SPE pretreatment system for ultra-trace environmental analysis and presents a practical solution for the real-time monitoring of contaminants in remote areas.

Graphical Abstract

1. Introduction

Pharmaceuticals and personal care products (PPCPs) encompass a wide range of chemical substances including medications, personal hygiene products, fragrances, disinfectants, and hormones. Due to their persistence, potential for bioaccumulation, and toxicity, PPCPs are recognized as emerging contaminants that can exert physiological effects on both humans and aquatic organisms, even at trace concentrations [1,2,3,4]. PPCPs are considered a major threat to aquatic ecosystems due to their biological activity and environmental persistence, and global monitoring efforts are increasing accordingly [5].
The European Union and the United States Environmental Protection Agency (EPA) have designated 33 priority substances to regulate key organic pollutants responsible for aquatic contamination. Additionally, compounds such as diclofenac, iopamidol, synthetic musks, carbamazepine, ibuprofen, clofibric acid, triclosan, phthalates, and bisphenol A have been proposed as candidates for future regulation [6,7].
To support future regulatory decisions, the European Commission has also implemented a watch list system since 2015 for the systematic monitoring of emerging contaminants in wastewater. The latest update, Implementing Decision 2025/439, was established under Directive 2008/105/EC to guide EU-wide surveillance efforts [European Commission]. Similar monitoring initiatives are being adopted globally in response to increasing concerns over PPCP contamination [8].
Carbamazepine and sulfamethoxazole have been identified as posing high ecological risks to freshwater ecosystems in Asia [2]. Ibuprofen has been shown to inhibit algal growth, disrupt photosynthesis, cause morphological changes in algal cells, and exert immunosuppressive and nephrotoxic effects in fish including alterations in gene expression related to bone development and immune function [9]. The presence of caffeine in aquatic environments has raised concerns as it has been reported to affect the cardiovascular, behavioral, and reproductive systems of both humans and aquatic organisms [10]. Triclosan exhibits chemical properties that can disrupt the endocrine system [11]. Trimethoprim and sulfamethoxazole detected in WWTP effluent were found to enhance antibiotic resistance in two natural bacterial strains present in the receiving environment [6]. Diclofenac is highly toxic and causes damage to the liver, kidneys, and gills of fish such as rainbow trout [12]. Naproxen can affect organisms inhabiting ecosystems either through its inherent toxicity or via the toxicity of its metabolites. The latter can be formed through both physicochemical and biological processes [13]. Paraxanthine is the primary metabolite of caffeine, accounting for more than 80% of its total metabolism [14].
These substances originate from pharmaceutical manufacturing facilities, hospitals, and households and often enter the environment through the improper disposal of unused medications. PPCPs have been widely detected in various environmental matrices including wastewater and sewage [15,16], surface water [17,18,19,20], groundwater, and even drinking water at trace concentrations in the ng/L range [21,22,23,24]. Frequently detected PPCPs in the United States include caffeine, ibuprofen, acetaminophen, triclosan, carbamazepine, and various antibiotics [19,25]. Ibuprofen is commonly reported [26], while in Mexico, diclofenac, ibuprofen, naproxen, and clofibric acid have been identified [27]. In China, roxithromycin, erythromycin, ibuprofen, carbamazepine, propranolol, triclosan, and antibiotics are frequently found [28,29,30,31], and in South Korea, commonly detected PPCPs include acetaminophen, ibuprofen, caffeine, carbamazepine, naproxen, and antibiotics [32,33].
PPCPs are of particular concern because conventional wastewater treatment plants often show insufficient removal efficiencies, allowing both parent compounds and transformation products with similar pharmacological activity to be discharged into aquatic ecosystems [33]. As a result, domestic wastewater is considered a significant source of ecological contamination and potential human health risk [34,35]. Therefore, the accurate and sensitive monitoring of PPCPs in environmental waters is essential.
Recent advances in analytical technologies have enabled the simultaneous quantification of multiple PPCPs at trace levels across different aquatic systems. Automated workflows integrating extraction, separation, and detection—such as online solid-phase extraction (SPE) coupled with liquid chromatography-tandem mass spectrometry (LC-MS/MS)—have become widely adopted for environmental sample analysis due to their advantages of minimal sample preparation, reduced sample volume, and lower solvent consumption [36,37,38,39,40].
In previous studies, online SPE systems typically referred to fully automated analytical workflows in which extraction and quantification were seamlessly integrated with LC-MS/MS instruments in real-time [41,42,43,44,45]. However, most existing systems still require the transport of collected samples to laboratories for further processing and analysis, and often rely on expensive SPE modules and mass spectrometry instruments. To date, no system has been developed that enables fully automated, on-site sampling, sample preparation, injection, and real-time analysis within a single platform.
SPE remains the most critical step in trace-level PPCP analysis, but its automation and field integration have remained technically challenging. This study addresses this gap by developing a robotic, on-flow SPE system designed specifically for autonomous on-site monitoring.
Recently, robotic systems and on-flow technologies have been utilized to automate sample preparation in chromatography and mass spectrometry analyses [46].
Accordingly, this study integrated two major automation approaches—robotic systems and on-flow technologies—to develop a field-deployable robotic on-flow solid-phase extraction (ROF-SPE) system capable of fully automated on-site sampling, concentration, injection, and analysis within a single platform. The system actively controls the flow rate using solenoid valves and precision pumps while integrating multi-step extraction and concentration processes directly with the analytical instrument in an online configuration, thereby maximizing the throughput and significantly reducing the analysis time. The automated sample pretreatment process was tested to verify the accuracy, precision, and reproducibility of the analysis while minimizing human error and exposure to hazardous chemicals. The objective of this study was to overcome the limitations of conventional online SPE systems by developing a fully automated, field-based environmental monitoring technology capable of real-time analysis, ensuring that the robot-controlled on-flow SPE system achieves precision and efficiency equivalent to conventional offline or semi-automated methods while shortening the analysis time and enabling the stable, long-term real-time monitoring of PPCPs on-site.

2. Materials and Methods

2.1. Chemicals and Reagents

All solvents used here were of LC-MS grade, whereas all other chemicals were of analytical reagent grade. Methanol (≥99.9%, suitable for HPLC) was sourced from Avantor (Radnor, PA, USA), and formic acid (96%, ACS grade) and ammonium hydroxide (28–30%, ACS grade) were obtained from Sigma-Aldrich (St. Louis, MO, USA). The 16 pharmaceutical regents of acetaminophen (ACP), atenolol (ATN), ranitidine (RNT), paraxanthine (PRX), iopromide (IPM), caffeine (CFI), sulfamethazine (SFA), trimethoprim (TMP), sulfamethoxazole (SFX), lincomycin (LCM), propranolol (PPN), carbamazepine (CBZ), naproxen (NPX), diclofenac (DCF), ibuprofen (IBF), and triclosan (TCS) were purchased from Sigma-Aldrich (St. Louis, MO, USA).
Internal standard substances—used to control the variability of the target analytes and eliminate matrix effects and instrumental interferences to improve quantification accuracy and reproducibility—included ACP-d4, ATN-d7, RNT-d6, PRX-d3, IPM-d3, CFI-d9, TMP-d9, SFX-d4, LCM-d3, PPN-d7, CBZ-d10, NPX-d4, DCF-d4, IBF-d3, TCS-d3, and SFA-13C6. The standards were purchased from Sigma-Aldrich (St. Louis, MO, USA). To evaluate the SPE recovery, seven internal standards were employed: CBZ-d10, IBF-d3, ATN-d7, TMP-d9, SFA-13C6, SFX-d4, and DCF-d4. Stock solutions of all of the compounds were prepared in methanol at a concentration of 1000 mg/L. Deionized water used for the preparation and dilution of standard solutions was produced using a purification system with a resistivity of 18.2 MΩ·cm at 25 °C. Table 1 lists the key physicochemical properties of the 16 PPCPs investigated.

2.2. The Robotic and On-Flow SPE System

We developed a robotic and on-flow SPE system coupled with a liquid chromatography-tandem mass spectrometry (ROF-SPE-LC-MS/MS) system capable of performing sample collection and SPE pretreatment directly in the field. A conceptual diagram of the system is shown in Figure 1a. The “solid phase extraction” and “LC/MS/MS” sections in Figure 1a correspond to the SPE components and the overall system shown in Figure 1b. Furthermore, the flow of valves depicted in the “solid phase extraction” section of Figure 1a is illustrated in greater detail in Figure 1c.
The ROF-SPE system, along with a liquid chromatography (LC) system (Acquity, Waters, Milford, MA, USA) and a tandem mass spectrometer (Xevo TQ-S, Waters, Milford, MA, USA), was modularly installed and integrated within a 20-foot container (2.3 m wide × 6.0 m long × 2.3 m high; load capacity: 25 metric tons). The container was positioned near the tertiary effluent outlet of the I City wastewater treatment plant and designed to allow mobile deployment. At the site, tertiary effluent was directly sampled using a pump, automatically filtered through a 0.5 μm filter (SACAR, Seoul, Republic of Korea). A pH meter (HI-1230B, HANNA, Seoul, Republic of Korea) and a temperature sensor (GA100S, Samwonen, Republic of Korea) were installed in the sampling unit to adjust the pH and monitor the temperature of the sample before it was introduced into the ROF-SPE system.
In the field, samples automatically extracted through the SPE process were loaded and discharged from a sample loop using a 2-position, 6-port valve (Rheodyne, CA, USA). Subsequently, the samples were automatically injected into the LC-MS/MS system via a column. The SPE component was designed to accommodate 24 SPE cartridges mounted on a linear-motion tray, allowing for sequential use (Figure 1b). In the 2-position, 6-port valve shown in Figure 1c, the pre-concentrated sample from the SPE system is loaded into the loop (ports 1–4) via the syringe pump (port 5) through port 6. After filling, the valve switches from the loading path (LC pump → 3 → 2 → column) to the injection path (3 → 4 → loop → 1 → 2 → column) to deliver the sample to the column.
The concentration process is carried out through vortex shearing and heating of a custom-made sample block (CentumTech, Seoul, Republic of Korea) at 40 °C and 30 psi. The vortex shearing caused by the gas nozzle (2 mm, CentumTech, Seoul, Republic of Korea) is a process in which nitrogen gas flows along the inner wall, inducing rotation of the sample. This rotation increases the surface area of the sample, thereby maximizing its contact with the concentrating gas. Nitrogen gas, known for its low oxidative properties, is used in this process. Once concentration is complete, a sensor (HPF-T032E-L02, Azbil, Tokyo, Japan) mounted at the bottom measures the sample status. This value is then converted into an on/off signal via the sensor amplifier (HPX-EG00-1S-L02, Azbil, Tokyo, Japan). When the preset value is reached, the concentration process automatically stops.
The concentrated sample obtained through the SPE pretreatment was automatically introduced into the LC-MS/MS injection port using a 3-port syringe pump (IMI Norgren, Littleton, CO, USA) and sensor (Azbil, Tokyo, Japan).
The ROF-SPE system was designed to be compatible with various LC-MS/MS platforms. The LC-MS/MS interface supports multiple communication protocols including TTL, RS232C, and RS485, and incorporates a timeline-based mode that allows for start and end signal control from either the LC pump or the mass spectrometer.

2.3. Liquid Chromatography-Tandem Mass Spectrometry

Chromatographic separation was performed using a Waters BEH C18 column (2.1 × 100 mm, 1.9 μm) maintained at 45 °C. The mobile phase consisted of 0.1% formic acid in water (A) and methanol (B). A gradient elution was performed as follows: 95% B at 0 min, decreased to 80% at 1 min, further to 0% at 10 min, held for 12 min, and returned to 95% at 15 min. The flow rate was set at 0.3 mL/min, and the injection volume was 10 μL. Mass spectrometry detection was performed using an electrospray ionization source in both positive and negative ion modes. The nebulizer gas (ion source 1) and heater gas (ion source 2) were supplied at 50 psi, while the curtain gas was maintained at 25 psi. The desolvation temperature was set to 500 °C. Ion spray voltages were +5.5 and −4.5 kV for the positive and negative modes, respectively. Nitrogen was used as the collision gas throughout the analysis.

2.4. The Robotic and On-Flow Solid-Phase Extraction Method

The robotic and on-flow solid-phase extraction (ROF-SPE) was fully automated. A 500 mL sample of final effluent from a sewage treatment plant was automatically filtered through a 0.5 μm filter. To suppress pharmaceutical degradation caused by metal-catalyzed reactions, 100 μL of Na2EDTA was added via syringe pump injection [47,48]. Seven internal standards were automatically introduced to a final concentration of 100 µg/L to evaluate extraction recovery. The pH was adjusted to the desired condition using 0.1% (v/v) formic acid and 0.1% (v/v) ammonium hydroxide.
The SPE cartridge used was a commercially available Oasis HLB (200 mg, 6 cc, 30 µm; Waters Corporation, Milford, MA, USA), which provides high retention for acidic, neutral, and basic compounds and is suitable for water-based sample loading [44,49,50]. Cartridges were preconditioned with 6 mL of methanol (3 mL/min), followed by 6 mL of water (3 mL/min), and equilibrated with 6 mL of water at pH 3, 7, or 10 (5 mL/min) depending on the experimental conditions.
The sample (500 mL) was then loaded onto the cartridge at 10 mL/min. Washing and eluent are important to increase the recovery rates and remove matrix interferences [51]. Cartridges were washed with 6–18 mL of water at pH 3, 7, or 10 (3 mL/min), adjusted using 0.1% formic acid or 0.1% ammonium hydroxide. Washing was compared using an organic solvent (10% MeOH) at pH 3, 7, and 10.
The cartridge was subsequently dried under nitrogen gas for 20 min to remove residual moisture. Elution was performed in two steps using 3–6 mL of methanol (1 mL/min). The eluate was evaporated under nitrogen at 40 °C and 30 psi for 20 min, then reconstituted in 1 mL of methanol for LC-MS/MS analysis. The total pretreatment time of the FAOS-SPE system was 150 min for the first sample. When operated continuously, the system was capable of processing up to 18 samples per day (80 min).
Recovery tests were conducted in five replicates, and the average recovery was used for evaluation. The developed ROF-SPE system was compared with a commercial offline SPE device (AquaTrace ASPE899, GLtechno Holdings Inc., Tokyo, Japan) under identical pretreatment conditions.
Under consistent pretreatment conditions (flow rate, solvent volume, sample volume, processing speed, drying, and elution parameters), the offline SPE method required 220 min for evaporation alone. The total pretreatment time per sample was 370 min.

2.5. Method Validation

Method detection limits (MDLs) and method quantification limits (MQLs) were experimentally determined based on signal-to-noise (S/N) ratios of 3 and 10, respectively. The MDL and MQL were verified by injecting the standard solutions five times at the target concentration level. Calibration curves were established by linear regression using six different concentrations. Precision was also evaluated using five replicate extractions and expressed as the relative standard deviation (RSD, %) of the repeated measurements. The accuracy was determined as the relative error (%) between the measured and spiked concentrations.

2.6. Matrix Effect and SPE Extraction Recovery

Matrix effects (ME, %) were evaluated using the sample as the analytical matrix. The ME was determined by comparing the average peak areas of the analytes spiked into the samples (Aspike) with those of standards prepared in solvent (Asolvent) after subtracting the background response from the unspiked sample (Ablank). Each condition was analyzed in triplicate, and the ME calculated according to the following equation [41,52]:
M E % = A s p i k e A b l a n k A s o l v e n t × 100
Here, ME values within the range of 85–115% were considered acceptable without correction. Values < 85% indicated ion suppression, while those > 115% indicated ion enhancement, both of which require correction using internal standards [53]. The RSD should not exceed 15% [54]. Extraction recovery was determined by comparing the concentration obtained after SPE pretreatment with the internal standard and the initial addition concentration, and was estimated as the average of the five experiments [41].
E x t r a c t i o n   r e c o v e r y % = C s p i k e C b l a n k C a c t u a l × 100
The process efficiency was calculated as the overall efficiency reflecting both the ME and recovery [52].

2.7. Water Quality

The pH and total dissolved solids (TDS) were measured using a multi-parameter meter (ORION STAR A221, Thermo Scientific, Waltham, MA, USA). Turbidity was determined using a turbidimeter (2100N, HACH, Loveland, CO, USA), and the total organic carbon (TOC) was analyzed using a TOC analyzer (TOC-VCPH, Shimadzu, Kyoto, Japan). The UV254 absorbance was measured using a UV–Vis spectrophotometer (DR5000, HACH, Loveland, CO, USA). Total nitrogen (T-N) and total phosphorus (T-P) were determined using a multi-parameter photometer (SYNCA 3ch; BLTech Korea, Chuncheon-si, Republic of Korea).

3. Results

3.1. LC-MS/MS Optimization

A field-deployable ROF-SPE coupled with the LC-MS/MS method was developed to analyze PPCPs in tertiary effluent from a wastewater treatment plant. The presence of various water constituents, such as specific enzymes, fulvic and humic acids, and microorganisms, can lead to the formation of diverse metabolic products that markedly affect PPCP recovery. Matrix effects can suppress or, in rare cases, enhance the analytical signals of target compounds, occasionally resulting in inaccurate results [55]. PPCPs are mostly polar or moderately polar compounds [56,57]. Therefore, the accurate quantification of different types of water requires the careful consideration of all water quality characteristics that may influence analyte recovery. Table 2 presents the water quality parameters of tertiary effluent at the study site. The MS conditions were optimized based on previously reported ion fragments, and the final parameters are summarized in Table 3. Isotopically labeled compounds were used as internal standards for calibration curve construction and quantification of the target analytes, facilitating matrix effect correction and improving analytical precision.

3.2. Method Validation

The performance of the developed method was evaluated in terms of its MDL, MQL, precision, and accuracy, as summarized in Table 4. All 16 target PPCPs demonstrated excellent linearity across the tested concentration range (n = 6) with correlation coefficients (R2) > 0.99. The MDLs and MQLs ranged from 2.5 to 103.4 ng/L and 3.6 to 328.9 ng/L, respectively. Among the analytes, PRX exhibited notably higher MDL and MQL than those of the other 15 compounds. The RSD for precision ranged from 3.0 to 15.4%, whereas accuracy values ranged from 80.6 to 104.9%. These results confirm that the method satisfied the standard analytical validation criteria with acceptable precision (RSD < 25%) and accuracy within the range of 85–110%.

3.3. Matrix Effect

To account for potential matrix interference, the ME was evaluated by spiking the 16 target PPCP standards into real field samples and assessed the extent of ion suppression or enhancement as well as the sensitivity of each compound to MEs. Three concentration levels (1, 5, and 20 μg/L) were tested. The ME results for each compound are listed in Table 5. At concentrations of 1 and 5 μg/L, notable ion suppression (ME < 85%) was observed for PRX (73.2%), SFX (78.9%), IBF (75.6%), and TCS (61.9%). In contrast, signal enhancement (ME > 115%) was observed for PPN and DCF, with ME values of 136.5 and 120.7%, respectively. Greater suppression was observed at 1 μg/L compared with 5 μg/L for most compounds. At 20 μg/L, all compounds showed ME values ranging from 80.4 to 117.8%, falling within the generally accepted range of 85–115%. The RSD of all measurements remained <15% for all tested concentrations. For compounds affected by matrix-related ion interference, calibration was performed using isotopically labeled surrogates to compensate for signal variability.

3.4. Optimization of Robotic and On-Flow SPE Method

The development of a pretreatment method capable of detecting PPCPs across diverse chemical classes remains a considerable challenge. Therefore, the pretreatment procedure was optimized specifically for 16 target PPCPs, prioritized based on their anticipated occurrence in the environment.
The results applied to the FAOS-SPE system were applied to the offline SPE system and compared. SPE was performed using 500 mL of sample, which had been filtered on-site through a 0.5 μm filter, and concentrated onto an Oasis HLB cartridge to achieve a concentration factor of 500. The 16 target PPCPs were presumed to be weakly basic or acidic, exhibiting a range of physicochemical properties.
The sample pH was adjusted to 3 (using 0.1% (v/v) formic acid), 7 (using deionized water), and 10 (using 0.1% (v/v) ammonium hydroxide), and the recovery rates at each pH were compared to evaluate the effect of pH on extraction efficiency. To minimize the loss of target analytes during SPE pretreatment and maximize recovery, it is essential to control not only the sample pH, but also the pH of the loading and washing solvents.
Figure 2 presents the process efficiency (%) of seven isotopically labeled compounds: ATN-d7, SFA-13C6, TMP-d9, CBZ-d10, DCF-d4, IBF-d3, and SFX-d4, evaluated under six different washing conditions. These conditions included 6 mL of water adjusted to pH 3, 7, and 10 (W3-6, W7-6, and W10-6), and 6 mL of 10% methanol adjusted to the same pH values (M3-6, M7-6, and M10-6). Under the washing conditions using water at pH 3, 7, and 10, most compounds showed the highest efficiency at pH 7. In particular, IBF-d3 exhibited a very high recovery rate (over 60.9%) under pH 7. When washed with 10% MeOH, the efficiency generally decreased compared with water washing. Only DCF-d4 showed a high recovery (58.9%) under the pH 3 condition with 10% MeOH. For TMP-d9 and SFX-d4, the efficiency did not change significantly, even under the 10% MeOH washing conditions. The addition of 10% MeOH led to reduced efficiency in some compounds, and washing with 10% MeOH at pH 10 tended to show the lowest efficiency, indicating it was the least effective condition.
The washing solvent was adjusted to match the sample pH conditions using water with pH values of 3, 7, and 10. The sample pH values were 3, 7, and 10. The water washing volumes (WWV) were varied between 6, 12, and 18 mL, while the elution volumes were adjusted to 6, 9, and 12 mL to evaluate their effects on analyte recovery.
For the SPE recovery test, internal standards were selected based on the pKa values of the target compounds listed in Table 1. Specifically, samples were spiked with internal standards under the following pH conditions: pH 3 for acidic compounds (IBF-d3, DCF-d4, and SFA-13C6), pH 7 for neutral compounds (CBZ-d10 and SFX-d4), and pH 10 for basic compounds (ATN-d7 and TMP-d9). Extraction recovery was calculated based on spiked samples, and the final process efficiency was determined by considering the ME. The extraction results (Figure 3a) show the process efficiency under an elution volume of 6 mL across the three sample pH conditions (pH 3, 7, and 10) and three washing volumes (6, 12, and 18 mL). Figure 3b shows the heatmap visualization used to determine the optimal extraction conditions.
Under pH 3 conditions, ATN-d7, TMP-d9, and SFX-d4 showed poor recoveries (<11%), while DCF-d4 and IBF-d3 exhibited relatively higher recoveries (>80%). However, the process efficiency values for most compounds at pH 3 were generally low, indicating that pH 3 is an inefficient condition. The highest overall recoveries were observed at pH 7, particularly with a washing volume of 12 mL, where compounds such as CBZ-d10, IBF-d3, DCF-d4, SFX-d4, and SFA-13C6 showed process efficiency values ranging from 70 to 84%. Under pH 10, basic compounds like ATN-d7 and TMP-d9 exhibited increased process efficiency values, reaching up to 70.3%. However, most other compounds showed lower recoveries (12.4–41.7%), indicating that this condition is not suitable for all analytes. Among all of the tested conditions, a washing volume of 12 mL consistently yielded the most stable and highest recoveries and is therefore recommended as the optimal washing condition for the ROF-SPE procedure.
Under an optimized washing volume of 12 mL, the elution volume was varied (6, 9, and 12 mL) and tested at pH 3, 7, and 10. The resulting process efficiency data are presented in Figure 4a. At pH 3, the process efficiency values were generally low, ranging from 5.3 to 61.4%. The highest recoveries were observed at an elution volume of 9 mL for IBF-d3 (61.4%) and SFX-d4 (41.4%). Increasing the elution volume beyond 9 mL resulted in only a limited improvement in recovery. At pH 7—with the exception of ATN-d7 and TMP-d9—the process efficiency values ranged from 70.9 to 92.4% with the highest recoveries observed at an elution volume of 12 mL. However, acceptable recoveries were also obtained at 9 mL elution for several compounds including CBZ-d10 (92.4%), DCF-d4 (84.0%), IBF-d3 (84.6%), SFX-d4 (79.0%), and SFA-13C6 (82.9%). These results indicate that even acidic compounds can achieve sufficient recovery under neutral pH conditions when combined with optimal washing and elution settings.
At pH 10, an elution volume of 9 mL yielded high recoveries for basic compounds such as ATN-d7 (85.9%) and TMP-d9 (80.9%) as well as CBZ-d10 (83.1%), suggesting that this condition is favorable for the pretreatment of basic analytes. With the exception of ATN-d7 and SFA-13C6, the process efficiency values obtained with an elution volume of 12 mL were only marginally higher (<2–6%) than those observed with 9 mL (Figure 4b). Considering that such a minor improvement (2–3%) would require additional solvent consumption, which is inefficient from both an economic and environmental perspective, 9 mL was deemed sufficient for elution.
Most target PPCPs, including acidic and neutral compounds, consistently exhibited high and stable process efficiency values at pH 7, whereas some basic compounds such as ATN-d7 and TMP-d9 showed improved recoveries at pH 10. Therefore, the optimal extraction conditions were selected by combining the 9 mL elution volumes at pH 7 and 9, offering a robust and efficient compromise across all classes of analytes. The process efficiency tests verified the quality, consistency, and reliability of the SPE procedure.
A comparative analysis of offline SPE and optimized ROF-SPE conditions was conducted using five replicates. The RSDs of the seven analytes used for process efficiency testing were all within 15% for both methods. The recoveries of all target compounds ranged from 80.7 to 119.9%. The intra- and inter-day precision values, expressed as RSDs, were within 10.6 and 15.6%, respectively.
These satisfactory recovery and precision results demonstrate that the developed online analytical method provides excellent accuracy and reproducibility comparable to those of conventional offline SPE systems.

3.5. Analysis of Real Water Samples

The proposed optimized ROF-SPE extraction method, which involves alternating operation at pH 7 and 10 with a 12 mL water washing step and 9 mL elution, was successfully applied and implemented for on-site monitoring of the tertiary effluent from a wastewater treatment plant. Monitoring results obtained from September 2024 to July 2025 are presented in Figure 5. Figure 5a illustrates the monthly distribution of 16 PPCPs detected in the tertiary effluent from January to December. Most compounds were detected at trace levels (<1.0 µg/L), with intermittent appearances depending on the month.
The detected concentration ranges (μg/L) for the 16 target PPCPs were as follows: ACP (ND–0.1353), ATN (ND–0.0337), PRX (ND–0.5236), IPM (0.0118–0.7914), CFI (ND–0.6870), TMP (ND–0.0068), SFX (ND–0.1094), LCM (ND–0.2524), PPN (ND–0.0406), CBZ (ND–0.1421), NPX (0.0002–0.1325), DCF (0.0188–0.1999), IBF (0.0006–0.1601), and TCS (ND–0.0182). IPM and CFI showed consistent detections throughout the year, with noticeably higher concentrations during the summer months (June to August), while PRX exhibited peaks in early and late periods of the monitoring. Relatively high levels of DCF, LCM, IBF CBZ, and NPX were also detected. SFX, ACP, PPN, and ATN were detected in trace amounts, whereas SFA and RNT were rarely detected.
The seasonal average concentrations were grouped into spring (March–May), summer (June–August), autumn (September–November), and winter (December–February) (Figure 5b). It was operated for more than 30 days in each season. Among the analytes, CFI, PRX, and IPM exhibited relatively higher average concentrations during summer and autumn, with IPM also showing elevated levels in winter.
These seasonal variations likely reflect changes in usage patterns and environmental factors such as rainfall and temperature. This highlights the importance of considering seasonal variability when developing pollutant management strategies because the occurrence and persistence of PPCPs may vary across seasons. Such fluctuations can be effectively monitored using the ROF-SPE-LC-MS/MS system, which enables a rapid and continuous field-based analysis. Compared with conventional offline SPE—which requires ~370 min to run including sample pretreatment—the ROF-SPE system reduced the total processing time to 130 min, resulting in a time reduction of nearly 65%. In addition, during LC-MS/MS analysis, the next sample can be prepared in parallel, allowing for a continuous and efficient analytical workflow.
The ROF-SPE-LC-MS/MS method offers notably greater convenience and efficiency than traditional offline SPE methods, with the added advantage of on-site applicability. The proposed method enabled the ultra-trace quantification (as low as 0.1 ng/L) of 16 PPCPs commonly found in wastewater effluent, making it a valuable tool for effective environmental monitoring.

4. Discussion

This study successfully demonstrated the development and field deployment of a robotic and on-flow solid-phase extraction (ROF-SPE) system coupled with LC–MS/MS for the real-time monitoring of pharmaceuticals and personal care products (PPCPs) in wastewater effluent. The system performed reliably for 12 months under real-world conditions, validating its analytical precision, recovery, and operational stability for continuous field applications.
Conventional offline SPE–LC–MS/MS methods generally require labor-intensive sample preparation, extended analysis time, and chemical preservation steps before laboratory analysis. In contrast, the developed ROF-SPE system automates all processes including sample collection and injection on-site, reducing the total analysis time from approximately 370 min to 80 min (a 78.4% reduction) while maintaining comparable precision (RSD ≤ 15%). Conventional online SPE or passive sampling approaches, such as osmotic pump SPE [58], have been limited to partial automation or long-term accumulation methods, making real-time monitoring impossible and requiring chemical preservation or off-site processing [59,60]. The present system thus provides a distinct advancement by enabling real-time, robotic, on-site sample injection, and direct LC–MS/MS integration, representing a fully autonomous field monitoring solution.
The optimized ROF-SPE method achieved high recovery efficiencies of 72.6–92.4% for most compounds and up to 85.9% for basic analytes such as atenolol and trimethoprim. These results are consistent with those reported in previous studies using advanced systems such as conventional online or automated SPE–LC–MS/MS methods [61,62].
Furthermore, the system achieved a limit of quantification as low as 0.1 ng/L, which aligns with or surpasses the detection capabilities of previously published PPCP monitoring methods in wastewater [62]. This performance demonstrates that full automation and field integration do not compromise analytical sensitivity or reproducibility.
Among the 16 target PPCPs, 14 were consistently detected across seasons including IPM, CFI, PRX, LCM, DCF, IBF, and CBZ. The compounds detected in this study have also been reported at high levels in previous studies, suggesting that the PPCPs identified in domestic effluents are similar to those detected internationally [22,63]. The PPCPs exhibited seasonal variations [64], which are likely attributed to increased pharmaceutical consumption and changes in hydraulic load [63,65].
The complete automation of the pretreatment workflow, which covers sample collection, filtration, pH adjustment, extraction, and injection, marks a significant advancement in field-deployable environmental analysis. This system reduces human error, lowers solvent consumption, and eliminates the need for chemical preservatives, thereby promoting greener analytical practices.
Nonetheless, potential limitations remain including matrix interferences caused by variations in wastewater composition and the requirement for periodic calibration during extended use. Future research should aim to expand the range of target analytes including endocrine-disrupting compounds, pesticides, and both perfluoroalkyl and polyfluoroalkyl substances. Overall, the developed ROF-SPE–LC–MS/MS platform provides a practical and scalable solution for the autonomous monitoring of PPCPs in wastewater. Compared with previously reported online or automated systems, it offers faster analysis, comparable or improved recoveries, and reliable field applicability [40,41]. These results demonstrate that robotic and on-flow integration can bridge the gap between laboratory precision and real-world environmental surveillance, advancing the transition toward fully automated, data-driven water quality monitoring systems.

5. Conclusions

This study developed a fully automated robotic on-flow solid-phase extraction (ROF-SPE) coupled with LC-MS/MS for the real-time, on-site monitoring of pharmaceuticals and personal care products (PPCPs) in wastewater effluent. The system integrates all stages of sample pretreatment, including collection, filtration, concentration, injection, and analysis, into a single automated platform. This approach eliminates manual handling and enables continuous and autonomous operation in the field.
Optimization of the pretreatment conditions showed that applying 12 mL water washing and 9 mL elution at pH 7 resulted in recoveries of 72.6–92.4% for most target compounds (e.g., IBF-d3, DCF-d4, CBZ-d10, SFX-d4, SFA-13C6) with excellent reproducibility (RSD ≤ 15%). Under pH 10 conditions, basic compounds such as ATN-d7 and TMP-d9 achieved recoveries of up to 81.0%, confirming stable extraction performance across acidic, neutral, and basic analytes.
Compared with the conventional offline SPE method, the developed system maintained equivalent precision (RSD ≤ 15%) while reducing the most time-consuming evaporation step to only 20 min. As a result, the total analysis time decreased from approximately 370 min to 80 min (a 78.4% reduction). Moreover, parallel sample preparation during LC–MS/MS analysis allowed up to 18 analyses per day, significantly improving the analytical throughput. This system was capable of quantifying target compounds at concentrations as low as 0.1 ng/L. On-site operation of the ROF-SPE–LC-MS/MS system at a municipal wastewater treatment plant from September 2024 to July 2025 demonstrated its operational stability under real conditions. Among the 16 targeted PPCPs, iopromide (0.0118–0.7914 µg/L), caffeine (≤0.6870 µg/L), and paraxanthine (≤0.5236 µg/L) were detected at the highest concentrations, followed by lincomycin, diclofenac, ibuprofen, and carbamazepine. Seasonal variations revealed higher average concentrations during summer and autumn, likely due to differences in usage patterns and environmental factors such as rainfall and temperature.
These findings demonstrate that the proposed ROF-SPE–LC-MS/MS system offers high accuracy, reproducibility, and robustness for long-term field operation. The technology represents a major step forward in autonomous environmental monitoring and has strong potential for continuous water quality assessment, pollution response, and early warning applications.

Author Contributions

Writing, analysis, methodology, and data curation: S.-H.N.; Analysis and data curation, H.K. and J.L. (Juwon Lee); Analysis, E.K., J.-W.K. and J.P.; Data curation, Y.S.; Funding acquisition, conceptualization, investigation, methodology, J.L. (Jonggul Lee); Project administration, investigation, conceptualization, T.-M.H. All authors have read and agreed to the published version of the manuscript.

Funding

This work was supported by the Korea Environment Industry & Technology Institute (KEITI) through the Project for Developing Innovative Drinking Water and Wastewater Technologies Program, funded by the Korea Ministry of Environment (MOE) (Grant RS-2022-KE002370).

Institutional Review Board Statement

Not applicable.

Informed Consent Statement

Not applicable.

Data Availability Statement

Data are available on request from the corresponding author.

Acknowledgments

The authors would like to thank all of the anonymous reviewers for their assistance in the development and revision of this paper.

Conflicts of Interest

Author Jonggul Lee was employed by the company CentumTech Incorporation. The remaining authors declare that the research was conducted in the absence of any commercial or financial relationships that could be construed as a potential conflict of interest.

References

  1. Kuzmanović, M.; Ginebreda, A.; Petrović, M.; Barceló, D. Risk assessment based prioritization of 200 organic micropollutants in four Iberian rivers. Sci. Total Environ. 2015, 503–504, 289–299. [Google Scholar] [CrossRef]
  2. Nozaki, K.; Tanoue, R.; Kunisue, T.; Tue, N.M.; Fujii, S.; Sudo, N.; Isobe, T.; Nakayama, K.; Sudaryanto, A.; Subramanian, A.; et al. Pharmaceuticals and personal care products (PPCPs) in surface water and fish from three Asian countries: Species-specific bioaccumulation and potential ecological risks. Sci. Total Environ. 2023, 866, 161258. [Google Scholar] [CrossRef]
  3. Xin, X.; Huang, G.; Zhang, B. Review of aquatic toxicity of pharmaceuticals and personal care products to algae. J. Hazard. Mater. 2021, 410, 124619. [Google Scholar] [CrossRef]
  4. Ohoro, C.R.; Adeniji, A.O.; Okoh, A.I.; Okoh, O.O. Distribution and chemical analysis of pharmaceuticals and personal care products (PPCPs) in the environmental systems: A review. Int. J. Environ. Res. Public Health 2019, 16, 3026. [Google Scholar] [CrossRef]
  5. Alzola-Andres, M.; Cerveny, D.; Domingo-Echaburu, S.; Lekube, X.; Ruiz-Sancho, L.; Brodin, T.; Orive, G.; Lertxundi, U. Pharmaceutical residues in stranded dolphins in the Bay of Biscay. Sci. Total Environ. 2024, 912, 168570. [Google Scholar] [CrossRef] [PubMed]
  6. Ebele, A.J.; Abdallah, M.A.E.; Harrad, S. Pharmaceuticals and personal care products (PPCPs) in the freshwater aquatic environment. Emerg. Contam. 2017, 3, 1–16. [Google Scholar] [CrossRef]
  7. Ellis, J.B. Assessing sources and impacts of priority PPCP compounds in urban receiving waters. In Proceedings of the 11th International Conference on Urban Drainage, Edinburgh, UK, 31 August–5 September 2008. [Google Scholar]
  8. Harish, H.; Jegatheesan, V. A review of sources, worldwide legislative measures and the factors influencing the treatment technologies for contaminants of emerging concern (CECs). Curr. Pollut. Rep. 2025, 11, 44. [Google Scholar] [CrossRef]
  9. Jiang, L.; Li, Y.; Chen, Y.; Yao, B.; Chen, X.; Yu, Y.; Yang, J.; Zhou, Y. Pharmaceuticals and personal care products (PPCPs) in the aquatic environment: Biotoxicity, determination and electrochemical treatment. J. Clean. Prod. 2023, 388, 135923. [Google Scholar] [CrossRef]
  10. Doepker, C.; Lieberman, H.R.; Smith, A.P.; Peck, J.D.; El-Sohemy, A.; Welsh, B.T. Caffeine: Friend or foe? Annu. Rev. Food Sci. Technol. 2016, 7, 117–137. [Google Scholar] [CrossRef]
  11. Wang, Z.; Li, X.; Li, Y.; Liu, H.; Lin, C.S.K.; Sun, J.; Wang, Q. Unveiling the occurrence and ecological risks of triclosan in surface water through meta-analysis. Environ. Pollut. 2024, 361, 124901. [Google Scholar] [CrossRef]
  12. Taggart, M.A.; Cuthbert, R.; Das, D.; Sashikumar, C.; Pain, D.J.; Green, R.E.; Feltrer, Y.; Shultz, S.; Cunningham, A.A.; Meharg, A.A. Diclofenac disposition in Indian cow and goat with reference to Gyps vulture population declines. Environ. Pollut. 2007, 147, 60–65. [Google Scholar] [CrossRef] [PubMed]
  13. Jallouli, N.; Elghniji, K.; Hentati, O.; Ribeiro, A.R.; Silva, A.M.T.; Ksibi, M. UV and solar photo-degradation of naproxen: TiO2 catalyst effect, reaction kinetics, products identification and toxicity assessment. J. Hazard. Mater. 2016, 304, 329–336. [Google Scholar] [CrossRef] [PubMed]
  14. Lajin, B.; Schweighofer, N.; Goessler, W.; Obermayer-Pietsch, B. The determination of the paraxanthine/caffeine ratio as a metabolic biomarker for CYP1A2 activity in various human matrices by UHPLC-ESI-MS/MS. Talanta 2021, 234, 122658. [Google Scholar] [CrossRef] [PubMed]
  15. Wu, Y.; Song, S.; Chen, X.; Shi, Y.; Cui, H.; Liu, Y.; Yang, S. Source-specific ecological risks and critical source identification of PPCPs in surface water: Comparing urban and rural areas. Sci. Total Environ. 2023, 854, 158792. [Google Scholar] [CrossRef]
  16. Kumar, R.; Sarmah, A.K.; Padhye, L.P. Fate of pharmaceuticals and personal care products in a wastewater treatment plant with parallel secondary wastewater treatment train. J. Environ. Manag. 2019, 233, 649–659. [Google Scholar] [CrossRef]
  17. Agunbiade, F.O.; Moodley, B. Pharmaceuticals as emerging organic contaminants in Umgeni River water system, KwaZulu-Natal, South Africa. Environ. Monit. Assess. 2014, 186, 7273–7291. [Google Scholar] [CrossRef]
  18. Carmona, E.; Andreu, V.; Picó, Y. Occurrence of acidic pharmaceuticals and personal care products in Turia River Basin: From waste to drinking water. Sci. Total Environ. 2014, 484, 53–63. [Google Scholar] [CrossRef]
  19. Deo, R.P. Pharmaceuticals in the surface water of the USA: A review. Curr. Environ. Health Rep. 2014, 1, 113–122. [Google Scholar] [CrossRef]
  20. Liu, W.R.; Zhao, J.L.; Liu, Y.S.; Chen, Z.F.; Yang, Y.Y.; Zhang, Q.Q.; Ying, G.G. Biocides in the Yangtze River of China: Spatiotemporal distribution, mass load and risk assessment. Environ. Pollut. 2015, 200, 53–63. [Google Scholar] [CrossRef]
  21. De Jongh, C.M.; Kooij, P.J.F.; de Voogt, P.; ter Laak, T.L. Screening and human health risk assessment of pharmaceuticals and their transformation products in Dutch surface waters and drinking water. Sci. Total Environ. 2012, 427–428, 70–77. [Google Scholar] [CrossRef]
  22. Pai, C.W.; Leong, D.; Chen, C.Y.; Wang, G.S. Occurrences of pharmaceuticals and personal care products in the drinking water of Taiwan and their removal in conventional water treatment processes. Chemosphere 2020, 256, 127002. [Google Scholar] [CrossRef]
  23. Papagiannaki, D.; Morgillo, S.; Bocina, G.; Calza, P.; Binetti, R. Occurrence and human health risk assessment of pharmaceuticals and hormones in drinking water sources in the metropolitan area of Turin in Italy. Toxics 2021, 9, 88. [Google Scholar] [CrossRef]
  24. Vulliet, E.; Cren-Olivé, C.; Grenier-Loustalot, M.F. Occurrence of pharmaceuticals and hormones in drinking water treated from surface waters. Environ. Chem. Lett. 2011, 9, 103–114. [Google Scholar] [CrossRef]
  25. Schultz, M.M.; Furlong, E.T.; Kolpin, D.W.; Werner, S.L.; Schoenfuss, H.L.; Barber, L.B.; Blazer, V.S.; Norris, D.O.; Vajda, A.M. Antidepressant pharmaceuticals in two U.S. effluent-impacted streams: Occurrence and fate in water and sediment, and selective uptake in fish neural tissue. Environ. Sci. Technol. 2010, 44, 1918–1925. [Google Scholar] [CrossRef]
  26. Wu, J.L.; Liu, Z.H.; Ma, Q.G.; Dai, L.; Dang, Z. Occurrence, removal and risk evaluation of ibuprofen and acetaminophen in municipal wastewater treatment plants: A critical review. Sci. Total Environ. 2023, 891, 164600. [Google Scholar] [CrossRef] [PubMed]
  27. Gibson, R.; Durán-Álvarez, J.C.; León Estrada, K.; Chávez, A.; Cisneros, B.J. Accumulation and leaching potential of some pharmaceuticals and potential endocrine disruptors in soils irrigated with wastewater in the Tula Valley, Mexico. Chemosphere 2010, 81, 1437–1445. [Google Scholar] [CrossRef] [PubMed]
  28. Ma, R.; Wang, B.; Lu, S.; Zhang, Y.; Yin, L.; Huang, J.; Deng, S.; Wang, Y.; Yu, G. Characterization of pharmaceutically active compounds in Dongting Lake, China: Occurrence, chiral profiling and environmental risk. Sci. Total Environ. 2016, 557–558, 268–275. [Google Scholar] [CrossRef] [PubMed]
  29. Liu, J.; Wang, R.; Huang, B.; Lin, C.; Wang, Y.; Pan, X. Distribution and bioaccumulation of steroidal and phenolic endocrine disrupting chemicals in wild fish species from Dianchi Lake, China. Environ. Pollut. 2011, 159, 2815–2822. [Google Scholar] [CrossRef]
  30. Yuan, S.F.; Liu, Z.H.; Huang, R.P.; Yin, H.; Dang, Z. Occurrence, fate, and mass balance of selected pharmaceutical and personal care products (PPCPs) in an urbanized river. Sci. Total Environ. 2020, 727, 138706. [Google Scholar] [CrossRef]
  31. Huang, C.L.; Ma, H.W.; Yu, C.P. Substance flow analysis and assessment of environmental exposure potential for triclosan in mainland China. Sci. Total Environ. 2014, 499, 265–275. [Google Scholar] [CrossRef]
  32. Sim, W.J.; Lee, J.W.; Oh, J.E. Occurrence and fate of pharmaceuticals in wastewater treatment plants and rivers in Korea. Environ. Pollut. 2010, 158, 1938–1947. [Google Scholar] [CrossRef] [PubMed]
  33. Son, D.J.; Kim, C.S.; Lee, J.H.; Yoon, J.K.; Lee, S.H.; Jeong, D.H. Occurrence assessment of pharmaceuticals in various sewage treatment plants and effluent-receiving streams in Korea. Water 2023, 15, 3897. [Google Scholar] [CrossRef]
  34. Harbi, K.; Makridis, P.; Koukoumis, C.; Papadionysiou, M.; Vgenis, T.; Kornaros, M.; Ntaikou, I.; Giokas, S.; Dailianis, S. Evaluation of a battery of marine species-based bioassays against raw and treated municipal wastewaters. J. Hazard. Mater. 2017, 321, 537–546. [Google Scholar] [CrossRef]
  35. Yu, X.; Sui, Q.; Lyu, S.; Zhao, W.; Liu, J.; Cai, Z.; Yu, G.; Barcelo, D. Municipal solid waste landfills: An underestimated source of pharmaceutical and personal care products in the water environment. Environ. Sci. Technol. 2020, 54, 9757–9768. [Google Scholar] [CrossRef]
  36. Guedes-Alonso, R.; Sosa-Ferrera, Z.; Santana-Rodríguez, J.J. An on-line solid phase extraction method coupled with UHPLC-MS/MS for the determination of steroid hormone compounds in treated water samples from wastewater treatment plants. Anal. Methods 2015, 7, 5996–6005. [Google Scholar] [CrossRef]
  37. Kubo, T.; Kuroda, K.; Tominaga, Y.; Naito, T.; Sueyoshi, K.; Hosoya, K.; Otsuka, K. Effective determination of a pharmaceutical, sulpiride, in river water using online solid-phase extraction coupled with high-performance liquid chromatography–tandem mass spectrometry. J. Pharm. Biomed. Anal. 2014, 89, 111–117. [Google Scholar] [CrossRef]
  38. Qu, L.; Fan, Y.; Wang, W.; Ma, K.; Yin, Z. Development, validation and clinical application of an online-SPE-LC-HRMS/MS for simultaneous quantification of phenobarbital, phenytoin, carbamazepine, and its active metabolite carbamazepine 10,11-epoxide. Talanta 2016, 158, 77–88. [Google Scholar] [CrossRef]
  39. Shao, B.; Chen, D.; Zhang, J.; Wu, Y.; Sun, C. Determination of 76 pharmaceutical drugs by liquid chromatography–tandem mass spectrometry in slaughterhouse wastewater. J. Chromatogr. A 2009, 1216, 8312–8318. [Google Scholar] [CrossRef]
  40. Xao, X.; Jinfeng, G.; Hu, Q.; Ma, J.; Yuan, D.; Fu, X.; Qi, Y.; Volmer, D.A. An advanced LC–MS/MS protocol for simultaneous detection of pharmaceuticals and personal care products in the environment. Rapid Commun. Mass Spectrom. 2022, 37, e9397. [Google Scholar] [CrossRef]
  41. Belay, M.H.; Precht, U.; Mortensen, P.; Marengo, E.; Robotti, E. A fully automated online SPE-LC-MS/MS method for the determination of 10 pharmaceuticals in wastewater samples. Toxics 2022, 10, 103. [Google Scholar] [CrossRef]
  42. Chen, L.; Yan, X.; Zhou, X.; Peng, P.; Sun, Q.; Zhao, F. Advances in the on-line solid-phase extraction-liquid chromatography-mass spectrometry analysis of emerging organic contaminants. TrAC Trends Anal. Chem. 2023, 160, 116976. [Google Scholar] [CrossRef]
  43. Liang, Y.; Liu, J.; Zhong, Q.; Yu, D.; Yao, J.; Huang, T.; Zhu, M.; Zhou, T. A fully automatic cross-used solid-phase extraction online coupled with ultra-high performance liquid chromatography–tandem mass spectrometry system for the trace analysis of multi-class pharmaceuticals in water samples. J. Pharm. Biomed. Anal. 2019, 174, 330–339. [Google Scholar] [CrossRef] [PubMed]
  44. Marasco Junior, C.A.; da Silva, B.F.; Lamarca, R.S. Automated method to determine pharmaceutical compounds in wastewater using on-line solid-phase extraction coupled to LC-MS/MS. Anal. Bioanal. Chem. 2021, 413, 5147–5160. [Google Scholar] [CrossRef] [PubMed]
  45. Senta, I.; Rodríguez-Mozaz, S.; Corominas, L.; Covaci, A.; Petrovic, M. Applicability of an on-line solid-phase extraction liquid chromatography–tandem mass spectrometry for the wastewater-based assessment of human exposure to chemicals from personal care and household products. Sci. Total Environ. 2022, 845, 157309. [Google Scholar] [CrossRef]
  46. Medina, D.A.V.; Maciel, E.V.S.; Lanças, E.M. Modern automated sample preparation for the determination of organic compounds: A review on robotic and on-flow systems. TrAC Trends Anal. Chem. 2023, 166, 117171. [Google Scholar] [CrossRef]
  47. De Alwis, H.; Heller, D.H. Multiclass, multiresidue method for the detection of antibiotic residues in distillers grains by liquid chromatography and ion trap tandem mass spectrometry. J. Chromatogr. A 2010, 1217, 3046–3084. [Google Scholar] [CrossRef]
  48. Paíga, P.; Santos, L.H.M.L.M.; Delerue-Matos, C. Development of a multi-residue method for the determination of human and veterinary pharmaceuticals and some of their metabolites in aqueous environmental matrices by SPE-UHPLC-MS/MS. J. Pharm. Biomed. Anal. 2017, 135, 75–86. [Google Scholar] [CrossRef]
  49. Nefau, T.; Karolak, S.; Castillo, L.; Boireau, V.; Levi, Y. Presence of illicit drugs and metabolites in influents and effluents of 25 sewage water treatment plants and map of drug consumption in France. Sci. Total Environ. 2013, 461–462, 712–722. [Google Scholar] [CrossRef]
  50. Senta, I.; Krizman, I.; Ahel, M.; Terzic, S. Multiresidual analysis of emerging amphetamine-like psychoactive substances in wastewater and river water. J. Chromatogr. A 2015, 1425, 204–212. [Google Scholar] [CrossRef]
  51. Sadutto, D.; Picó, Y. Sample preparation to determine pharmaceutical and personal care products in an all-water matrix: Solid phase extraction. Molecules 2020, 25, 5204. [Google Scholar] [CrossRef]
  52. Furey, A.; Moriarty, M.; Bane, V.; Kinsella, B.; Lehane, M. Ion suppression: A critical review on causes, evaluation, prevention and applications. Talanta 2013, 115, 104–122. [Google Scholar] [CrossRef]
  53. Senekowitsch, S.; Freitag, T.; Dubinski, D.; Freiman, T.M.; Maletzki, C.; Hinz, B. Validation of an LC-MS/MS method for the simultaneous intracellular quantification of the CDK4/6 inhibitor abemaciclib and the EZH2 inhibitors GSK126 and tazemetostat. Pharmaceutics 2025, 17, 433. [Google Scholar] [CrossRef]
  54. Raposo, F.; Barceló, D. Challenges and strategies of matrix effects using chromatography-mass spectrometry: An overview from research versus regulatory viewpoints. Trends Anal. Chem. 2021, 134, 116068. [Google Scholar] [CrossRef]
  55. Boras, J.A.; Vaqué, D.; Maynou, F.; Sà, E.L.; Weinbauer, M.G.; Sala, M.M. Factors shaping bacterial phylogenetic and functional diversity in coastal waters of the NW Mediterranean Sea. Estuar. Coast. Shelf Sci. 2015, 154, 102–110. [Google Scholar] [CrossRef]
  56. Awfa, D.; Ateia, M.; Fujii, M.; Johnson, M.S.; Yoshimura, C. Photodegradation of pharmaceuticals and personal care products in water treatment using carbonaceous–TiO2 composites: A critical review of recent literature. Water Res. 2018, 142, 26–45. [Google Scholar] [CrossRef]
  57. Sadutto, D.; Andreu, V.; Ilo, T.; Akkanen, J.; Picó, Y. Pharmaceuticals and personal care products in a Mediterranean coastal wetland: Impact of anthropogenic and spatial factors and environmental risk assessment. Environ. Pollut. 2021, 271, 116353. [Google Scholar] [CrossRef]
  58. Xiao, J.; Chen, T.; Zeng, Q.; Pei, J.; Li, Q.; Lin, K.; Sun, Q. Application of osmotic pump coupled solid phase extraction samplers for the on-site sampling and enrichment of pharmaceuticals and personal care products in wastewater treatment plants. Environ. Technol. Innov. 2024, 36, 103869. [Google Scholar] [CrossRef]
  59. Li, W.L.; Zhang, Z.F.; Sparham, C.; Li, Y.F. Validation of sampling techniques and SPE-UPLC/MS/MS for home and personal care chemicals in the Songhua Catchment, Northeast China. Sci. Total Environ. 2020, 707, 136038. [Google Scholar] [CrossRef]
  60. Wang, Y.; Yang, Q.; Zhang, H.; Wang, Z.; Wu, A.; Luo, Y.; Zhou, Q. For the occurrence of PPCPs from source to tap: A novel approach modified in terms of sample preservation and SPE cartridge to monitor PPCPs in our water supply. Anal. Chim. Acta 2024, 1308, 342662. [Google Scholar] [CrossRef]
  61. Nannou, C.; Efthymiou, C.; Boti, V.; Albanis, T. Unveiling the pharmaceutical footprint in freshwater and seawater: HRMS method optimization, validation, and uncertainty estimation. Microchem. J. 2025, 210, 112933. [Google Scholar] [CrossRef]
  62. Papageorgiou, M.; Zioris, I.; Danis, T.; Bikiaris, D.; Lambropoulou, D. Comprehensive investigation of a wide range of pharmaceuticals and personal care products in urban and hospital wastewaters in Greece. Sci. Total Environ. 2019, 694, 133565. [Google Scholar] [CrossRef]
  63. Folorunsho, O.; Bogush, A.; Kourtchev, I. Occurrence of emerging and persistent organic pollutants in the rivers Cam, Ouse and Thames, UK. Sci. Total Environ. 2025, 962, 178436. [Google Scholar] [CrossRef]
  64. Löher, F.; Palma, W.-U.; Schaffer, M.; Olsson, O. Concentrations and sources of methylxanthines in a Northern German river system. Sci. Total Environ. 2021, 775, 145898. [Google Scholar] [CrossRef]
  65. Wang, Y.; Li, Y.; Hu, A.; Rashid, A.; Ashfaq, M.; Wang, Y.; Wang, H.; Luo, H.; Yu, C.P.; Sun, Q. Monitoring, mass balance and fate of pharmaceuticals and personal care products in seven wastewater treatment plants in Xiamen City, China. J. Hazard. Mater. 2018, 354, 81–90. [Google Scholar] [CrossRef]
Figure 1. Schematic diagram of the robotic and on-flow SPE coupled with liquid chromatography-tandem mass spectrometry; (a) process flowchart, (b) SPE conceptual design and fabricated SPE device, and (c) 2-position, 6-port valve.
Toxics 13 00899 g001
Figure 2. Process efficiency (%) of seven isotopically labeled compounds under six washing conditions using water and 10% methanol at pH 3, 7, and 10.
Toxics 13 00899 g002
Figure 3. Results of extraction using the internal standard: (a) Process efficiency (PE) results under the elution 6 mL condition, varying by pH (3, 7, and 10) and water washing volumes (6, 12, and 18 mL). (b) Heatmap visualization to identify optimal SPE conditions based on compound-specific PE.
Toxics 13 00899 g003
Figure 4. Optimization results of extraction using internal standard. (a) Process efficiency (PE) results under the washing 12 mL condition, varying by pH (3, 7, and 10) and elution volumes (6, 9, and 12 mL). (b) Heatmap visualization to identify optimal SPE conditions based on compound-specific PE.
Toxics 13 00899 g004
Figure 5. Concentrations of 16 target PPCPs in wastewater effluent analyzed using the robot and of-flow SPE–LC–MS/MS system: (a) variation in concentrations across the monitoring period; (b) seasonal variation. “ND” indicates not detected.
Toxics 13 00899 g005
Table 1. Physico-chemical properties of the 16 target pharmaceuticals and personal care products.
CompoundsAbbreviationpKaLog KowPv (mmHg)MWMolecular Formula
AcetaminophenACP9.380.467 × 10−6151.17C8H9NO2
AtenololATN9.60.162.924 × 10−10266.34C14H22N2O3
RanitidineRNT8.20.271.2 × 10−7314.41C13H22N4O3S
ParaxanthinePRX0.9−0.077.6 × 10−5180.16C7H8N4O2
IopromideIPM8.4−3.11.4 × 10−20791.1C18H24I3N3O8
CaffeineCFI14−0.072.5 × 10−3194.19C8H10N4O2
SulfamethazineSFA7.40.145.2 × 10−8264.30C11H12N4O2S
TrimethoprimTMP7.120.919.88 × 10−9290.32C14H18N4O3
SulfamethoxazoleSFX6.00.896.93 × 10−8253.28C10H11N3O3S
LincomycinLCM7.60.292.7 × 10−20406.54C18H34N2O6S
PropranololPPN9.53.481.7 × 10−5259.80C16H21NO2
CarbamazepineCBZ72.471.84 × 10−7236.27C15H12N2O
NaproxenNPX4.153.181.892 × 10−6230.27C14H14O3
DiclofenacDCF4.144.516.14 × 10−8296.16C14H10Cl2NO2
IbuprofenIBF4.913.971.162 × 10−11206.23C13H18O2
TriclosanTCS7.94.764.0 × 10−6444.44C22H24N2O8
Table 2. Water quality in the study area.
ItemValue
pH6.8 ± 0.2
Turbidity (NTU)0.54 ± 0.34
TDS (mg/L)325 ± 105
TOC (mg/L)5.2 ± 1.7
UV254 (cm−1)0.088 ± 0.020
BOD5 (mg/L)1.8 ± 0.5
T-N (mg/L)14.12 ± 3.40
T-P (mg/L)0.169 ± 0.080
Table 3. Summary of MS/MS conditions for the target compound analysis.
CompoundsPrecursor
Ion (m/z)
Product
Ion (m/z)
RT (min)Collision
Energy (eV)
Acetaminophen152 [M + H]+652.2810
Atenolol267 [M + H]+1162.0430
Ranitidine315 [M + H]+1762.0530
Paraxanthine180 [M + H]+1492.5824
Iopromide791 [M + H]+7742.4550
Caffeine195 [M + H]+833.1720
Sulfamethazine279 [M + H]+1243.2230
Trimethoprim291 [M + H]+1232.8720
Sulfamethoxazole254 [M + H]+923.6110
Lincomycin407 [M + H]+1262.8930
Propranolol206 [M + H]+1165.1920
Carbamazepine237 [M + H]+1796.3120
Naproxen231 [M − H]1417.4110
Diclofenac296 [M − H]2138.495
Ibuprofen205 [M − H]1618.6620
Triclosan288 [M − H]352.8720
Acetaminophen-d4156 [M + H]+1142.3410
Atenolol-d7247 [M + H]+1452.0730
Ranitidine-d6343 [M + H]+2072.0320
Paraxanthine-d3183 [M + H]+1242.5230
Iopromide-d3792 [M + H]+6032.3250
Caffeine-d9207 [M + H]+1503.1220
Trimethoprim-d9300 [M − H]+1232.8310
Sulfamethoxazole-d4259 [M − H]+973.5710
Lincomycin-d3408 [M − H]+1262.8830
Propranolol-d7268 [M + H]+1165.1720
Carbamazepine-d10247 [M − H]+2016.2430
Naproxen-d4233 [M − H]1897.4710
Diclofenac-d4298 [M − H]2548.4210
Ibuprofen-d3208 [M − H]1648.595
Triclosan-d3290 [M − H]352.8820
Sulfamethazine-13C6162 [M − H]+983.5830
Table 4. Linearity, limits of method detection (MDLs), and quantification (MQLs) of the LC-MS/MS method.
CompoundsISLinear Range (μg/L)MDL
(ng/L)
MQL (ng/L)RSD (%)
(n = 5)
Accuracy (%)
AcetaminophenAcetaminophen-d40.01–1002.88.97.485.3
AtenololAtenolol-d70.05–1005.620.711.285.5
RanitidineRanitidine-d60.05–1007.825.54.487.7
ParaxanthineParaxanthine-d30.5–100103.4328.93.399.5
IopromideIopromide-d31–1004.559.45.795.8
CaffeineCaffeine-d90.05–1007.224.19.386.3
SulfamethazineSulfamethazine-13C60.01–1004.73.88.995.4
TrimethoprimTrimethoprim-d90.05–1003.411.415.495.7
SulfamethoxazoleSulfamethoxazole-d40.01–1003.43.65.0104.9
LincomycinLincomycin-d30.02–1004.411.49.485.8
PropranololPropranolol-d70.01–1003.43.612.092.9
CarbamazepineCarbamazepine-d100.05–1003.411.48.188.2
NaproxenNaproxen-d30.02–1002.58.46.5100.6
DiclofenacDiclofenac-d40.02–1002.58.48.595.1
IbuprofenIbuprofen-d30.1–10016.254.06.597.6
TriclosanTriclosan-d30.05–1007.825.95.486.4
Table 5. Matrix effect of 16 PPCPs.
CompoundsMatrix Effect
1 (μg/L)5 (μg/L)20 (μg/L)
Mean (%)RSD (%)Mean (%)RSD (%)Mean (%)RSD (%)
Acetaminophen82.49.284.9 7.4103.5 5.2
Atenolol103.114.1106.3 12.1112.7 9.8
Ranitidine87.29.289.9 9.4114.6 5.4
Paraxanthine69.55.473.2 3.487.5 3.4
Iopromide110.76.7114.1 5.788.6 5
Caffeine109.56.36112.9 5.6112.8 5.6
Sulfamethazine89.36.792.1 6113.8 5.8
Trimethoprim97.45.5104.4 4.5112.9 3.5
Sulfamethoxazole758.978.9 5.684.7 5.1
Lincomycin85.97.586.5 6.9104.6 5.3
Propranolol132.66.4136.5 5.4113.7 4.2
Carbamazepine92.16.995.1 6.2110.5 3.2
Naproxen93.76.896.6 6.5102.8 3.2
Diclofenac121.38.3120.7 6.3112.3 3.3
Ibuprofen71.810.475.6 8.480.4 6.9
Triclosan58.88.961.9 5.497.9 6.5
Disclaimer/Publisher’s Note: The statements, opinions and data contained in all publications are solely those of the individual author(s) and contributor(s) and not of MDPI and/or the editor(s). MDPI and/or the editor(s) disclaim responsibility for any injury to people or property resulting from any ideas, methods, instructions or products referred to in the content.

