
The Characteristics of Adsorption of Di-n-Butyl Phthalate by Surface Sediment from the Three Gorges Reservoir

Abstract
1. Introduction
2. Materials and Methods
2.1. Chemicals and Materials
2.2. Characterization of Surface Sediment
2.3. Adsorption Experiments
2.3.1. Adsorption Kinetics
2.3.2. Adsorption Isotherm
2.3.3. Influence of Sediment Characteristics on Adsorption Isotherm
Sediment Content
Sediment Particle Size
2.4. Determination of DBP
3. Results and Discussion
3.1. Characterization of Sediment
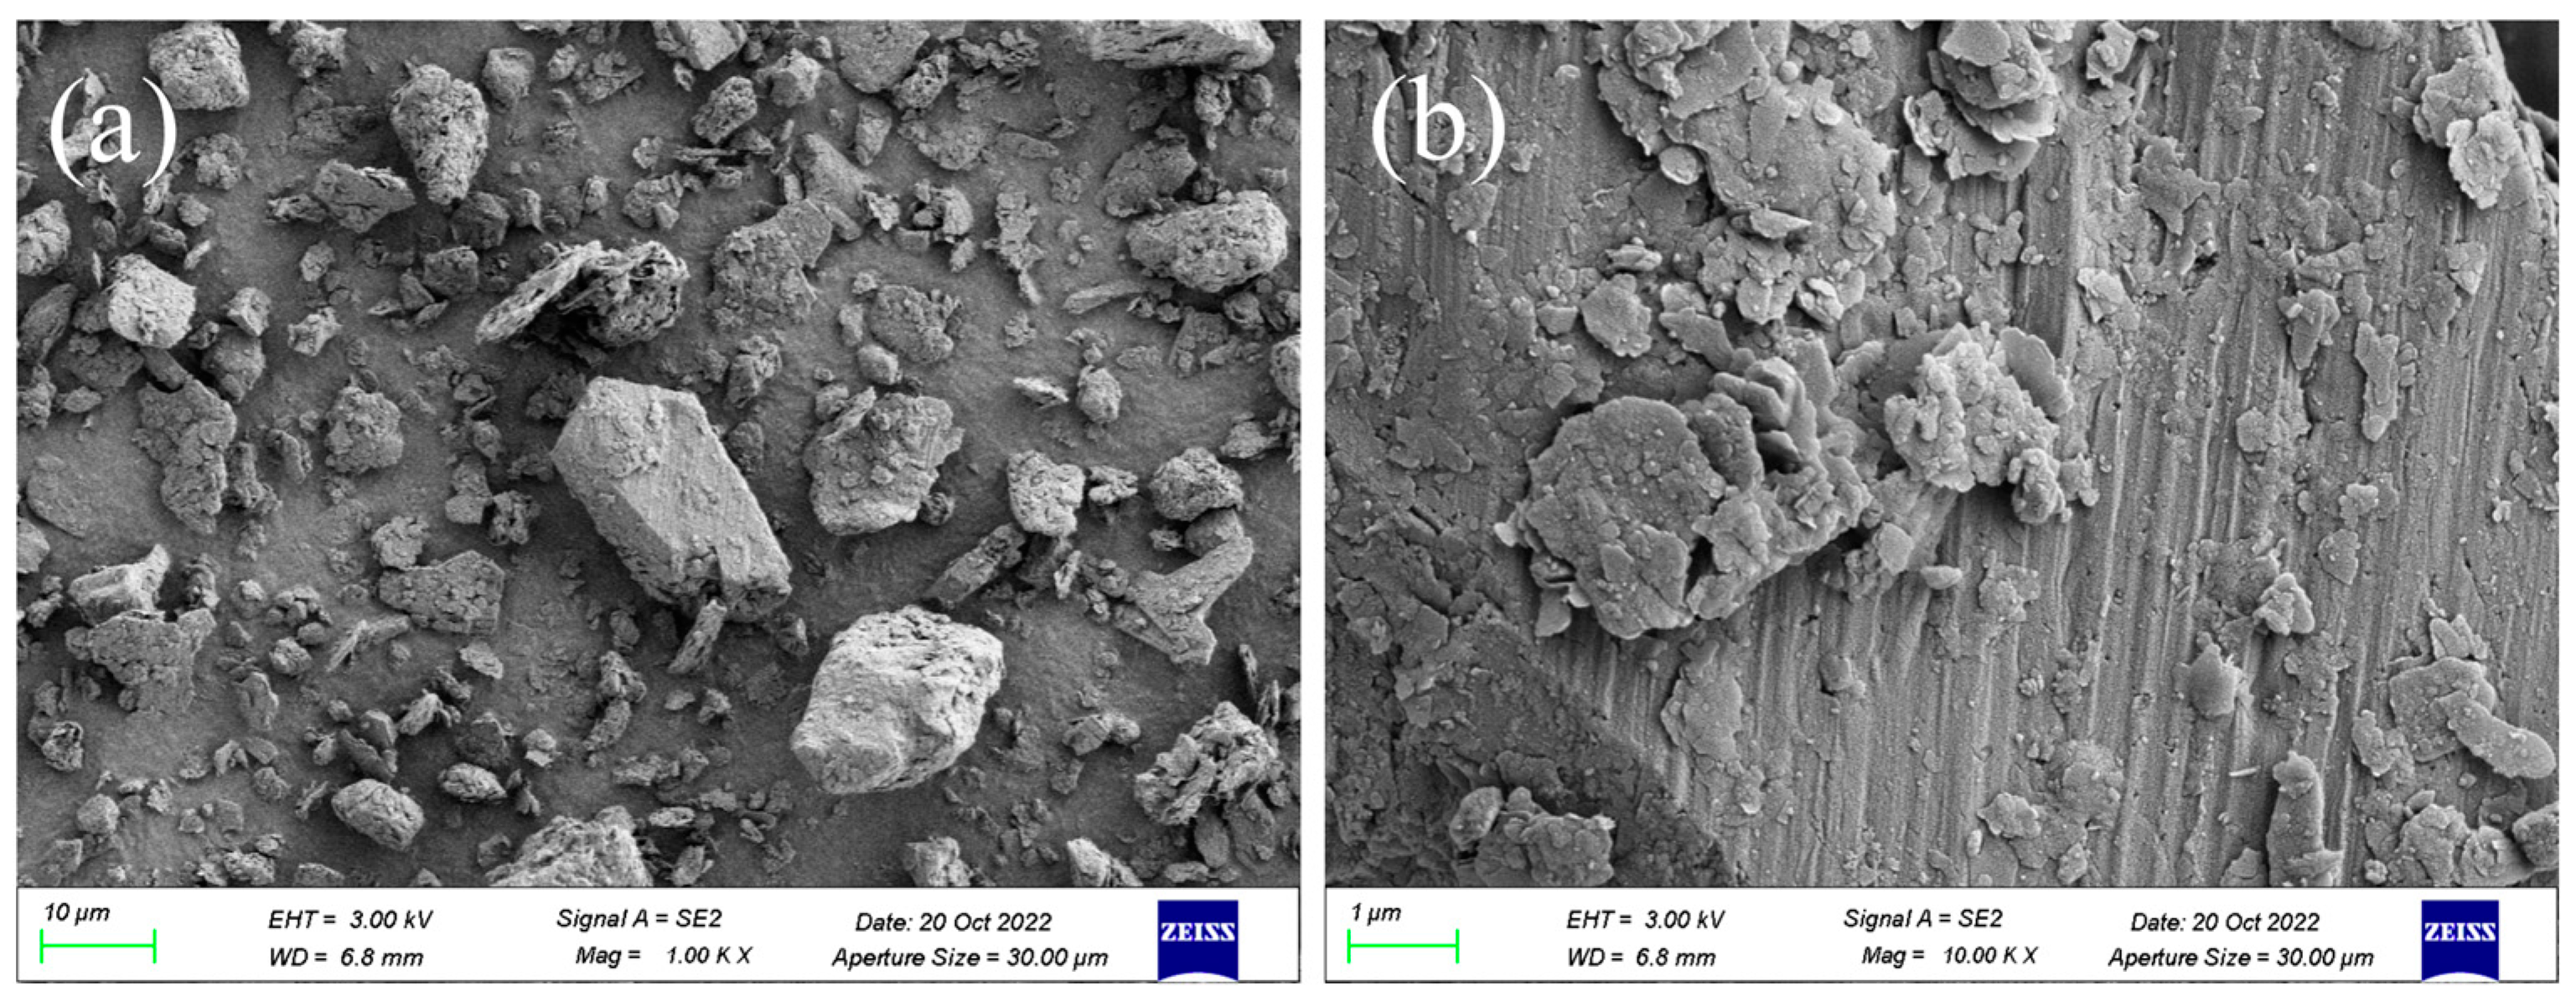
3.1.1. SEM Analysis
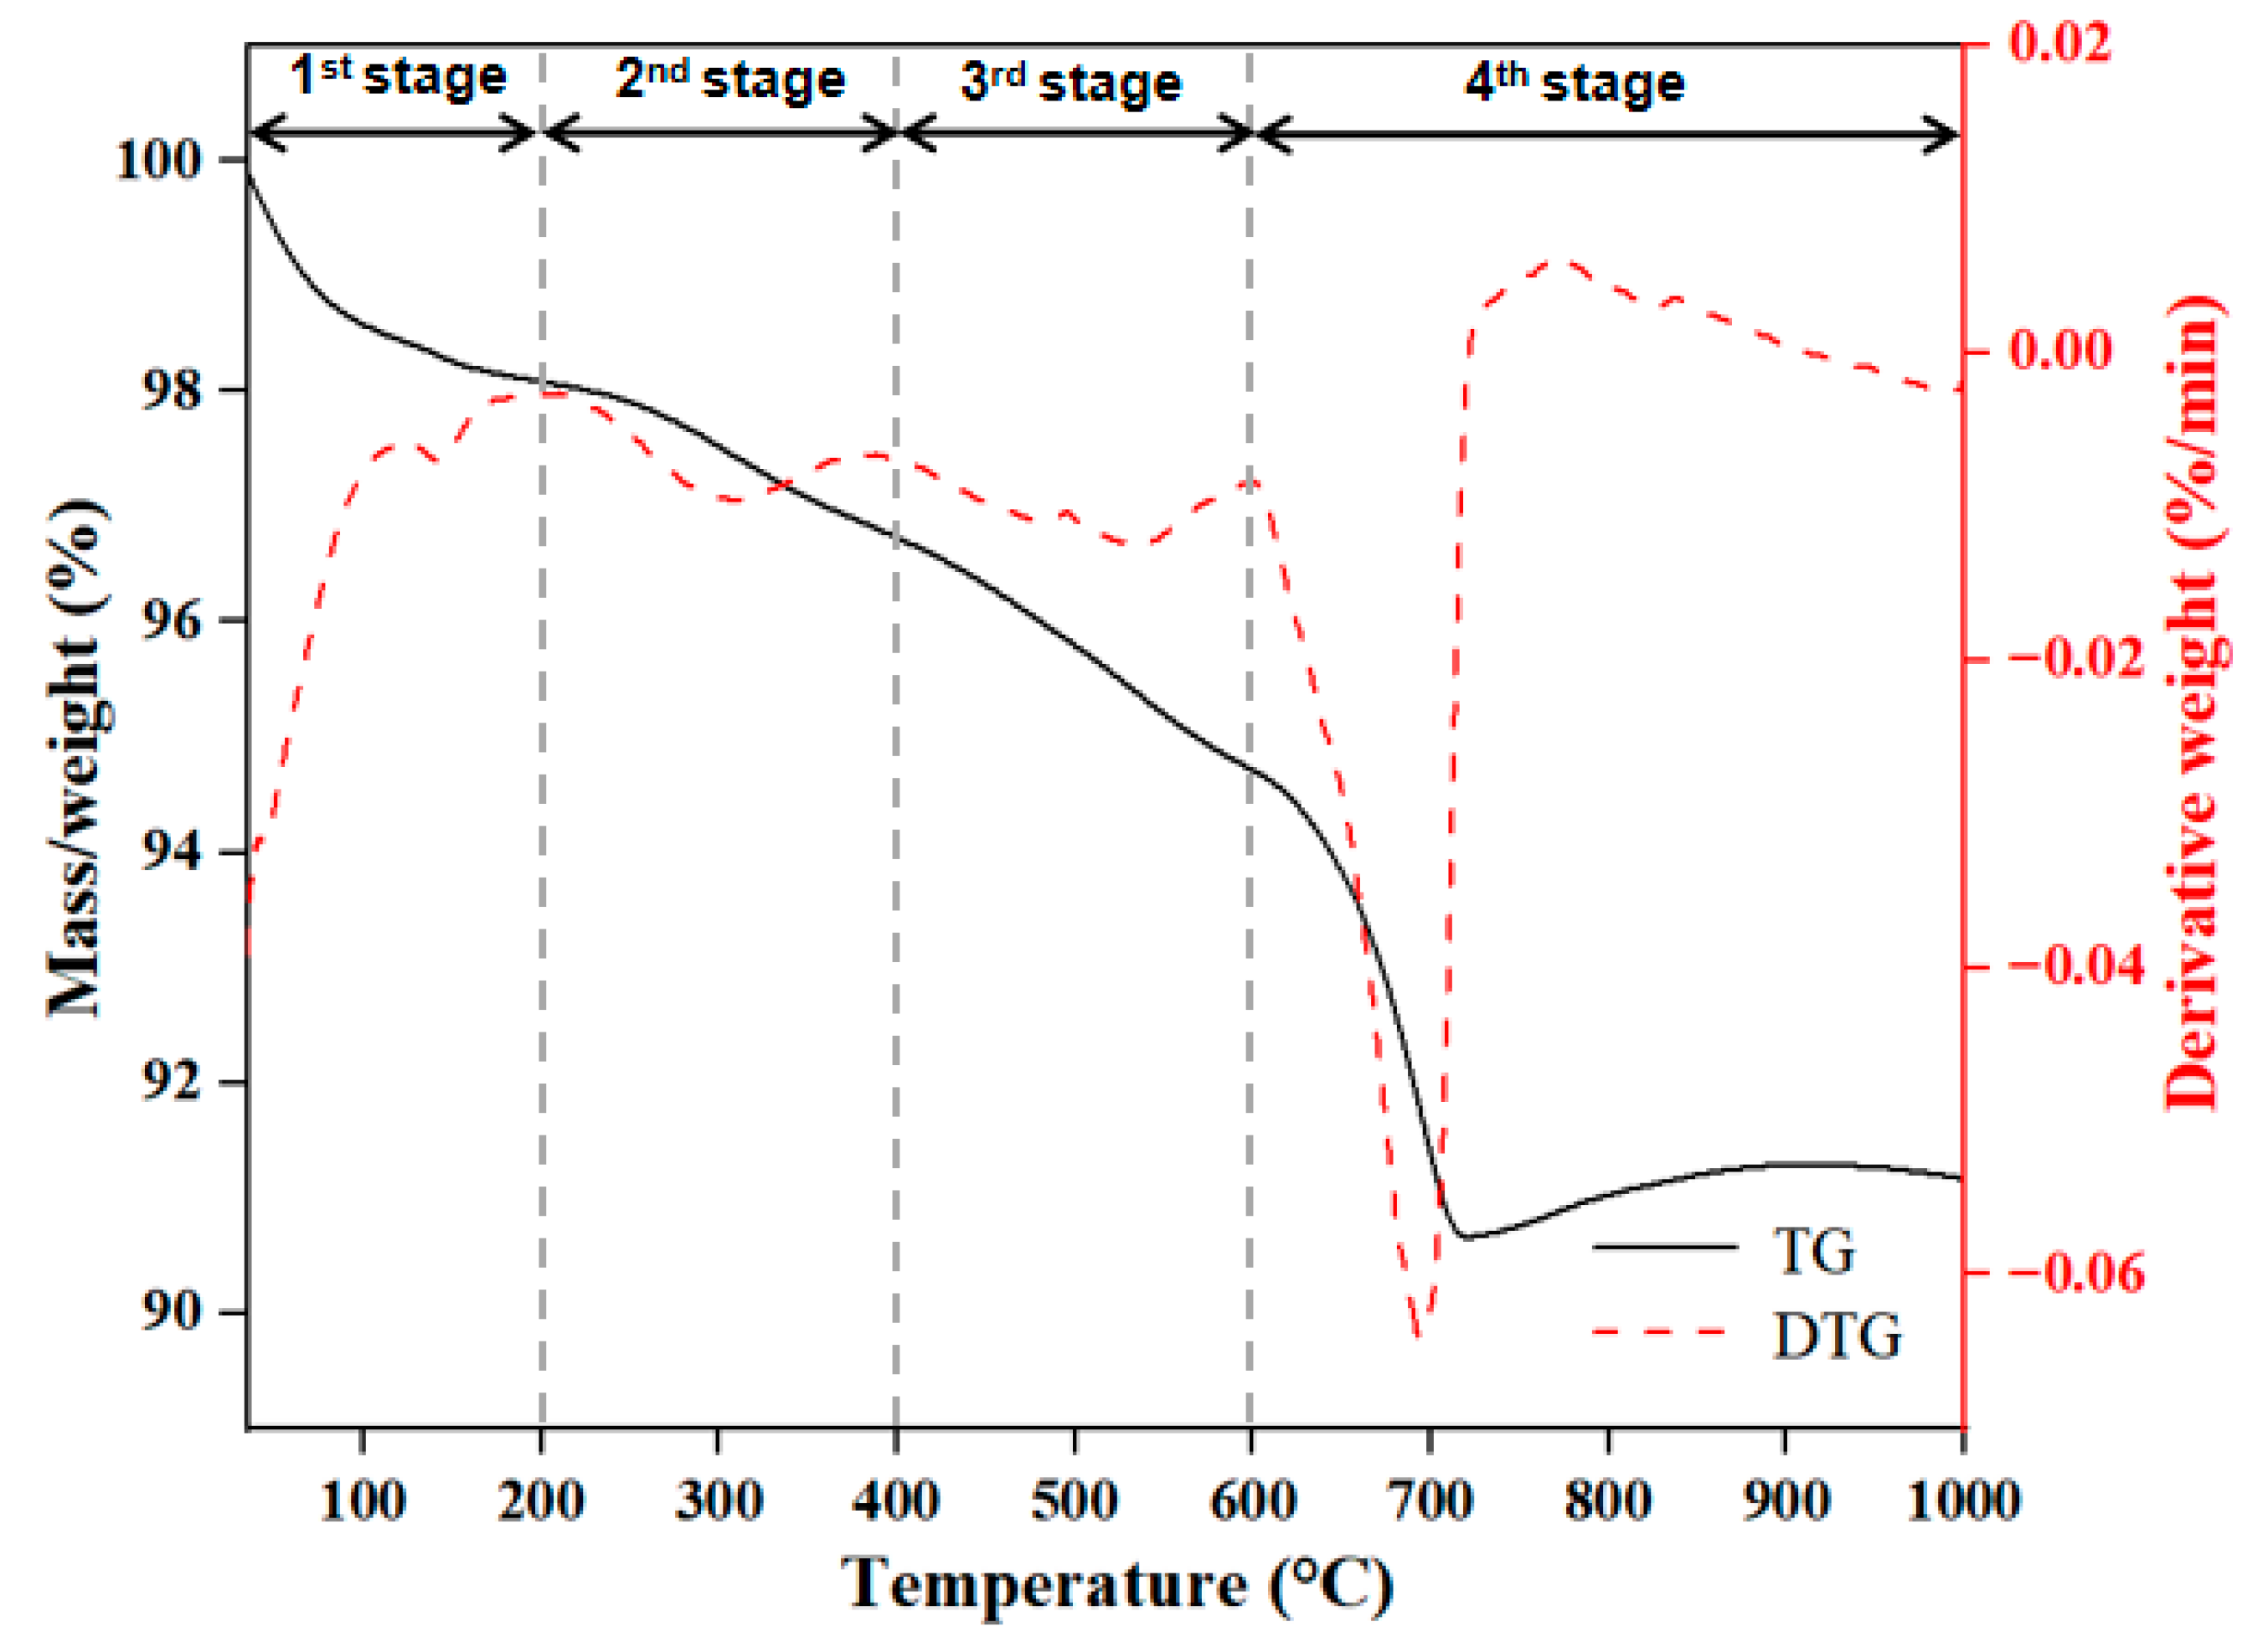
3.1.2. TGA Analysis
3.1.3. FTIR Analysis
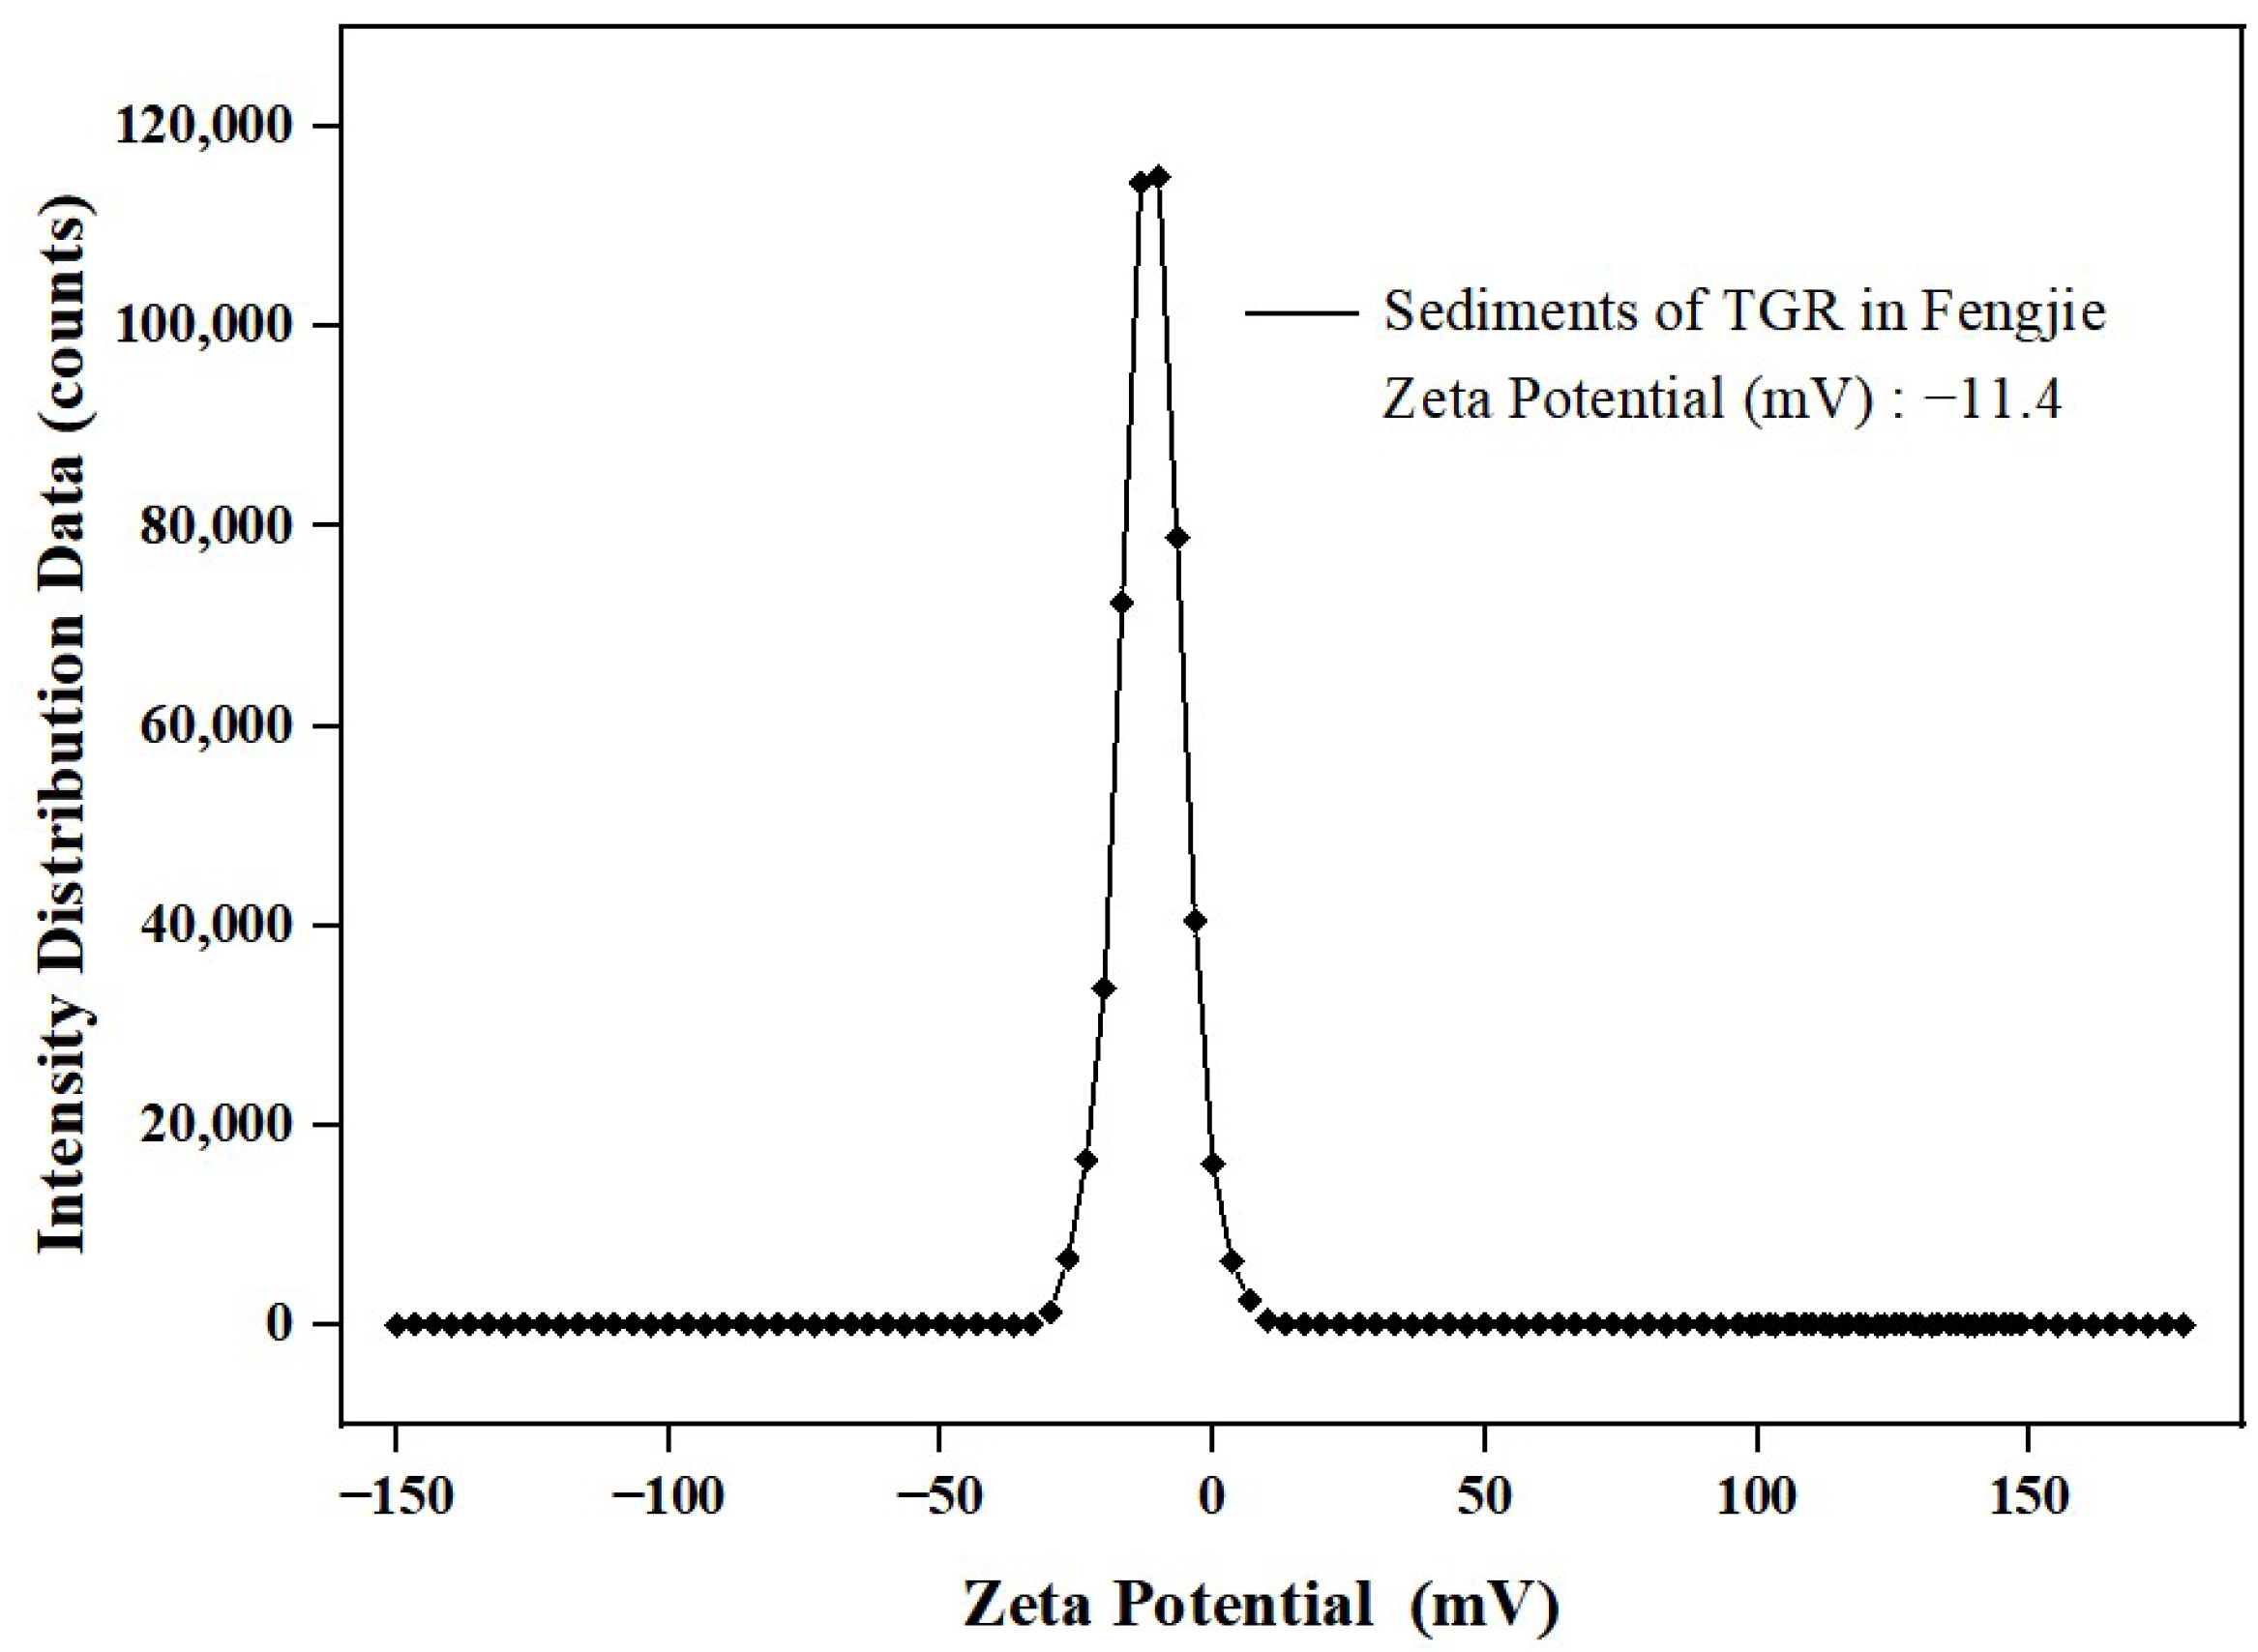
3.1.4. Zeta Potential Analysis
3.2. Adsorption Kinetics
3.3. Adsorption Isotherm
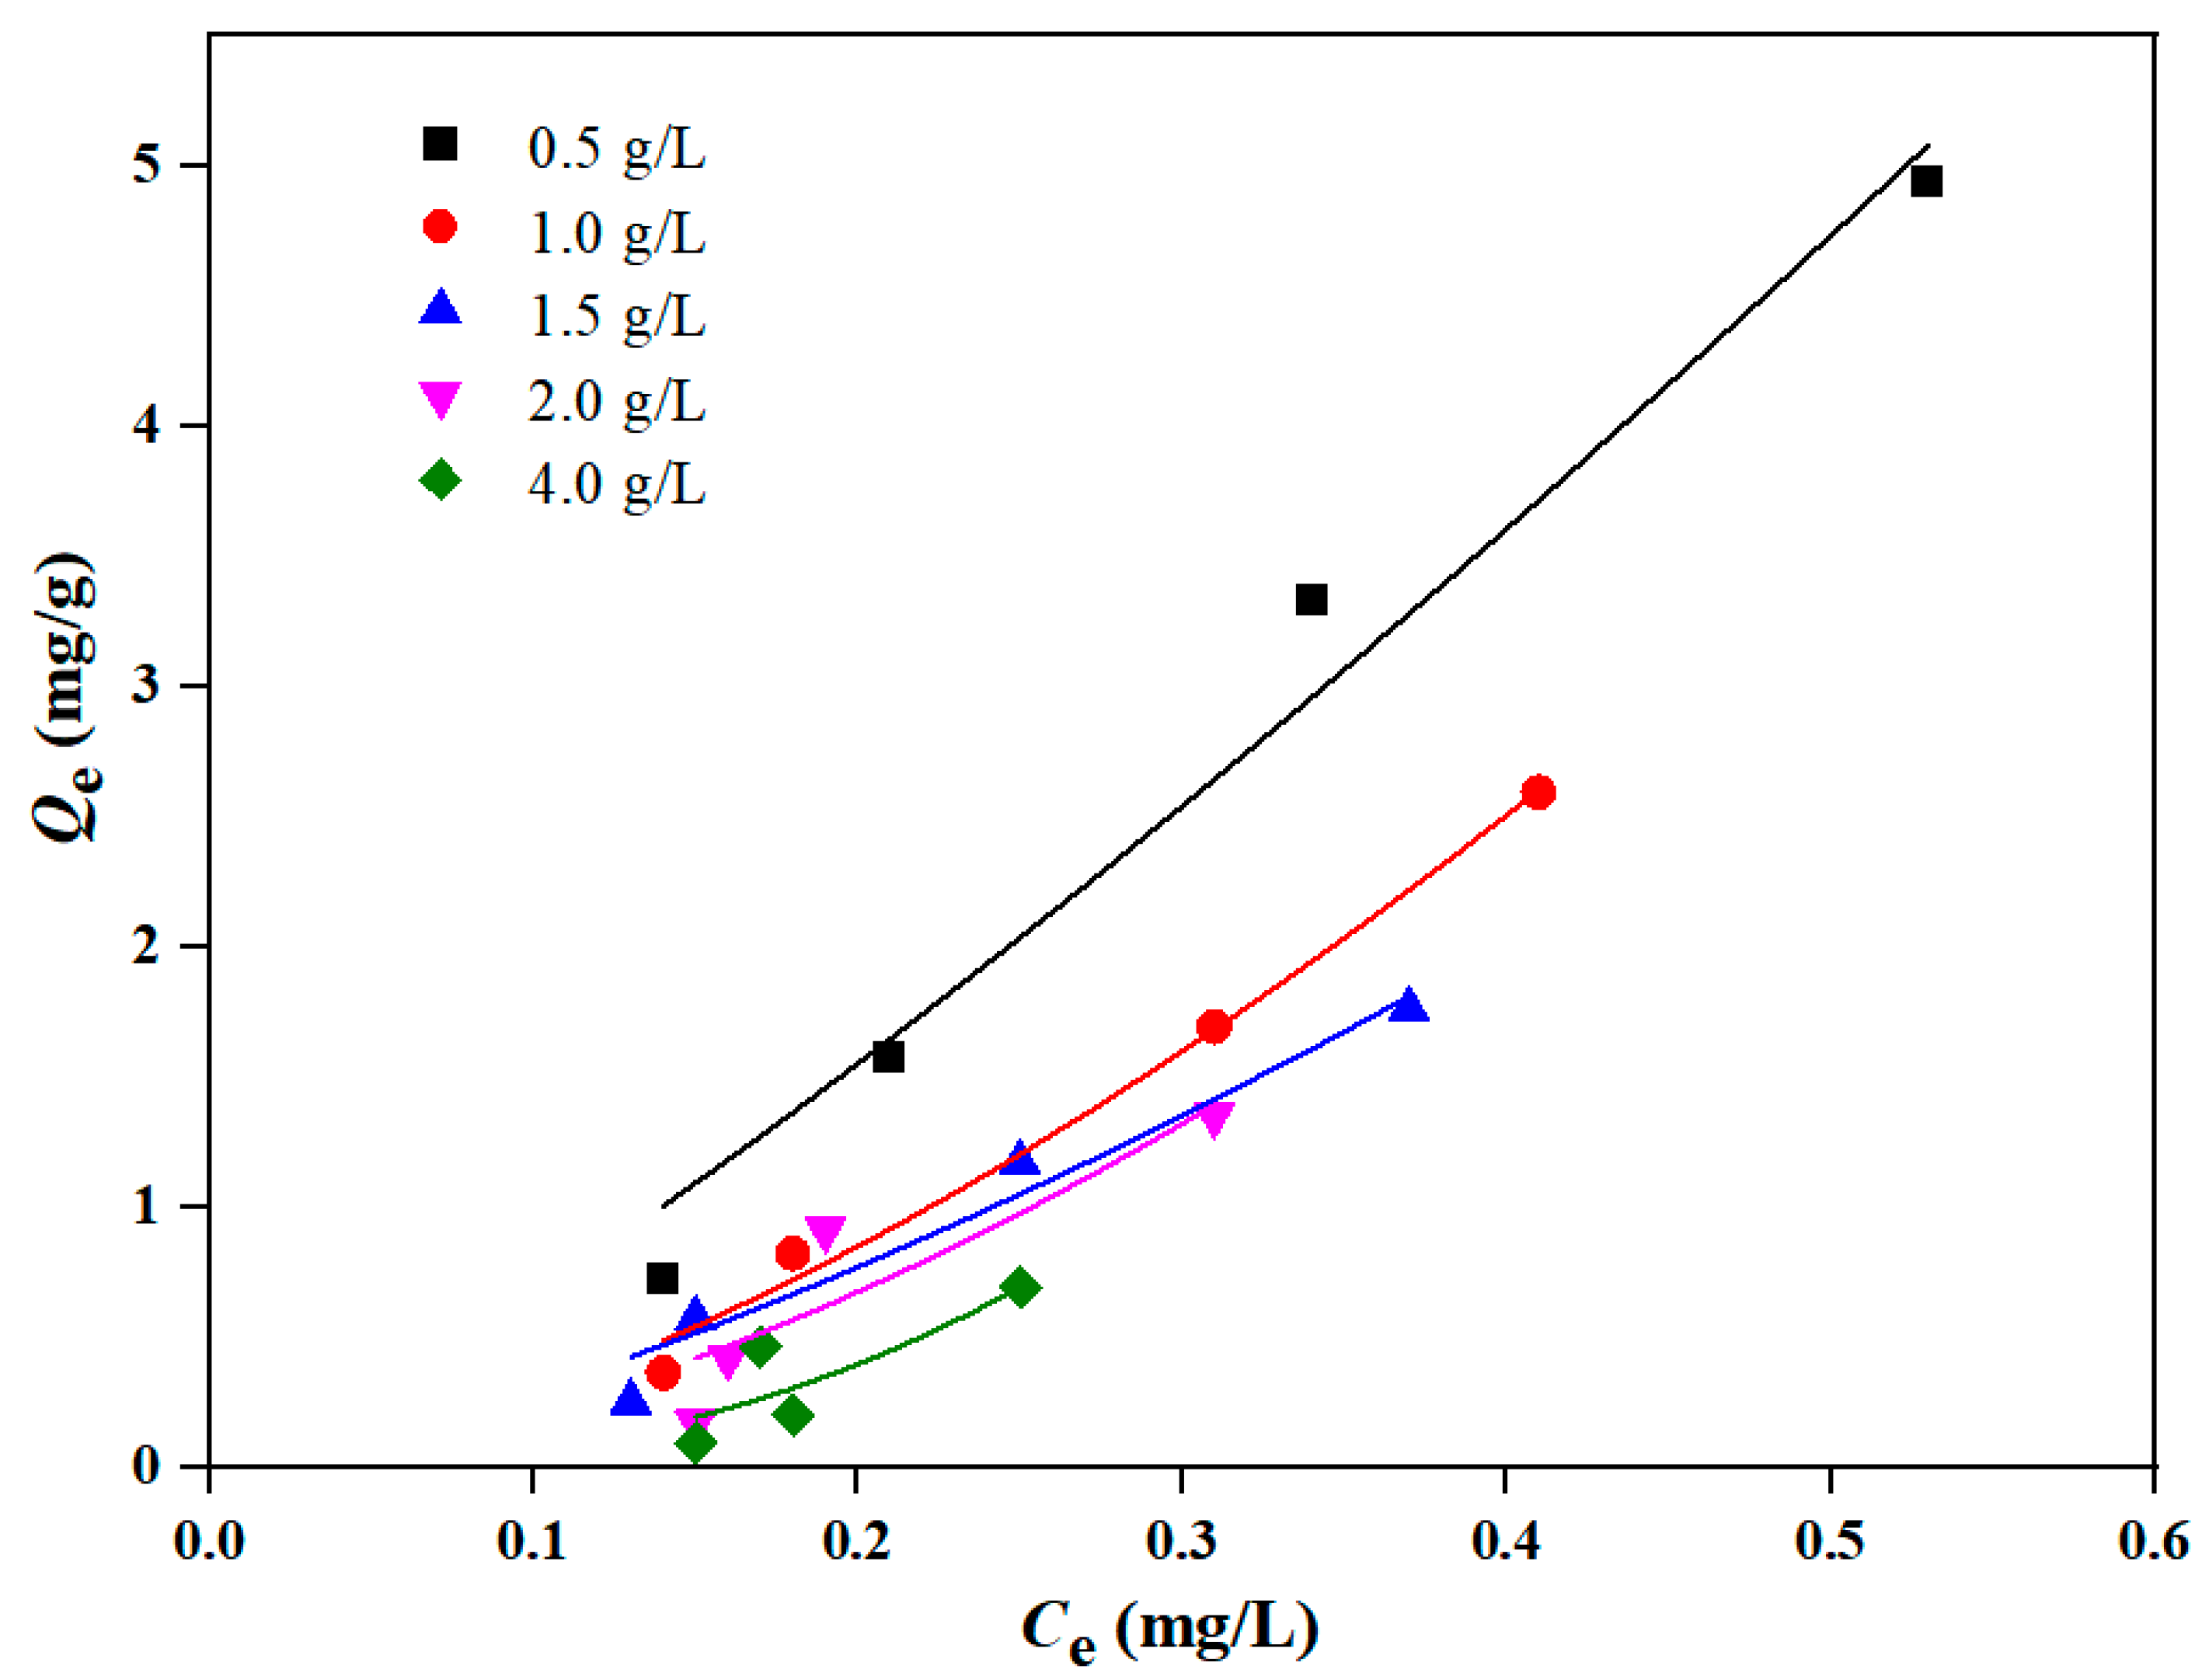
3.3.1. Adsorption Isotherm by Different Contents of Sediment
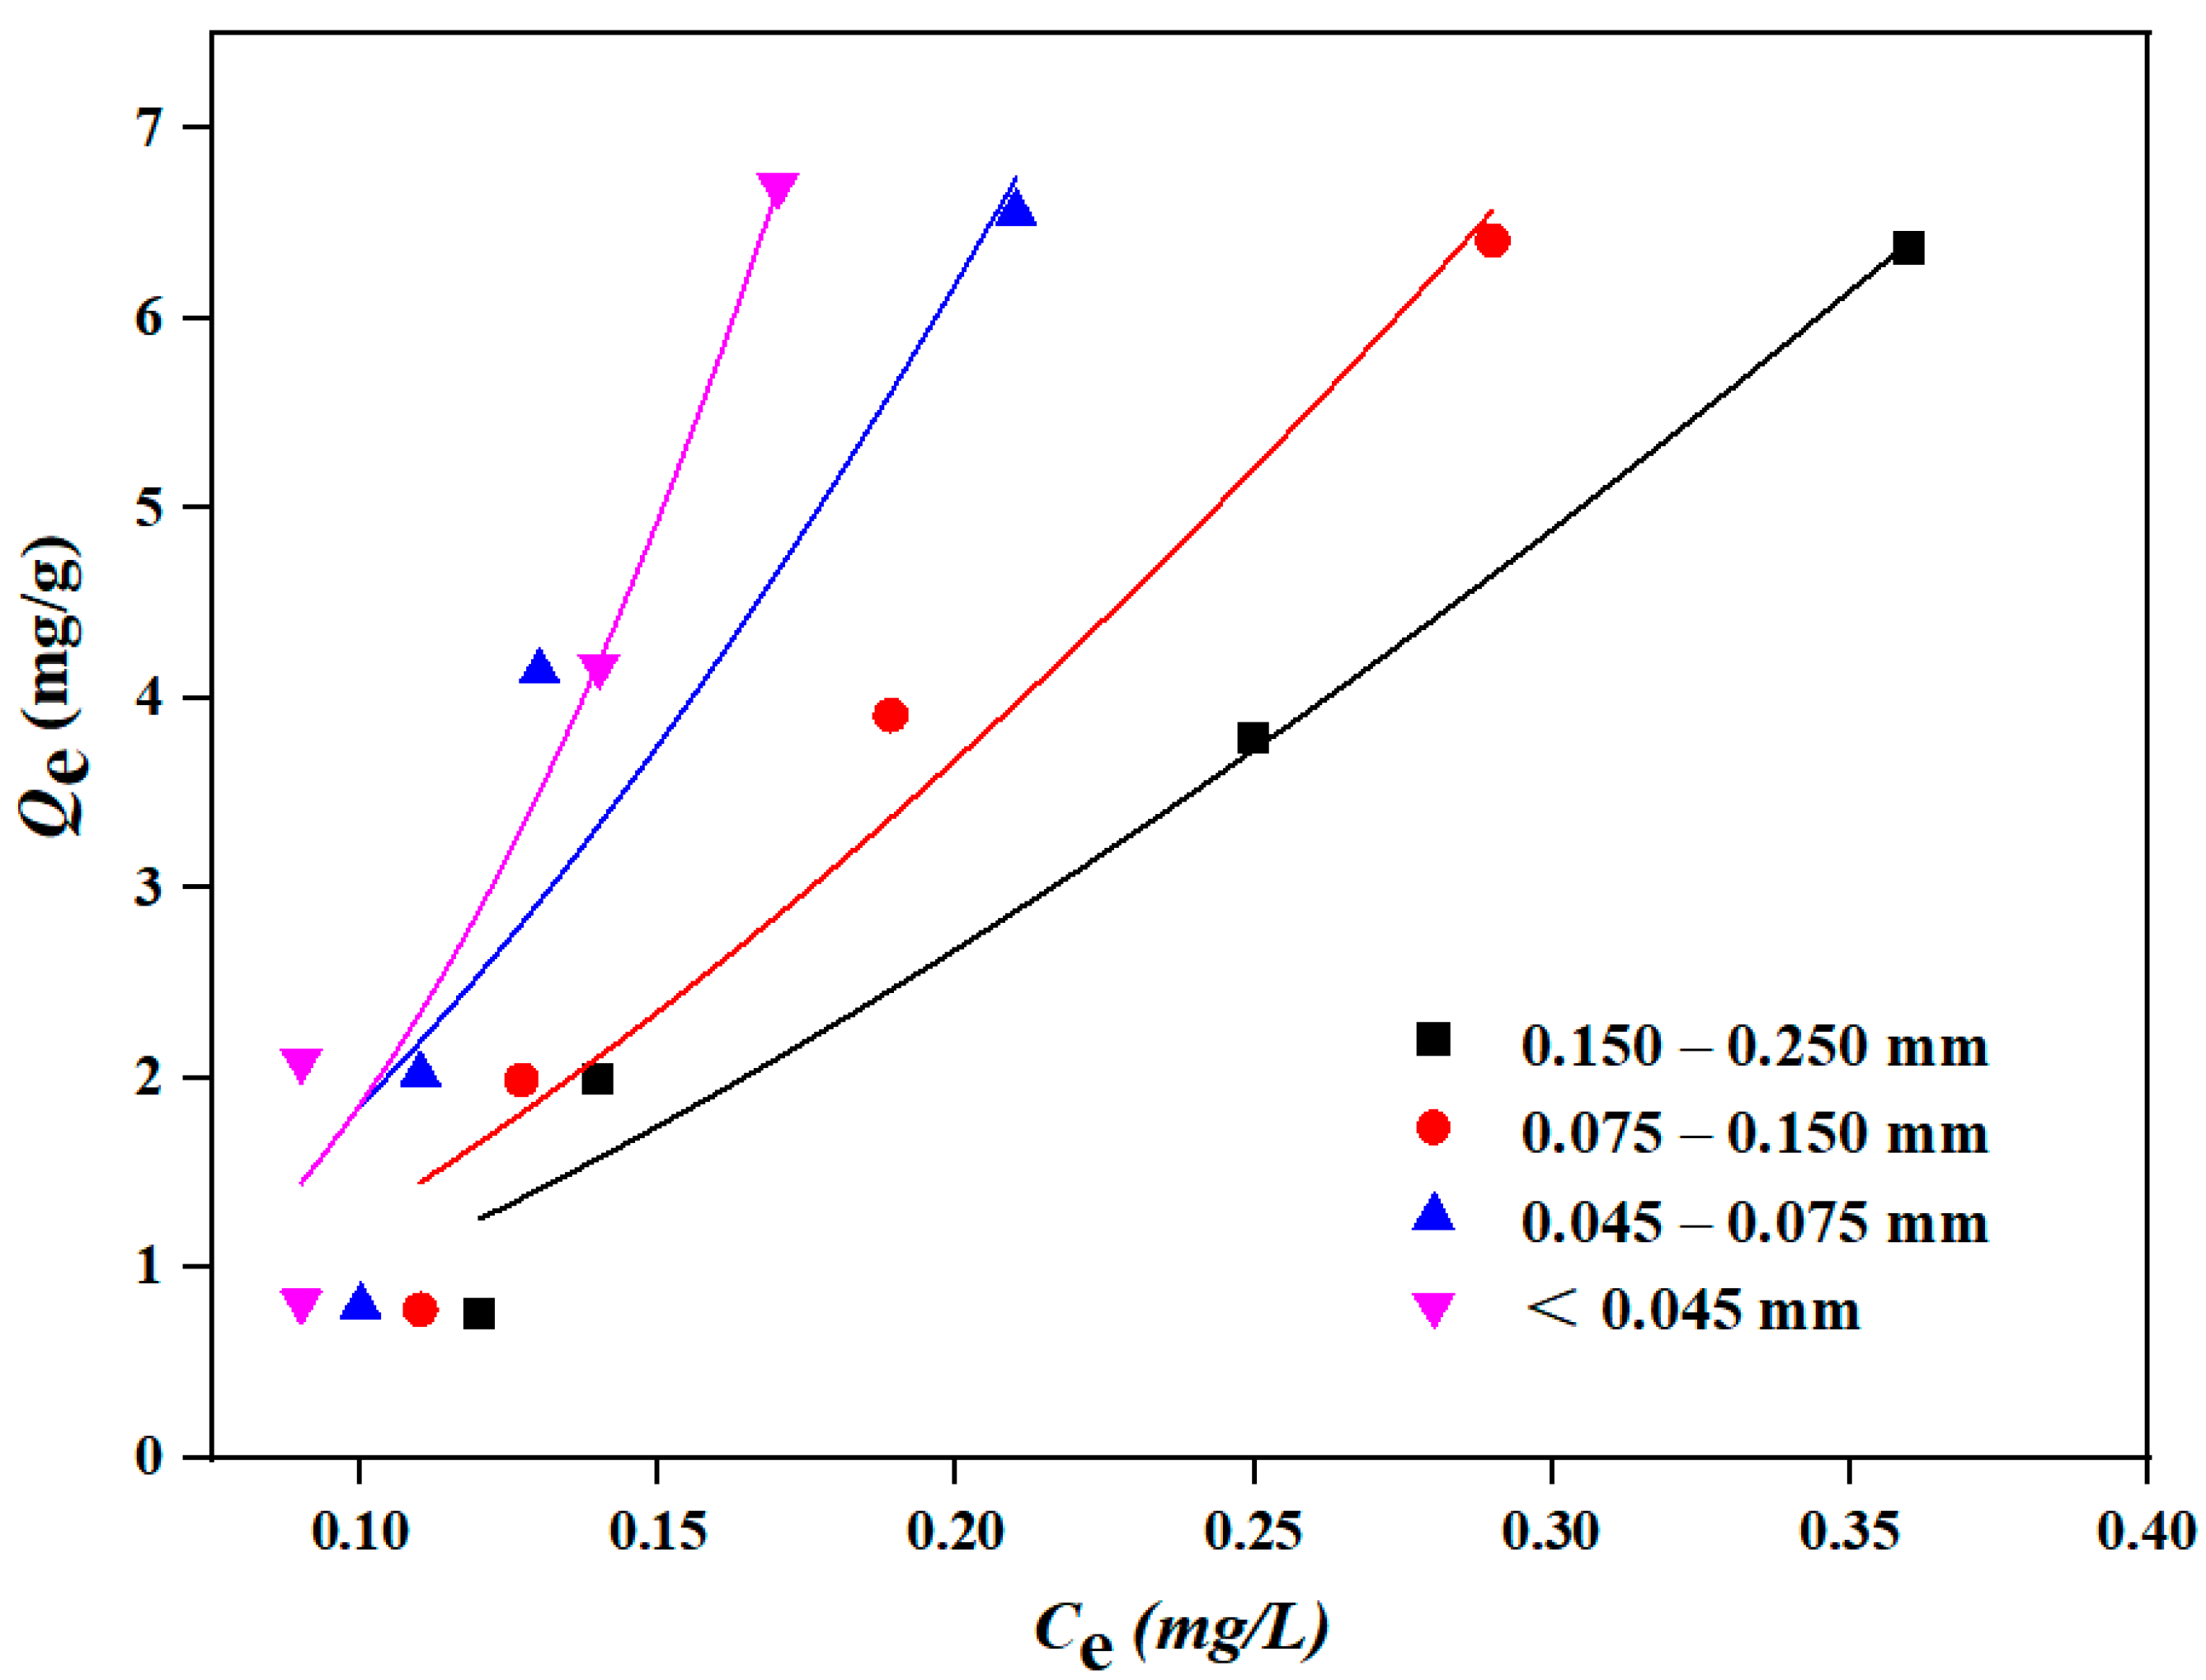
3.3.2. Adsorption Isotherm by Different Particle Sizes of Sediment
3.4. Comparison of Adsorption Characteristics of DBP by Sediment from the TGR with Other Reports
4. Conclusions
Author Contributions
Funding
Institutional Review Board Statement
Informed Consent Statement
Data Availability Statement
Conflicts of Interest
References
- Li, Y.Y.; Zheng, N.; Li, Y.; Li, P.Y.; Sun, S.Y.; Wang, S.J.; Song, X. Exposure of childbearing-aged female to phthalates through the use of personal care products in China: An assessment of absorption via dermal and its risk characterization. Sci. Total Environ. 2022, 807, 150980. [Google Scholar] [CrossRef] [PubMed]
- Shi, W.; Hu, X.X.; Zhang, F.X.; Hu, G.J.; Hao, Y.Q.; Zhang, X.W.; Liu, H.; Wei, S.; Wang, X.R.; Giesy, J.P.; et al. Occurrence of thyroid hormone activities in drinking water from eastern China: Contributions of phthalate esters. Environ. Sci. Technol. 2012, 46, 1811–1818. [Google Scholar] [CrossRef]
- Katsikantami, I.; Sifakis, S.; Tzatzarakis, M.N.; Vakonaki, E.; Kalantzi, O.; Tsatsakis, A.M.; Rizos, A.K. A global assessment of phthalates burden and related links to health effects. Environ. Int. 2016, 97, 212–236. [Google Scholar] [CrossRef] [PubMed]
- Net, S.; Richard, S.; Anne, D.; Andrea, P.; Baghdad, O. Occurrence, fate, behavior and ecotoxicological state of phthalates in different environmental matrices. Environ. Sci. Technol. 2015, 49, 4019–4035. [Google Scholar] [CrossRef] [PubMed]
- Zhang, Y.; Jiao, Y.Q.; Li, Z.X.; Tao, Y.; Yang, Y. Hazards of phthalates (PAEs) exposure: A review of aquatic animal toxicology studies. Sci. Total Environ. 2021, 771, 145418. [Google Scholar] [CrossRef] [PubMed]
- Lü, H.X.; Mo, C.H.; Zhao, H.M.; Lei, X.; Katsoyiannis, A.; Li, Y.W.; Cai, Q.Y.; Wong, M.H. Soil contamination and sources of phthalates and its health risk in China: A review. Environ. Res. 2018, 164, 417–429. [Google Scholar] [CrossRef] [PubMed]
- Zhang, L.L.; Liu, J.L.; Liu, H.Y.; Wan, G.S.; Zhang, S.W. The occurrence and ecological risk assessment of phthalate esters (PAEs) in urban aquatic environments of China. Ecotoxicology 2015, 24, 967–984. [Google Scholar] [CrossRef]
- Zhu, Q.Q.; Xu, L.Y.; Wang, W.Y.; Liu, W.B.; Liao, C.Y.; Jiang, G.B. Occurrence, spatial distribution and ecological risk assessment of phthalate esters in water, soil and sediment from Yangtze River Delta, China. Sci. Total Environ. 2022, 806, 150966. [Google Scholar] [CrossRef] [PubMed]
- Lin, L.; Dong, L.; Meng, X.Y.; Li, Q.Y.; Huang, Z.; Li, C.; Li, R.; Yang, W.J.; John, C. Distribution and sources of polycyclic aromatic hydrocarbons and phthalic acid esters in water and surface sediment from the Three Gorges Reservoir. J. Environ. Sci. 2018, 69, 271–280. [Google Scholar] [CrossRef] [PubMed]
- Zheng, F.Y.; Lu, T.; Chen, X.; Li, B.; Sun, T.T.; Cai, Q.H. Spatial distribution of nitrogen and phosphorus, and pollution evaluation for sediment in Xiangxi bay, Three Gorges Reservoir. Asian J. Ecotoxicol. 2018, 13, 49–59. [Google Scholar]
- Dai, Z.; Li, W.J.; Yang, S.F.; Yang, W.; Xiao, Y. Influence of sediment deposition on nitrogen and phosphorus pollutants in Three Gorges Reservoir area. Yangtze River 2020, 51, 23–27. [Google Scholar]
- Shao, Q. Study on the Coupling Relationship between the Siltation of the Three Gorges Reservoir and the Water Level in front of the Dam under the Condition of New Water and Sediment. Master’s Thesis, Chongqing Jiaotong University, Chongqing, China, 2020. [Google Scholar]
- Li, W.J.; Ma, H.P.; Yang, S.F.; Yang, W.; Song, C.P. Sedimentation and one dimensional simulation of fine sediment in the Three Gorges Reservoir. J. Basic Sci. Eng. 2021, 29, 251–260. [Google Scholar]
- Li, X.C.; Huang, L.; Fang, H.W.; Chen, M.H.; Cui, Z.H.; Sun, Z.Y.; Reible, D. Phosphorus adsorption by sediment considering mineral composition and environmental factors. Environ. Sci. Pollut. 2021, 28, 17495–17505. [Google Scholar] [CrossRef] [PubMed]
- Wu, Y.Y.; Fang, H.W.; Huang, L.; Cui, Z.H. Particulate organic carbon dynamics with sediment transport in the upper Yangtze River. Water Res. 2020, 184, 116193. [Google Scholar] [CrossRef] [PubMed]
- Wang, H.; Li, C.Y.; Yan, G.K.; Zhang, Y.J.; Wang, H.Y.; Dong, W.Y.; Chu, Z.S.; Chang, Y.; Ling, Y. Seasonal distribution characteristics and ecological risk assessment of phthalate esters in surface sediment of Songhua River basin. Environ. Pollut. 2023, 337, 122567. [Google Scholar] [CrossRef] [PubMed]
- Tang, X.Y.; Tong, S.C.; Huang, G.X.; Xu, G.X.; Li, X.H.; Lei, K.; Yao, S. Characteristics of sedimentation and channel adjustment linked to the Three Gorges Reservoir. Int. J. Sediment Res. 2021, 36, 177–189. [Google Scholar] [CrossRef]
- Moumita, N.; Tanushree, P.; Dipak, K.K.; Divya, B.; Kannan, P.; Pugazhenthi, G. Biodegradation of benzyl butyl phthalate and dibutyl phthalate by Arthrobacter sp. via micellar solubilization in a surfactant-aided system. Water Supply 2020, 21, 2084–2098. [Google Scholar]
- Rapok, K.J.; Karim, A.T.A.; Hashim, N.H.; Muhammad, A. Adsorption isotherms of dimethyl phthalate (DMP), diEthyl phthalate (DEP), dibutyl phthlate (DBP) and benzyl butyl phthalate (BBP) compounds in synthetic and sembrong river sediment. IOP Conf. Ser. Earth Environ. Sci. 2022, 1022, 012056. [Google Scholar] [CrossRef]
- Sun, H.F.; Ma, R.Y.; Nan, Y.L.; Feng, R.J. Insight into effects of citric acid on adsorption of phthalic acid esters (PAEs) in mangrove sediments. Ecotox Environ. Safe. 2019, 169, 353–360. [Google Scholar] [CrossRef] [PubMed]
- Revellame, E.D.; Fortela, D.L.; Sharp, W.; Hernandez, R.; Zappi, M.E. Adsorption kinetic modeling using pseudo-first order and pseudo-second order rate laws: A review. Clean. Eng. Technol. 2020, 1, 100032. [Google Scholar] [CrossRef]
- Tang, B.; Xu, H.P.; Song, F.M.; Liu, Z.F. Adsorption characteristics of Cd2+ ions in aqueous solution on modified straw biochar. Sustainability 2023, 15, 4373. [Google Scholar] [CrossRef]
- Lin, L.; Zhang, S.; Dong, L.; Cao, Y.Q.; Zhang, W.; Pan, X.; Li, Y.; Zhang, C.; Tao, J.X.; Jia, D.; et al. Photodegradation behavior and mechanism of dibutyl phthalate in water under flood discharge atomization. Sci. Total Environ. 2023, 871, 161822. [Google Scholar] [CrossRef] [PubMed]
- Xu, L.; Yang, X.; Guo, Y.H.; Ma, F.Y.; Guo, Y.N.; Yuan, X.; Huo, M.X. Simulated sunlight photodegradation of aqueous phthalate esters catalyzed by the polyoxotungstate/titania nanocomposite. J. Hazard. Mater. 2010, 178, 1070–1077. [Google Scholar] [CrossRef] [PubMed]
- Kao, P.H.; Lee, F.Y.; Hseu, Z.Y. Sorption and biodegradation of phthalic acid esters in freshwater sediments. J. Environ. Sci. Health 2005, 40, 103–115. [Google Scholar] [CrossRef]
- Xiang, L.; Wang, X.D.; Chen, X.H.; Mo, C.H.; Li, Y.W.; Li, H.; Cai, Q.Y.; Zhou, D.M.; Wong, M.H.; Li, Q.X. Sorption mechanism, kinetics, and isotherms of di-n-butyl phthalate to different soil particle-size fractions. J. Agric. Food Chem. 2019, 67, 4734–4745. [Google Scholar] [CrossRef]
- Oudghiri, F.; García-Morales, J.L.; Rodríguez-Barroso, M.R. Novel use of TGA-FTIR technique to predict the pollution degreein marine sediments. Infrared Phys. Technol. 2015, 72, 52–57. [Google Scholar] [CrossRef]
- Zou, Y.D.; Wang, X.X.; Ai, Y.; Liu, Y.H.; Li, J.X.; Ji, Y.F.; Wang, X.K. Coagulation behavior of graphene oxide on nanocrystallined Mg/Al layered double hydroxides: Batch experimental and theoretical calculation study. Environ. Sci. Technol. 2016, 50, 3658–3667. [Google Scholar] [CrossRef] [PubMed]
- Wang, Y.F.; Zhang, X.Y.; Zhang, X.; Meng, Q.J.; Gao, F.J.; Zhang, Y. Characterization of spectral responses of dissolved organic matter (DOM) for atrazine binding during thesorption process onto black soil. Chemosphere 2017, 180, 531–539. [Google Scholar] [CrossRef] [PubMed]
- Abdulla, H.A.N.; Minor, E.C.; Dias, R.F.; Hatcher, P.G. Changes in the compound classes of dissolved organic matter along an estuarine transect: A study using FTIR and 13C NMR. Geochim. Cosmochim. Acta 2010, 74, 3815–3838. [Google Scholar] [CrossRef]
- Wu, W.; Sheng, H.J.; Gu, C.G.; Song, Y.; Willbold, S.; Qiao, Y.; Liu, G.X.; Zhao, W.; Wang, Y.; Jiang, X.; et al. Extraneous dissolved organic matter enhanced adsorption of dibutyl phthalate in soils: Insights from kinetics and isotherms. Sci. Total Environ. 2018, 631–632, 1495–1503. [Google Scholar] [CrossRef]
- Tang, X.Q.; Wu, M.; Li, R. Distribution, sedimentation, and bioavailability of particulate phosphorus in the mainstream of the Three Gorges Reservoir. Water Res. 2018, 140, 44–55. [Google Scholar] [CrossRef] [PubMed]
- Shen, S.Q.; Yang, S.K.; Jiang, Q.L.; Luo, M.Y.; Li, Y.; Yang, C.Y.; Zhang, D. Effect of dissolved organic matter on adsorption of sediments to oxytetracycline: An insight from zeta potential and DLVO theory. Environ. Sci. Pollut. 2020, 27, 1697–1709. [Google Scholar] [CrossRef] [PubMed]
- Hu, X.; Li, J.; Wang, J.; Yin, L.; Shi, K.P.; Huang, H.Y.; Zhang, Y.; Li, S.Y. Characterization and stability of sedimentary colloids in different ecology regions in Taihu Lake. J. Oceanol. 2023, 41, 2146–2159. [Google Scholar] [CrossRef]
- Ahmadi, T.A.; Omranpoor, M.M.; Vatanara, A.; Seyedabadi, M.; Ramezani, V. Formation of nanosuspensions in bottom-up approach: Theories and optimization. DARU J. Pharm. Sci. 2019, 27, 451–473. [Google Scholar] [CrossRef] [PubMed]
- Gao, X.; Wu, Z.G.; Guo, J.S.; Wang, L.; Du, R. Adsorption of Phthalic acid esters on suspended particulates from the Wanzhou reach of the Yangtze River. Resour. Environ. Yangtze Basin 2010, 19, 178–182. [Google Scholar]
- Sun, Y.; Lin, C.X.; Liu, M.H.; Liu, Y.F. Equilibrium adsorption behaviors and kinetic characteristics of oxymatrine on a spherical cellulose adsorbent. Bioresources 2011, 6, 631–640. [Google Scholar] [CrossRef]
- Wang, H.Y.; Shen, Z.Y.; Guo, X.J.; Niu, J.F.; Kang, B. Ammonia adsorption and nitritation in sediments derived from the Three Gorges Reservoir, China. Environ. Earth Sci. 2010, 60, 1653–1660. [Google Scholar] [CrossRef]
- Magid, A.S.I.A.; Islam, M.S.; Chen, Y.L.; Weng, L.P.; Sun, Y.; Chang, X.P.; Zhou, B.; Ma, J.; Li, Y.T. Competitive adsorption of dibutyl phthalate (DBP) and di (2-ethylhexyl) phthalate (DEHP) onto fresh and oxidized corncob biochar. Chemosphere 2021, 280, 130639. [Google Scholar] [CrossRef]
- Cui, S.C.; Ding, A.Z.; Pan, C.Z.; Li, C.J.; Yan, Z.H.; Hao, L.F. Effect of sediment mass concentration and pH on phosphorus adsorption at different sediment size. J. Beijing Norm. Univ. Nat. Sci. 2012, 48, 582–586. [Google Scholar]


| Adsorption System | Kinetics Model | Correlation Coefficients (R2) | Rate Constant (k1, k2, g/mg·min) | Equilibrium Adsorption Amount (Qe, mg/g) |
|---|---|---|---|---|
| Deionized water | pseudo-first-order | 0.9924 | 0.393 | 3.49 |
| pseudo-second-order | 0.9970 | 0.334 | 3.55 | |
| Yangtze River water | pseudo-first-order | 0.9796 | 0.724 | 3.91 |
| pseudo-second-order | 0.9832 | 0.746 | 3.95 |
| Sediment Contents (g/L) | Parameters | ||
|---|---|---|---|
| Kf (mg/g)/(mg/L)n | n | R2 | |
| 0.5 | 11.01 | 0.8207 | 0.9799 |
| 1 | 10.49 | 0.6395 | 0.9921 |
| 1.5 | 7.199 | 0.7192 | 0.9675 |
| 2 | 9.708 | 0.6027 | 0.8373 |
| 4 | 22.85 | 0.3964 | 0.7510 |
| Sieve (mesh) | Particle Sizes (mm) | Specific Surface Area | Parameters | ||
|---|---|---|---|---|---|
| (m2/g) | Kf (mg/g)/(mg/L)n | n | R2 | ||
| 60–100 | 0.150–0.250 | 5.38 | 29.19 | 0.6738 | 0.9781 |
| 100–200 | 0.075–0.150 | 8.29 | 45.38 | 0.6406 | 0.9617 |
| 200–320 | 0.045–0.075 | 8.96 | 101.43 | 0.5756 | 0.8757 |
| >320 | <0.045 | 9.70 | 477.98 | 0.4151 | 0.9633 |
| Adsorbents | Particle Sizes (mm) | Specific Surface Area (m2/g) | Adsorption Condition | Adsorption Equilibrium Time | Freundlich Model | |
|---|---|---|---|---|---|---|
| Kf (mg/g)/(mg/L)n | n | |||||
| Sediment from Zhanjiang Estuary mangrove wetland | 2.00 | NA a | 1 g/L sediment, 0.1~8 mg/L DBP | 2 h | 59.8 | 1.04 |
| Sediment from Ah-Kung-Dian River | 2.00 | NA a | 200 g/L sediment, 0~2 mg/L DBP | 3 h | 1.45 | 1.60 |
| Paddy soil from Guangzhou | 0.135 | 3.90 | 20 g/L soil, 1~12 mg/L DBP | 24 h | 0.05 | 0.73 |
| Black soil from Harbin | 2.00 | NA a | 2.5 g/L soil, 0.5–8 mg/L DBP | 2 h | 66.32 | 1.27 |
| Sediment from TGR (this study) | 0.150 | 8.25 | 0.5 g/L sediment, 0.5~3 mg/L DBP | 2 h | 11.01 | 0.82 |
Disclaimer/Publisher’s Note: The statements, opinions and data contained in all publications are solely those of the individual author(s) and contributor(s) and not of MDPI and/or the editor(s). MDPI and/or the editor(s) disclaim responsibility for any injury to people or property resulting from any ideas, methods, instructions or products referred to in the content. |
© 2024 by the authors. Licensee MDPI, Basel, Switzerland. This article is an open access article distributed under the terms and conditions of the Creative Commons Attribution (CC BY) license (https://creativecommons.org/licenses/by/4.0/).
Share and Cite
Zhang, Y.; Liu, M.; Lin, L.; Zhao, L.; Deng, W.; Han, C.; Wu, M. The Characteristics of Adsorption of Di-n-Butyl Phthalate by Surface Sediment from the Three Gorges Reservoir. Toxics 2024, 12, 469. https://doi.org/10.3390/toxics12070469
Zhang Y, Liu M, Lin L, Zhao L, Deng W, Han C, Wu M. The Characteristics of Adsorption of Di-n-Butyl Phthalate by Surface Sediment from the Three Gorges Reservoir. Toxics. 2024; 12(7):469. https://doi.org/10.3390/toxics12070469
Chicago/Turabian StyleZhang, Yuting, Min Liu, Li Lin, Liangyuan Zhao, Wei Deng, Cheng Han, and Mingli Wu. 2024. "The Characteristics of Adsorption of Di-n-Butyl Phthalate by Surface Sediment from the Three Gorges Reservoir" Toxics 12, no. 7: 469. https://doi.org/10.3390/toxics12070469
APA StyleZhang, Y., Liu, M., Lin, L., Zhao, L., Deng, W., Han, C., & Wu, M. (2024). The Characteristics of Adsorption of Di-n-Butyl Phthalate by Surface Sediment from the Three Gorges Reservoir. Toxics, 12(7), 469. https://doi.org/10.3390/toxics12070469