
Theoretical Studies on the Quantitative Structure–Toxicity Relationship of Polychlorinated Biphenyl Congeners Reveal High Affinity Binding to Multiple Human Nuclear Receptors

 , ,
, ,
Abstract
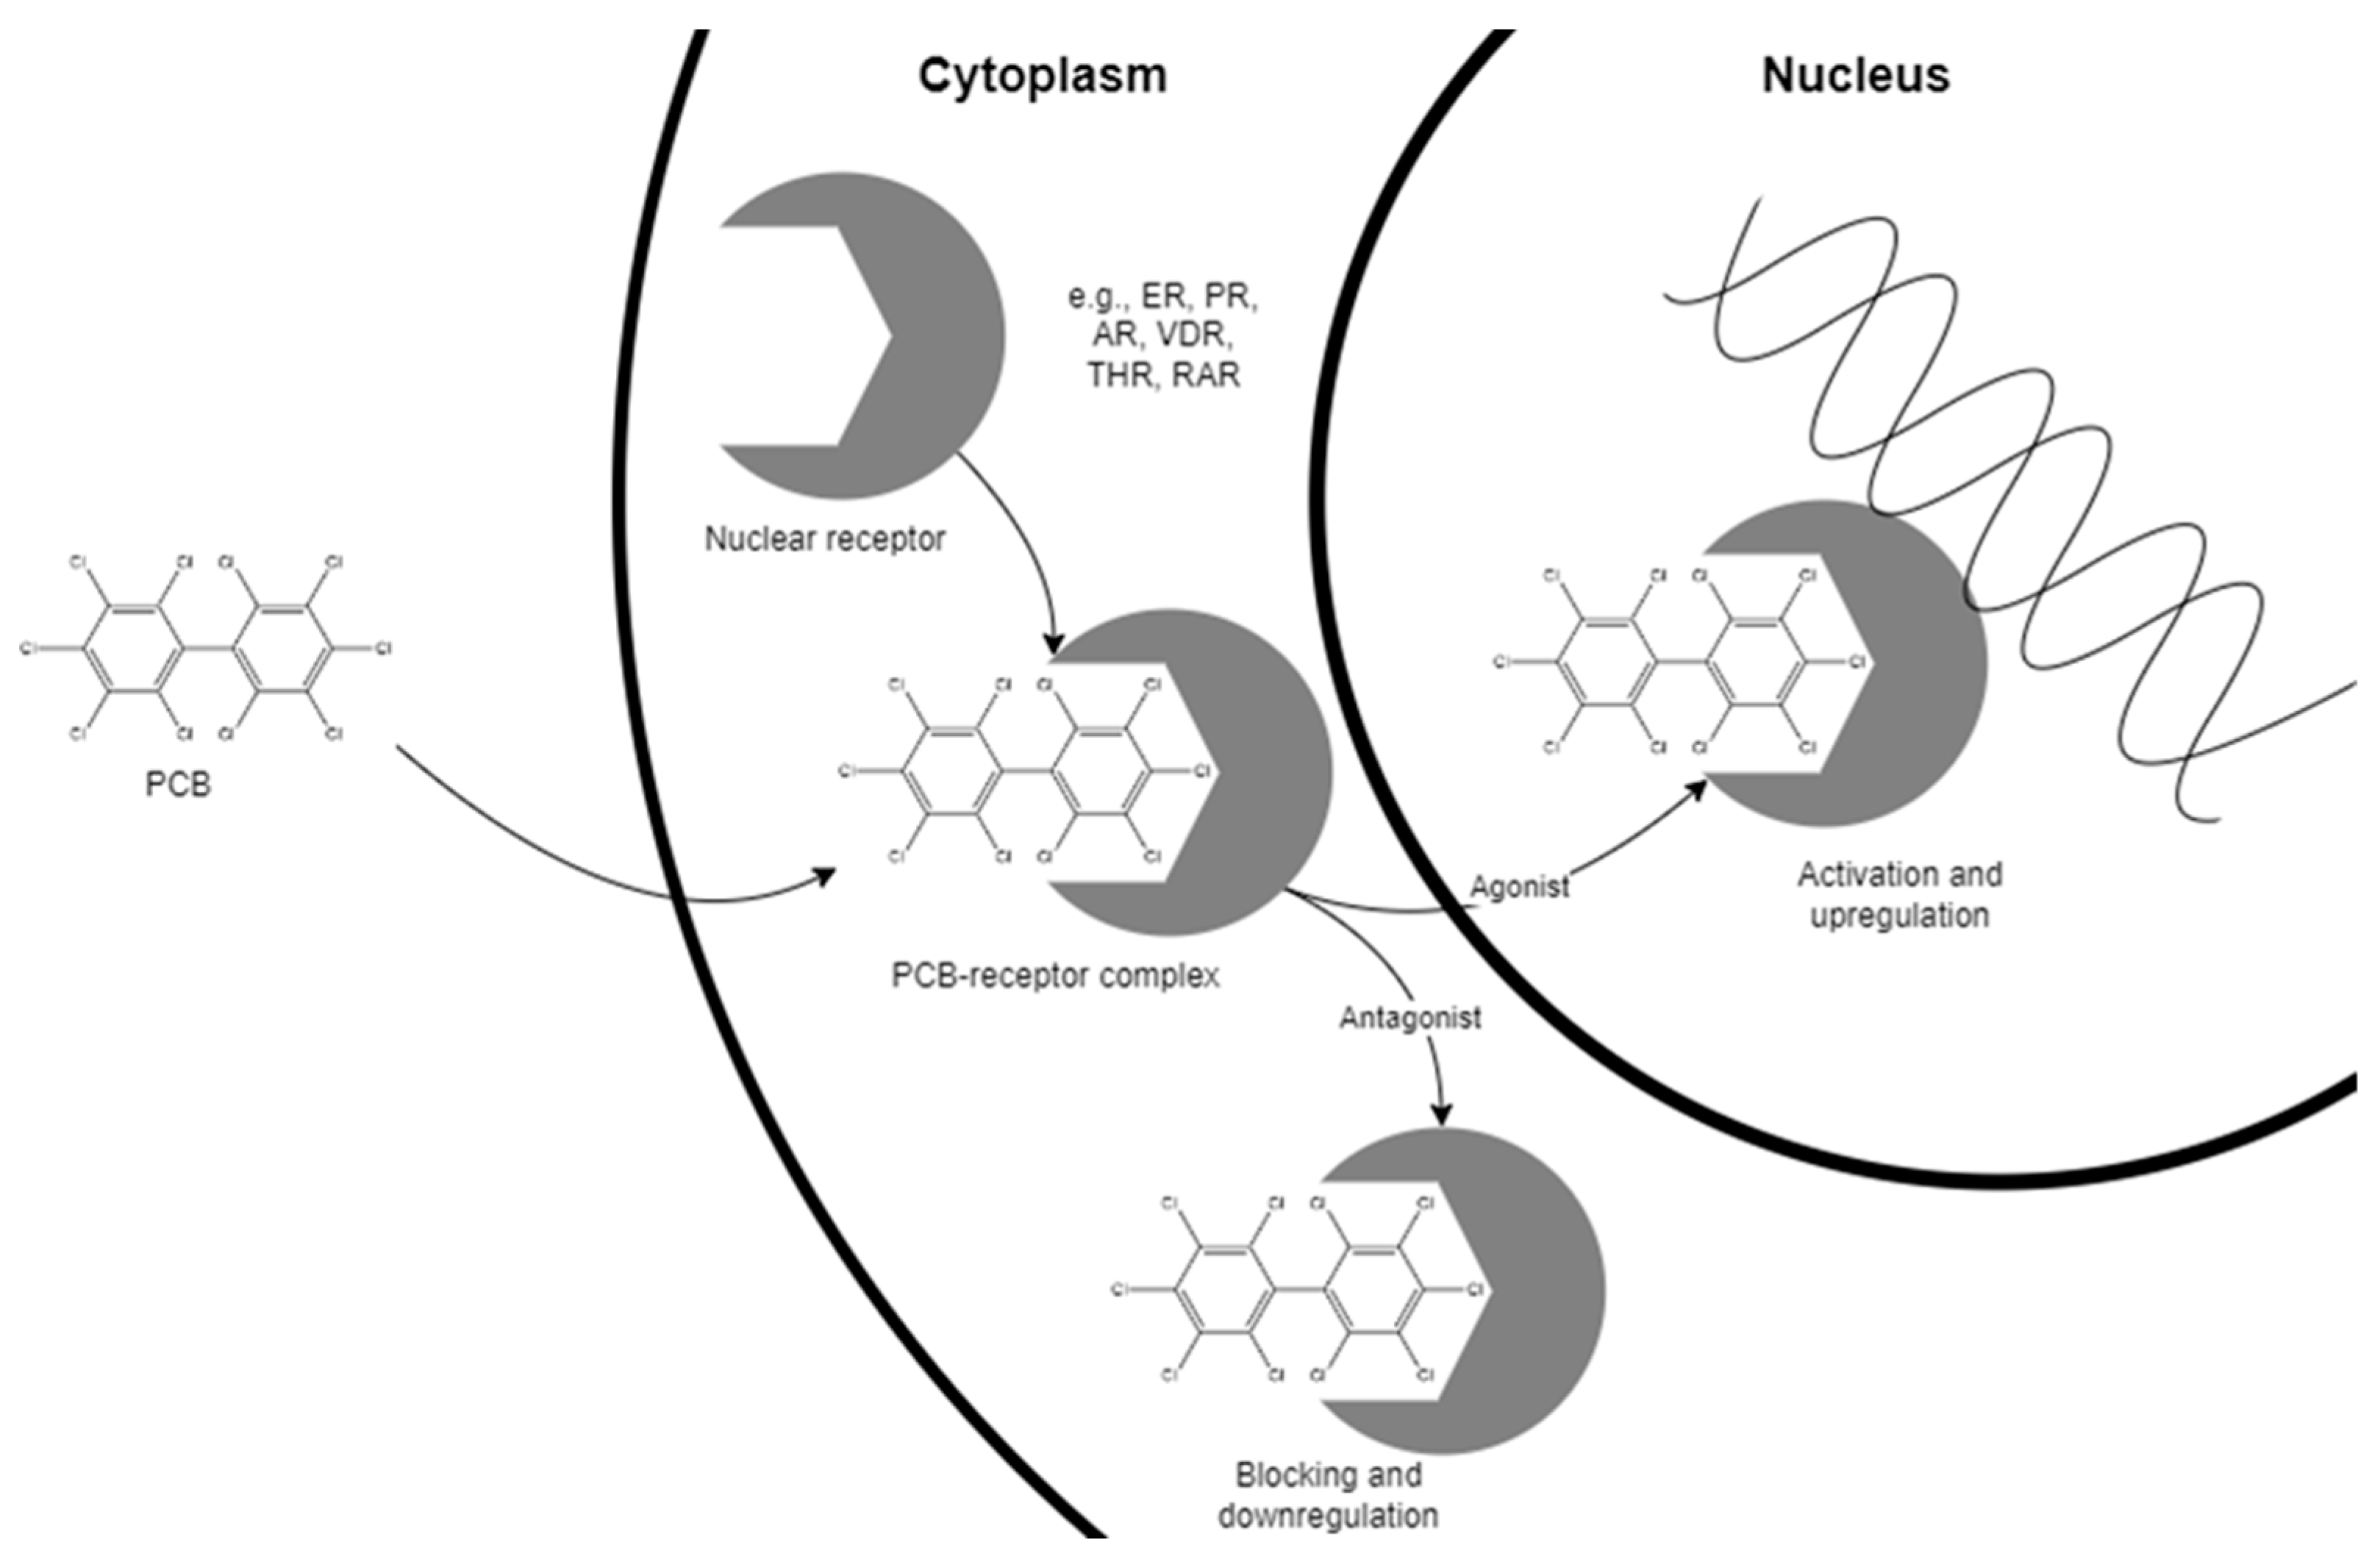
1. Introduction
2. Materials and Methods
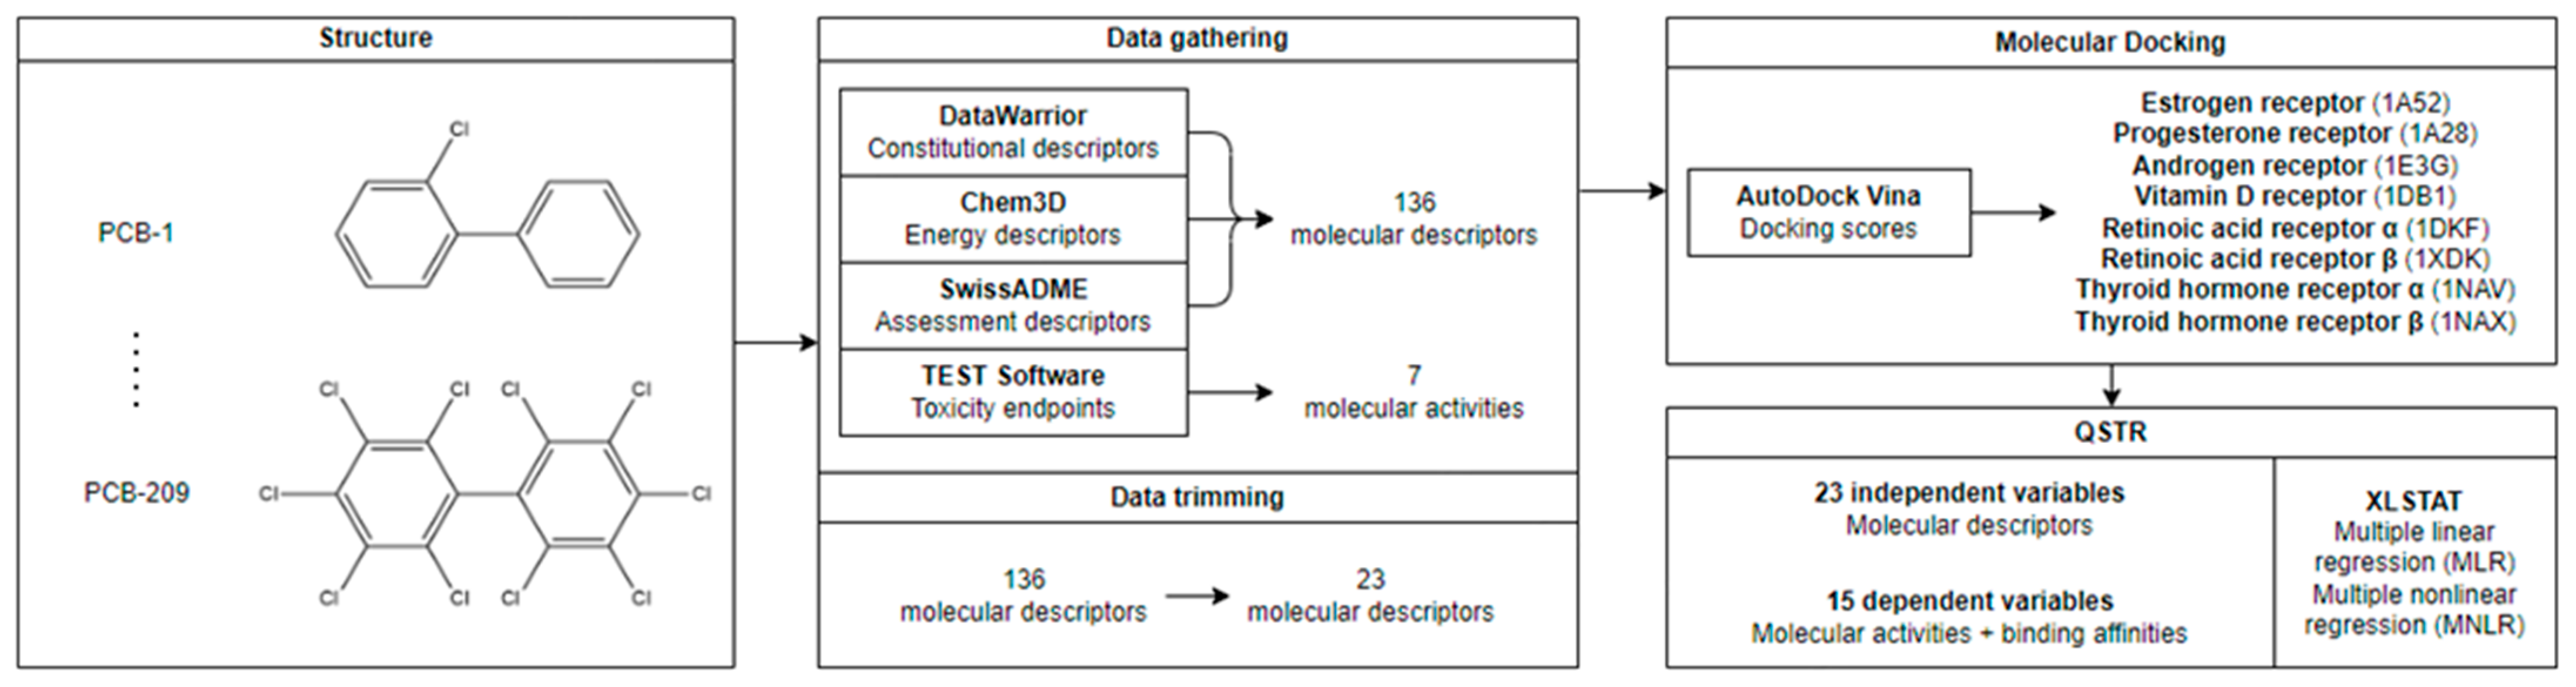
2.1. Data Gathering
2.2. Statistical Methods
2.3. Molecular Docking Simulations
2.4. Molecular Dynamics Simulations
3. Results and Discussion
3.1. Data Gathering
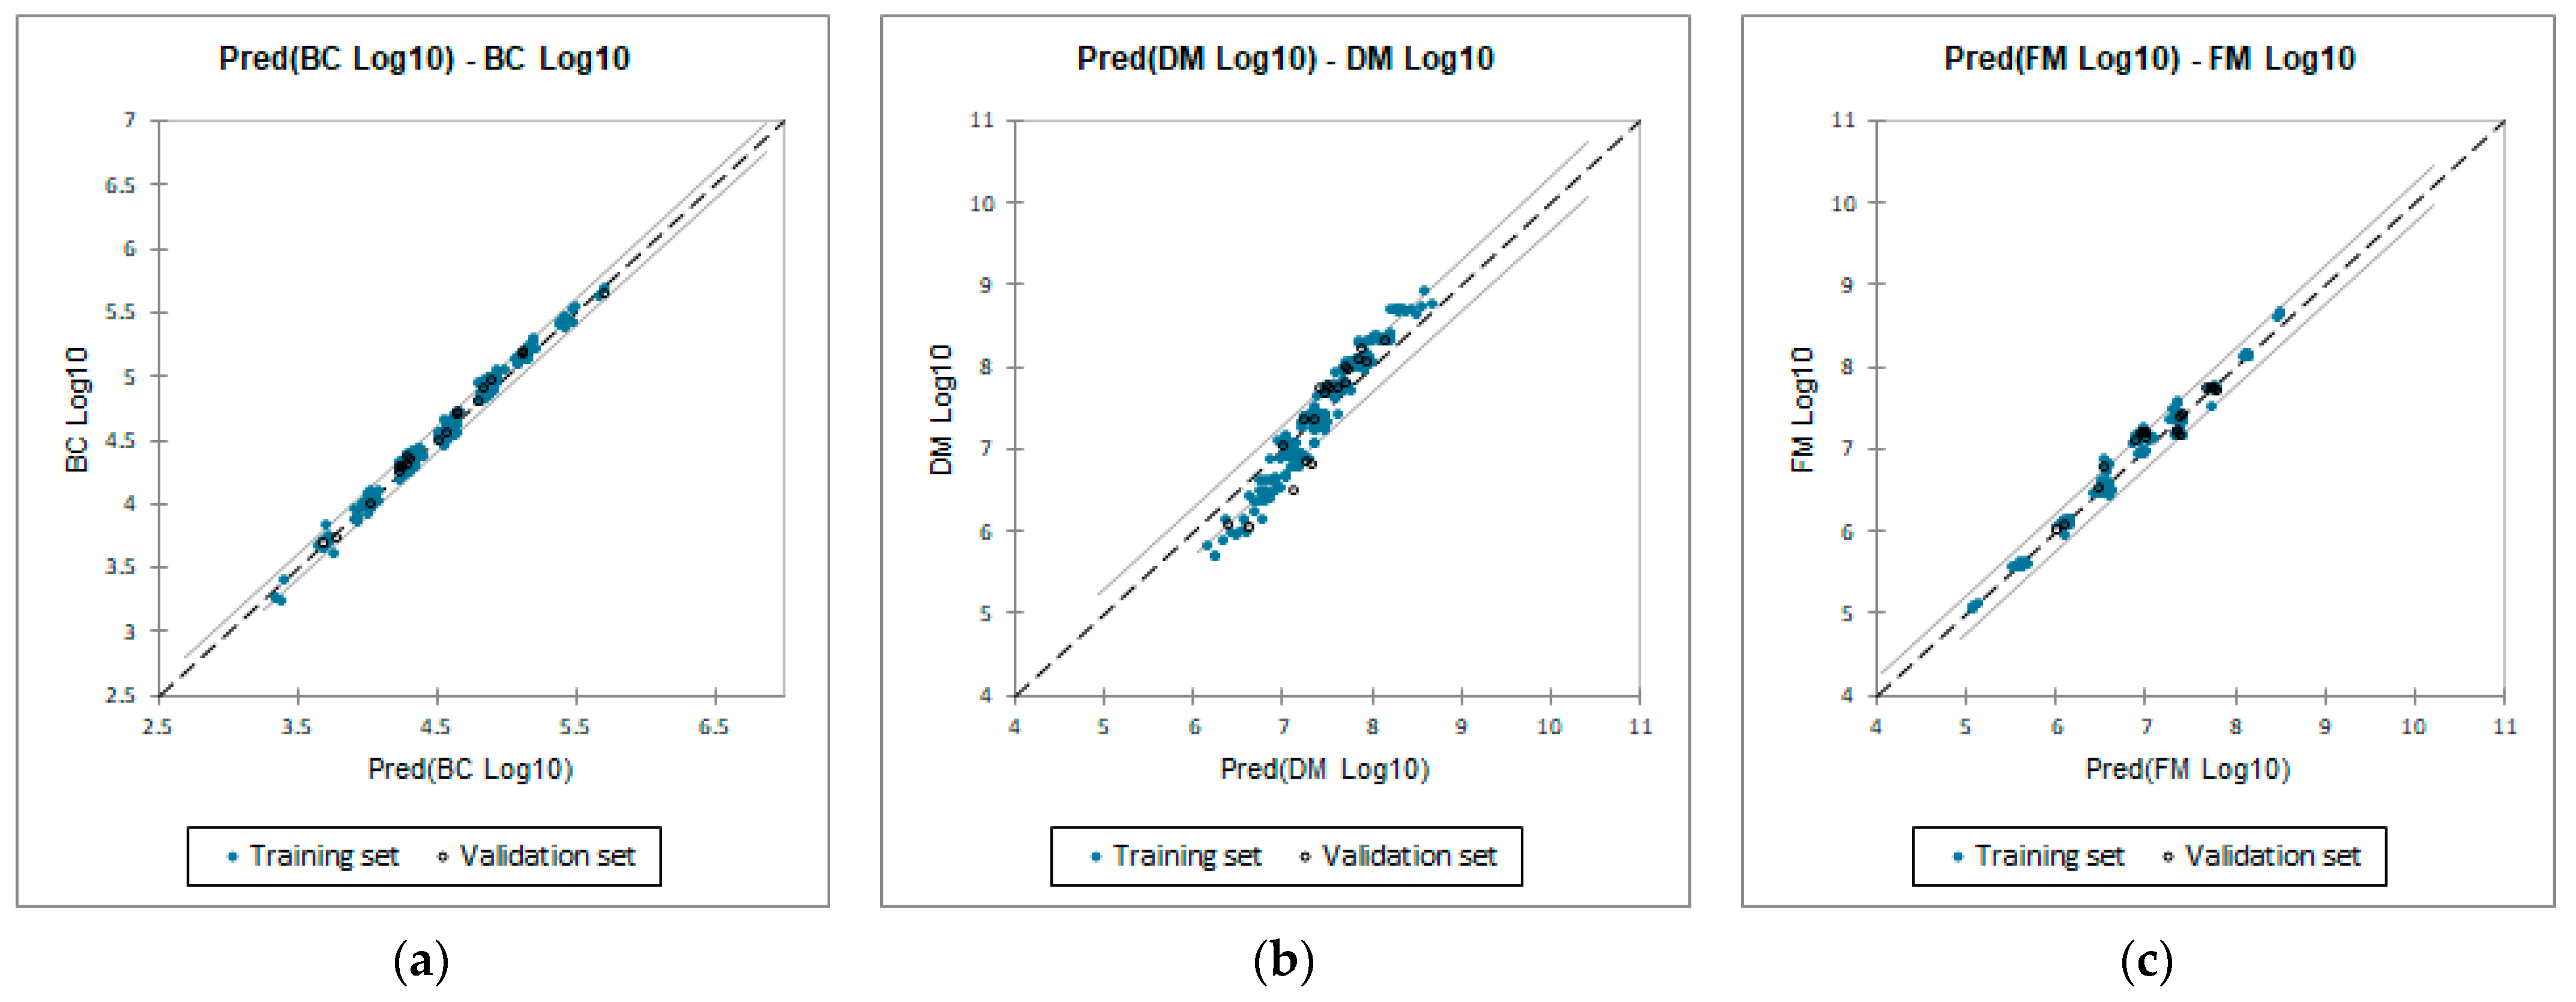
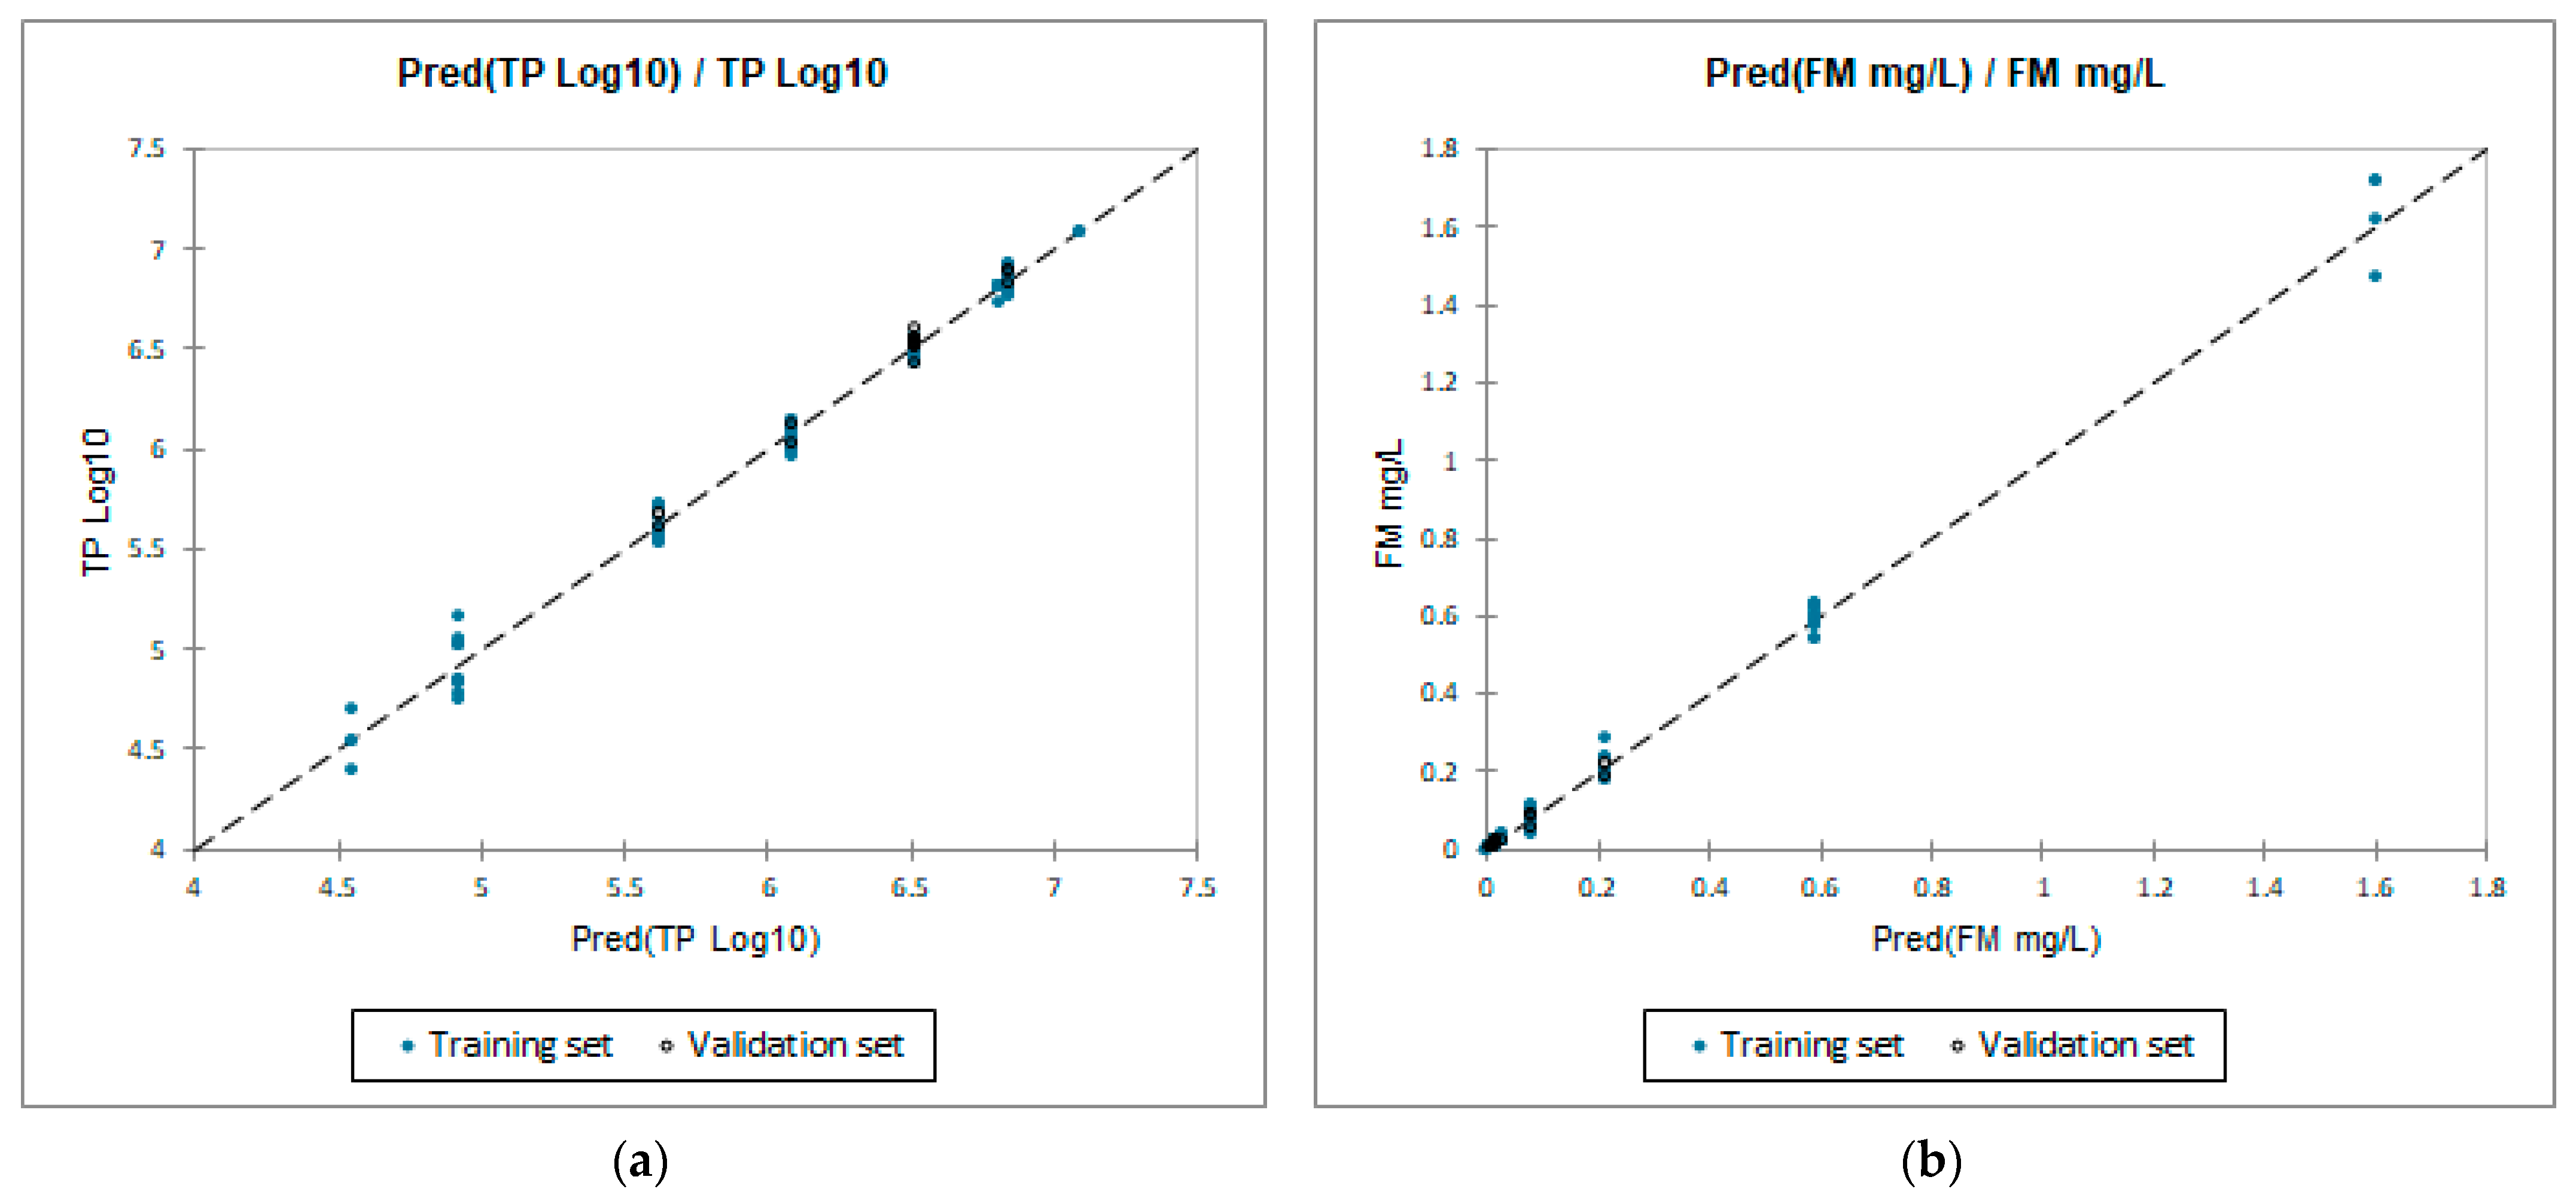
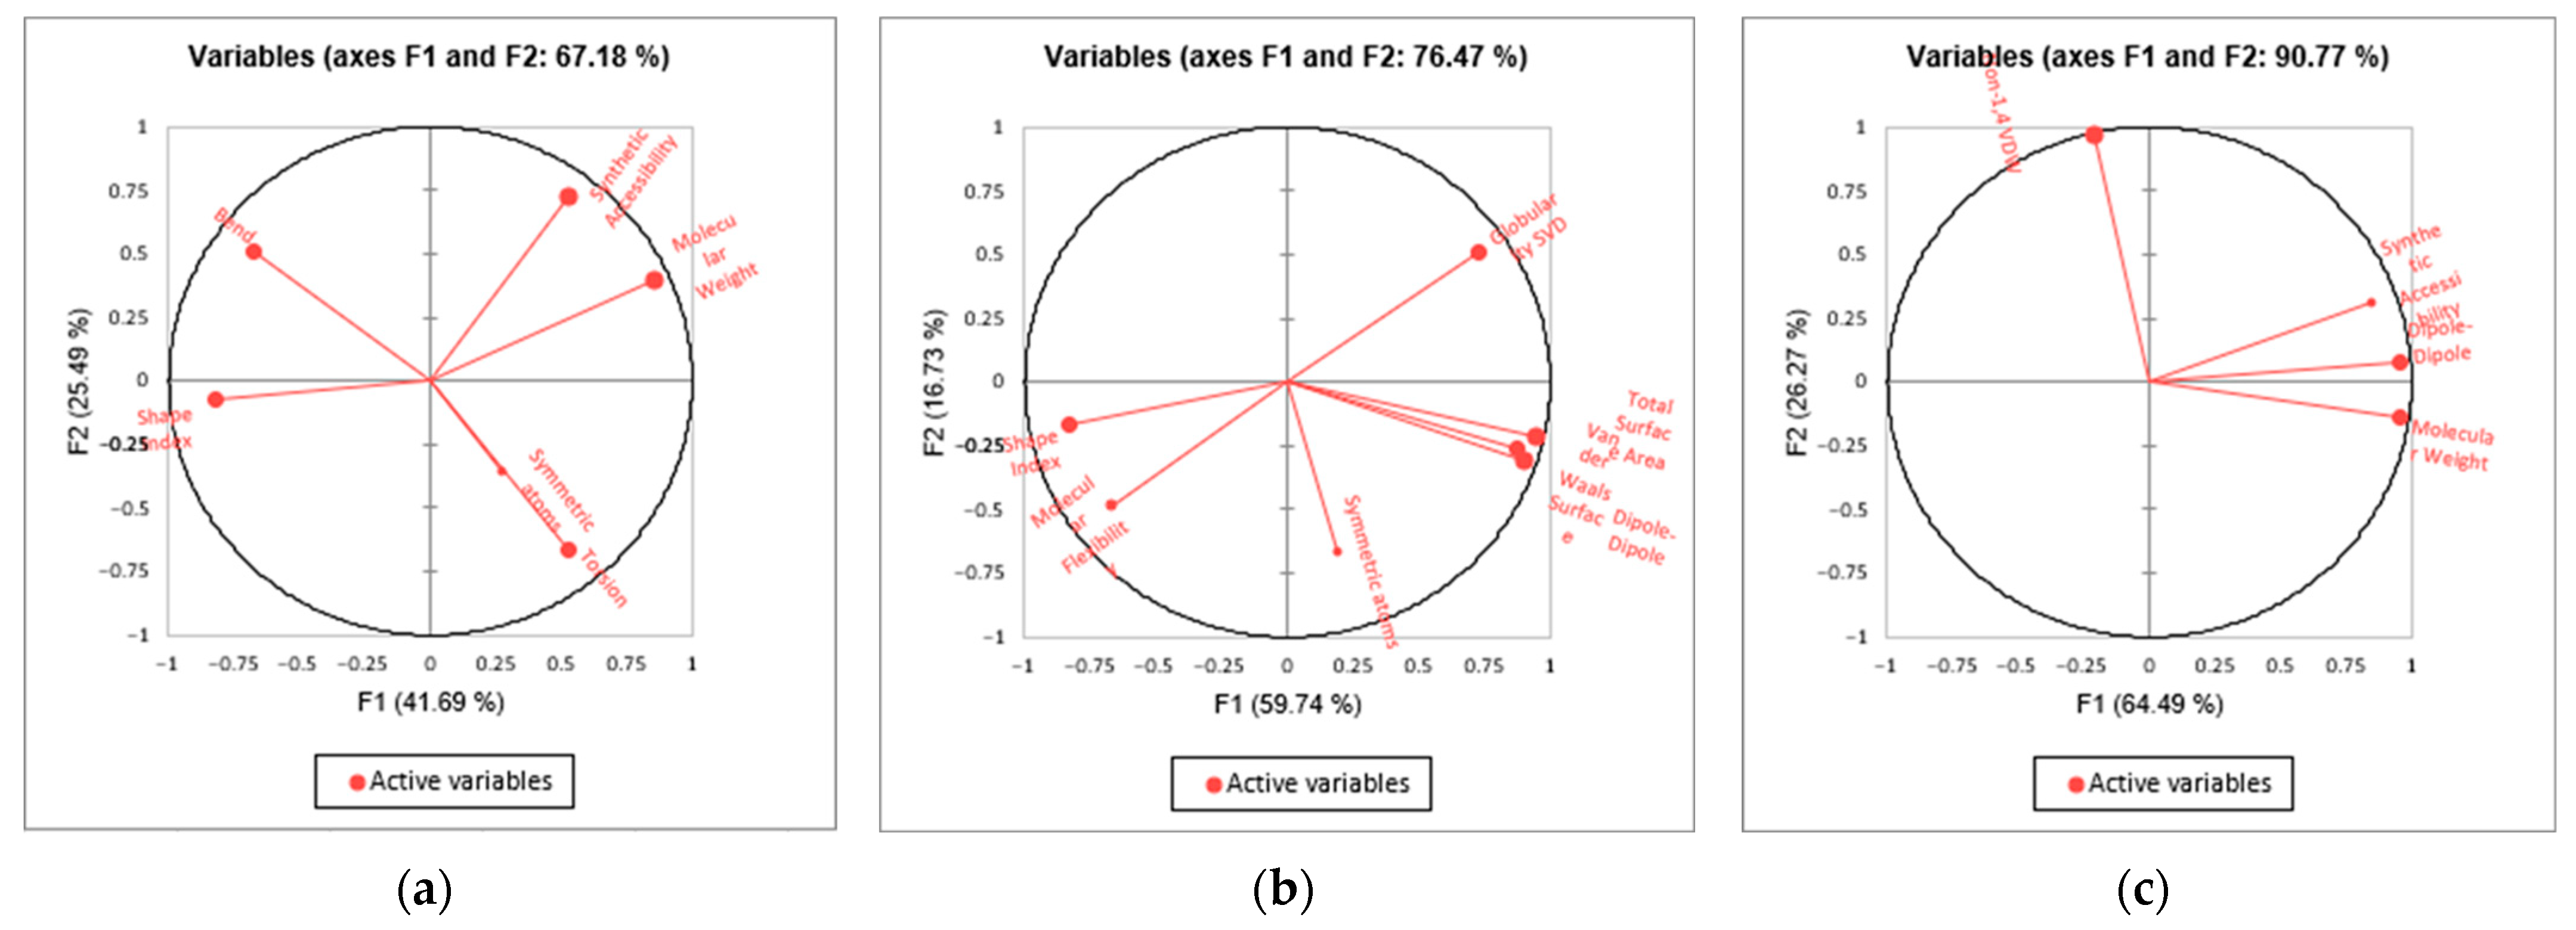
3.2. QSTR Models
- Bioconcentration log10 value (Equation (1));
- D. magna LC50 (48 h) log10 value (Equation (2));
- Fathead minnow LC50 (48 h) log10 value (Equation (3)).
- T. pyriformis IGC50 (48 h) log10 value (Equation (4));
- Fathead minnow LC50 (48 h) value (Equation (5)).
3.3. Molecular Docking
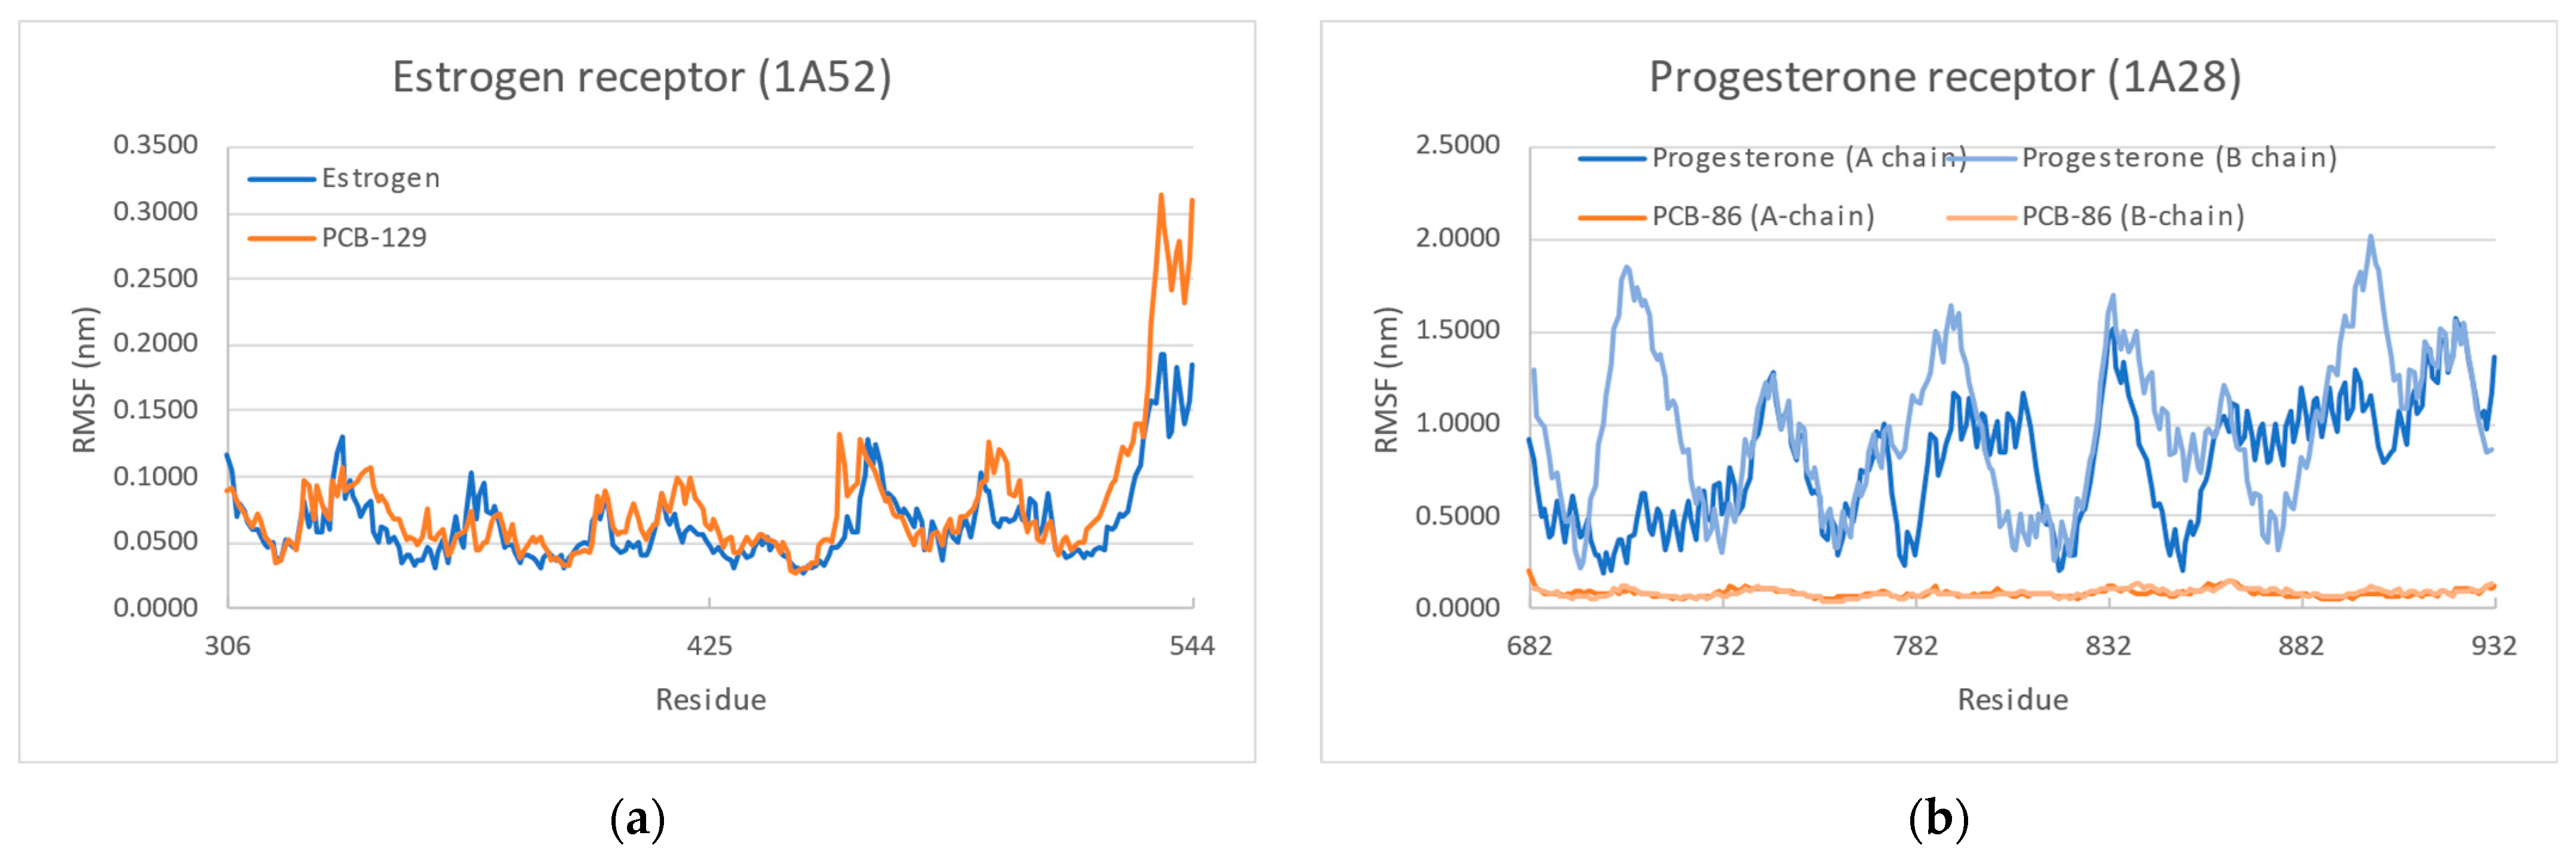
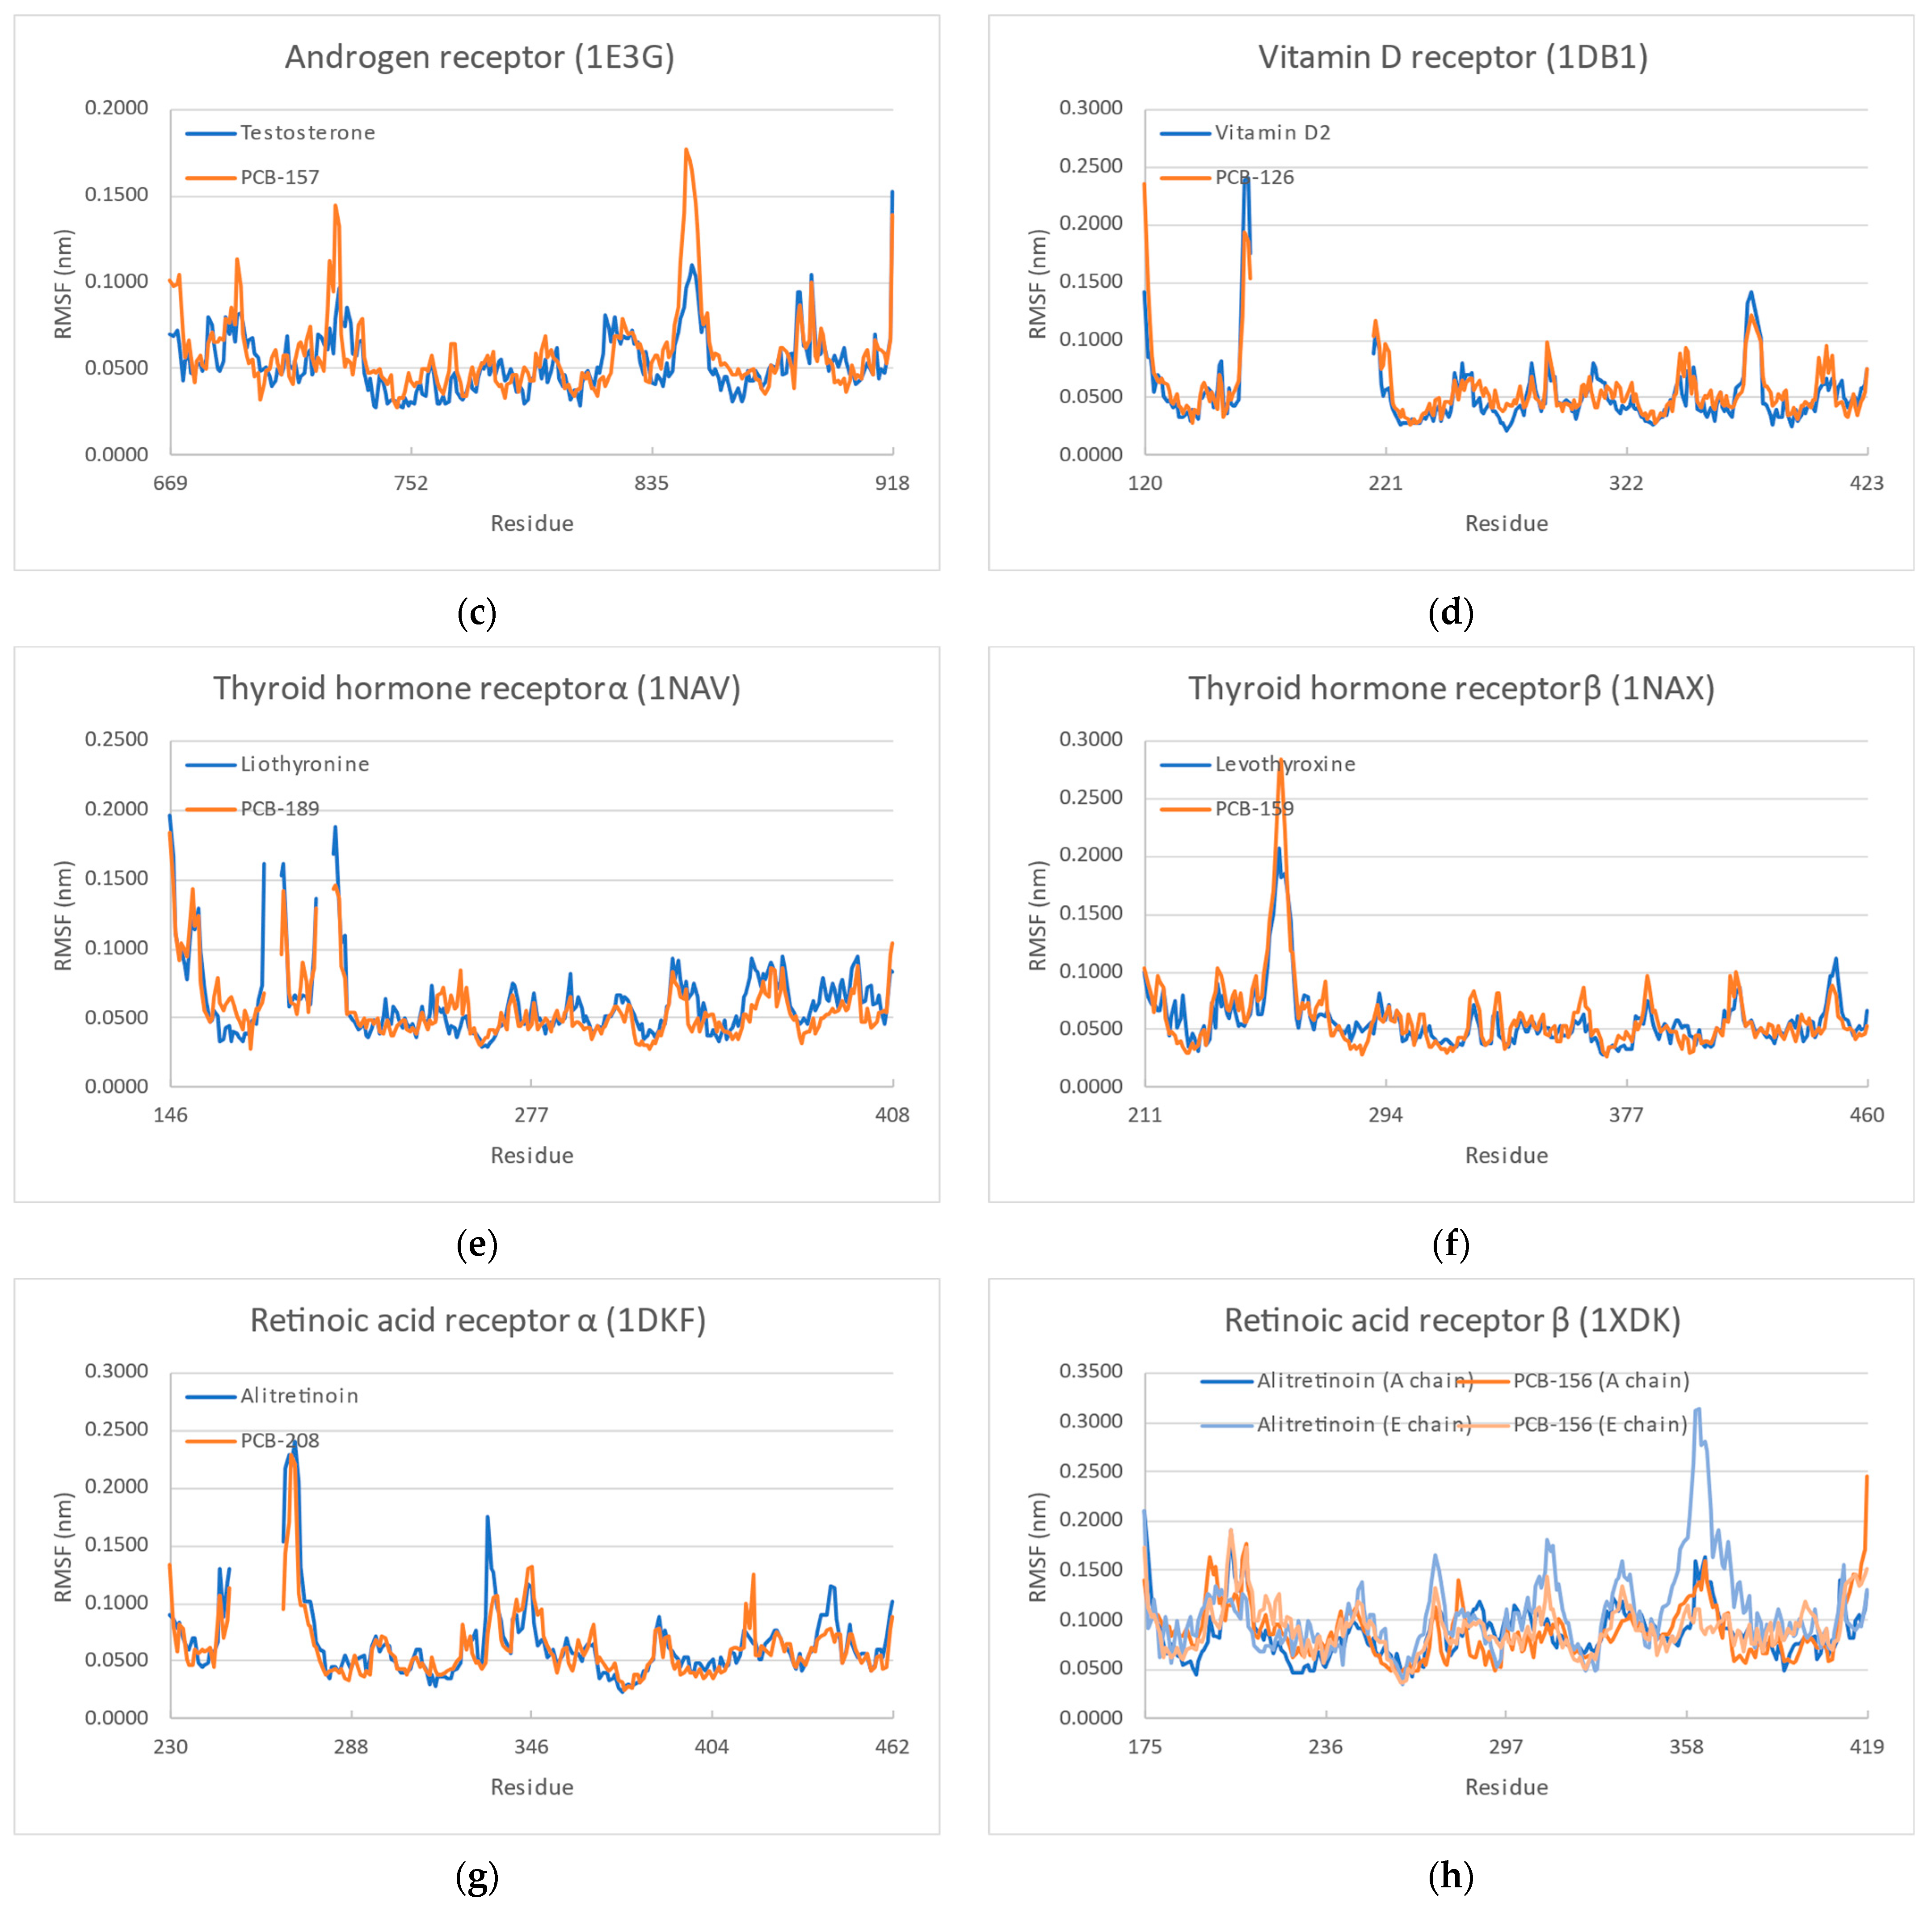
3.4. Molecular Dynamics
- Three of them have extremely favorable (<1 Å) RMSD values;
- Three of them have acceptable (1–3 Å) RMSD values; and
- Two of them have unfavorable (>3 Å) RMSD values.
4. Conclusions
Supplementary Materials
Author Contributions
Funding
Institutional Review Board Statement
Informed Consent Statement
Data Availability Statement
Conflicts of Interest
References
- Hannah, T.J.; Megson, D.; Sandau, C.D. A review of the mechanisms of by-product PCB formation in pigments, dyes and paints. Sci. Total Environ. 2022, 852, 158529. [Google Scholar] [CrossRef] [PubMed]
- Eddy, N.O. Theoretical chemistry study on the toxicity of some polychlorobiphenyl (PCB) compounds using molecular descriptors. Sci. Afr. 2020, 10, e00587. [Google Scholar] [CrossRef]
- Markowitz, G. From Industrial Toxins to Worldwide Pollutants: A Brief History of Polychlorinated Biphenyls. Public Health Rep. 2018, 133, 721–725. [Google Scholar] [CrossRef]
- Van den Berg, M.; Birnbaum, L.S.; Denison, M.; De Vito, M.; Farland, W.; Feeley, M.; Fiedler, H.; Hakansson, H.; Hanberg, A.; Haws, L.; et al. The 2005 World Health Organization Reevaluation of Human and Mammalian Toxic Equivalency Factors for Dioxins and Dioxin-Like Compounds. Toxicol. Sci. 2006, 93, 223–241. [Google Scholar] [CrossRef] [PubMed]
- Chen, S.; Sun, G.; Fan, T.; Li, F.; Xu, Y.; Zhang, N.; Zhao, L.; Zhong, R. Ecotoxicological QSAR study of fused/non-fused polycyclic aromatic hydrocarbons (FNFPAHs): Assessment and priority ranking of the acute toxicity to Pimephales promelas by QSAR and consensus modeling methods. Sci. Total Environ. 2023, 876, 162736. [Google Scholar] [CrossRef] [PubMed]
- Anh, H.Q.; Watanabe, I.; Minh, T.B.; Takahashi, S. Unintentionally produced polychlorinated biphenyls in pigments: An updated review on their formation, emission sources, contamination status, and toxic effects. Sci. Total Environ. 2021, 755, 142504. [Google Scholar] [CrossRef]
- Wang, C.; Dong, S.; Wang, P.; Hao, Y.; Wang, R.; Zhang, S.; Wang, Y.; Fan, M.; Zhang, Q.; Jiang, G. Reevaluation on accumulation and depletion of dioxin-like compounds in eggs of laying hens: Quantification on dietary risk from feed to egg. Sci. Total Environ. 2021, 801, 149690. [Google Scholar] [CrossRef]
- Nantasenamat, C.; Isarankura-Na-Ayudhya, C.; Naenna, T.; Prachayasittikul, V. A practical overview of quantitative structure-activity relationship. EXCLI J. 2009, 8, 74–88. [Google Scholar] [CrossRef]
- Wu, X.; Zhang, Q.; Hu, J. QSAR study of the acute toxicity to fathead minnow based on a large dataset. SAR QSAR Environ. Res. 2016, 27, 147–164. [Google Scholar] [CrossRef]
- Khan, P.M.; Roy, K.; Benfenati, E. Chemometric modeling of Daphnia magna toxicity of agrochemicals. Chemosphere 2019, 224, 470–479. [Google Scholar] [CrossRef]
- Jia, Q.; Wang, J.; Yan, F.; Wang, Q. A QSTR model for toxicity prediction of pesticides towards Daphnia magna. Chemosphere 2022, 291, 132980. [Google Scholar] [CrossRef]
- Li, F.; Fan, T.; Sun, G.; Zhao, L.; Zhong, R.; Peng, Y. Systematic QSAR and iQCCR modelling of fused/non-fused aromatic hydrocarbons (FNFAHs) carcinogenicity to rodents: Reducing unnecessary chemical synthesis and animal testing. Green. Chem. 2022, 24, 5304–5319. [Google Scholar] [CrossRef]
- Hao, Y.; Sun, G.; Fan, T.; Tang, X.; Zhang, J.; Liu, Y.; Zhang, N.; Zhao, L.; Zhong, R.; Peng, Y. In vivo toxicity of nitroaromatic compounds to rats: QSTR modelling and interspecies toxicity relationship with mouse. J. Hazard. Mater. 2020, 399, 122981. [Google Scholar] [CrossRef] [PubMed]
- Wang, L.L.; Ding, J.J.; Pan, L.; Fu, L.; Tian, J.H.; Cao, D.S.; Jiang, H.; Ding, X.Q. Quantitative structure-toxicity relationship model for acute toxicity of organophosphates via multiple administration routes in rats and mice. J. Hazard. Mater. 2021, 401, 123724. [Google Scholar] [CrossRef] [PubMed]
- Sun, G.; Zhang, Y.; Pei, L.; Lou, Y.; Mu, Y.; Yun, J.; Li, F.; Wang, Y.; Hao, Z.; Xi, S.; et al. Chemometric QSAR modeling of acute oral toxicity of Polycyclic Aromatic Hydrocarbons (PAHs) to rat using simple 2D descriptors and interspecies toxicity modeling with mouse. Ecotoxicol. Environ. Saf. 2021, 222, 112525. [Google Scholar] [CrossRef]
- Jillella, G.K.; Ojha, P.K.; Roy, K. Application of QSAR for the identification of key molecular fragments and reliable predictions of effects of textile dyes on growth rate and biomass values of Raphidocelis subcapitata. Aquat. Toxicol. 2021, 238, 105925. [Google Scholar] [CrossRef]
- Gramatica, P.; Cassani, S.; Sangion, A. Aquatic ecotoxicity of personal care products: QSAR models and ranking for prioritization and safer alternatives’ design. Green. Chem. 2006, 18, 4393–4406. [Google Scholar] [CrossRef]
- Nath, A.; Ojha, P.K.; Roy, K. Computational modeling of aquatic toxicity of polychlorinated naphthalenes (PCNs) employing 2D-QSAR and chemical read-across. Aquat. Toxicol. 2023, 257, 106429. [Google Scholar] [CrossRef]
- Mukherjee, R.K.; Kumar, V.; Roy, K. Chemometric modeling of plant protection products (PPPs) for the prediction of acute contact toxicity against honey bees (A. mellifera): A 2D-QSAR approach. J. Hazard. Mater. 2022, 423, 127230. [Google Scholar] [CrossRef]
- Kannan, K.; Blankenship, A.L.; Jones, P.D.; Giesy, J.P. Toxicity Reference Values for the Toxic Effects of Polychlorinated Biphenyls to Aquatic Mammals. Hum. Ecol. Risk Assess. Int. J. 2000, 6, 181–201. [Google Scholar] [CrossRef]
- Ulbrich, B.; Stahlmann, R. Developmental toxicity of polychlorinated biphenyls (PCBs): A systematic review of experimental data. Arch. Toxicol. 2004, 78, 252–268. [Google Scholar] [CrossRef] [PubMed]
- Wang, M.-Y.; Liang, J.-W.; Olounfeh, K.; Sun, Q.; Zhao, N.; Meng, F.-H. A Comprehensive In Silico Method to Study the QSTR of the Aconitine Alkaloids for Designing Novel Drugs. Molecules 2018, 23, 2385. [Google Scholar] [CrossRef] [PubMed]
- Aalizadeh, R.; von der Ohe, P.C.; Thomaidis, N.S. Prediction of acute toxicity of emerging contaminants on the water flea Daphnia magna by Ant Colony Optimization—Support Vector Machine QSTR models. Environ. Sci. Process Impacts 2017, 19, 438–448. [Google Scholar] [CrossRef] [PubMed]
- Önlü, S.; Saçan, M.T. Toxicity of contaminants of emerging concern to Dugesia japonica: QSTR modeling and toxicity relationship with Daphnia magna. J. Hazard. Mater. 2018, 351, 20–28. [Google Scholar] [CrossRef] [PubMed]
- Zani, C.; Toninelli, G.; Filisetti, B.; Donato, F. Polychlorinated Biphenyls and Cancer: An Epidemiological Assessment. J. Environ. Sci. Health Part C 2013, 31, 99–144. [Google Scholar] [CrossRef]
- Leng, L.; Li, J.; Luo, X.M.; Kim, J.Y.; Li, Y.M.; Guo, X.M.; Chen, X.; Yang, Q.Y.; Li, G.; Tang, N.J. Polychlorinated biphenyls and breast cancer: A congener-specific meta-analysis. Environ. Int. 2016, 88, 133–141. [Google Scholar] [CrossRef]
- Demers, A. Plasma Concentrations of Polychlorinated Biphenyls and the Risk of Breast Cancer: A Congener-specific Analysis. Am. J. Epidemiol. 2002, 155, 629–635. [Google Scholar] [CrossRef]
- Charlier, C.J.; Albert, A.I.; Zhang, L.; Dubois, N.G.; Plomteux, G.J. Polychlorinated biphenyls contamination in women with breast cancer. Clin. Chim. Acta 2004, 347, 177–181. [Google Scholar] [CrossRef]
- Ali, I.; Julin, B.; Glynn, A.; Högberg, J.; Berglund, M.; Johansson, J.E.; Andersson, S.O.; Andrén, O.; Giovannucci, E.; Wolk, A.; et al. Exposure to polychlorinated biphenyls and prostate cancer: Population-based prospective cohort and experimental studies. Carcinogenesis 2016, 37, bgw105. [Google Scholar] [CrossRef]
- McKinney, J.D.; Waller, C.L. Polychlorinated biphenyls as hormonally active structural analogues. Environ. Health Perspect. 1994, 102, 290–297. [Google Scholar] [CrossRef]
- Aronson, K.J.; Miller, A.B.; Woolcott, C.G.; Sterns, E.E.; McCready, D.R.; Lickley, L.A.; Fish, E.B.; Hiraki, G.Y.; Holloway, C.; Ross, T.; et al. Breast adipose tissue concentrations of polychlorinated biphenyls and other organochlorines and breast cancer risk. Cancer Epidemiol. Biomark. Prev. 2000, 9, 55–63. [Google Scholar]
- Moysich, K.B.; Menezes, R.J.; Baker, J.A.; Falkner, K.L. Environmental Exposure to Polychlorinated Biphenyls and Breast Cancer Risk. Rev. Environ. Health 2002, 17, 263–278. [Google Scholar] [CrossRef] [PubMed]
- Pourhassan, B.; Pourbabaki, R.; Omidi, F.; Kalantary, S.; Beigzadeh, Z. Meta-Analysis of Body Concentration of Polychlorinated Biphenyls and Prostate Cancer. Toxicol. Ind. Health 2022, 38, 757–772. [Google Scholar] [CrossRef] [PubMed]
- Charles, L.E. Electromagnetic Fields, Polychlorinated Biphenyls, and Prostate Cancer Mortality in Electric Utility Workers. Am. J. Epidemiol. 2003, 157, 683–691. [Google Scholar] [CrossRef] [PubMed]
- Emeville, E.; Giusti, A.; Coumoul, X.; Thomé, J.-P.; Blanchet, P.; Multigner, L. Associations of Plasma Concentrations of Dichlorodiphenyldichloroethylene and Polychlorinated Biphenyls with Prostate Cancer: A Case–Control Study in Guadeloupe (French West Indies). Environ. Health Perspect. 2015, 123, 317–323. [Google Scholar] [CrossRef] [PubMed]
- Gaum, P.M.; Lang, J.; Esser, A.; Schettgen, T.; Neulen, J.; Kraus, T.; Gube, M. Exposure to polychlorinated biphenyls and the thyroid gland—Examining and discussing possible longitudinal health effects in humans. Environ. Res. 2016, 148, 112–121. [Google Scholar] [CrossRef] [PubMed]
- Kiliç, N.; Sandal, S.; Çolakoglu, N.; Kutlu, S.; Seyran, A.; Yilmaz, B. Endocrine Disruptive Effects of Polychlorinated Biphenyls on the Thyroid Gland in Female Rats. Tohoku J. Exp. Med. 2005, 206, 327–332. [Google Scholar] [CrossRef]
- Gu, J.Y.; Qian, C.H.; Tang, W.; Wu, X.H.; Xu, K.F.; Scherbaum, W.A.; Schott, M.; Liu, C. Polychlorinated Biphenyls Affect Thyroid Function and Induce Autoimmunity in Sprague-Dawley Rats. Horm. Metab. Res. 2009, 41, 471–474. [Google Scholar] [CrossRef]
- Korach, K.S.; Sarver, P.; Chae, K.; McLachlan, J.A.; McKinney, J.D. Estrogen receptor-binding activity of polychlorinated hydroxybiphenyls: Conformationally restricted structural probes. Mol. Pharmacol. 1988, 33, 120–126. [Google Scholar]
- Jorgensen, E.C.; Li, C.H. Hormonal Proteins and Peptides; VI. Academic Press, Inc: Cambridge, MA, USA, 1978. [Google Scholar]
- Khalid, A.B.; Krum, S.A. Estrogen receptors alpha and beta in bone. Bone 2016, 87, 130–135. [Google Scholar] [CrossRef]
- Lastra, G.; Harbuz-Miller, I.; Sowers, J.R.; Manrique, C.M. Estrogen Receptor Signaling and Cardiovascular Function. In Sex Differences in Cardiovascular Physiology and Pathophysiology; Elsevier: Amsterdam, The Netherlands, 2019; pp. 13–22. [Google Scholar] [CrossRef]
- Bai, J.; Qi, Q.R.; Li, Y.; Day, R.; Makhoul, J.; Magness, R.R.; Chen, D.B. Estrogen Receptors and Estrogen-Induced Uterine Vasodilation in Pregnancy. Int. J. Mol. Sci. 2020, 21, 4349. [Google Scholar] [CrossRef] [PubMed]
- Condon, J.C.; Kyathanahalli, C.; Anamthathmakula, P.; Jeyasuria, P. Estrogen/estrogen receptor action and the pregnant myometrium. Curr. Opin. Physiol. 2020, 13, 135–140. [Google Scholar] [CrossRef]
- Smyth, C.M.; Benn, D.E.; Reeve, T.S. Influence of the menstrual cycle on the concentrations of estrogen and progesterone receptors in primary breast cancer biopsies. Breast Cancer Res. Treat. 1988, 11, 45–50. [Google Scholar] [CrossRef] [PubMed]
- Pujol, P.; Daures, J.-P.; Thezenas, S.; Guilleux, F.; Rouanet, P.; Grenier, J. Changing estrogen and progesterone receptor patterns in breast carcinoma during the menstrual cycle and menopause. Cancer 1998, 83, 698–705. [Google Scholar] [CrossRef]
- Khan, S.A.; Rogers, M.A.M.; Obando, J.A.; Tamsen, A. Estrogen Receptor Expression of Benign Breast Epithelium and Its Association with Breast Cancer. Cancer Res. 1994, 54, 993–997. [Google Scholar] [PubMed]
- Critchley, H.O.D.; Maybin, J.A.; Armstrong, G.M.; Williams, A.R.W. Physiology of the Endometrium and Regulation of Menstruation. Physiol. Rev. 2020, 100, 1149–1179. [Google Scholar] [CrossRef] [PubMed]
- Wetendorf, M.; DeMayo, F.J. Progesterone receptor signaling in the initiation of pregnancy and preservation of a healthy uterus. Int. J. Dev. Biol. 2014, 58, 95–106. [Google Scholar] [CrossRef] [PubMed]
- Mulac-Jericevic, B.; Conneely, O.M. Reproductive tissue selective actions of progesterone receptors. Reproduction 2004, 128, 139–146. [Google Scholar] [CrossRef]
- Hamilton, J.B.; Montagna, W.; Ellis, R.A. The Biology of Hair Growth; Academic Press: Cambridge, MA, USA, 1958. [Google Scholar]
- Kadi, F. Cellular and molecular mechanisms responsible for the action of testosterone on human skeletal muscle. A basis for illegal performance enhancement. Br. J. Pharmacol. 2008, 154, 522–528. [Google Scholar] [CrossRef]
- Zamponi, V.; Mazzilli, R.; Mazzilli, F.; Fantini, M. Effect of sex hormones on human voice physiology: From childhood to senescence. Hormones 2021, 20, 691–696. [Google Scholar] [CrossRef]
- Chen, J.-F.; Lin, P.-W.; Tsai, Y.-R.; Yang, Y.-C.; Kang, H.-Y. Androgens and Androgen Receptor Actions on Bone Health and Disease: From Androgen Deficiency to Androgen Therapy. Cells 2019, 8, 1318. [Google Scholar] [CrossRef] [PubMed]
- Heinlein, C.A.; Chang, C. Androgen Receptor in Prostate Cancer. Endocr. Rev. 2004, 25, 276–308. [Google Scholar] [CrossRef] [PubMed]
- Fleet, J.C.; Schoch, R.D. Molecular mechanisms for regulation of intestinal calcium absorption by vitamin D and other factors. Crit. Rev. Clin. Lab. Sci. 2010, 47, 181–195. [Google Scholar] [CrossRef]
- Adorini, L.; Daniel, K.; Penna, G. Vitamin D Receptor Agonists, Cancer and the Immune System: An Intricate Relationship. Curr. Top. Med. Chem. 2006, 6, 1297–1301. [Google Scholar] [CrossRef] [PubMed]
- Akimbekov, N.S.; Digel, I.; Sherelkhan, D.K.; Razzaque, M.S. Vitamin D and Phosphate Interactions in Health and Disease. Adv. Exp. Med. Biol. 2022, 1362, 37–46. [Google Scholar] [CrossRef] [PubMed]
- McCann, L.M.; Beto, J. Roles of calcium-sensing receptor and vitamin d receptor in the pathophysiology of secondary hyperparathyroidism. J. Ren. Nutr. 2010, 20, 141–150. [Google Scholar] [CrossRef] [PubMed]
- Bikle, D.D. Vitamin D and Bone. Curr. Osteoporos. Rep. 2012, 10, 151–159. [Google Scholar] [CrossRef] [PubMed]
- Pike, J.W.; Meyer, M.B. The Vitamin D Receptor: New Paradigms for the Regulation of Gene Expression by 1,25-Dihydroxyvitamin D3. Endocrinol. Metab. Clin. N. Am. 2010, 39, 255–269. [Google Scholar] [CrossRef]
- Yen, P.M. Physiological and Molecular Basis of Thyroid Hormone Action. Physiol. Rev. 2001, 81, 1097–1142. [Google Scholar] [CrossRef]
- Harvey, C.B.; Williams, G.R. Mechanism of Thyroid Hormone Action. Thyroid 2002, 12, 441–446. [Google Scholar] [CrossRef]
- Brent, G.A. Tissue-specific actions of thyroid hormone: Insights from animal models. Rev. Endocr. Metab. Disord. 2000, 1, 27–33. [Google Scholar] [CrossRef] [PubMed]
- Sinha, R.A.; Singh, B.K.; Yen, P.M. Direct effects of thyroid hormones on hepatic lipid metabolism. Nat. Rev. Endocrinol. 2018, 14, 259–269. [Google Scholar] [CrossRef] [PubMed]
- Brent, G.A. Mechanisms of thyroid hormone action. J. Clin. Investig. 2012, 122, 3035–3043. [Google Scholar] [CrossRef] [PubMed]
- Kam, R.K.T.; Deng, Y.; Chen, Y.; Zhao, H. Retinoic acid synthesis and functions in early embryonic development. Cell Biosci. 2012, 2, 11. [Google Scholar] [CrossRef]
- Zhang, J.; Gao, Y.; Yu, M.; Wu, H.; Ai, Z.; Wu, Y.; Liu, H.; Du, J.; Guo, Z.; Zhang, Y. Retinoic Acid Induces Embryonic Stem Cell Differentiation by Altering Both Encoding RNA and microRNA Expression. PLoS ONE 2015, 10, e0132566. [Google Scholar] [CrossRef] [PubMed]
- Amamoto, R.; Wallick, G.K.; Cepko, C.L. Retinoic acid signaling mediates peripheral cone photoreceptor survival in a mouse model of retina degeneration. Elife 2022, 11, 76389. [Google Scholar] [CrossRef] [PubMed]
- Pino-Lagos, K.; Benson, M.J.; Noelle, R.J. Retinoic Acid in the Immune System. Ann. N. Y Acad. Sci. 2008, 1143, 170–187. [Google Scholar] [CrossRef] [PubMed]
- Szymański, Ł.; Skopek, R.; Palusińska, M.; Schenk, T.; Stengel, S.; Lewicki, S.; Kraj, L.; Kamiński, P.; Zelent, A. Retinoic Acid and Its Derivatives in Skin. Cells 2020, 9, 2660. [Google Scholar] [CrossRef]
- Zhang, X.; Liu, Y.; Lee, M.-O. Retinoid receptors in human lung cancer and breast cancer. Mutat. Res. Fundam. Mol. Mech. Mutagen. 1996, 350, 267–277. [Google Scholar] [CrossRef]
- Chambon, P. A decade of molecular biology of retinoic acid receptors. FASEB J. 1996, 10, 940–954. [Google Scholar] [CrossRef]
- Sander, T.; Freyss, J.; von Korff, M.; Rufener, C. DataWarrior: An Open-Source Program For Chemistry Aware Data Visualization And Analysis. J. Chem. Inf. Model. 2015, 55, 460–473. [Google Scholar] [CrossRef] [PubMed]
- Daina, A.; Michielin, O.; Zoete, V. SwissADME: A free web tool to evaluate pharmacokinetics, drug-likeness and medicinal chemistry friendliness of small molecules. Sci. Rep. 2017, 7, 42717. [Google Scholar] [CrossRef] [PubMed]
- Martin, T. Toxicity Estimation Software Tool (TEST); U.S. Environmental Protection Agency: Cincinnati, OH, USA, 2020. [Google Scholar]
- Maki, A.W. Correlations Between Daphnia magna and Fathead Minnow (Pimephales promelas) Chronic Toxicity Values for Several Classes of Test Substances. J. Fish. Res. Board. Can. 1979, 36, 411–421. [Google Scholar] [CrossRef]
- Johnson, W.W.; Finley, M.T. Handbook of Acute Toxicity of Chemicals to Fish and Aquatic Invertebrates; United States Department of the Interior Fish and Wildlife Service: Washington, DC, USA, 1980. [Google Scholar]
- Addinsoft XLSTAT Statistical and Data Analysis Solution. 2022. Available online: https://xlstat.com (accessed on 9 June 2023).
- Vilar, S.; Cozza, G.; Moro, S. Medicinal Chemistry and the Molecular Operating Environment (MOE): Application of QSAR and Molecular Docking to Drug Discovery. Curr. Top. Med. Chem. 2008, 8, 1555–1572. [Google Scholar] [CrossRef] [PubMed]
- Tanenbaum, D.M.; Wang, Y.; Williams, S.P.; Sigler, P.B. Crystallographic comparison of the estrogen and progesterone receptor’s ligand binding domains. Proc. Natl. Acad. Sci. USA 1998, 95, 5998–6003. [Google Scholar] [CrossRef] [PubMed]
- Williams, S.P.; Sigler, P.B. Atomic structure of progesterone complexed with its receptor. Nature 1998, 393, 392–396. [Google Scholar] [CrossRef] [PubMed]
- Matias, P.M.; Donner, P.; Coelho, R.; Thomaz, M.; Peixoto, C.; Macedo, S.; Otto, N.; Joschko, S.; Scholz, P.; Wegg, A.; et al. Structural Evidence for Ligand Specificity in the Binding Domain of the Human Androgen Receptor. J. Biol. Chem. 2000, 275, 26164–26171. [Google Scholar] [CrossRef]
- Rochel, N.; Wurtz, J.M.; Mitschler, A.; Klaholz, B.; Moras, D. The Crystal Structure of the Nuclear Receptor for Vitamin D Bound to Its Natural Ligand. Mol. Cell 2000, 5, 173–179. [Google Scholar] [CrossRef]
- Ye, L.; Li, Y.L.; Mellström, K.; Mellin, C.; Bladh, L.G.; Koehler, K.; Garg, N.; Garcia Collazo, A.M.; Litten, C.; Husman, B.; et al. Thyroid Receptor Ligands. 1. Agonist Ligands Selective for the Thyroid Receptor β1. J. Med. Chem. 2003, 46, 1580–1588. [Google Scholar] [CrossRef]
- Bourguet, W.; Vivat, V.; Wurtz, J.-M.; Chambon, P.; Gronemeyer, H.; Moras, D. Crystal Structure of a Heterodimeric Complex of RAR and RXR Ligand-Binding Domains. Mol. Cell 2000, 5, 289–298. [Google Scholar] [CrossRef]
- Pogenberg, V.; Guichou, J.F.; Vivat-Hannah, V.; Kammerer, S.; Pérez, E.; Germain, P.; de Lera, A.R.; Gronemeyer, H.; Royer, C.A.; Bourguet, W. Characterization of the Interaction between Retinoic Acid Receptor/Retinoid X Receptor (RAR/RXR) Heterodimers and Transcriptional Coactivators through Structural and Fluorescence Anisotropy Studies. J. Biol. Chem. 2005, 280, 1625–1633. [Google Scholar] [CrossRef] [PubMed]
- Dassault Systèmes. BIOVIA Discovery Studio; Dassault Systèmes: San Diego, CA, USA, 2021. [Google Scholar]
- Trott, O.; Olson, A.J. AutoDock Vina: Improving the speed and accuracy of docking with a new scoring function, efficient optimization, and multithreading. J. Comput. Chem. 2009, 31, 455–461. [Google Scholar] [CrossRef] [PubMed]
- Eberhardt, J.; Santos-Martins, D.; Tillack, A.F.; Forli, S. AutoDock Vina 1.2.0: New Docking Methods, Expanded Force Field, and Python Bindings. J. Chem. Inf. Model. 2021, 61, 3891–3898. [Google Scholar] [CrossRef] [PubMed]
- GROMACS 2023. 2 Manual. Zenodo 2023. [Google Scholar] [CrossRef]
- Huang, J.; MacKerell, A.D. CHARMM36 all-atom additive protein force field: Validation based on comparison to NMR data. J. Comput. Chem. 2013, 34, 2135–2145. [Google Scholar] [CrossRef]
- Boonstra, S.; Onck, P.R.; van der Giessen, E. CHARMM TIP3P Water Model Suppresses Peptide Folding by Solvating the Unfolded State. J. Phys. Chem. B 2016, 120, 3692–3698. [Google Scholar] [CrossRef]


| Nuclear Receptor | Physiological Function | Dysfunction |
|---|---|---|
| Estrogen receptor | Bone health maintenance [41] Secondary sex characteristic development Cardiovascular regulation [42] Pregnancy support [43,44] Menstrual cycle support [45,46] | Breast and ovarian cancers [47] |
| Progesterone receptor | Breast development [47] Menstrual cycle regulation [48] Pregnancy regulation [49] | Endometriosis and infertility [50] |
| Androgen receptor | Facial and body hair growth [51] Muscle development [52] Voice deepening [53] Bone health maintenance [54] | Androgen insensitivity syndrome and prostate cancer [55] |
| Vitamin D receptor | Mineral metabolism [56] Immune response regulation [57] Inorganic phosphate homeostasis [58] Calcium homeostasis [59] Bone health maintenance [60] | Autoimmune diseases, cancer, and cardiovascular disorders [61] |
| Thyroid hormone receptor | Development regulation [62] Heart regulation [63] Metabolism regulation [64] Lipid metabolism [65] | Thyroid hormone resistance Hypo- and hyperthyroidism [66] |
| Retinoic acid receptor | Embryonic development [67] Stem cell differentiation [68] Organ development [67] Vision regulation [69] Immune regulation [70] Skin regulation [71] | Lung and breast cancer [72] Congenital malformations and skin diseases [73] |
| Correlated Descriptor | Model | ||
|---|---|---|---|
| (1) | (2) | (3) | |
| Molecular weight | ✓ | ✓ | |
| Symmetric atoms | ✓ | ✓ | |
| Total surface area | ✓ | ||
| Globularity (SVD) | ✓ | ||
| Shape index | ✓ | ✓ | |
| Molecular flexibility | ✓ | ||
| Bend energies | ✓ | ||
| Torsion energies | ✓ | ||
| Non-1,4 VDW energies | ✓ | ||
| Dipole–dipole energies | ✓ | ✓ | |
| Synthetic accessibility | ✓ | ✓ | |
| correlated descriptors | 6 | 6 | 4 |
| Receptor | Ligand | Binding (kcal/mol) | Interactions * | |||||
|---|---|---|---|---|---|---|---|---|
| HP | HB | H | S | H/HB | E | |||
| Estrogen | PCB-129 | −9.319 | 10 | 0 | 0 | 0 | 0 | 0 |
| PCB-170 | −9.121 | 11 | 0 | 0 | 0 | 0 | 0 | |
| PCB-171 | −9.022 | 8 | 0 | 2 | 0 | 0 | 0 | |
| Progesterone | PCB-86 | −8.921 | 8 | 0 | 0 | 0 | 0 | 0 |
| PCB-129 | −8.898 | 10 | 0 | 0 | 0 | 0 | 0 | |
| PCB-150 | −8.839 | 8 | 0 | 0 | 0 | 0 | 0 | |
| Androgen | PCB-157 | −9.121 | 12 | 0 | 1 | 0 | 0 | 0 |
| PCB-156 | −9.102 | 11 | 0 | 1 | 0 | 0 | 0 | |
| PCB-105 | −8.999 | 14 | 0 | 0 | 0 | 0 | 0 | |
| Vitamin D | PCB-126 | −8.802 | 18 | 0 | 0 | 1 | 0 | 0 |
| PCB-123 | −8.776 | 13 | 0 | 0 | 0 | 0 | 0 | |
| PCB-66 | −8.762 | 12 | 0 | 0 | 0 | 0 | 0 | |
| THR-α | PCB-189 | −9.693 | 16 | 1 | 1 | 0 | 0 | 0 |
| PCB-156 | −9.620 | 15 | 3 | 0 | 0 | 0 | 0 | |
| PCB-106 | −9.342 | 15 | 2 | 0 | 0 | 0 | 0 | |
| THR-β | PCB-159 | −9.744 | 17 | 2 | 1 | 1 | 0 | 1 |
| PCB-108 | −9.424 | 17 | 2 | 1 | 1 | 0 | 0 | |
| PCB-111 | −9.422 | 21 | 2 | 1 | 1 | 0 | 0 | |
| RAR-α | PCB-208 | −9.334 | 8 | 1 | 0 | 1 | 0 | 0 |
| PCB-199 | −9.220 | 11 | 1 | 0 | 1 | 0 | 0 | |
| PCB-198 | −9.097 | 7 | 1 | 0 | 1 | 0 | 0 | |
| THR-β | PCB-156 | −10.190 | 17 | 0 | 0 | 0 | 0 | 0 |
| PCB-167 | −10.180 | 20 | 0 | 0 | 0 | 0 | 0 | |
| PCB-191 | −10.160 | 17 | 0 | 1 | 0 | 1 | 0 | |
| Receptor | Ligand | RMSD (Å) |
|---|---|---|
| 1A52 Estrogen receptor | Estrogen | 0.867 |
| PCB-129 | 1.770 | |
| 1A28 Progesterone receptor | Progesterone | 0.688 |
| PCB-86 | 72.702 | |
| 1E3G Androgen receptor | Testosterone | 0.822 |
| PCB-157 | 1.514 | |
| 1DB1 Vitamin D receptor | Vitamin D2 | 0.245 |
| PCB-126 | 0.949 | |
| 1NAV Thyroid hormone receptor α | Liothyronine (T3) | 0.750 |
| PCB-189 | 0.863 | |
| 1NAX Thyroid hormone receptor β | Levothyroxine (T4) | 0.366 |
| PCB-159 | 0.736 | |
| 1DKF Retinoic acid receptor α | Alitretinoin | 0.902 |
| PCB-208 | 2.076 | |
| 1XDK Retinoic acid receptor β | Alitretinoin | 0.051 |
| PCB-156 | 27.997 |
| Receptor | Ligand | Total Interacting Energy (kcal/mol) |
|---|---|---|
| 1A52 Estrogen receptor | Estrogen | 55.576 ± 3.754 |
| PCB-129 | 38.714 ± 1.981 | |
| 1A28 Progesterone receptor | Progesterone | 50.825 ± 3.743 |
| PCB-86 | 31.388 ± 2.778 | |
| 1E3G Androgen receptor | Testosterone | 42.381 ± 1.412 |
| PCB-157 | 37.717 ± 2.911 | |
| 1DB1 Vitamin D receptor | Vitamin D2 | 61.509 ± 3.064 |
| PCB-126 | 36.917 ± 1.386 | |
| 1NAV Thyroid hormone receptor α | Liothyronine (T3) | 64.077 ± 3.703 |
| PCB-189 | 49.320 ± 2.681 | |
| 1NAX Thyroid hormone receptor β | Levothyroxine (T4) | 59.820 ± 4.351 |
| PCB-159 | 45.184 ± 1.475 | |
| 1DKF Retinoic acid receptor α | Alitretinoin | 40.208 ± 2.010 |
| PCB-208 | 38.392 ± 2.708 | |
| 1XDK Retinoic acid receptor β | Alitretinoin | 53.306 ± 3.258 |
| PCB-156 | 37.790 ± 2.444 |
| Nuclear Receptor | Natural Ligand | PCB | ||
|---|---|---|---|---|
| Name | Docking Score | Name | Docking Score | |
| ER | Estradiol | −10.700 | PCB-129 | −9.319 |
| PR | Progesterone | −11.450 | PCB-86 | −8.921 |
| AR | Testosterone | −8.289 | PCB-157 | −9.121 |
| VDR | Vitamin D2 | −12.220 | PCB-126 | −8.802 |
| THRα | T3 | −9.086 | PCB-189 | −9.693 |
| THRβ | T3 | −6.649 | PCB-159 | −9.744 |
| RARα | Tretinoin | −6.925 | PCB-208 | −9.334 |
| RARβ | Tretinoin | −6.925 | PCB-156 | −10.190 |
Disclaimer/Publisher’s Note: The statements, opinions and data contained in all publications are solely those of the individual author(s) and contributor(s) and not of MDPI and/or the editor(s). MDPI and/or the editor(s) disclaim responsibility for any injury to people or property resulting from any ideas, methods, instructions or products referred to in the content. |
© 2024 by the authors. Licensee MDPI, Basel, Switzerland. This article is an open access article distributed under the terms and conditions of the Creative Commons Attribution (CC BY) license (https://creativecommons.org/licenses/by/4.0/).
Share and Cite
Carrera, A.R.M.; Eleazar, E.G.; Caparanga, A.R.; Tayo, L.L. Theoretical Studies on the Quantitative Structure–Toxicity Relationship of Polychlorinated Biphenyl Congeners Reveal High Affinity Binding to Multiple Human Nuclear Receptors. Toxics 2024, 12, 49. https://doi.org/10.3390/toxics12010049
Carrera ARM, Eleazar EG, Caparanga AR, Tayo LL. Theoretical Studies on the Quantitative Structure–Toxicity Relationship of Polychlorinated Biphenyl Congeners Reveal High Affinity Binding to Multiple Human Nuclear Receptors. Toxics. 2024; 12(1):49. https://doi.org/10.3390/toxics12010049
Chicago/Turabian StyleCarrera, Andrei Raphael M., Elisa G. Eleazar, Alvin R. Caparanga, and Lemmuel L. Tayo. 2024. "Theoretical Studies on the Quantitative Structure–Toxicity Relationship of Polychlorinated Biphenyl Congeners Reveal High Affinity Binding to Multiple Human Nuclear Receptors" Toxics 12, no. 1: 49. https://doi.org/10.3390/toxics12010049
APA StyleCarrera, A. R. M., Eleazar, E. G., Caparanga, A. R., & Tayo, L. L. (2024). Theoretical Studies on the Quantitative Structure–Toxicity Relationship of Polychlorinated Biphenyl Congeners Reveal High Affinity Binding to Multiple Human Nuclear Receptors. Toxics, 12(1), 49. https://doi.org/10.3390/toxics12010049