
The Role of Vitamin E in Protecting against Oxidative Stress, Inflammation, and the Neurotoxic Effects of Acute Paracetamol in Pregnant Female Rats

 , , ,
, , , 
Abstract
1. Introduction
2. Materials and Methods
2.1. Animals
2.2. Drugs
2.3. Experimental Procedure
2.4. Blood Biochemistry: Hepatotoxicity
2.4.1. Alanine Aminotransferase (ALT)
2.4.2. Aspartate Aminotransferase (AST)
2.5. Blood Biochemistry: Nephrotoxicity
2.5.1. Serum Creatinine (SCr)
2.5.2. Blood Urea Nitrogen (BUN)
2.6. Brain Tissue Harvesting
2.7. Tissue Preparation
2.8. Antioxidant Status
2.8.1. Uric Acid (UA)
2.8.2. Superoxide Dismutase (SOD)
2.9. Real-Time, Quantitative PCR
2.10. Statistical Analysis
3. Results
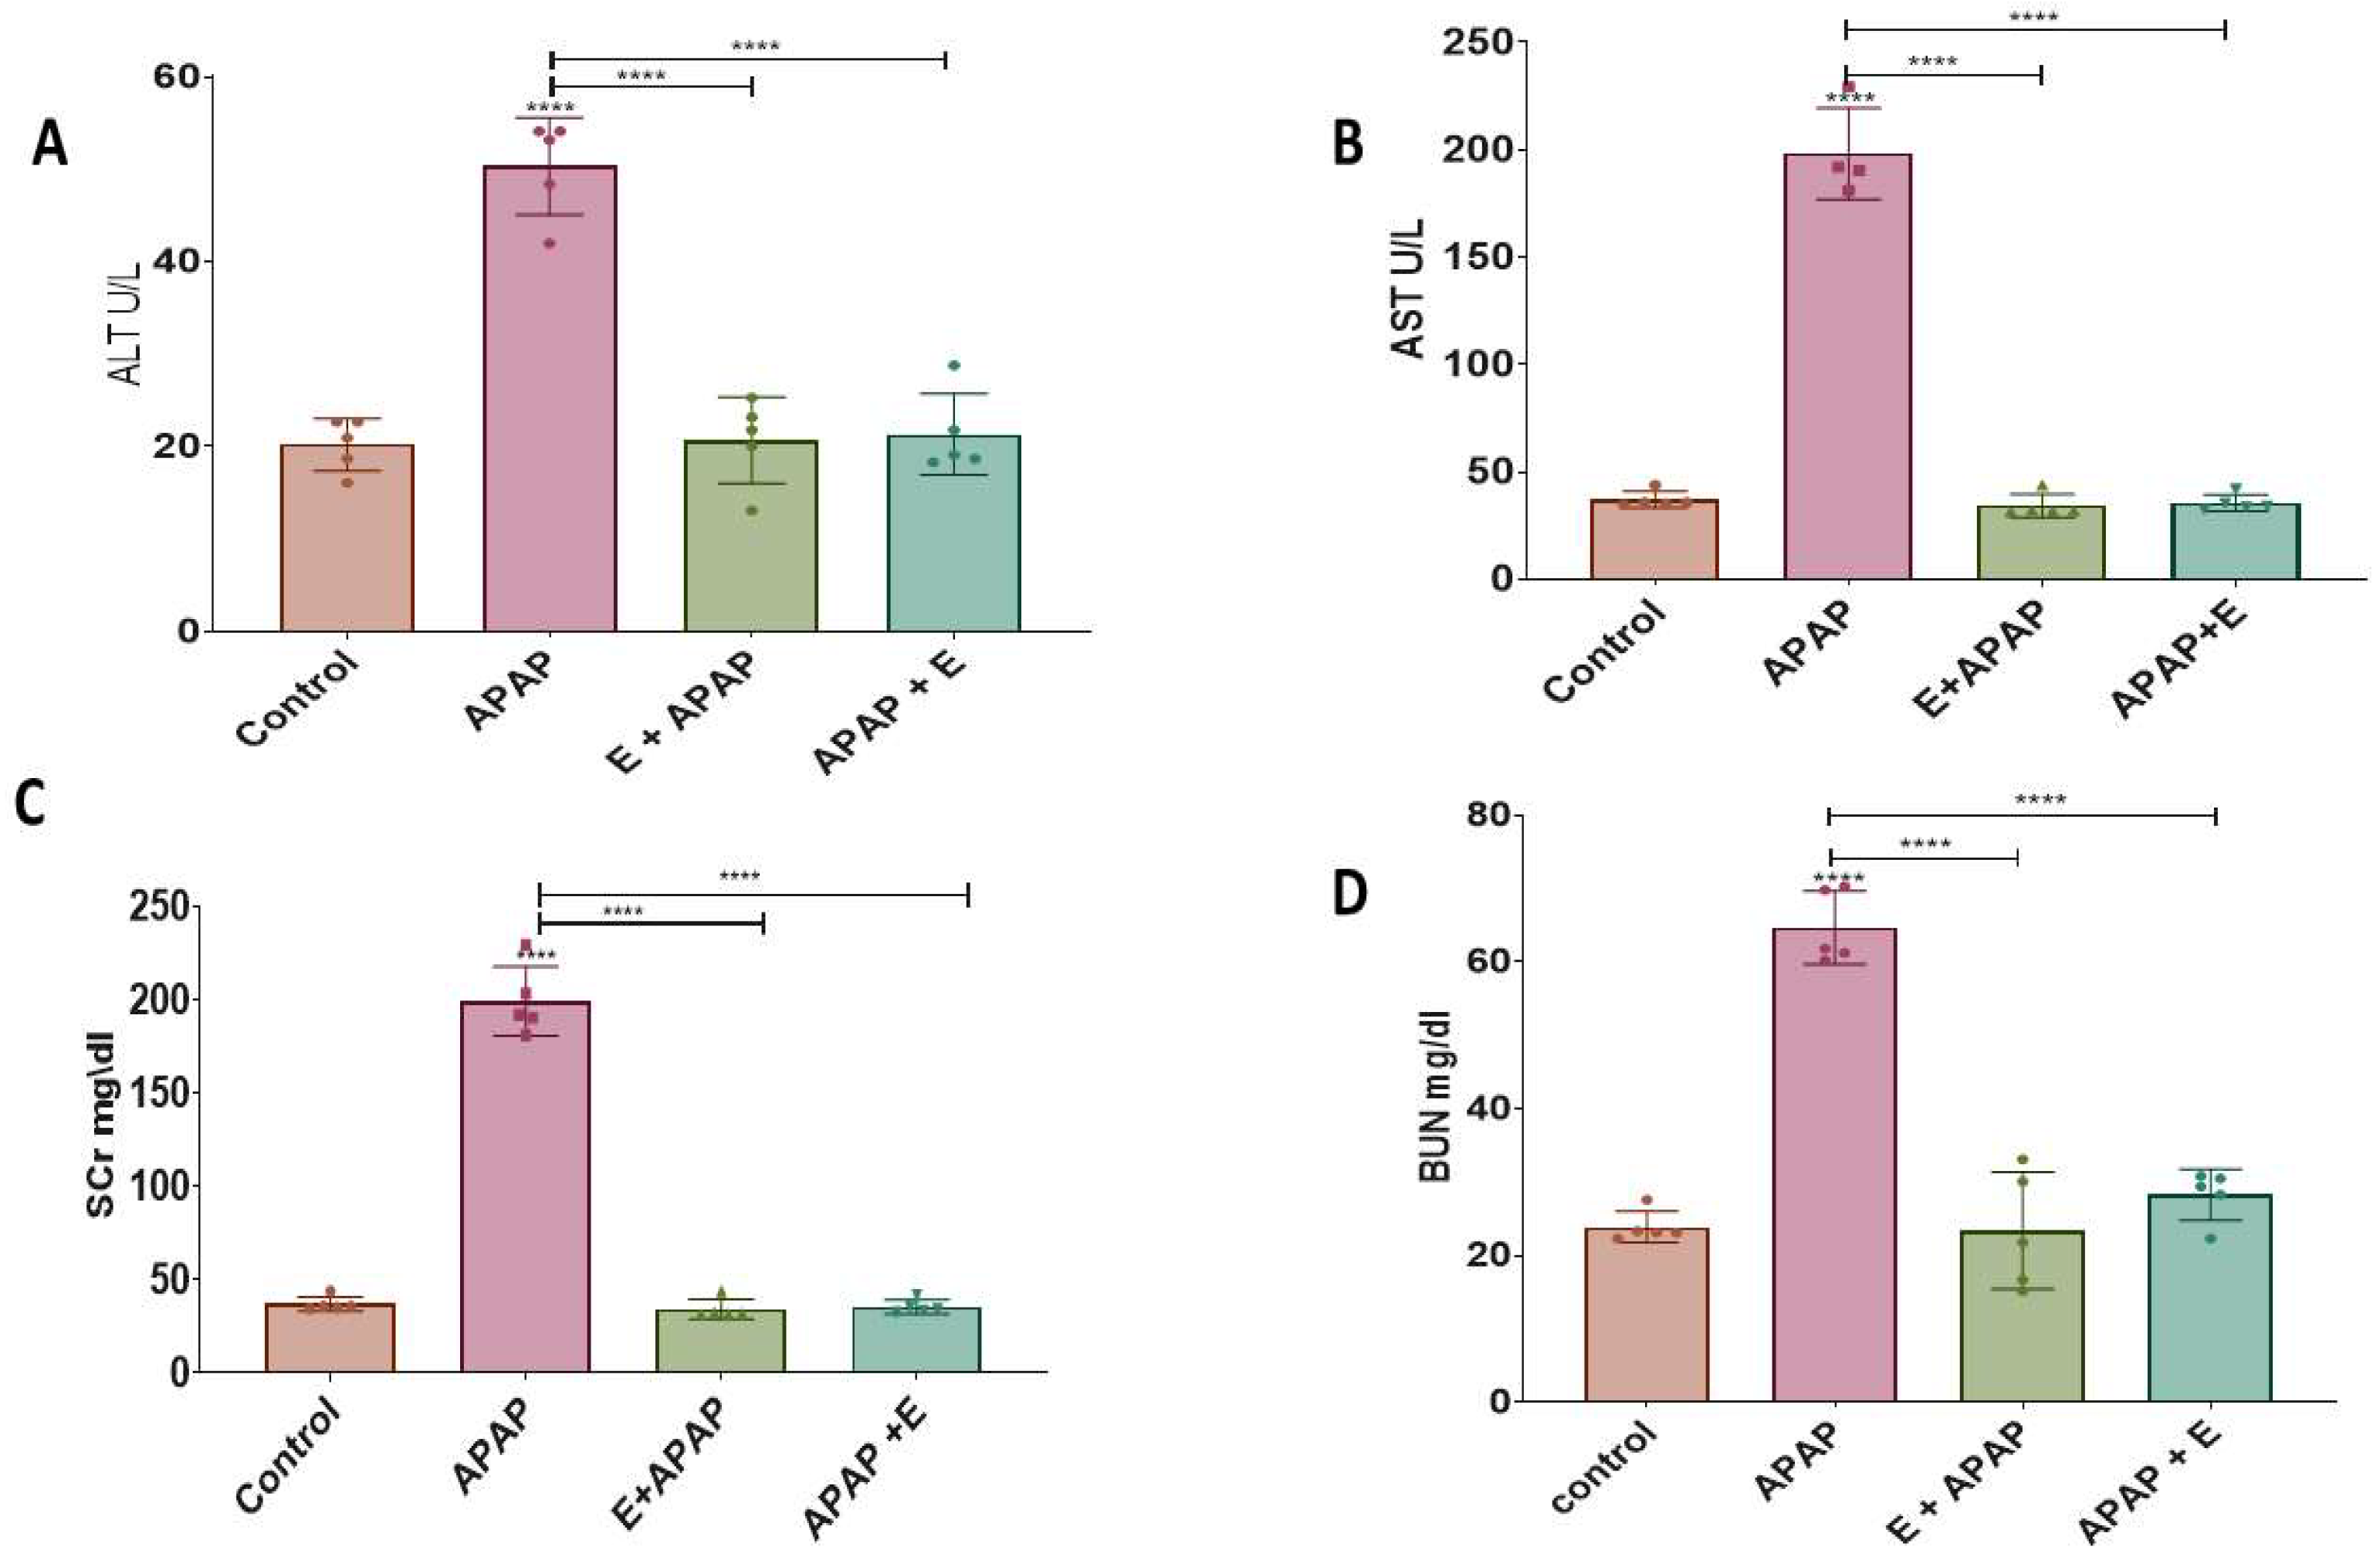
3.1. Blood Biochemistry: Hepatotoxicity
3.1.1. Alanine Aminotransferase (ALT)
3.1.2. Aspartate Aminotransferase (AST)
3.2. Blood Biochemistry: Nephrotoxicity
3.2.1. Serum Creatinine (SCr)
3.2.2. Blood Urea Nitrogen (BUN)
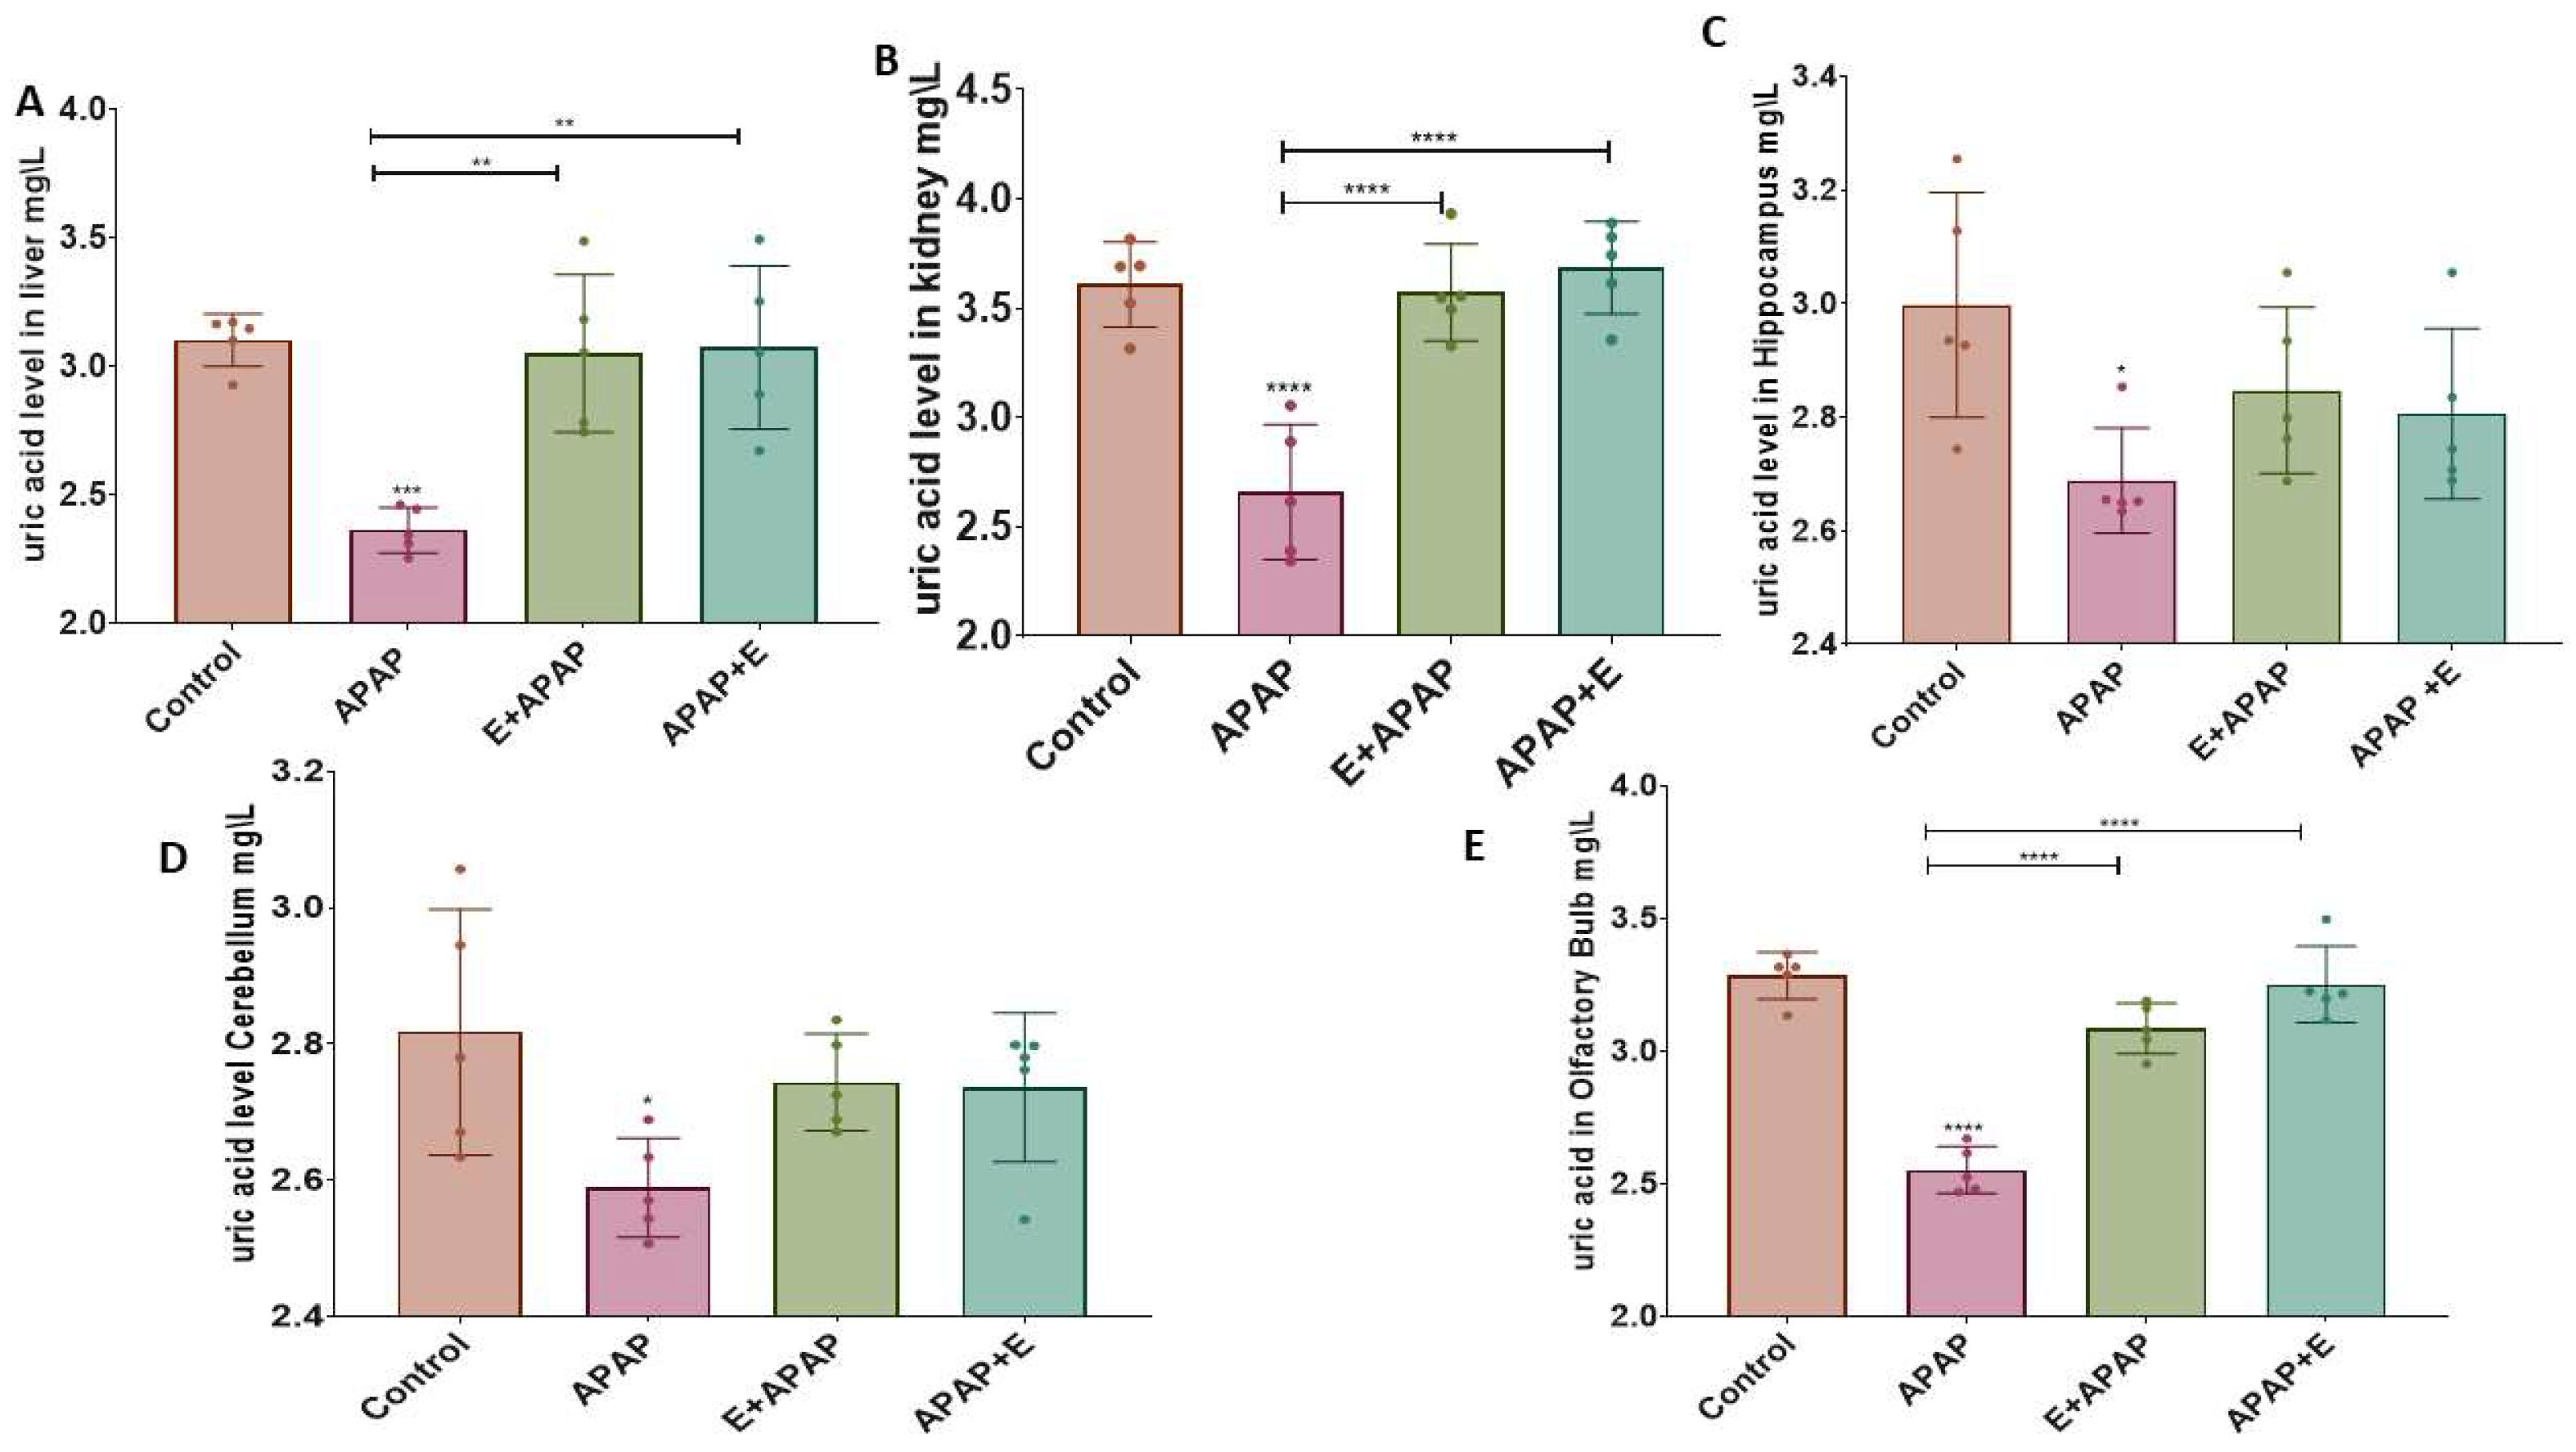
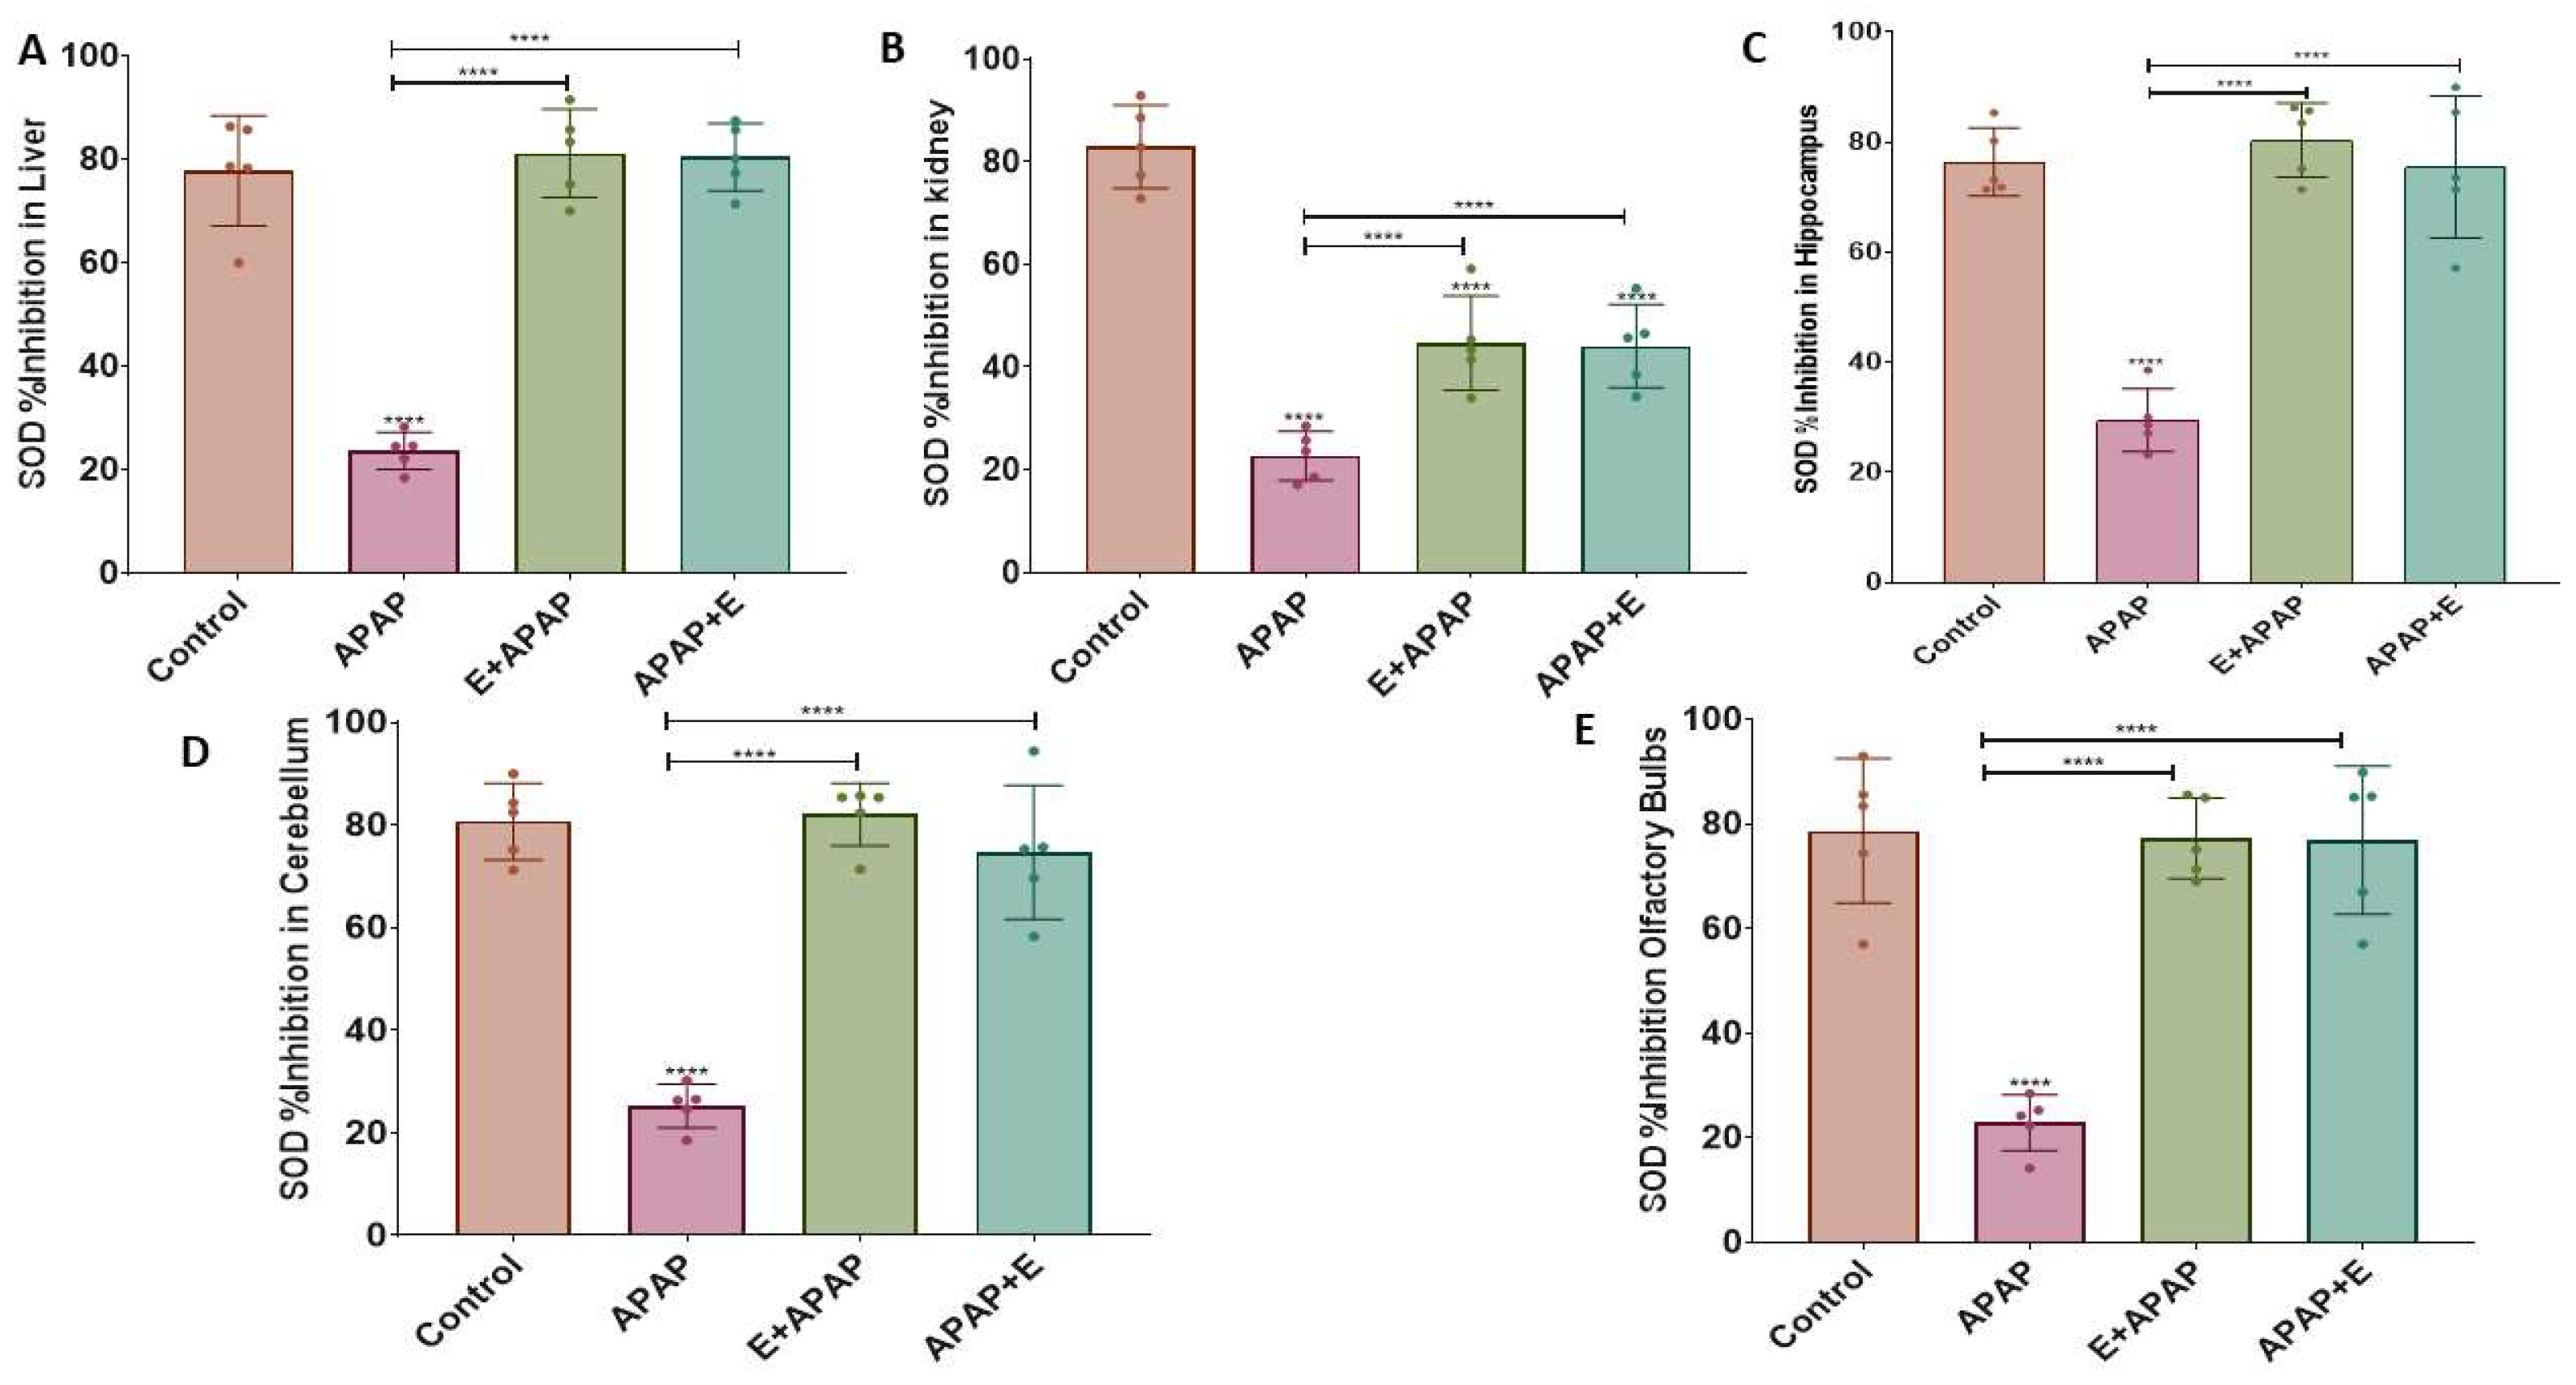
3.3. Antioxidant Status
3.3.1. Uric Acid (UA)
3.3.2. Superoxide Dismutase (SOD)
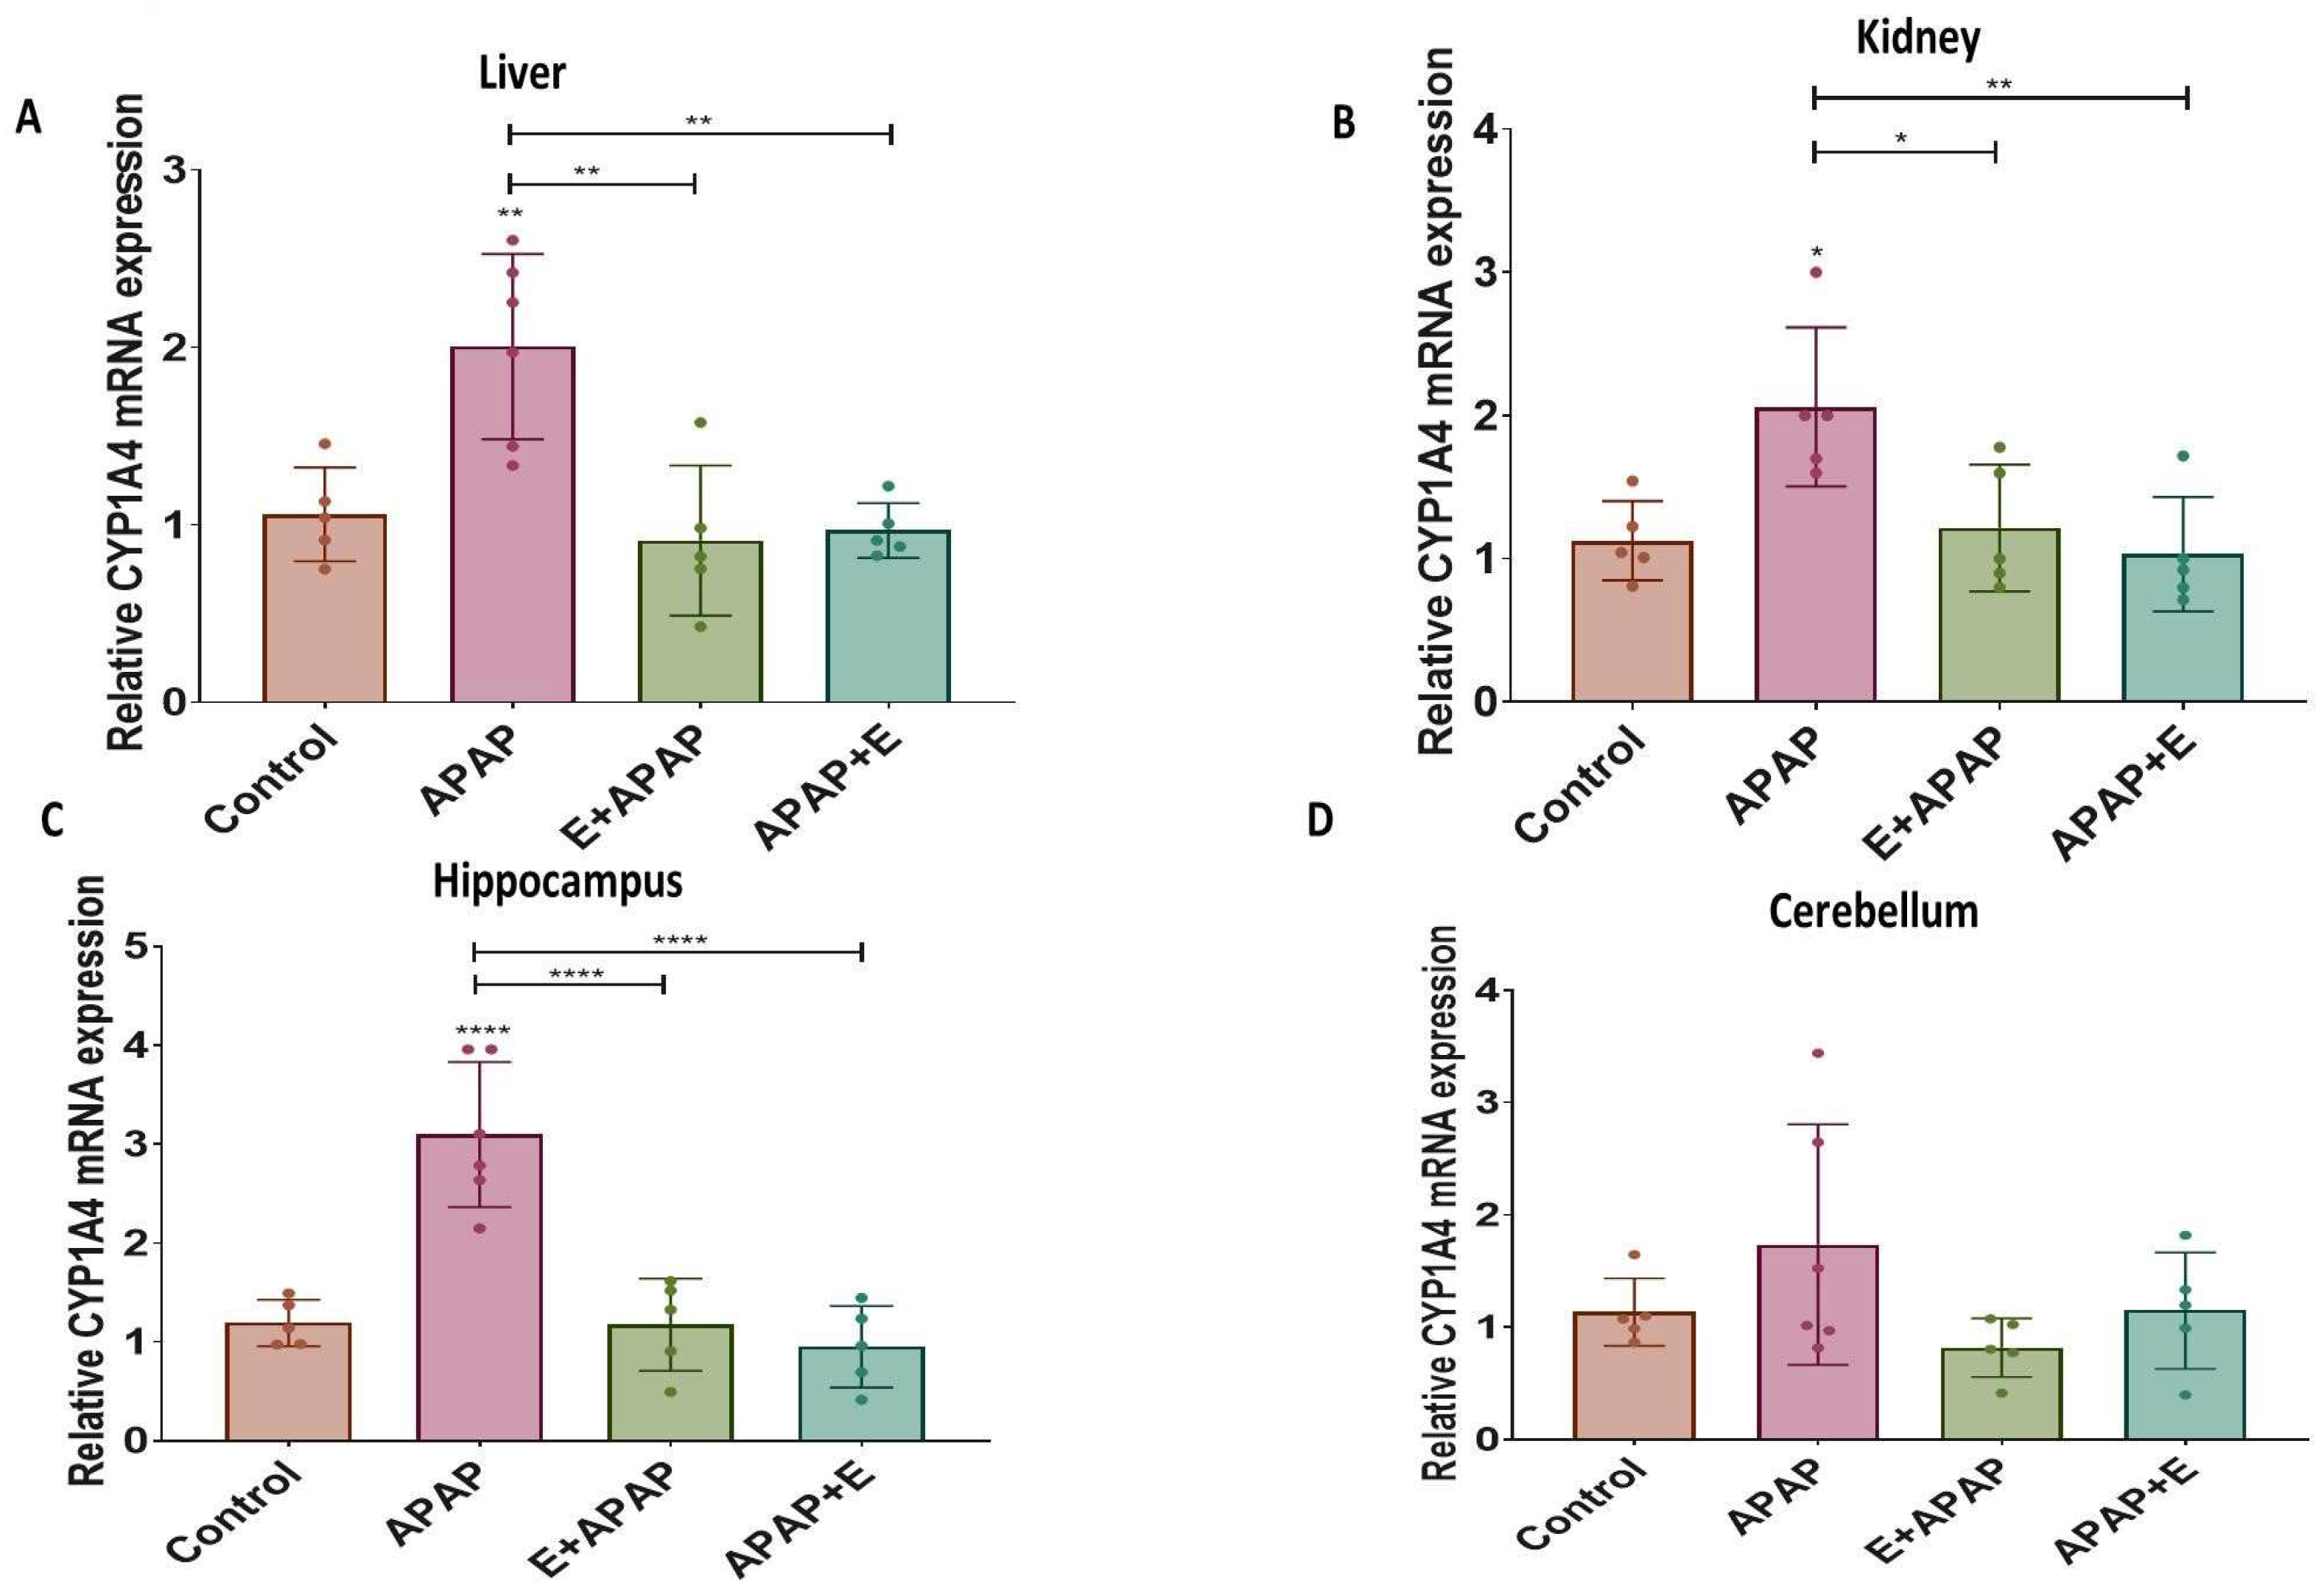
3.4. Real-Time Quantitative PCR Results:
3.4.1. Cyp1a4
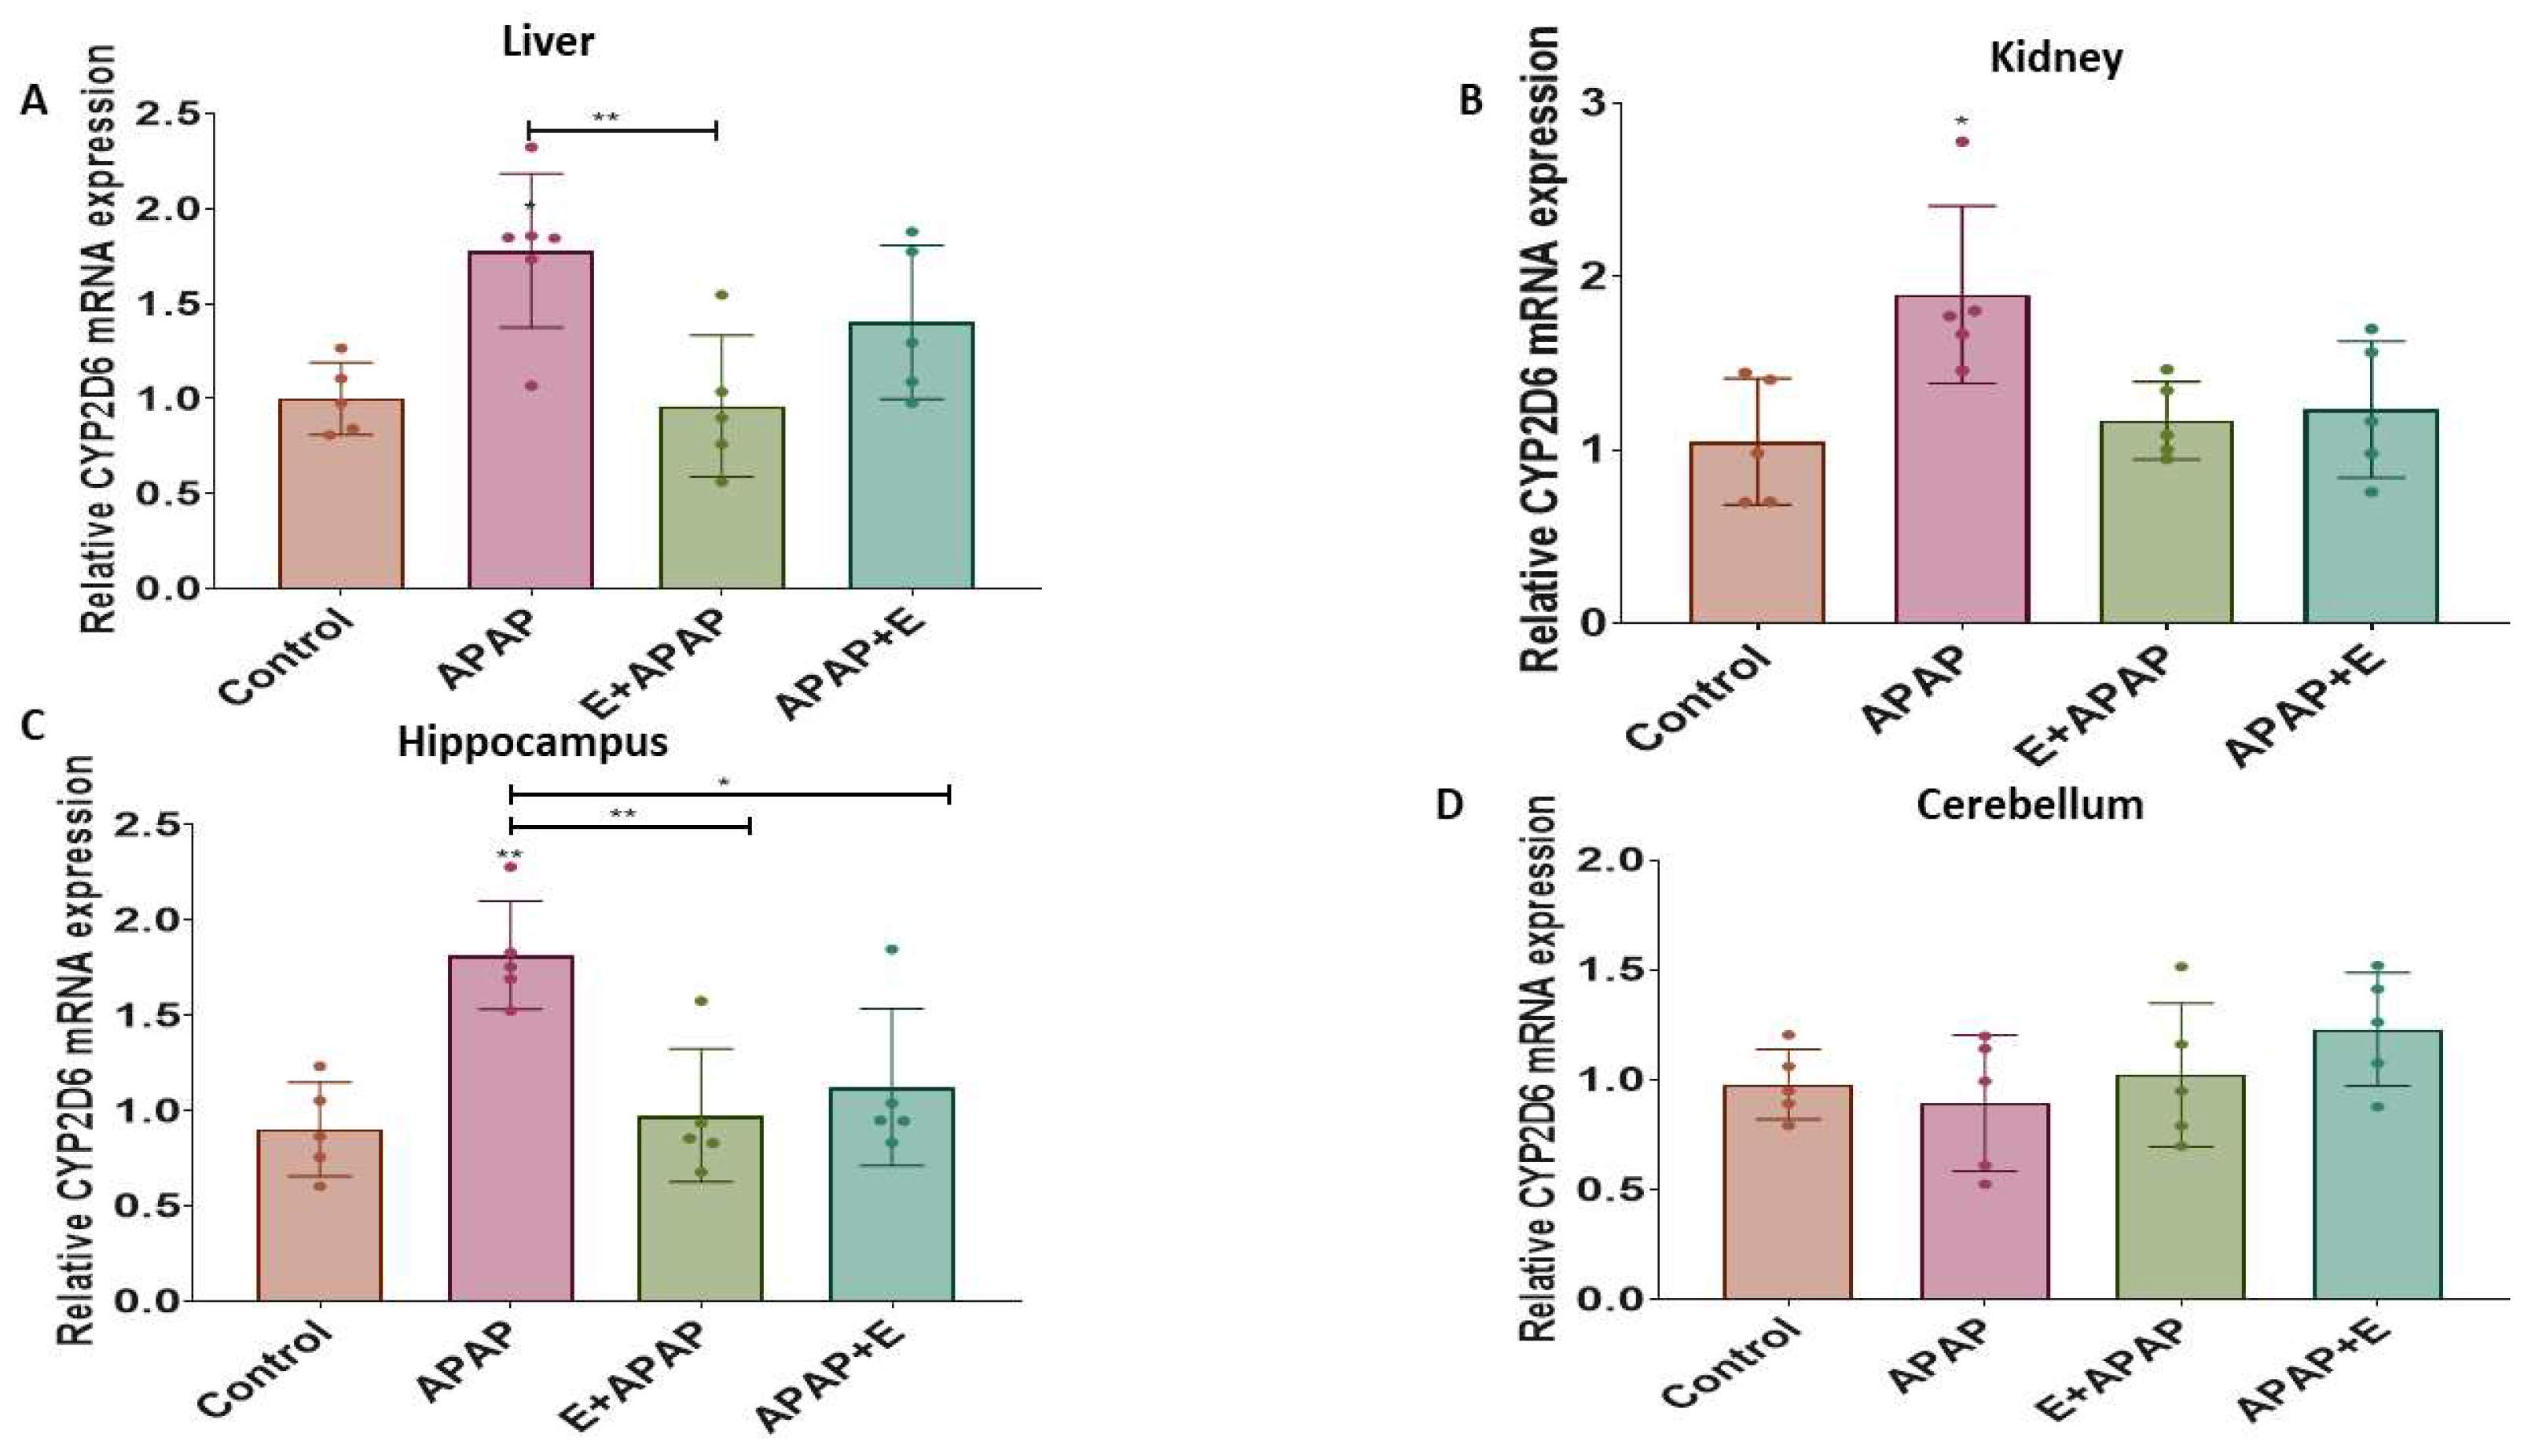
3.4.2. Cyp2d6
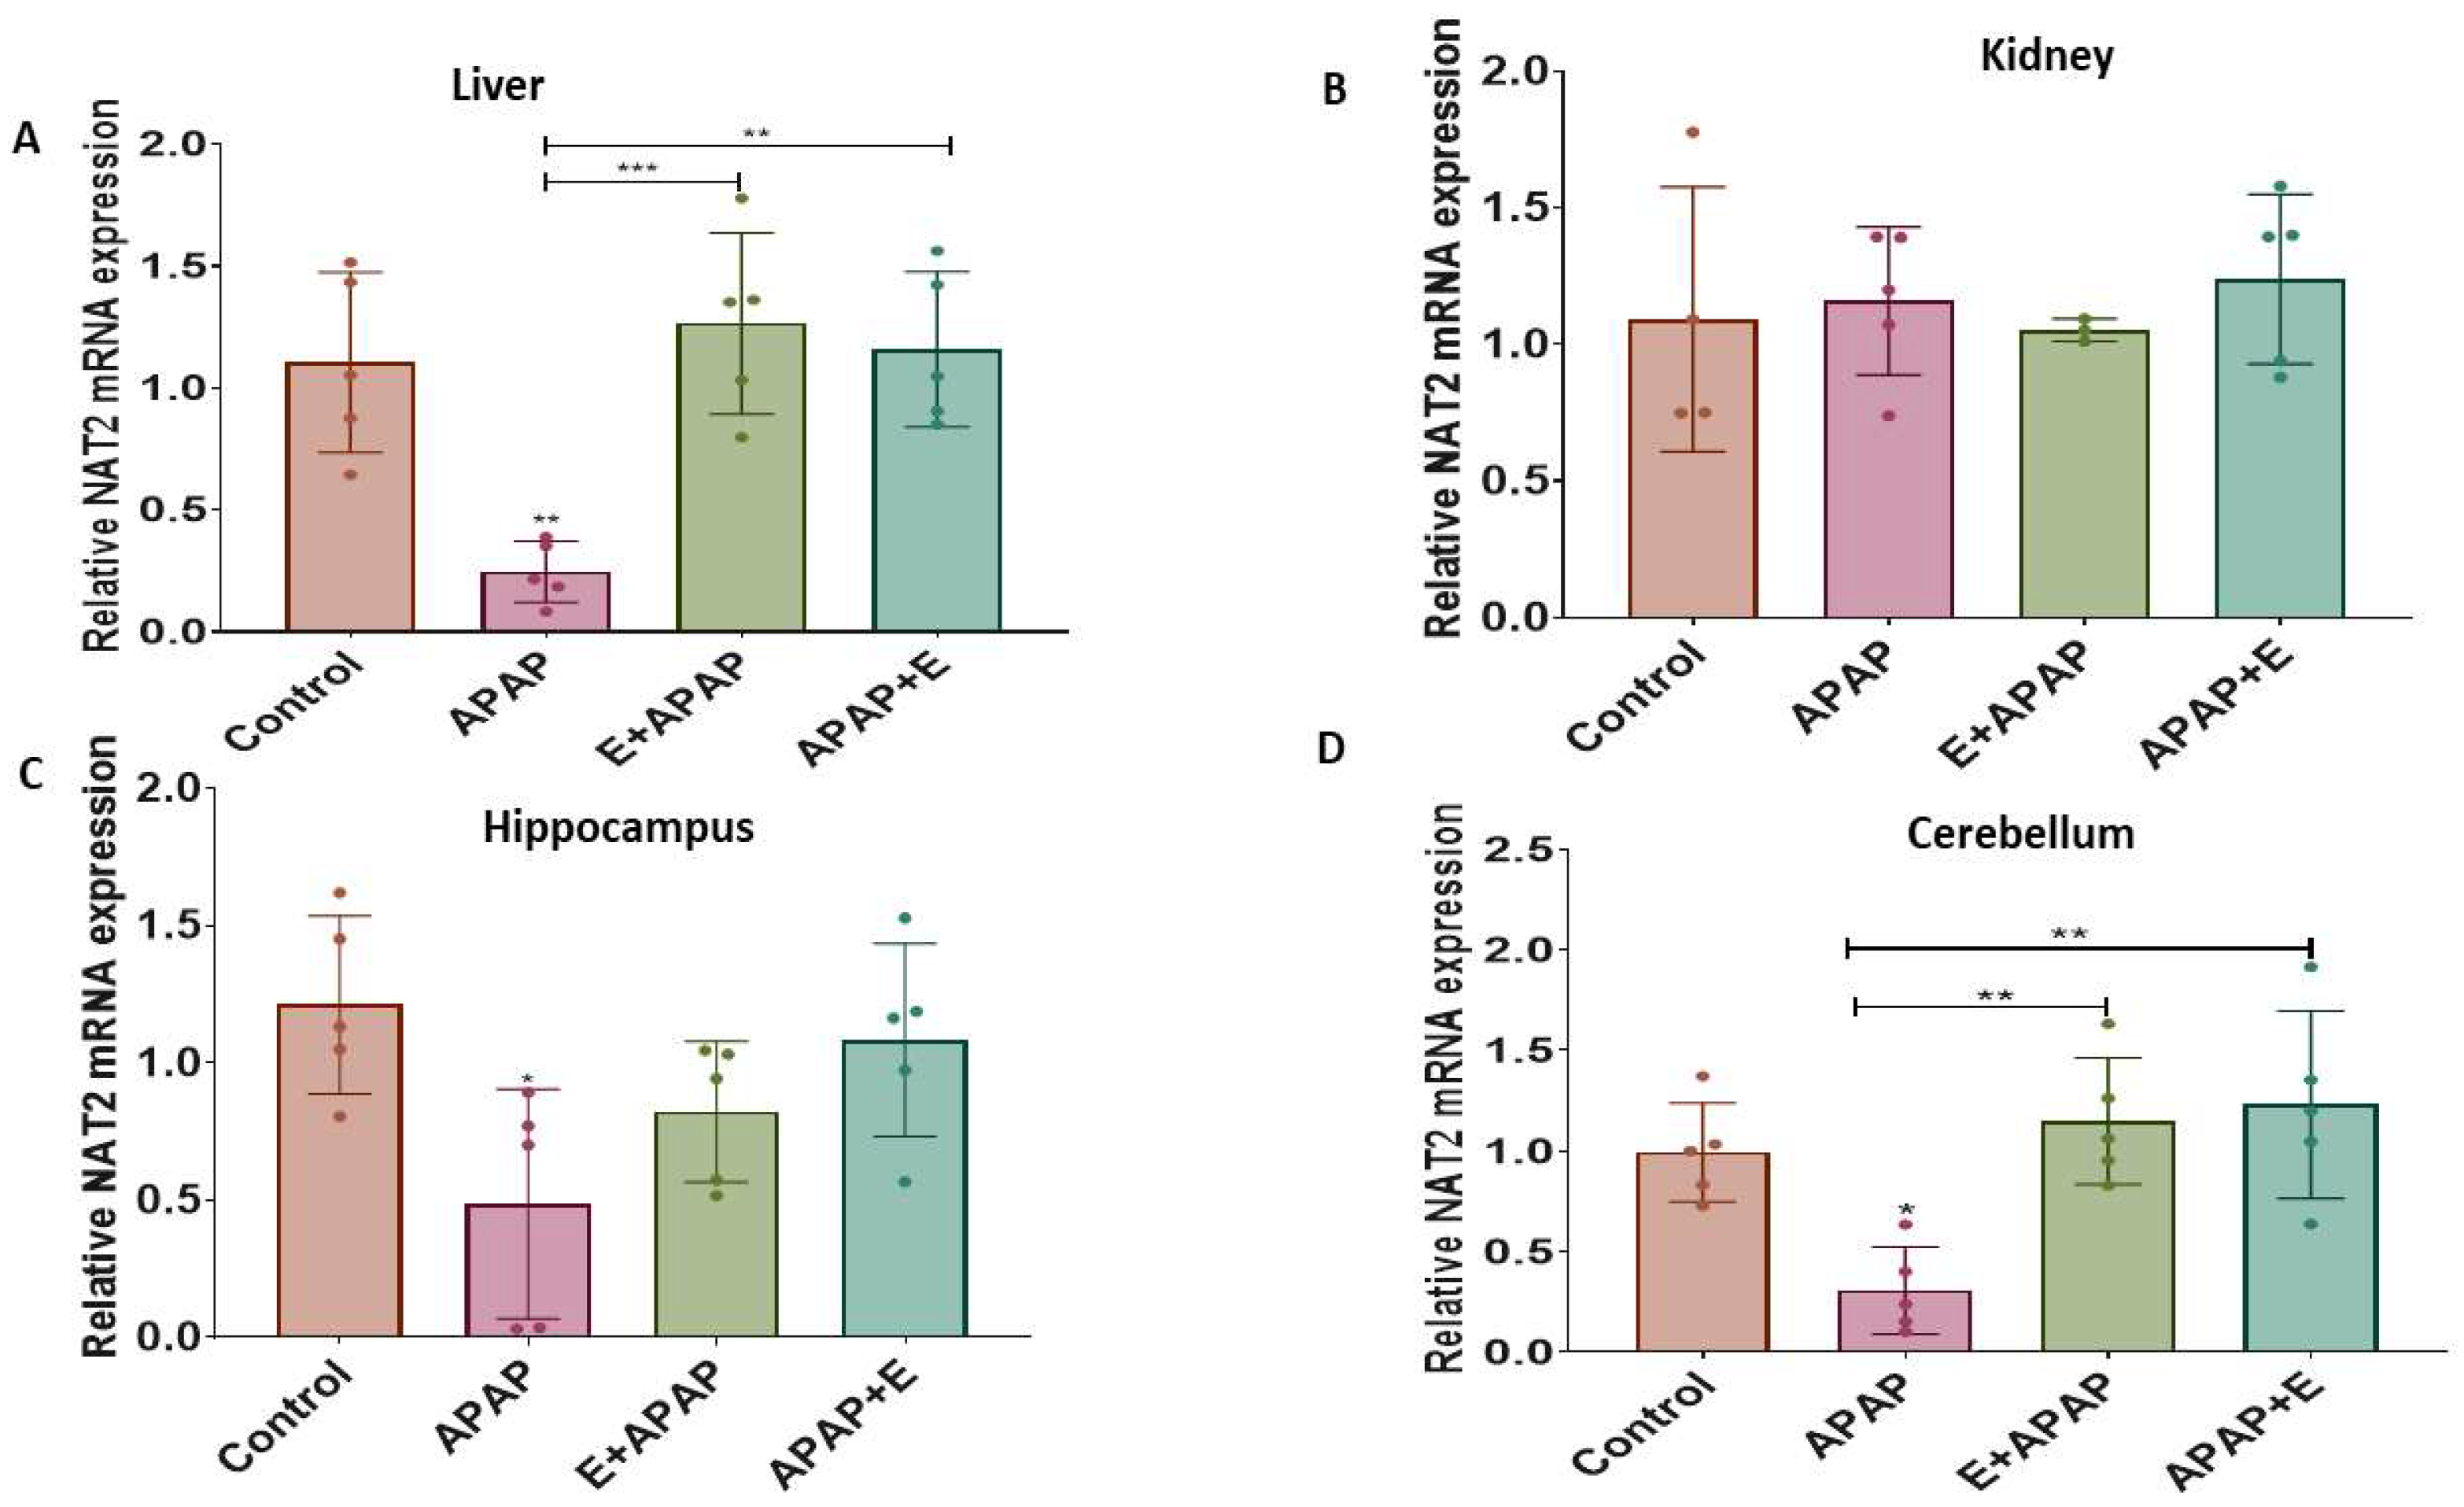
3.4.3. Nat2
4. Discussion
Author Contributions
Funding
Institutional Review Board Statement
Informed Consent Statement
Data Availability Statement
Conflicts of Interest
References
- Elayeh, E.; Akour, A.; Haddadin, R.N. Prevalence and predictors of self-medication drugs to prevent or treat COVID-19: Experience from a Middle Eastern country. Int. J. Clin. Pract. 2021, 75, e14860. [Google Scholar] [CrossRef] [PubMed]
- Malak, M.-Z.; AbuKamel, A. Self-medication Practices among University Students in Jordan. Malays. J. Med. Health Sci. 2019, 15, 112–119. [Google Scholar]
- Breu, A.C.; Patwardhan, V.R.; Nayor, J.; Ringwala, J.N.; Devore, Z.G.; Ganatra, R.B.; Hathorn, K.E.; Horton, L.; Iriana, S.; Tapper, E.B. A multicenter study into causes of severe acute liver injury. Clin. Gastroenterol. Hepatol. 2019, 17, 1201–1203. [Google Scholar] [CrossRef] [PubMed]
- Mikhail, A.; Tanoli, O.; Légaré, G.; Dubé, P.-A.; Habel, Y.; Lesage, A.; Low, N.C.; Lamarre, S.; Singh, S.; Rahme, E. Over-the-counter drugs and other substances used in attempted suicide presented to emergency departments in Montreal, Canada. Crisis 2018, 40, 166–175. [Google Scholar] [CrossRef]
- Moore, N.; Duret, S.; Grolleau, A.; Lassalle, R.; Barbet, V.; Duong, M.; Thurin, N.; Droz-Perroteau, C.; Gulmez, S.E. Previous drug exposure in patients hospitalised for acute liver injury: A case-population study in the French National Healthcare Data System. Drug Saf. 2019, 42, 559–572. [Google Scholar] [CrossRef]
- Yan, M.; Huo, Y.; Yin, S.; Hu, H. Mechanisms of acetaminophen-induced liver injury and its implications for therapeutic interventions. Redox Biol. 2018, 17, 274–283. [Google Scholar] [CrossRef] [PubMed]
- Ndetan, H.; Evans, M.W., Jr.; Singal, A.K.; Brunner, L.J.; Calhoun, K.; Singh, K.P. Light to moderate drinking and therapeutic doses of acetaminophen: An assessment of risks for renal dysfunction. Prev. Med. Rep. 2018, 12, 253–258. [Google Scholar] [CrossRef]
- Wilkes, J.M.; Clark, L.E.; Herrera, J.L. Acetaminophen Overdose in Pregnancy. South. Med. J. 2005, 98, 1118–1122. [Google Scholar] [CrossRef]
- Mokhtari, V.; Afsharian, P.; Shahhoseini, M.; Kalantar, S.M.; Moini, A. A Review on Various Uses of N-Acetyl Cysteine. Cell J. 2017, 19, 11. [Google Scholar] [CrossRef]
- Bauer, A.Z.; Swan, S.H.; Kriebel, D.; Liew, Z.; Taylor, H.S.; Bornehag, C.-G.; Andrade, A.M.; Olsen, J.; Jensen, R.H.; Mitchell, R.T. Paracetamol use during pregnancy—A call for precautionary action. Nat. Rev. Endocrinol. 2021, 17, 757–766. [Google Scholar] [CrossRef]
- Skakkebaek, N.E.; De Meyts, E.R.; Main, K.M. Testicular dysgenesis syndrome: An increasingly common developmental disorder with environmental aspects. Apmis 2001, 109, S22–S30. [Google Scholar] [CrossRef]
- Albert, O.; Desdoits-Lethimonier, C.; Lesné, L.; Legrand, A.; Guillé, F.; Bensalah, K.; Dejucq-Rainsford, N.; Jégou, B. Paracetamol, aspirin and indomethacin display endocrine disrupting properties in the adult human testis in vitro. Hum. Reprod. 2013, 28, 1890–1898. [Google Scholar] [CrossRef] [PubMed]
- Kristensen, D.M.; Mazaud-Guittot, S.; Gaudriault, P.; Lesné, L.; Serrano, T.; Main, K.M.; Jégou, B. Analgesic use—Prevalence, biomonitoring and endocrine and reproductive effects. Nat. Rev. Endocrinol. 2016, 12, 381–393. [Google Scholar] [CrossRef] [PubMed]
- Arendrup, F.S.; Mazaud-Guittot, S.; Jégou, B.; Kristensen, D.M. EDC IMPACT: Is exposure during pregnancy to acetaminophen/paracetamol disrupting female reproductive development? Endocr. Connect. 2018, 7, 149. [Google Scholar] [CrossRef]
- Rossitto, M.; Ollivier, M.; Déjardin, S.; Pruvost, A.; Brun, C.; Marchive, C.; Nguyen, A.L.; Ghettas, A.; Keime, C.; De Massy, B. In utero exposure to acetaminophen and ibuprofen leads to intergenerational accelerated reproductive aging in female mice. Commun. Biol. 2019, 2, 310. [Google Scholar] [CrossRef]
- Thiele, K.; Solano, M.E.; Huber, S.; Flavell, R.A.; Kessler, T.; Barikbin, R.; Jung, R.; Karimi, K.; Tiegs, G.; Arck, P.C. Prenatal acetaminophen affects maternal immune and endocrine adaptation to pregnancy, induces placental damage, and impairs fetal development in mice. Am. J. Pathol. 2015, 185, 2805–2818. [Google Scholar] [CrossRef]
- Cederbaum, A.I. Molecular mechanisms of the microsomal mixed function oxidases and biological and pathological implications. Redox Biol. 2015, 4, 60–73. [Google Scholar] [CrossRef]
- Bertolini, A.; Ferrari, A.; Ottani, A.; Guerzoni, S.; Tacchi, R.; Leone, S. Paracetamol: New Vistas of an Old Drug. CNS Drug Rev. 2006, 12, 250–275. [Google Scholar] [CrossRef]
- McGill, M.R.; Sharpe, M.R.; Williams, C.D.; Taha, M.; Curry, S.C.; Jaeschke, H.J. The mechanism underlying acetaminophen-induced hepatotoxicity in humans and mice involves mitochondrial damage and nuclear DNA fragmentation. J. Clin. Investig. 2012, 122, 1574–1583. [Google Scholar] [CrossRef]
- Pingili, R.B.; Pawar, A.K.; Challa, S.R. Effect of chrysin on the formation of N-acetyl-p-benzoquinoneimine, a toxic metabolite of paracetamol in rats and isolated rat hepatocytes. Chem.-Biol. Interact. 2019, 302, 123–134. [Google Scholar] [CrossRef]
- Rothen, J.-P.; Haefeli, W.; Meyer, U.A.; Todesco, L.; Wenk, M. Acetaminophen is an inhibitor of hepatic N-acetyltransferase 2 in vitro and in vivo. Pharmacogenetics 1998, 8, 553–560. [Google Scholar] [CrossRef] [PubMed]
- Guo, C.; Xie, G.; Su, M.; Wu, X.; Lu, X.; Wu, K.; Wei, C. Characterization of acetaminophen-induced cytotoxicity in target tissues. Am. J. Transl. Res. 2016, 8, 4440. [Google Scholar] [PubMed]
- Wang, X.; Wu, Q.; Liu, A.; Anadón, A.; Rodríguez, J.-L.; Martínez-Larrañaga, M.-R.; Yuan, Z.; Martínez, M.-A. Paracetamol: Overdose-induced oxidative stress toxicity, metabolism, and protective effects of various compounds in vivo and in vitro. Drug Metab. Rev. 2017, 49, 395–437. [Google Scholar] [CrossRef] [PubMed]
- Iorga, A.; Dara, L.; Kaplowitz, N. Drug-induced liver injury: Cascade of events leading to cell death, apoptosis or necrosis. Int. J. Mol. Sci. 2017, 18, 1018. [Google Scholar] [CrossRef]
- Ozatik, F.Y.; Teksen, Y.; Kadioglu, E.; Ozatik, O.; Bayat, Z. Effects of hydrogen sulfide on acetaminophen-induced acute renal toxicity in rats. Int. Urol. Nephrol. 2019, 51, 745–754. [Google Scholar] [CrossRef]
- Kennon-McGill, S.; McGill, M.R. Extrahepatic Toxicity of Acetaminophen: Critical Evaluation of the Evidence and Proposed Mechanisms. J. Clin. Transl. Res. 2018, 3, 5. [Google Scholar] [CrossRef]
- Moshaei-Nezhad, P.; Hosseini, S.M.; Yahyapour, M.; Iman, M.; Khamesipour, A. Protective effect of ivy leaf extract on paracetamol-induced oxidative stress and nephrotoxicity in mice. J. Herbmed Pharmacol. 2019, 8, 64–68. [Google Scholar] [CrossRef]
- Abu, I.F.; Mat, A.C.; Zulkifli, M.; Juliana, N.; Mohamad, M.H.N. Improvement of kidney histological morphology in nephrotoxic paracetamol-induced rats by Cassia alata treatment. Int. J. Res. Pharm. Sci. 2018, 9, 6–11. [Google Scholar]
- Upadhya, S.C.; Tirumalai, P.S.; Boyd, M.R.; Mori, T.; Ravindranath, V. Cytochrome P4502E (Cyp2e) in Brain: Constitutive Expression, Induction by Ethanol and Localization by Fluorescence in Situ Hybridization. Arch. Biochem. Biophys. 2000, 373, 23–34. [Google Scholar] [CrossRef]
- Howard, L.A.; Miksys, S.; Hoffmann, E.; Mash, D.; Tyndale, R.F. Brain Cyp2e1 is induced by nicotine and ethanol in rat and is higher in smokers and alcoholics. Br. J. Pharmacol. 2003, 138, 1376–1386. [Google Scholar] [CrossRef]
- Joshi, M.; Tyndale, R.F. Induction and recovery time course of rat brain Cyp2e1 after nicotine treatment. Drug Metab. Dispos. 2006, 34, 647–652. [Google Scholar] [CrossRef] [PubMed]
- Posadas, I.; Santos, P.; Blanco, A.; Muñoz-Fernández, M.; Ceña, V. Acetaminophen induces apoptosis in rat cortical neurons. PloS ONE 2010, 5, e15360. [Google Scholar] [CrossRef] [PubMed]
- Ghanem, C.I.; Pérez, M.J.; Manautou, J.E.; Mottino, A.D. Acetaminophen from liver to brain: New insights into drug pharmacological action and toxicity. Pharmacol. Res. 2016, 109, 119–131. [Google Scholar] [CrossRef] [PubMed]
- El Hadi, H.; Vettor, R.; Rossato, M. Vitamin E as a Treatment for Nonalcoholic Fatty Liver Disease: Reality or Myth? Antioxidants 2018, 7, 12. [Google Scholar] [CrossRef]
- Emanuel, E.J.; Grady, C.C.; Crouch, R.A.; Lie, R.K.; Miller, F.G.; Wendler, D.D. The Oxford Textbook of Clinical Research Ethics; Oxford University Press: Oxford, UK, 2008. [Google Scholar]
- Henneh, I.T.; Ahlidja, W.; Alake, J.; Kwabil, A.; Ahmed, M.A.; Kyei-Asante, B.; Adinortey, M.B.; Ekor, M.; Armah, F.A. Ziziphus abyssinica root bark extract ameliorates paracetamol-induced liver toxicity in rats possibly via the attenuation of oxidative stress. Toxicol. Rep. 2022, 9, 1929–1937. [Google Scholar] [CrossRef]
- Doğan, N.; Akçam, M.; Koca, T.; Doğuç, D.K.; Özgöçmen, M. The protective effect of Capparis ovata in acute hepatotoxicity induced by paracetamol. Turk. J. Med. Sci. 2016, 46, 561–566. [Google Scholar] [CrossRef]
- Iyanda, A.A.; Adeniyi, F.A.A. Biochemical and histologic presentations of female Wistar rats administered with different doses of paracetamol/methionine. Niger. J. Physiol. Sci. 2011, 26, 151–160. [Google Scholar]
- Tras, B.; Faki, H.E.; Kutahya, Z.O.; Bahcivan, E.; Dik, B.; Uney, K. The effects of dexamethasone and minocycline alone and combined with N-acetylcysteine and vitamin E on serum matrix metalloproteinase-9 and coenzyme Q10 levels in aflatoxin B1 administered rats. Pol. J. Vet. Sci. 2022, 25, 419–427. [Google Scholar]
- Raeeszadeh, M.; Saleh Hosseini, S.M.; Amiri, A.A. Impact of Co-Administration of N-Acetylcysteine and Vitamin E on Cyclophosphamide-Induced Ovarian Toxicity in Female Rats. J. Toxicol. 2022, 2022, 9073405. [Google Scholar] [CrossRef]
- Sudheesh, N.; Ajith, T.; Janardhanan, K. Hepatoprotective effects of DL-α-lipoic acid and α-Tocopherol through amelioration of the mitochondrial oxidative stress in acetaminophen challenged rats. Toxicol. Mech. Methods 2013, 23, 368–376. [Google Scholar] [CrossRef]
- Paxinos, G.; Watson, C. The Rat Brain in Stereotaxic Coordinates; Hard Cover Edition; Elsevier: Amsterdam, The Netherlands, 2006. [Google Scholar]
- Livak, K.J.; Schmittgen, T.D. Analysis of relative gene expression data using real-time quantitative PCR and the 2−ΔΔCT method. Methods 2001, 25, 402–408. [Google Scholar] [CrossRef] [PubMed]
- El-Boshy, M.; BaSalamah, M.A.; Ahmad, J.; Idris, S.; Mahbub, A.; Abdelghany, A.H.; Almaimani, R.A.; Almasmoum, H.; Ghaith, M.M.; Elzubier, M. Vitamin D protects against oxidative stress, inflammation and hepatorenal damage induced by acute paracetamol toxicity in rat. Free. Radic. Biol. Med. 2019, 141, 310–321. [Google Scholar] [CrossRef]
- Jafri, M.; Subhani, M.J.; Javed, K.; Singh, S. Hepatoprotective activity of leaves of Cassia occidentalis against paracetamol and ethyl alcohol intoxication in rats. J. Ethnopharmacol. 1999, 66, 355–361. [Google Scholar] [CrossRef]
- Hamid, Z.A.; Budin, S.B.; Jie, N.W.; Hamid, A.; Husain, K.; Mohamed, J. Nephroprotective effects of Zingiber zerumbet Smith ethyl acetate extract against paracetamol-induced nephrotoxicity and oxidative stress in rats. J. Zhejiang Univ. Sci. B 2012, 13, 176–185. [Google Scholar] [CrossRef] [PubMed]
- Walker, B.; Kelleher, J.; Dixon, M.; Losowsky, M. Vitamin E protection of the liver from paracetamol in the rat. Clin. Sci. Mol. Med. 1974, 47, 449–459. [Google Scholar] [CrossRef] [PubMed]
- Trumper, L.; Girardi, G.; Elías, M.M. Acetaminophen nephrotoxicity in male Wistar rats. Arch. Toxicol. 1992, 66, 107–111. [Google Scholar] [CrossRef]
- Cekmen, M.; Ilbey, Y.; Ozbek, E.; Simsek, A.; Somay, A.; Ersoz, C. Curcumin prevents oxidative renal damage induced by acetaminophen in rats. Food Chem. Toxicol. 2009, 47, 1480–1484. [Google Scholar] [CrossRef]
- Şener, G.; Şehirli, A.Ö.; Ayanoğlu-Dülger, G. Protective effects of melatonin, vitamin E and N-acetylcysteine against acetaminophen toxicity in mice: A comparative study. J. Pineal Res. 2003, 35, 61–68. [Google Scholar] [CrossRef]
- Sathishkumar, T.; Baskar, R. Renoprotective effect of Tabernaemontana heyneana Wall. leaves against paracetamol-induced renotoxicity in rats and detection of polyphenols by high-performance liquid chromatography–diode array detector–mass spectrometry analysis. J. Acute Med. 2014, 4, 57–67. [Google Scholar] [CrossRef]
- Hamza, R.Z.; Al-Harbi, M.S. Amelioration of paracetamol hepatotoxicity and oxidative stress on mice liver with silymarin and Nigella sativa extract supplements. Asian Pac. J. Trop. Biomed. 2015, 5, 521–531. [Google Scholar] [CrossRef]
- da Silva, M.H.; da Rosa, E.J.F.; de Carvalho, N.R.; Dobrachinski, F.; da Rocha, J.B.T.; Mauriz, J.L.; González-Gallego, J.; Soares, F.A.A. Acute brain damage induced by acetaminophen in mice: Effect of diphenyl diselenide on oxidative stress and mitochondrial dysfunction. Neurotox. Res. 2012, 21, 334–344. [Google Scholar] [CrossRef]
- Mohammed, E.; Safwat, G. Assessment of the ameliorative role of selenium nanoparticles on the oxidative stress of acetaminophen in some tissues of male albino rats. Beni-Suef Univ. J. Basic Appl. Sci. 2013, 2, 80–85. [Google Scholar] [CrossRef]
- Manyike, P.T.; Kharasch, E.D.; Kalhorn, T.F.; Slattery, J.T. Contribution of Cyp2e1 and Cyp3a to acetaminophen reactive metabolite formation. Clin. Pharmacol. Ther. 2000, 67, 275–282. [Google Scholar] [CrossRef]
- Rumack, B.H. Acetaminophen misconceptions. Hepatology 2004, 40, 10–15. [Google Scholar] [CrossRef] [PubMed]
- Zhao, L.; Pickering, G. Paracetamol metabolism and related genetic differences. Drug Metab. Rev. 2011, 43, 41–52. [Google Scholar] [CrossRef] [PubMed]
- Kim, S.-H. Acetaminophen Associated Neurotoxicity and Its Relevance to Neurodevelopmental Disorders; University of South Florida: Tampa, FL, USA, 2017. [Google Scholar]
- Dressler, W.E.; Appelqvist, T. Plasma/blood pharmacokinetics and metabolism after dermal exposure to para-aminophenol or para-phenylenediamine. Food Chem. Toxicol. 2006, 44, 371–379. [Google Scholar] [CrossRef]
- Estrada, L.; Kanelakis, K.C.; Levy, G.N.; Weber, W.W. Tissue-and Gender-Specific Expression ofN-Acetyltransferase 2 (Nat2*) during Development of the Outbred Mouse Strain CD-1. Drug Metab. Dispos. 2000, 28, 139–146. [Google Scholar]
- Jiang, Y.; Fan, X.; Wang, Y.; Chen, P.; Zeng, H.; Tan, H.; Gonzalez, F.J.; Huang, M.; Bi, H. Schisandrol B protects against acetaminophen-induced hepatotoxicity by inhibition of CYP-mediated bioactivation and regulation of liver regeneration. Toxicol. Sci. 2015, 143, 107–115. [Google Scholar] [CrossRef]
- Pattarachotanant, N.; Prasansuklab, A.; Tencomnao, T. Momordica charantia L. Extract Protects Hippocampal Neuronal Cells against PAHs-Induced Neurotoxicity: Possible Active Constituents Include Stigmasterol and Vitamin E. Nutrients 2021, 13, 2368. [Google Scholar] [CrossRef]
- Nirala, S.K.; Bhadauria, M.; Mathur, R.; Mathur, A. Amelioration of beryllium induced alterations in hepatorenal biochemistry and ultramorphology by co-administration of tiferron and adjuvants. J. Biomed. Sci. 2007, 14, 331–345. [Google Scholar] [CrossRef]
- Landes, N.; Pfluger, P.; Kluth, D.; Birringer, M.; Rühl, R.; Böl, G.F.; Glatt, H.; Brigelius-Flohé, R. Vitamin E activates gene expression via the pregnane X receptor. Biochem. Pharmacol. 2003, 65, 269–273. [Google Scholar] [CrossRef] [PubMed]
- Hodgman, M.J.; Garrard, A.R. A review of acetaminophen poisoning. Crit. Care Clin. 2012, 28, 499–516. [Google Scholar] [CrossRef] [PubMed]


| Component | Sample (µL) | Blank 1 (µL) | Blank 2 (µL) | Blank 3 (µL) |
|---|---|---|---|---|
| Sample solution | 20 | 0 | 20 | 0 |
| ddH2O | 0 | 20 | 0 | 20 |
| WST working solution | 200 | 200 | 200 | 200 |
| Enzyme working solution | 20 | 20 | 0 | 0 |
| Dilution Buffer | 0 | 0 | 20 | 20 |
Disclaimer/Publisher’s Note: The statements, opinions and data contained in all publications are solely those of the individual author(s) and contributor(s) and not of MDPI and/or the editor(s). MDPI and/or the editor(s) disclaim responsibility for any injury to people or property resulting from any ideas, methods, instructions or products referred to in the content. |
© 2023 by the authors. Licensee MDPI, Basel, Switzerland. This article is an open access article distributed under the terms and conditions of the Creative Commons Attribution (CC BY) license (https://creativecommons.org/licenses/by/4.0/).
Share and Cite
Hammad, A.M.; Shawaqfeh, B.; Hikmat, S.; Al-Qirim, T.; Hamadneh, L.; Al-Kouz, S.; Awad, M.M.; Hall, F.S. The Role of Vitamin E in Protecting against Oxidative Stress, Inflammation, and the Neurotoxic Effects of Acute Paracetamol in Pregnant Female Rats. Toxics 2023, 11, 368. https://doi.org/10.3390/toxics11040368
Hammad AM, Shawaqfeh B, Hikmat S, Al-Qirim T, Hamadneh L, Al-Kouz S, Awad MM, Hall FS. The Role of Vitamin E in Protecting against Oxidative Stress, Inflammation, and the Neurotoxic Effects of Acute Paracetamol in Pregnant Female Rats. Toxics. 2023; 11(4):368. https://doi.org/10.3390/toxics11040368
Chicago/Turabian StyleHammad, Alaa M., Baraa Shawaqfeh, Suhair Hikmat, Tariq Al-Qirim, Lama Hamadneh, Sameer Al-Kouz, Mariam M. Awad, and Frank S. Hall. 2023. "The Role of Vitamin E in Protecting against Oxidative Stress, Inflammation, and the Neurotoxic Effects of Acute Paracetamol in Pregnant Female Rats" Toxics 11, no. 4: 368. https://doi.org/10.3390/toxics11040368
APA StyleHammad, A. M., Shawaqfeh, B., Hikmat, S., Al-Qirim, T., Hamadneh, L., Al-Kouz, S., Awad, M. M., & Hall, F. S. (2023). The Role of Vitamin E in Protecting against Oxidative Stress, Inflammation, and the Neurotoxic Effects of Acute Paracetamol in Pregnant Female Rats. Toxics, 11(4), 368. https://doi.org/10.3390/toxics11040368