
Mercury Contamination as an Indicator of Fish Species’ Trophic Position in the Middle Araguaia River, Brazil


 , , , , ,
  ,
,  ,
,  and
and
Abstract
:1. Introduction
2. Materials and Methods
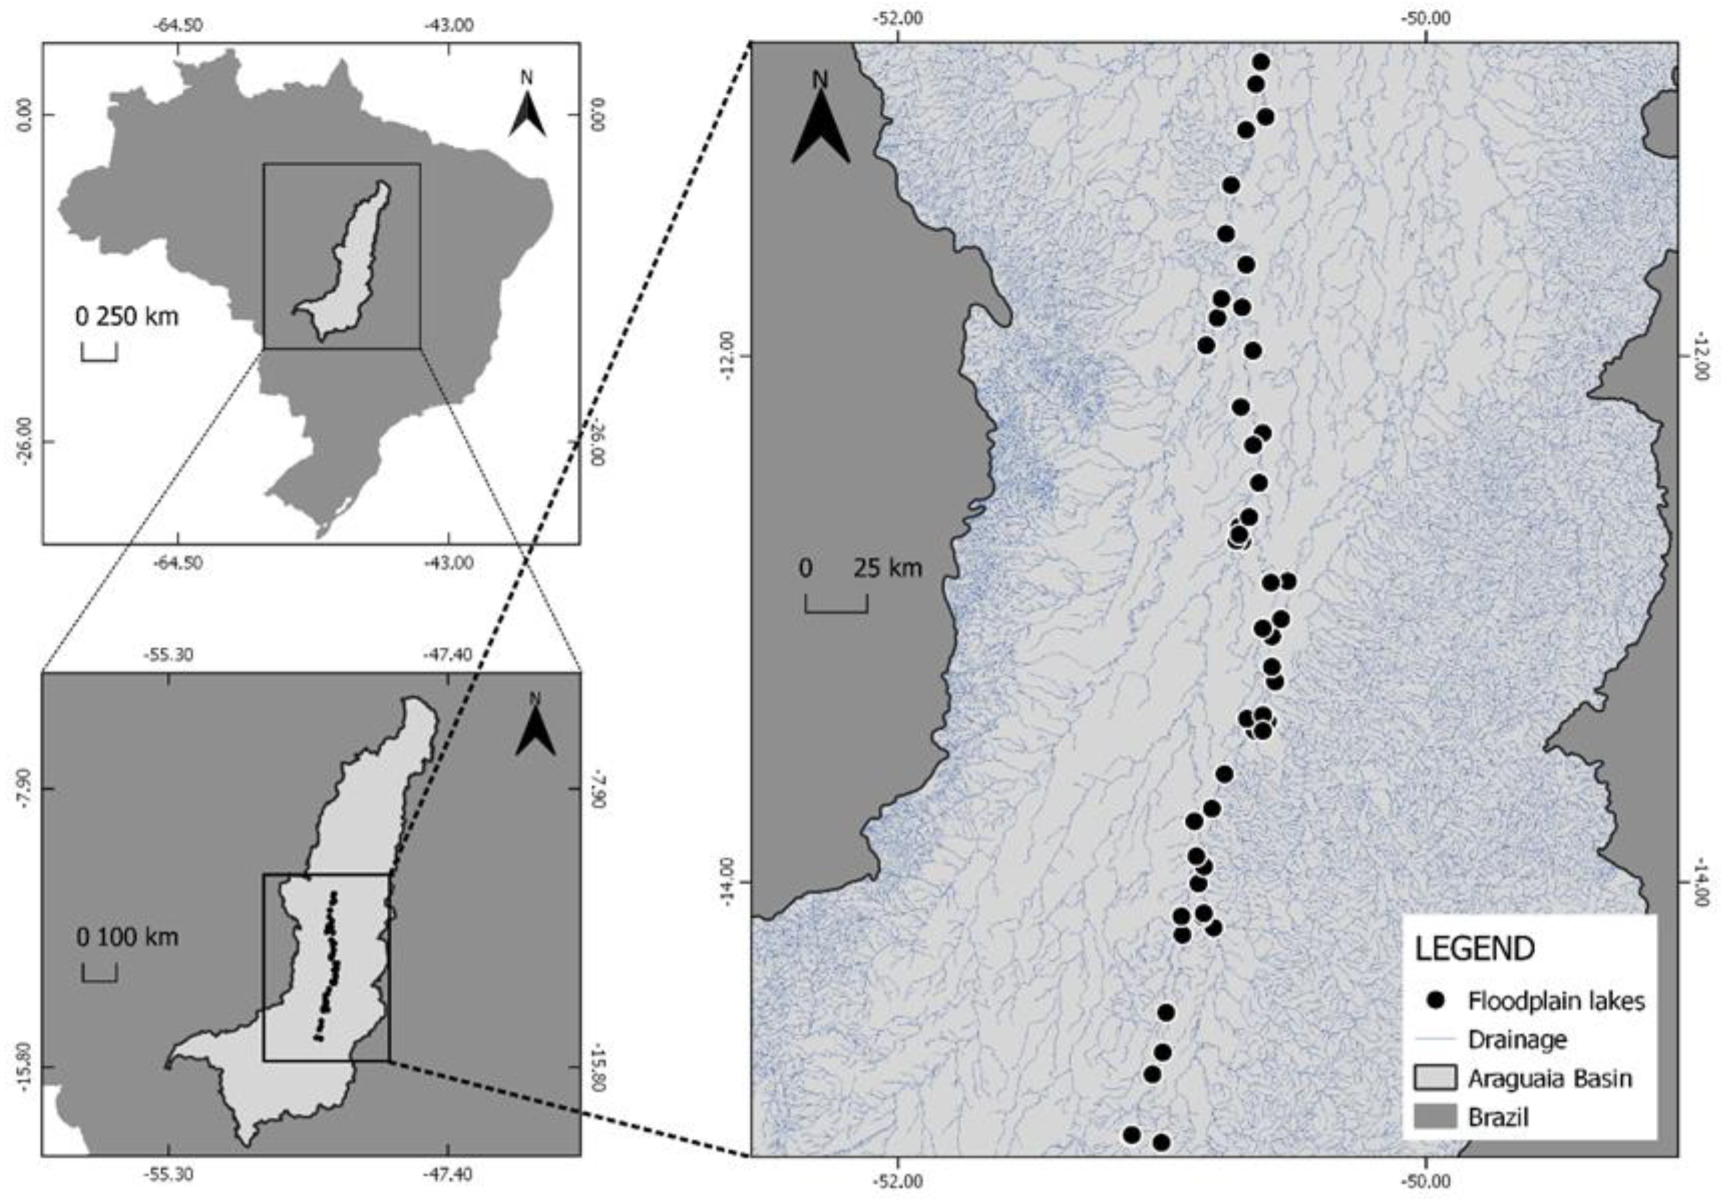
2.1. Study Area
2.2. Sampling
2.3. Sample Treatment and Mercury Determination
2.4. Biota–Sediment Accumulation Factor
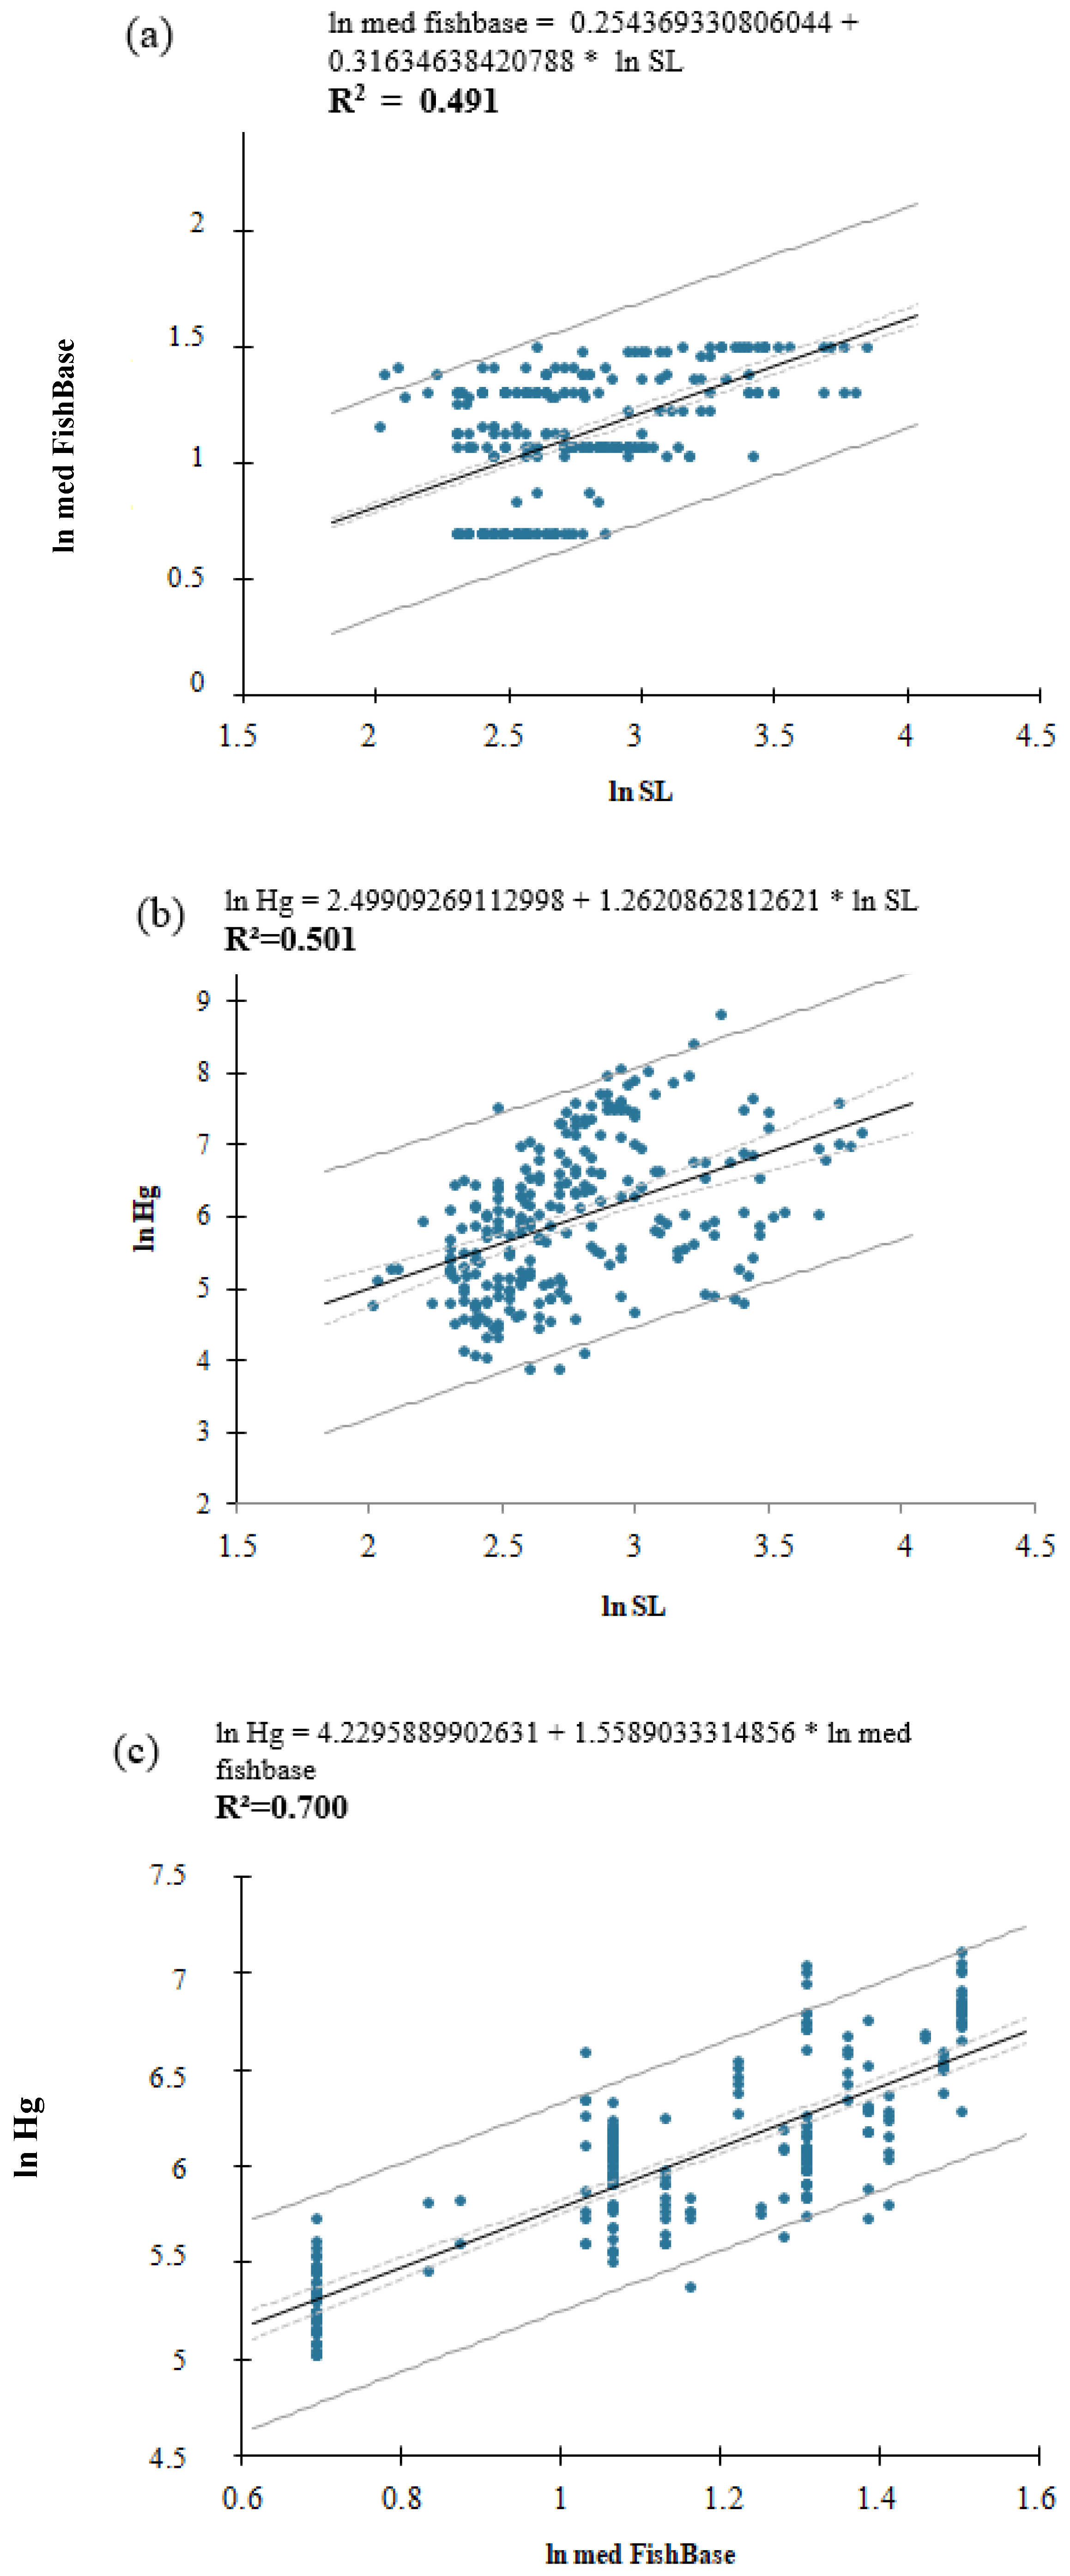
2.5. Statistical Analyses
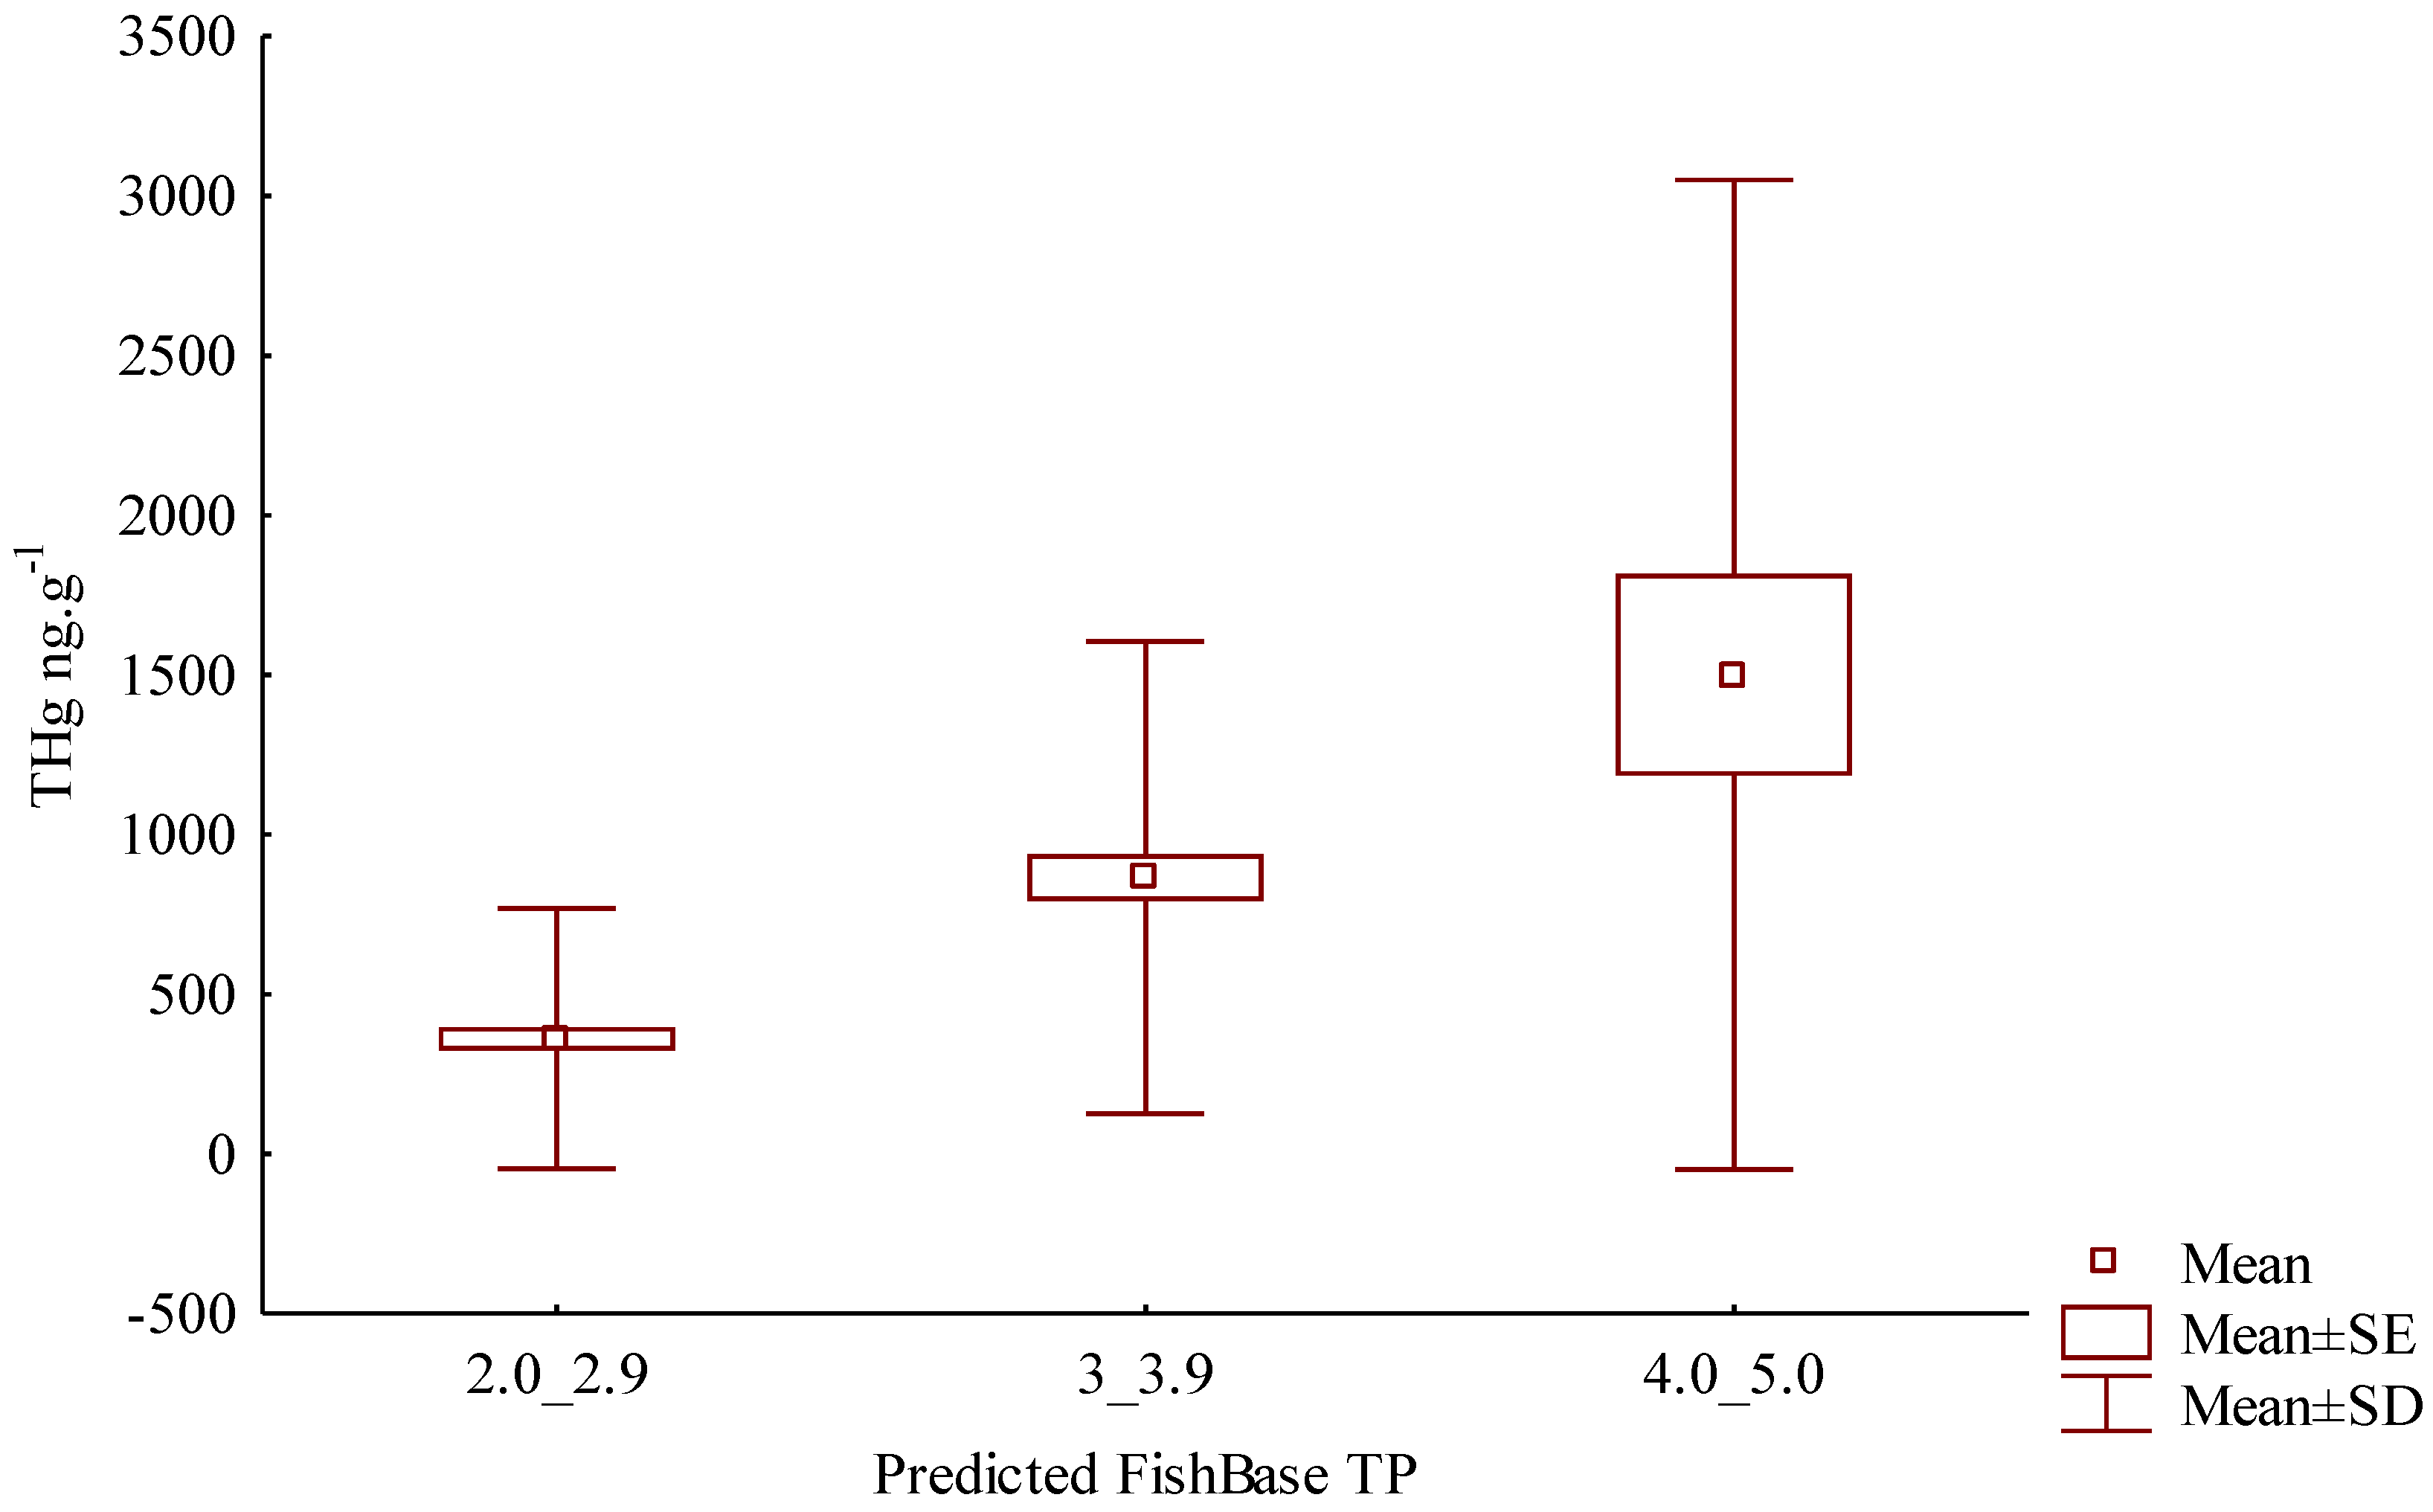
3. Results
4. Discussion
5. Conclusions
Author Contributions
Funding
Data Availability Statement
Acknowledgments
Conflicts of Interest
References
- Landry, M.R.; Décima, M.R. Protistan microzooplankton and the trophic position of tuna: Quantifying the trophic link between micro- and mesozooplankton in marine foodwebs. ICES J. Mar. Sci. 2017, 74, 1885–1892. [Google Scholar] [CrossRef]
- FishBase. Available online: www.FishBase.org (accessed on 25 July 2023).
- Mancinelli, G.; Vizzini, S.; Mazzola, A.; Maci, S.; Basset, A. Cross-validation of δ15N and FishBase estimates of fish trophic position in a Mediterranean lagoon: The importance of the isotopic baseline. Estuar. Coast. Shelf Sci. 2013, 135, 77–85. [Google Scholar] [CrossRef]
- Kopf, R.K.; Yen, J.D.; Nimmo, D.G.; Brosse, S.; Villéger, S. Global patterns and predictors of trophic position, body size and jaw size in fishes. Glob. Ecol. Biogeogr. 2021, 30, 414–428. [Google Scholar] [CrossRef]
- Cope, J.M. Exploring intraspecific life history patterns in sharks. Fish. Bull. 2006, 104, 311–320. [Google Scholar]
- Chassot, E.; Rouyer, T.; Trenkel, V.M.; Gascuel, D. Investigating trophic-level variability in Celtic Sea fish predators. J. Fish Biol. 2008, 73, 763–781. [Google Scholar] [CrossRef]
- Dantas, D.D.F.; Caliman, A.; Guariento, R.D.; Angelini, R.; Carneiro, L.S.; Lima, S.M.; Martinez, P.A.; Attayde, J.L. Climate effects on fish body size–trophic position relationship depend on ecosystem type. Ecography 2019, 42, 1579–1586. [Google Scholar] [CrossRef]
- Patrick, W.S.; Cope, J.M.; Thorson, J.T. Validating and improving life history data in FishBase. Fisheries 2014, 39, 173–176. [Google Scholar] [CrossRef]
- Hussey, N.E.; MacNeil, M.; McMeans, B.C.; Olin, J.A.; Dudley, S.F.; Cliff, G.; Wintner, S.P.; Fennessy, S.; Fisk, A. Rescaling the trophic structure of marine food webs. Ecol. Lett. 2014, 17, 239–250. [Google Scholar] [CrossRef]
- Driscoll, C.T.; Mason, R.P.; Chan, H.M.; Jacob, D.J.; Pirrone, N. Mercury as a global pollutant—Sources, pathways, and effects. Environ. Sci. Technol. 2013, 47, 4967–4983. [Google Scholar] [CrossRef]
- Latrubesse, E.M.; Stevaux, J.C. Geomorphology and Environmental Aspects of the Araguaia Fluvial Basin, Brasil. Z. Fur Geomorphol. 2002, 129, 109–127. [Google Scholar]
- Britski, H.A.; Sato, Y.; Rosa, A.B.S. Manual de Identificação de Peixes da Região de Três Maria: Com Chaves de Identificação Para os Peixes da Bacia do São Francisco, 3rd ed.; Codevasf: Brasília, Brazil, 1988. [Google Scholar]
- Santos, G.M.; Mérona, B.; Juras, A.A.; Jégu, M. Peixes do Baixo rio Tocantins: 20 Anos Depois da Usina Hidrelétrica Tucuruí, 1st ed.; Eletronorte: Palmas, Brazil, 2004. [Google Scholar]
- Gworek, B.; Dmuchowski, W.; Baczewska, A.H.; Brągoszewska, P.; Bemowska-Kałabun, O.; Wrzosek-Jakubowska, J. Air Contamination by Mercury, Emissions and Transformations—A Review. Water Air Soil Pollut. 2017, 228, 4. [Google Scholar] [CrossRef] [PubMed]
- Burkhard, L.P.; Cook, P.M.; Lukasewycz, M.T. Direct application of biota-sediment accumulation factors. Environ. Toxicol. Chem. 2010, 29, 230–236. [Google Scholar] [CrossRef] [PubMed]
- Djikanović, V.; Skorić, S.B.; Spasić, S.; Naunović, Z.; Lenhardt, M. Ecological risk assessment for different macrophytes and fish species in reservoirs using biota-sediment accumulation factors as a useful tool. Environ. Pollut. 2018, 241, 1167–1174. [Google Scholar] [CrossRef] [PubMed]
- Romanuk, T.N.; Hayward, A.; Hutchings, J.A. Trophic level scales positively with body size in fishes. Glob. Ecol. Biogeogr. 2011, 20, 231–240. [Google Scholar] [CrossRef]
- Arim, M.; Abades, S.R.; Laufer, G.; Loureiro, M.; Marquet, P.A. Food web structure and body size: Trophic position and resource acquisition. Oikos 2010, 119, 147–153. [Google Scholar] [CrossRef]
- Arim, M.; Borthagaray, A.I.; Giacomini, H.C. Energetic constraints to food chain length in a metacommunity framework. Can. J. Fish. Aquat. Sci. 2016, 73, 685–692. [Google Scholar] [CrossRef]
- Bastos, W.R.; Dórea, J.G.; Bernardi, J.V.; Lauthartte, L.C.; Mussy, M.H.; Hauser, M.; Doria, C.R.; Malm, O. Mercury in muscle and brain of catfish from the Madeira river, Amazon, Brazil. Ecotoxicol. Environ. Saf. 2015, 118, 90–97. [Google Scholar] [CrossRef]
- Matos, L.S.; Silva, J.O.; Kasper, D.; Carvalho, L.N. Assessment of mercury contamination in Brycon falcatus (Characiformes: Bryconidae) and human health risk by consumption of this fish from the Teles Pires River, Southern Amazonia. Neotrop. Ichthyol. 2018, 16, 1–12. [Google Scholar] [CrossRef]
- Davis, J.A.; Ross, J.R.; Bezalel, S.N.; Sim, L.L.; Bonnema, A.; Ichikawa, G.; Heim, W.A.; Schiff, K.; Eagles-Smith, C.A.; Ackerman, J.T. Hg concentrations in fish from coastal waters of California and Western North America. Sci. Total Environ. 2016, 568, 1146–1156. [Google Scholar] [CrossRef]
- Kwon, S.Y.; McIntyre, P.B.; Flecker, A.S.; Campbell, L.M. Mercury biomagnification in the food web of a neotropical stream. Sci. Total Environ. 2012, 417–418, 92–97. [Google Scholar] [CrossRef]
- Moura, L.; de Lacerda, L.D. Contrasting Mercury Bioavailability in the Marine and Fluvial Dominated Areas of the Jaguaribe River Basin, Ceará, Brazil. Bull. Environ. Contam. Toxicol. 2018, 101, 49–54. [Google Scholar] [CrossRef] [PubMed]
- de Mérona, B.; Rankin-de-Mérona, J. Food resource partitioning in a fish community of the central Amazon floodplain. Neotrop. Ichthyol. 2004, 2, 75–84. [Google Scholar] [CrossRef]
- Malabarba, M.C.S.L. Revision of the Neotropical genus Triportheus Cope, 1872 (Characiformes: Characidae). Neotrop. Ichthyol. 2004, 2, 4. [Google Scholar] [CrossRef]
- Queiroz, H.L.; Crampton, W.G. Estratégias para Manejo de Recursos Pesqueiros em Mamirauá; MCT-CNPq; Sociedade Civil Mamirauá: Brasília, Brazil, 1999; 208p. [Google Scholar]
- Burkhard, L.P.; Arnot, J.A.; Embry, M.R.; Farley, K.J.; Hoke, R.A.; Kitano, M.; Leslie, H.A.; Lotufo, G.R.; Parkerton, T.F.; Sappington, K.G.; et al. Comparing laboratory- and field-measured biota-sediment accumulation factors. Integr. Environ. Assess. Manag. 2012, 8, 32–41. [Google Scholar] [CrossRef]
- Kwok, C.K.; Liang, Y.; Leung, S.Y.; Wang, H.; Dong, Y.; Young, L.; Giesy, J.P.; Wong, M.H. Biota-sediment accumulation factor (BSAF), bioaccumulation factor (BAF), and contaminant levels in prey fish to indicate the extent of PAHs and OCPs contamination in eggs of waterbirds. Environ. Sci. Pollut. Res. 2013, 20, 8425–8434. [Google Scholar] [CrossRef]
- Vieira, M.; Bernardi, J.V.; Dórea, J.G.; Rocha, B.C.; Ribeiro, R.C.; Zara, L.F. Distribution and availability of mercury and methylmercury in different waters from the Rio Madeira Basin, Amazon. Environ. Pollut. 2018, 235, 771–779. [Google Scholar] [CrossRef]
- Kim, C.S.; Rytuba, J.J.; Brown, G.E. Geological and anthropogenic factors influencing mercury speciation in mine wastes: An EXAFS spectroscopy study. Appl. Geochem. 2004, 19, 379–393. [Google Scholar] [CrossRef]
- Obrist, D.; Kirk, J.L.; Zhang, L.; Sunderland, E.M.; Jiskra, M.; Selin, N.E. A review of global environmental mercury processes in response to human and natural perturbations: Changes of emissions, climate, and land use. Ambio 2018, 47, 116–140. [Google Scholar] [CrossRef]
- Ioele, G.; De Luca, M.; Grande, F.; Durante, G.; Trozzo, R.; Crupi, C.; Ragno, G. Assessment of surface water quality using multivariate analysis: Case study of the crati River, Italy. Water 2020, 12, 2214. [Google Scholar] [CrossRef]
- Tong, Y.; Zhang, W.; Hu, D.; Ou, L.; Hu, X.C.; Yang, T.; Wei, W.; Ju, L.; Wang, X. Behavior of mercury in an urban river and its accumulation in aquatic plants. Environ. Earth Sci. 2013, 68, 1089–1097. [Google Scholar] [CrossRef]
- King, J.; Harmon, S.; Fu, T.; Gladden, J. Mercury removal, methylmercury formation, and sulfate-reducing bacteria profiles in wetland mesocosms. Chemosphere 2002, 46, 859–870. [Google Scholar] [CrossRef] [PubMed]
- Araújo, D.F.; Knoery, J.; Briant, N.; Ponzevera, E.; Chouvelon, T.; Auby, I.; Yépez, S.; Bruzac, S.; Sireau, T.; Pellouin-Grouhel, A.; et al. Metal stable isotopes in transplanted oysters as a new tool for monitoring anthropogenic metal bioaccumulation in marine environments: The case for copper. Environ. Pollut. 2021, 290, 118012. [Google Scholar] [CrossRef] [PubMed]
- Jeong, H.; Ra, K.; Won, J.H. A nationwide survey of trace metals and Zn isotopic signatures in mussels (Mytilus edulis) and oysters (Crassostrea gigas) from the coast of South Korea. Mar. Pollut. Bull. 2021, 173, 113061. [Google Scholar] [CrossRef]
- Thibon, F.; Metian, M.; Oberhänsli, F.; Montañés, M.C.; Vassileva, E.; Orani, A.M.; Télouk, P.; Swarzenski, P.W.; Vigier, N. Bioaccumulation of lithium isotopes in mussel soft tissues and implications for coastal environments. ACS Earth Space Chem. 2021, 5, 1407–1417. [Google Scholar] [CrossRef]
- Wang, L.; Wang, X.; Chen, H.; Wang, Z.; Jia, X. Oyster arsenic, cadmium, copper, mercury, lead and zinc levels in the northern South China Sea: Long-term spatiotemporal distributions, combined effects, and risk assessment to human health. Environ. Sci. Pollut. Res. 2022, 29, 12706–12719. [Google Scholar] [CrossRef] [PubMed]


| Fish Species | TP± SD 1 | n | Mean ± SD THg (µg·g−1) | Min 2 THg (µg·g−1) | Max 2 THg (µg·g−1) |
|---|---|---|---|---|---|
| Piscivores 3 | |||||
| Agoniates halecinus | 2.9 ± 0.3 | 39 | 1.20 ± 0.74 | 0.14 | 2.87 |
| Hydrolycus tatauaia | 4.3 ± 0.8 | 2 | 0.88 ± 0.07 | 0.87 | 0.88 |
| Plagioscion squamosissimus | 4.4 ± 0.5 | 6 | 0.76 ± 0.34 | 0.53 | 1.44 |
| Raphiodon vulpinus | 4.5 ± 0.8 | 8 | 0.75 ± 0.41 | 0.35 | 1.32 |
| Serrasalmus rhombeus | 4.0 ± 0.4 | 9 | 0.62 ± 0.32 | 0.12 | 1.04 |
| Pygocentrus nattereri | 3.7 ± 0.6 | 31 | 0.58 ± 0.30 | 0.24 | 1.79 |
| Serrasalmus maculatus | 4.1 ± 0.7 | 8 | 0.51 ± 0.41 | 0.11 | 1.25 |
| Hydrolycus armatus | 4.5 ± 0.8 | 7 | 0.40 ± 0.26 | 0.19 | 0.86 |
| Carnivores 3 | |||||
| Pellona castelnaeana | 3.7 ± 0.5 | 16 | 1.97 ± 1.69 | 0.29 | 6.93 |
| Arapaima gigas | 4.5 ± 0.0 | 3 | 0.13 ± 0.006 | 0.12 | 0.13 |
| Bryconops alburnoides | 3.2 ± 0.4 | 4 | 0.35 ± 0.07 | 0.30 | 0.47 |
| Auchenipterus nuchalis | 3.6 ± 0.5 | 3 | 0.24 ± 0.04 | 0.19 | 0.28 |
| Argonectes robertsi | 2.8 ± 0.4 | 4 | 0.27 ± 0.17 | 0.05 | 0.42 |
| Omnivores 3 | |||||
| Triportheus elongatus | 2.9 ± 0.3 | 15 | 1.56 ± 1.01 | 0.19 | 3.18 |
| Serrasalmus eigenmanni | 3.7 ± 0.6 | 6 | 0.30 ± 0.19 | 0.09 | 0.62 |
| Metynnis hypsauchen | 3.5 ± 0.6 | 3 | 0.30 ± 0.07 | 0.21 | 0.35 |
| Hemiodus microlepis | 2.8 ± 0.3 | 5 | 0.26 ± 0.13 | 0.04 | 0.42 |
| Anodus elongatus | 3.4 ± 0.4 | 6 | 0.25 ± 0.09 | 0.13 | 0.36 |
| Pimelodus blochii | 3.1 ± 0.4 | 13 | 0.16 ± 0.06 | 0.09 | 0.30 |
| Detritivores 3 | |||||
| Curimata inornata | 2.0 ± 0.0 | 31 | 0.17 ± 0.11 | 0.05 | 0.53 |
| Psectrogaster amazonica | 2.0 ± 0.0 | 20 | 0.13 ± 0.04 | 0.07 | 0.24 |
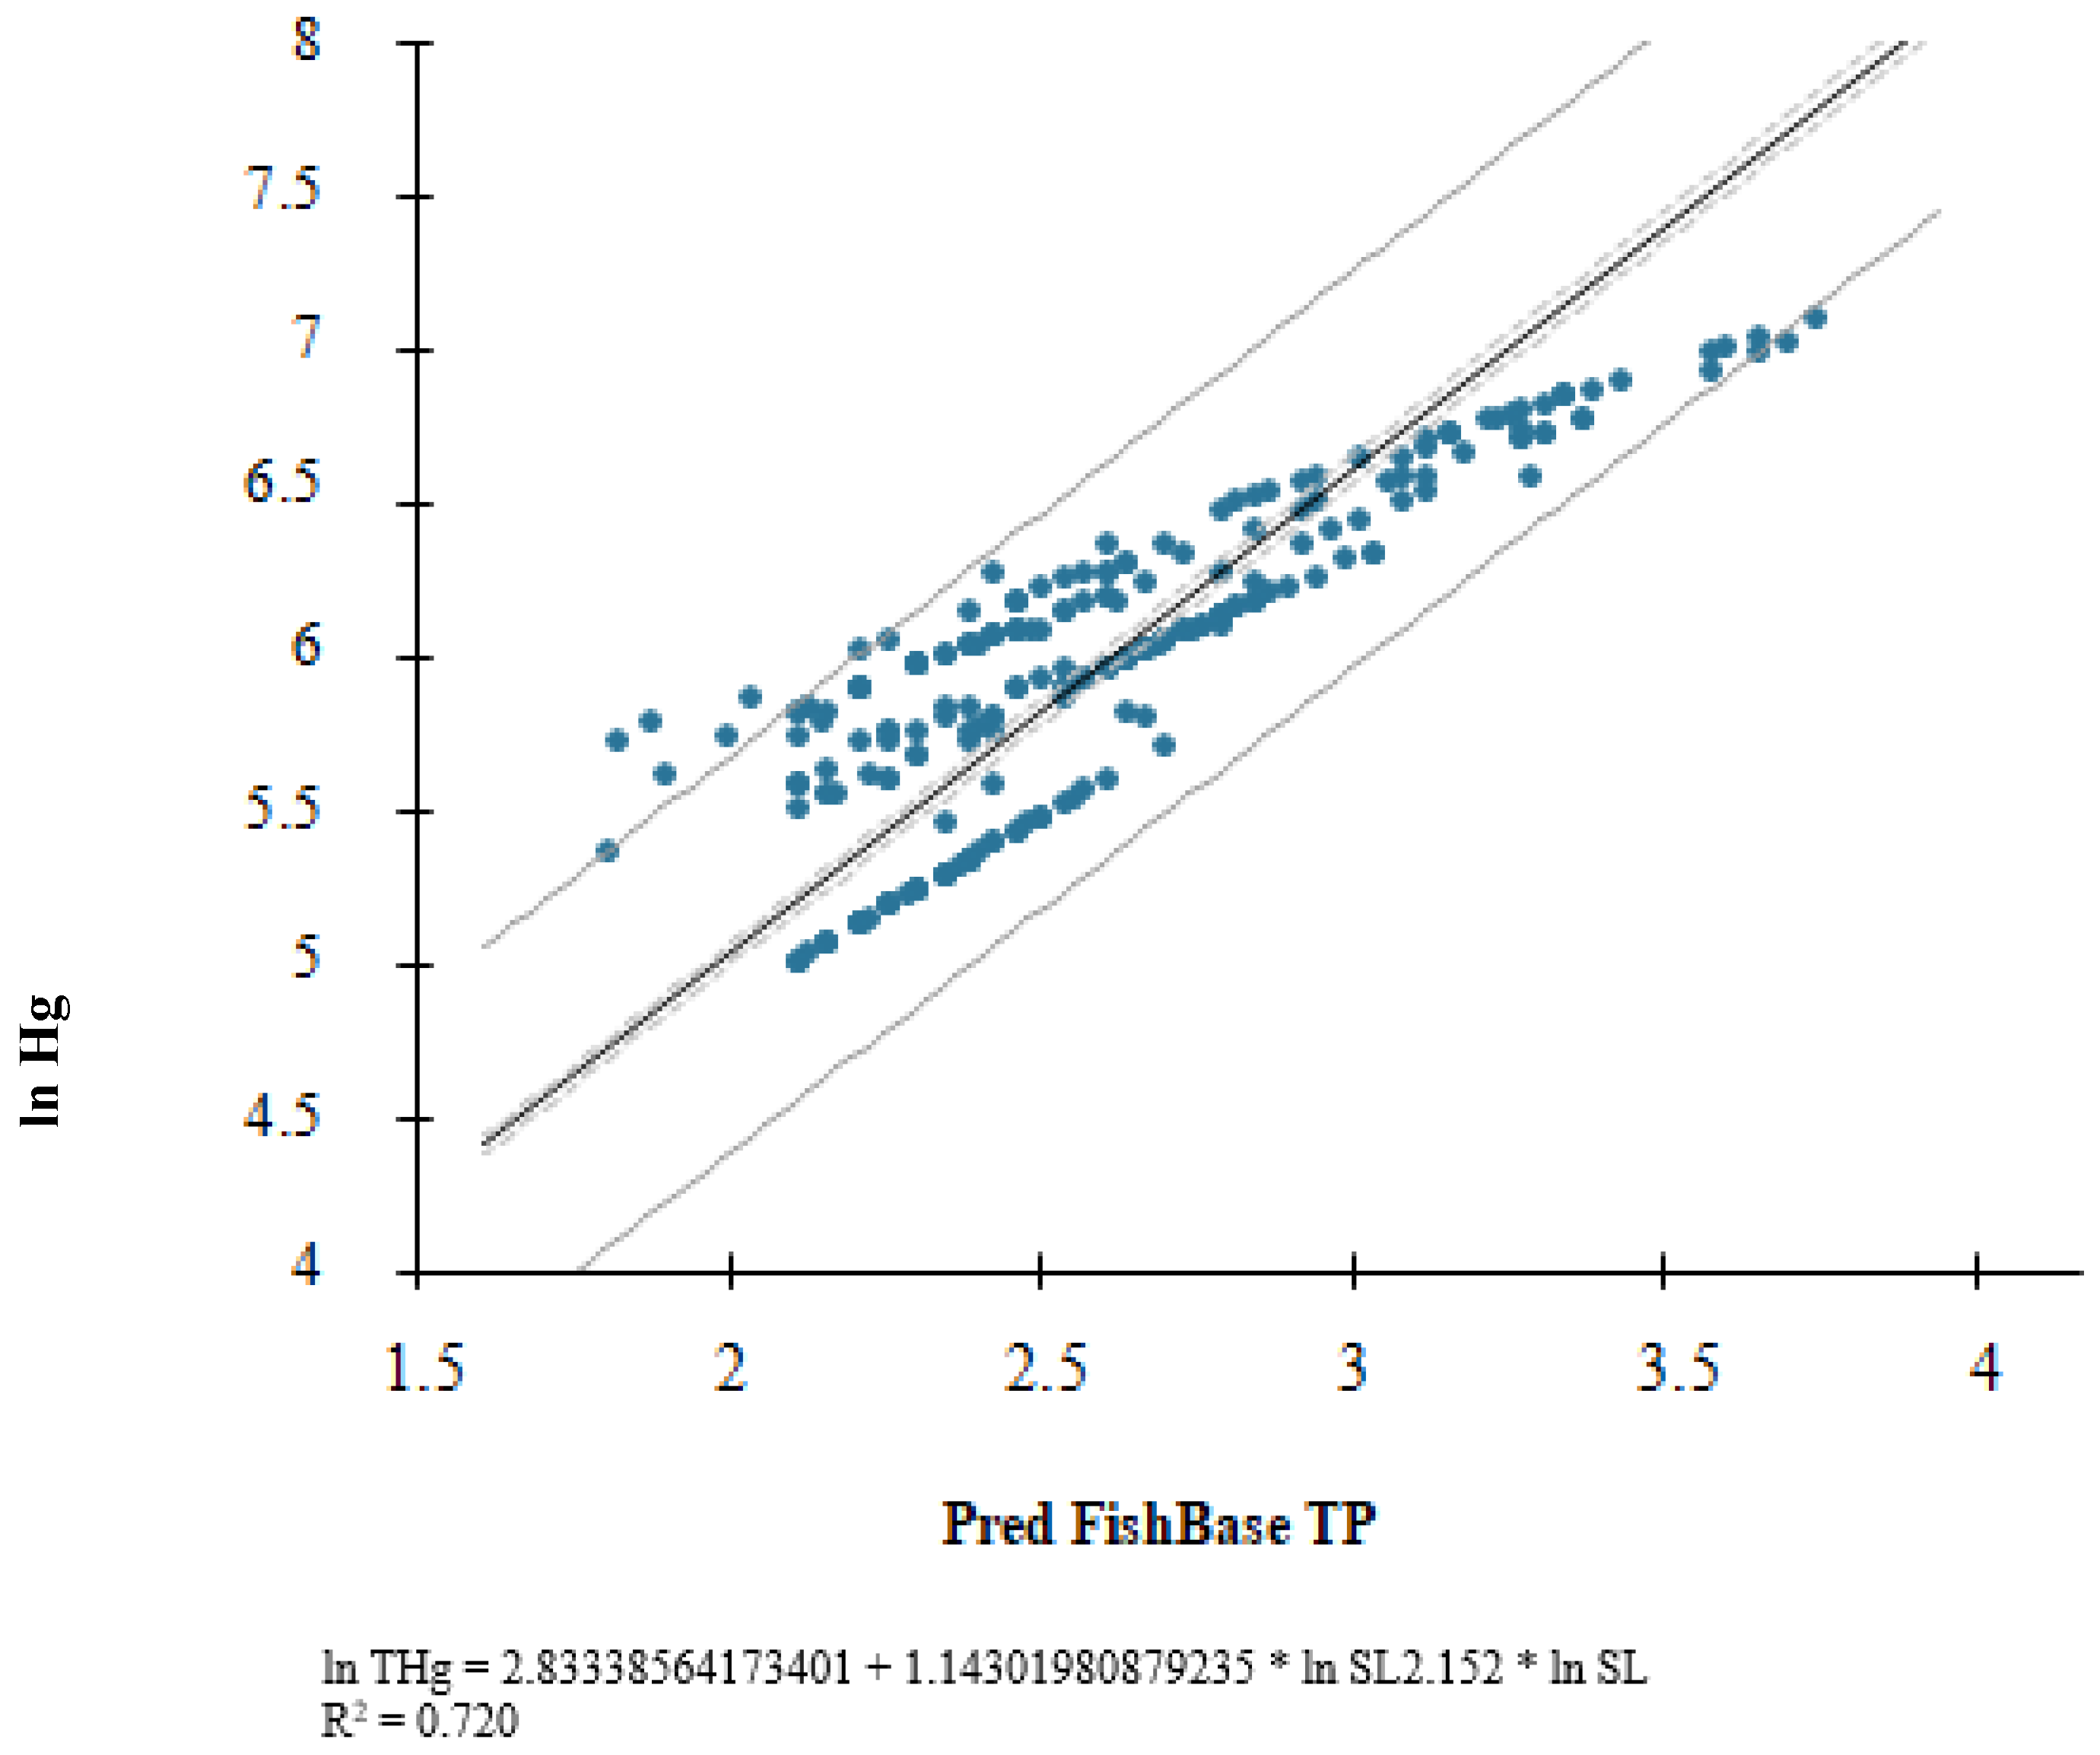
| Predictors | Coefficients | t-Value | Significance (p) |
|---|---|---|---|
| ln SL | 2.690 ± 0.057 | 45.135 | <0.0001 |
| ln med FishBase | 1.114 ± 0.031 | 32.703 | <0.0001 |
| ln SL ∗ ln med FishBase 1 | 0.740 ± 0.023 | 32.842 | <0.0001 |
Disclaimer/Publisher’s Note: The statements, opinions and data contained in all publications are solely those of the individual author(s) and contributor(s) and not of MDPI and/or the editor(s). MDPI and/or the editor(s) disclaim responsibility for any injury to people or property resulting from any ideas, methods, instructions or products referred to in the content. |
© 2023 by the authors. Licensee MDPI, Basel, Switzerland. This article is an open access article distributed under the terms and conditions of the Creative Commons Attribution (CC BY) license (https://creativecommons.org/licenses/by/4.0/).
Share and Cite
de Castro Moraes, L.; Bernardi, J.V.E.; de Souza, J.P.R.; Portela, J.F.; Pereira, H.R.; de Oliveira Barbosa, H.; Pires, N.L.; Monteiro, L.C.; Rodrigues, Y.O.S.; Vieira, L.C.G.; et al. Mercury Contamination as an Indicator of Fish Species’ Trophic Position in the Middle Araguaia River, Brazil. Toxics 2023, 11, 886. https://doi.org/10.3390/toxics11110886
de Castro Moraes L, Bernardi JVE, de Souza JPR, Portela JF, Pereira HR, de Oliveira Barbosa H, Pires NL, Monteiro LC, Rodrigues YOS, Vieira LCG, et al. Mercury Contamination as an Indicator of Fish Species’ Trophic Position in the Middle Araguaia River, Brazil. Toxics. 2023; 11(11):886. https://doi.org/10.3390/toxics11110886
Chicago/Turabian Stylede Castro Moraes, Lilian, José Vicente Elias Bernardi, João Pedro Rudrigues de Souza, Joelma Ferreira Portela, Hasley Rodrigo Pereira, Hugo de Oliveira Barbosa, Nayara Luiz Pires, Lucas Cabrera Monteiro, Ygor Oliveira Sarmento Rodrigues, Ludgero Cardoso Galli Vieira, and et al. 2023. "Mercury Contamination as an Indicator of Fish Species’ Trophic Position in the Middle Araguaia River, Brazil" Toxics 11, no. 11: 886. https://doi.org/10.3390/toxics11110886
APA Stylede Castro Moraes, L., Bernardi, J. V. E., de Souza, J. P. R., Portela, J. F., Pereira, H. R., de Oliveira Barbosa, H., Pires, N. L., Monteiro, L. C., Rodrigues, Y. O. S., Vieira, L. C. G., Sousa Passos, C. J., de Souza, J. R., Bastos, W. R., & Dórea, J. G. (2023). Mercury Contamination as an Indicator of Fish Species’ Trophic Position in the Middle Araguaia River, Brazil. Toxics, 11(11), 886. https://doi.org/10.3390/toxics11110886