


Study on Tritium and Iodine Species Transport through Porous Granite: A Non-Sorption Effect by Anion Exclusion

 ,
, 
Abstract
:1. Introduction
2. Theory of Advection and Dispersion
2.1. Equilibrium Transport
2.2. Two-Region Nonequilibrium Transport
3. Experiments
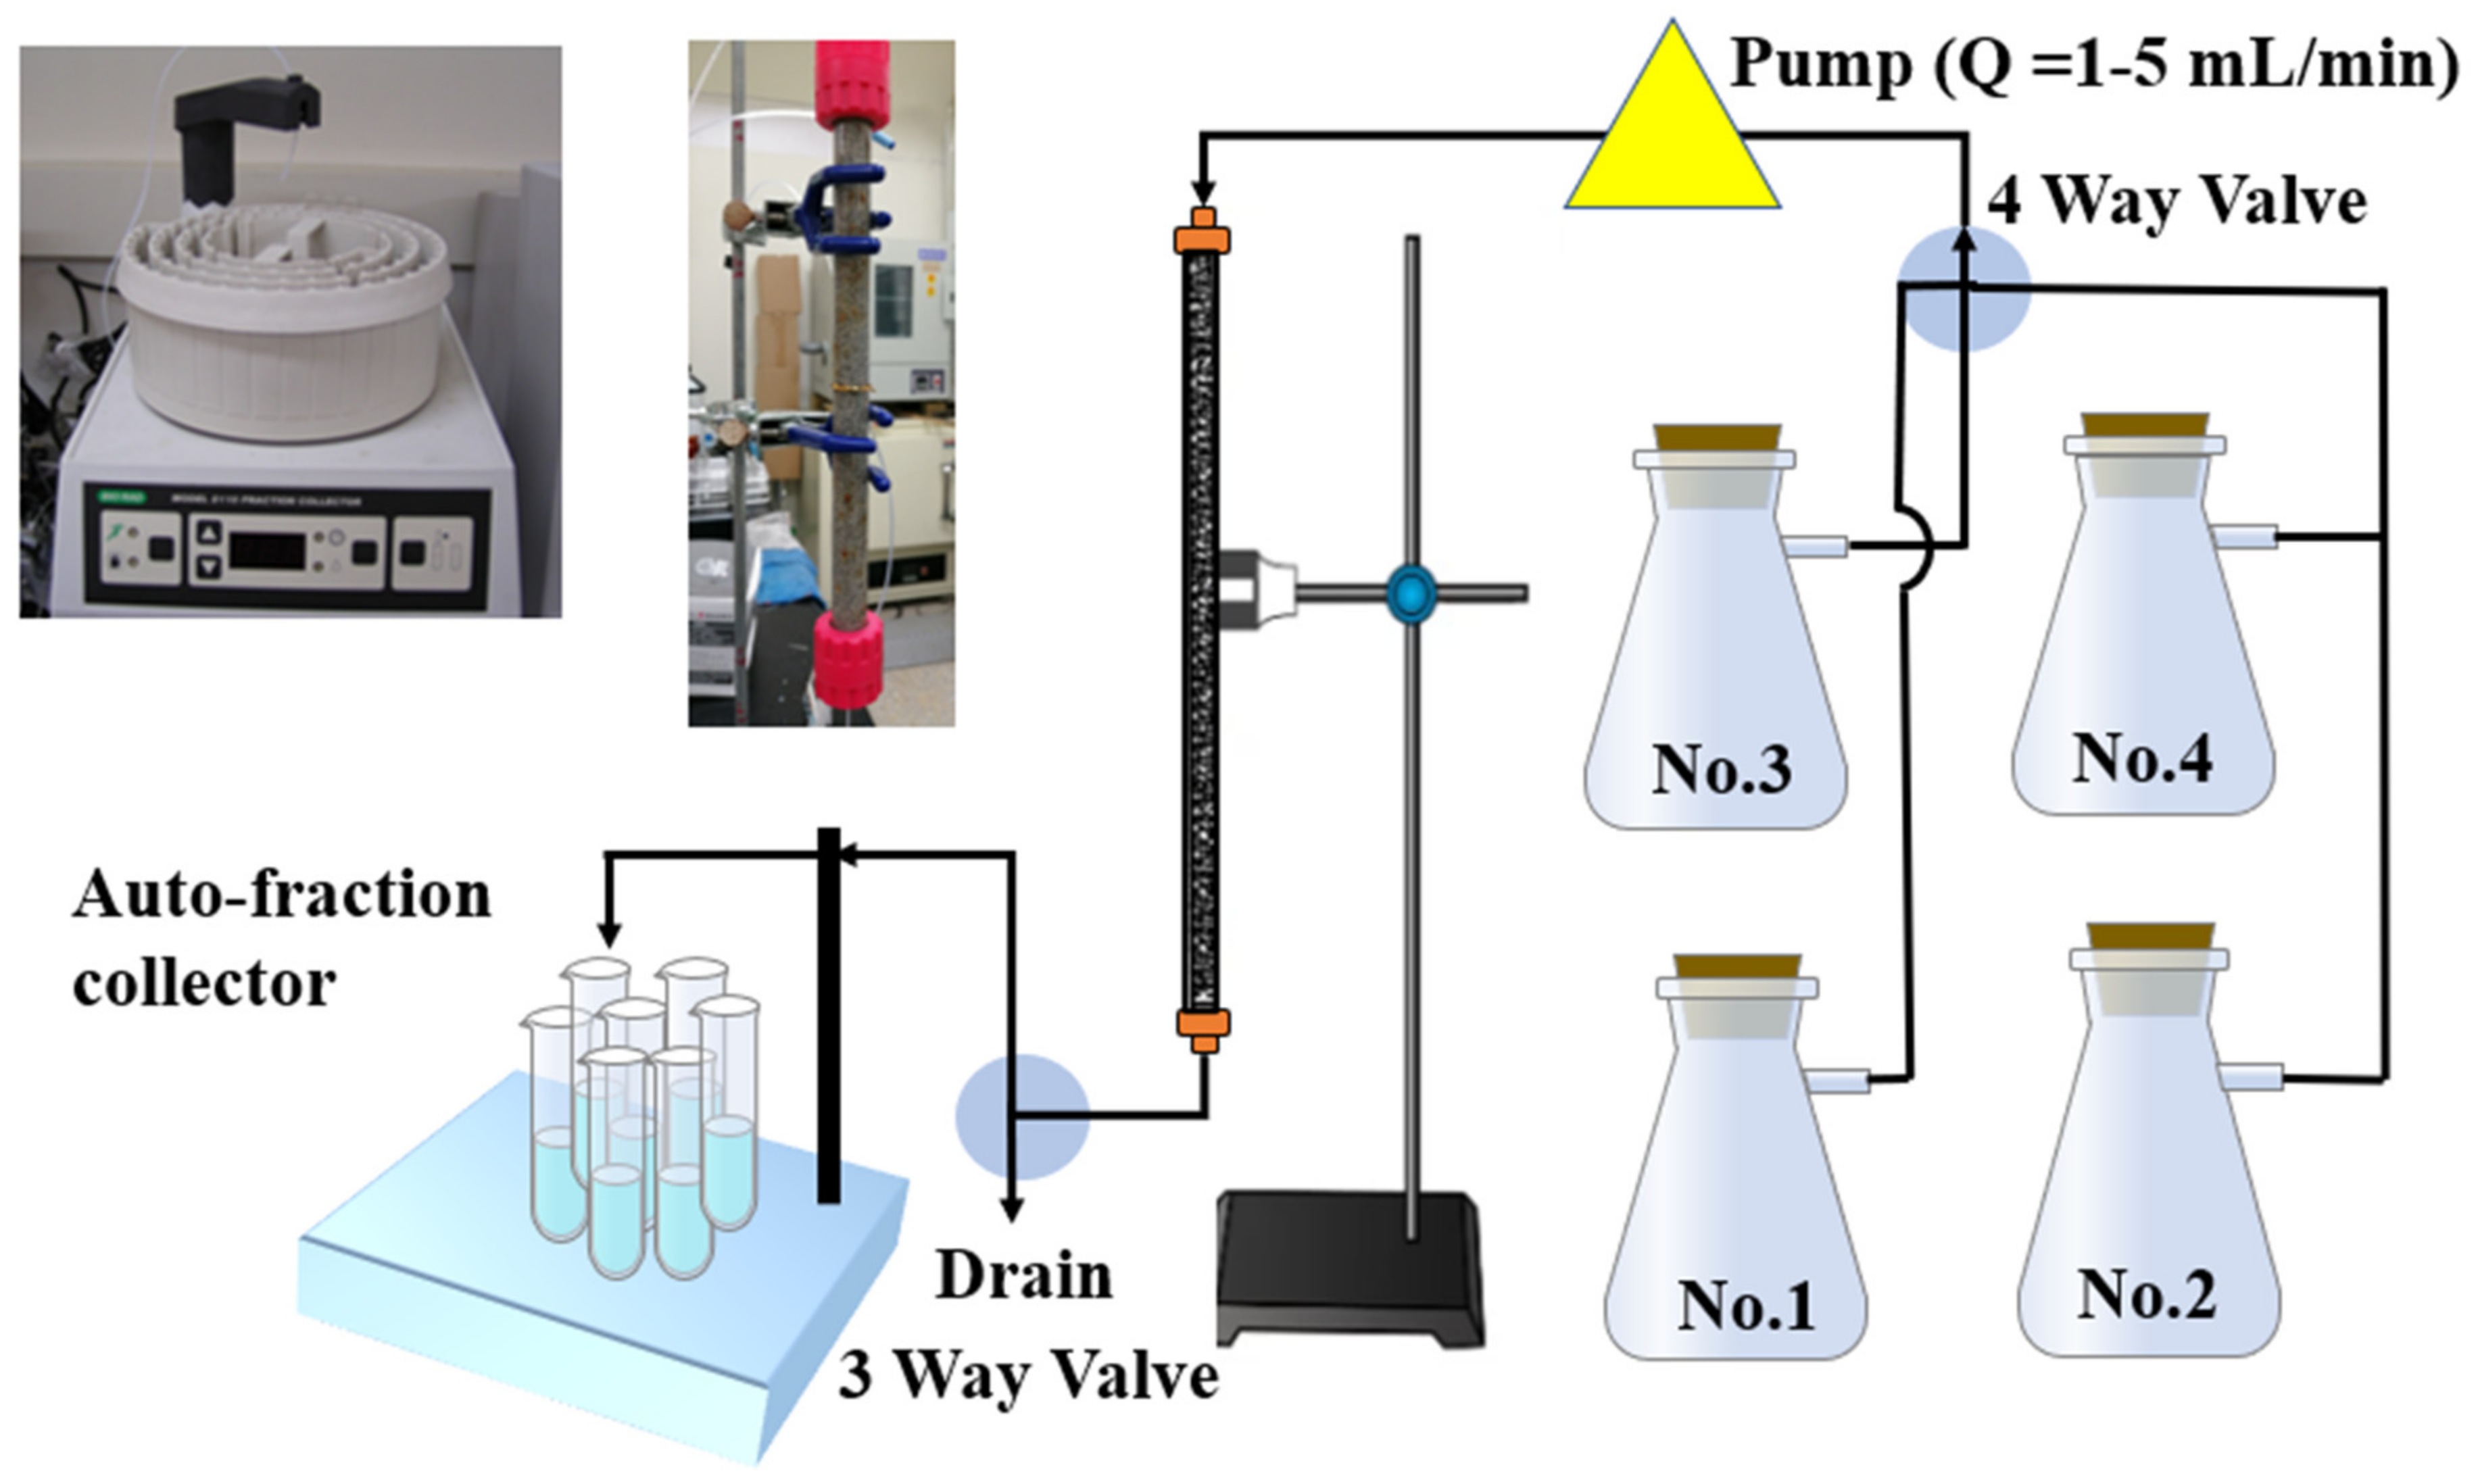
3.1. Experimental Device
3.2. Rocks and Liquids
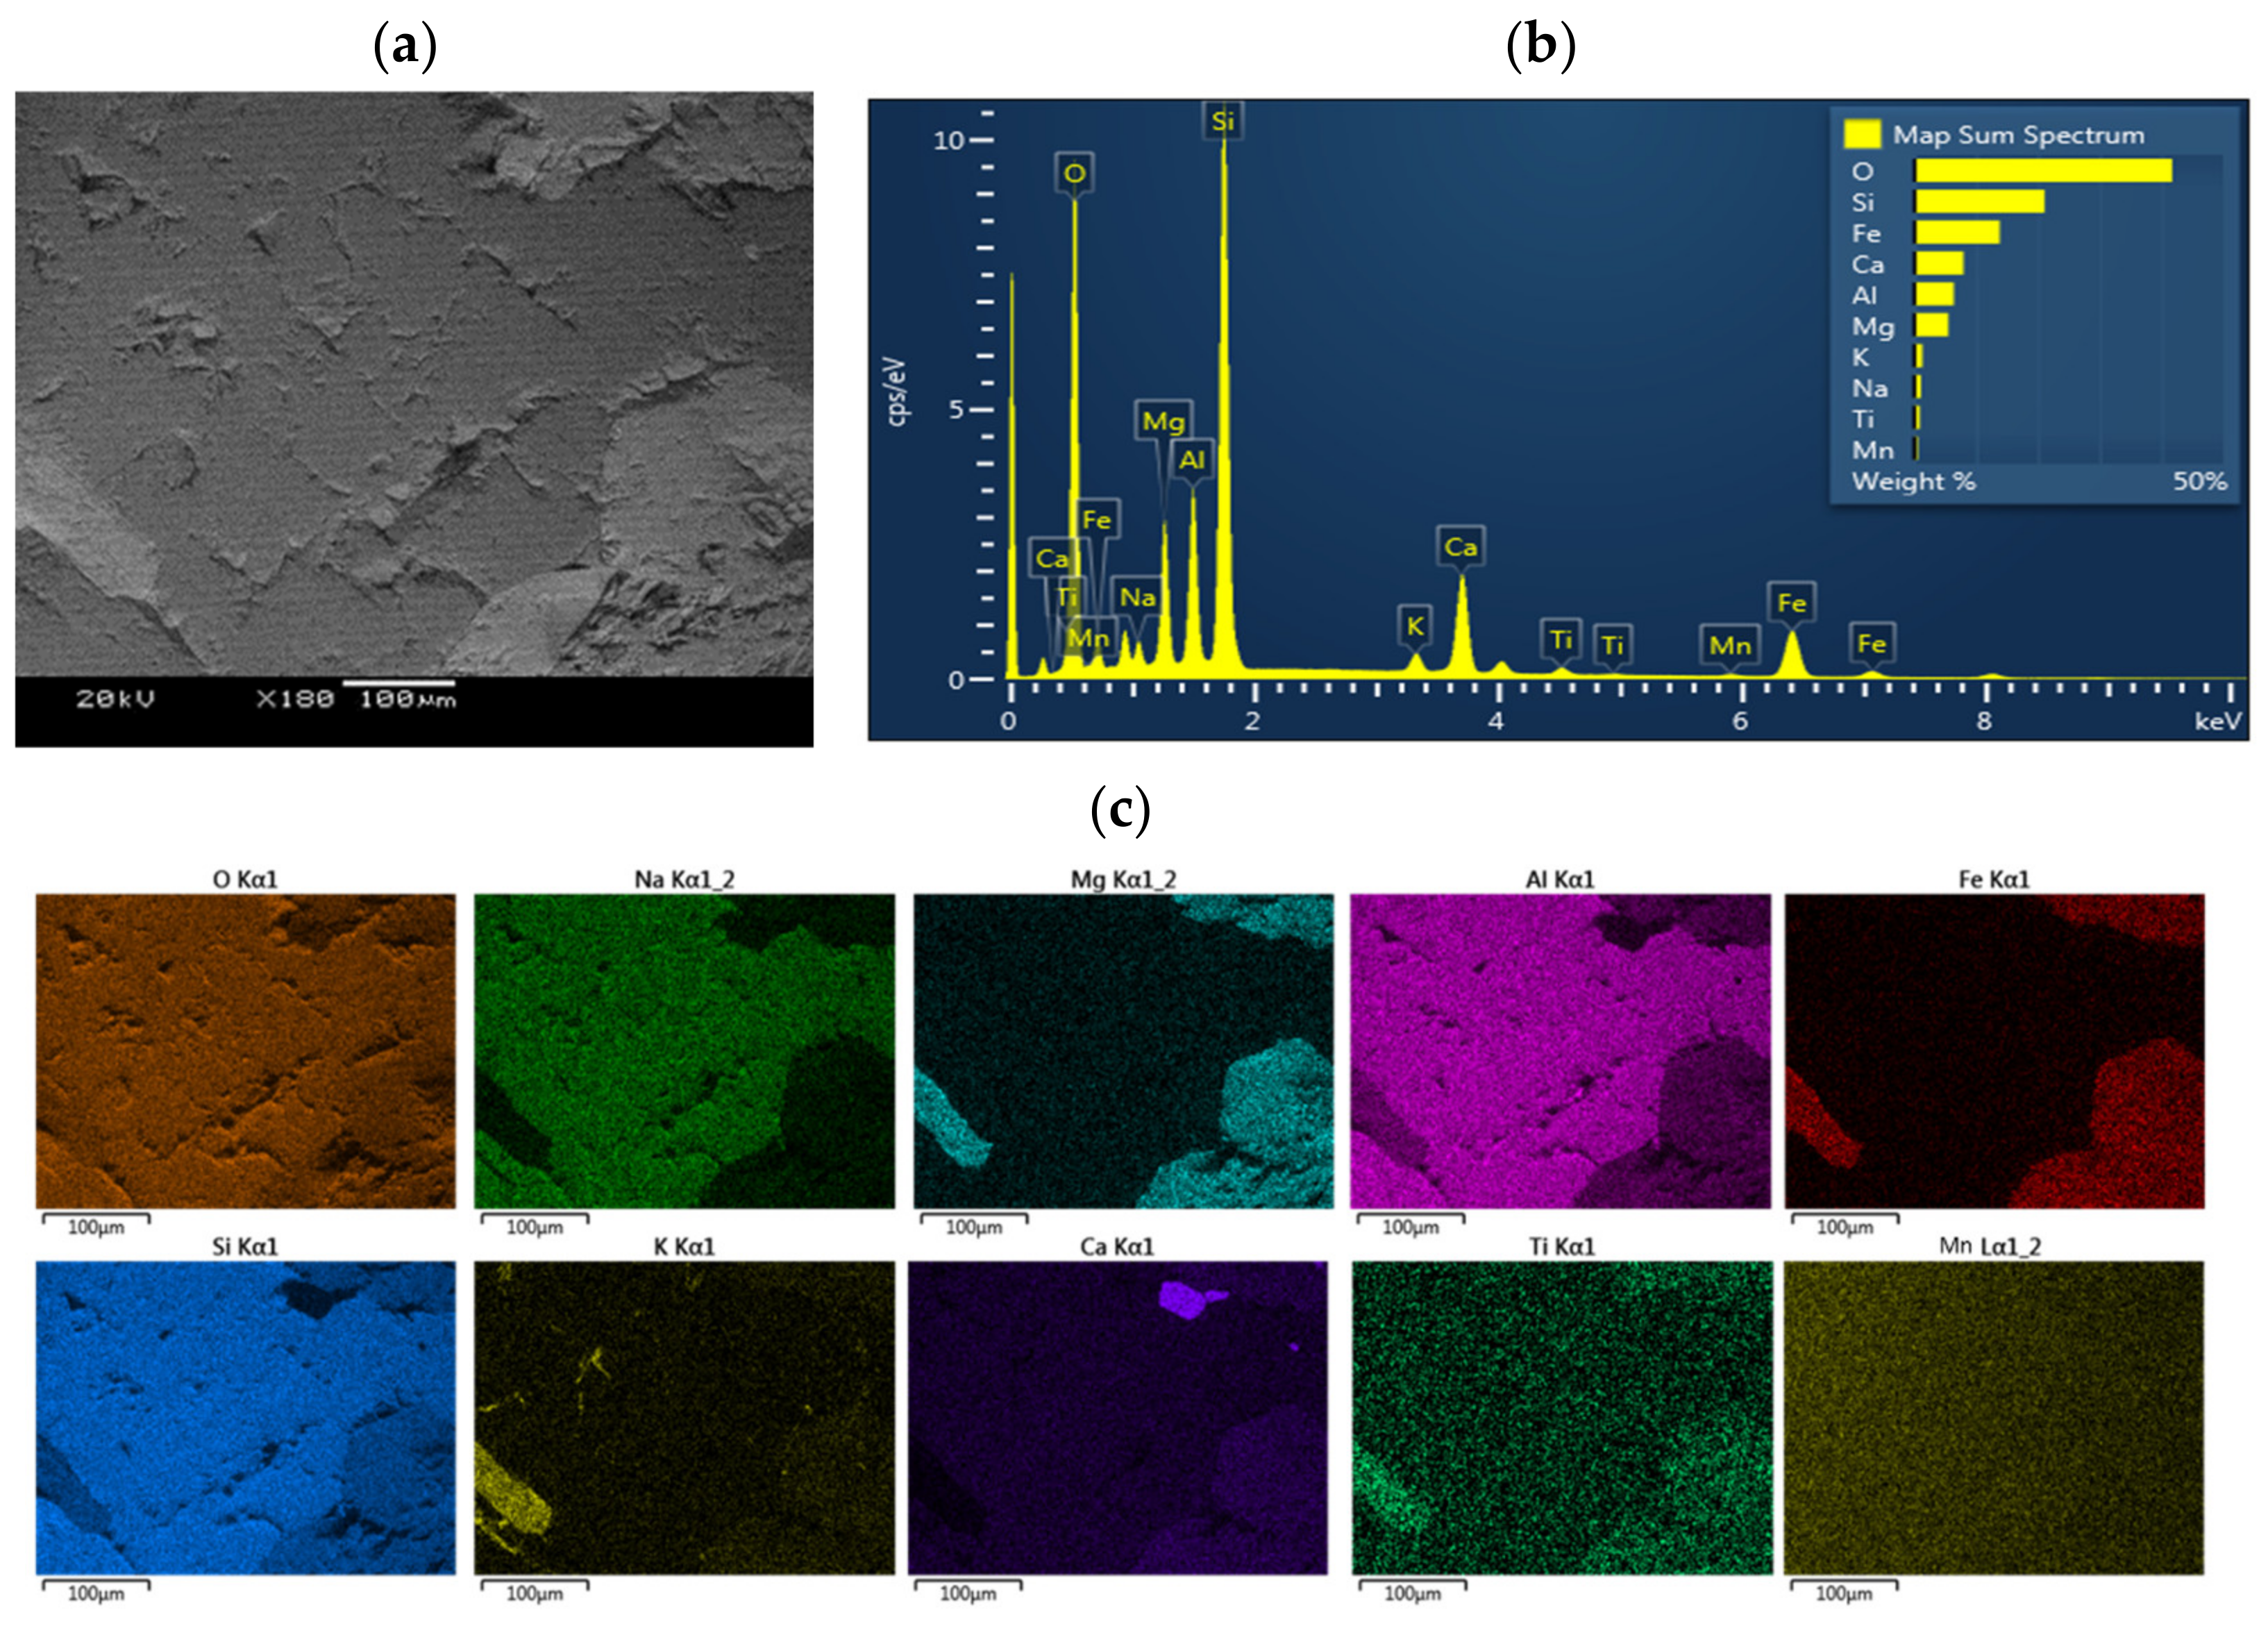
3.3. Mineral Composition and Elemental Analysis
3.4. Pre-Equilibrium: Water Saturation in Column
3.5. Nonreactive Tests of HTO
3.6. Reactive Tests of I− and IO3− (Anion Exclusion)
3.7. Mathematical Model and Parameter Estimations
4. Results and Discussion
4.1. Elemental Analysis by SEM–EDS
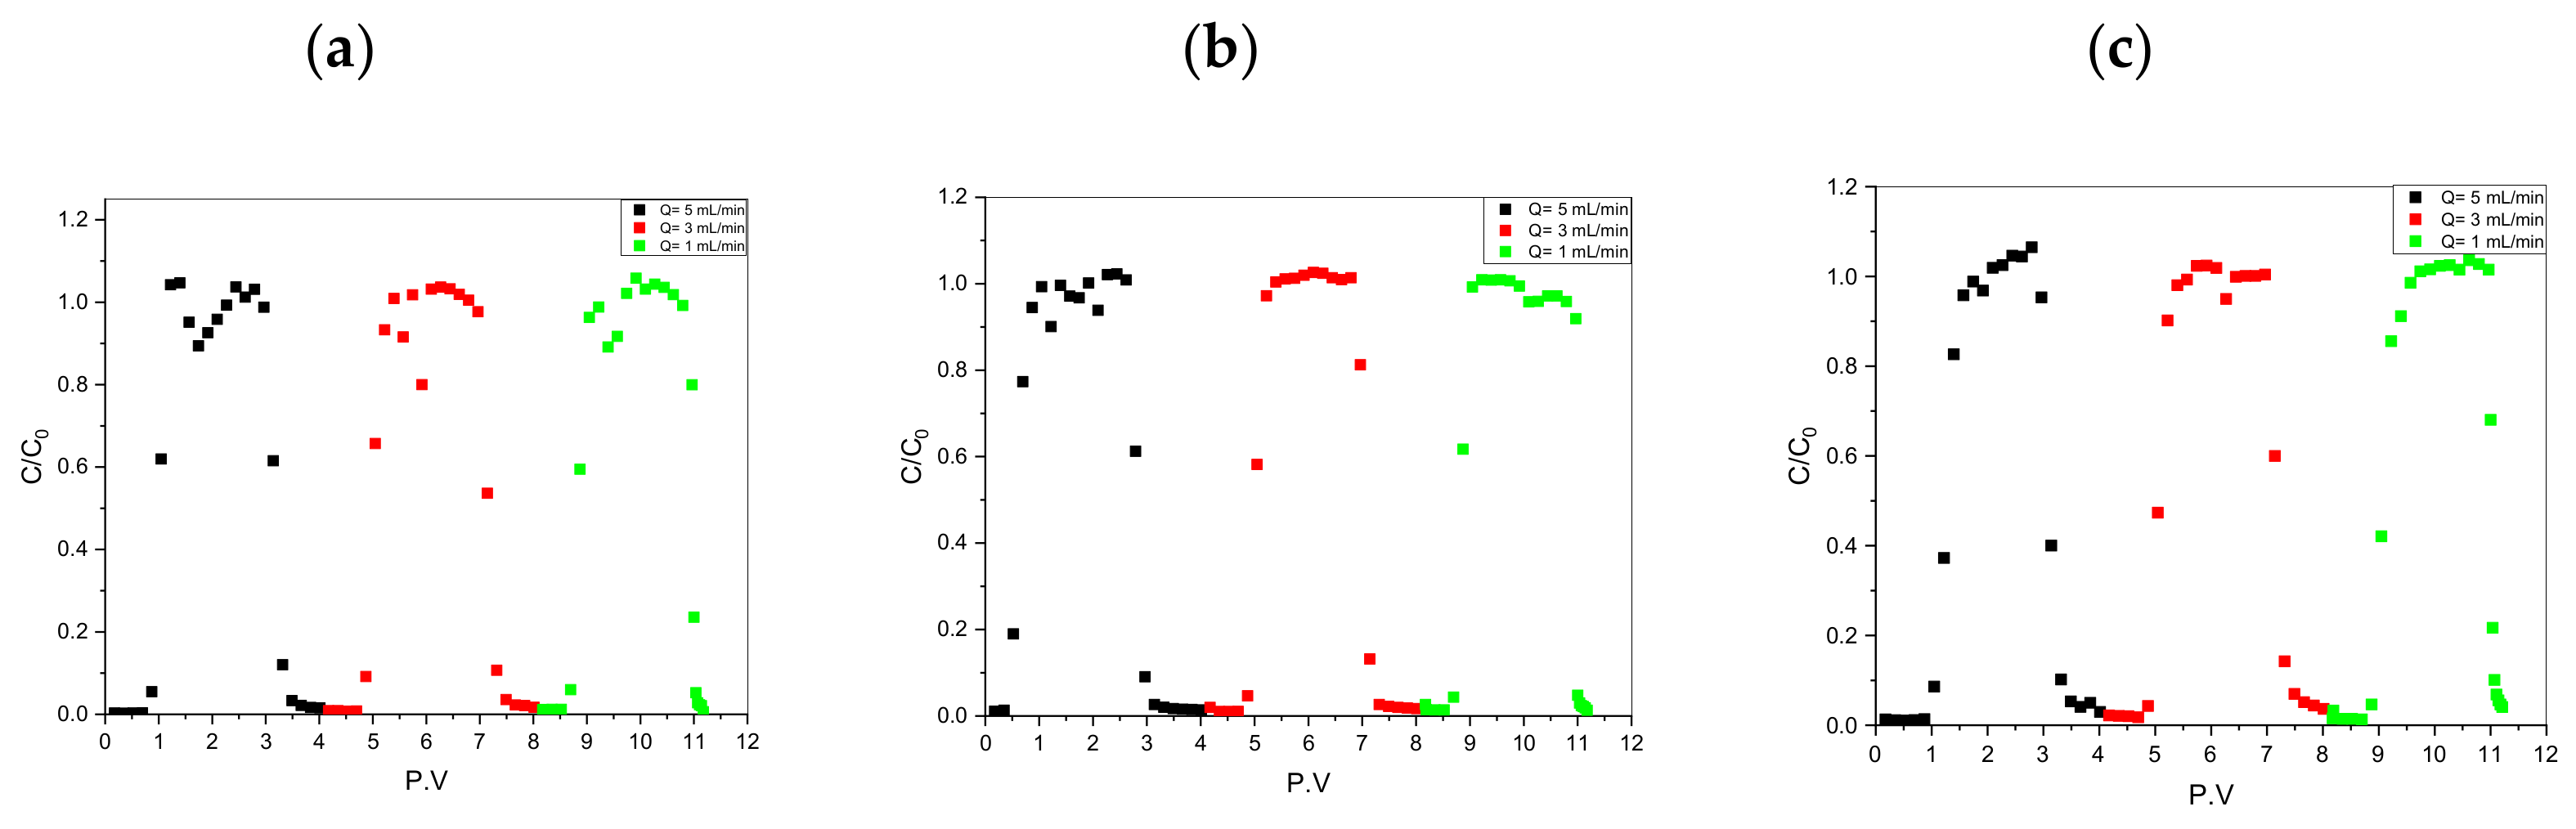
4.2. Experimental BTCs of HTO, I−, and IO3−
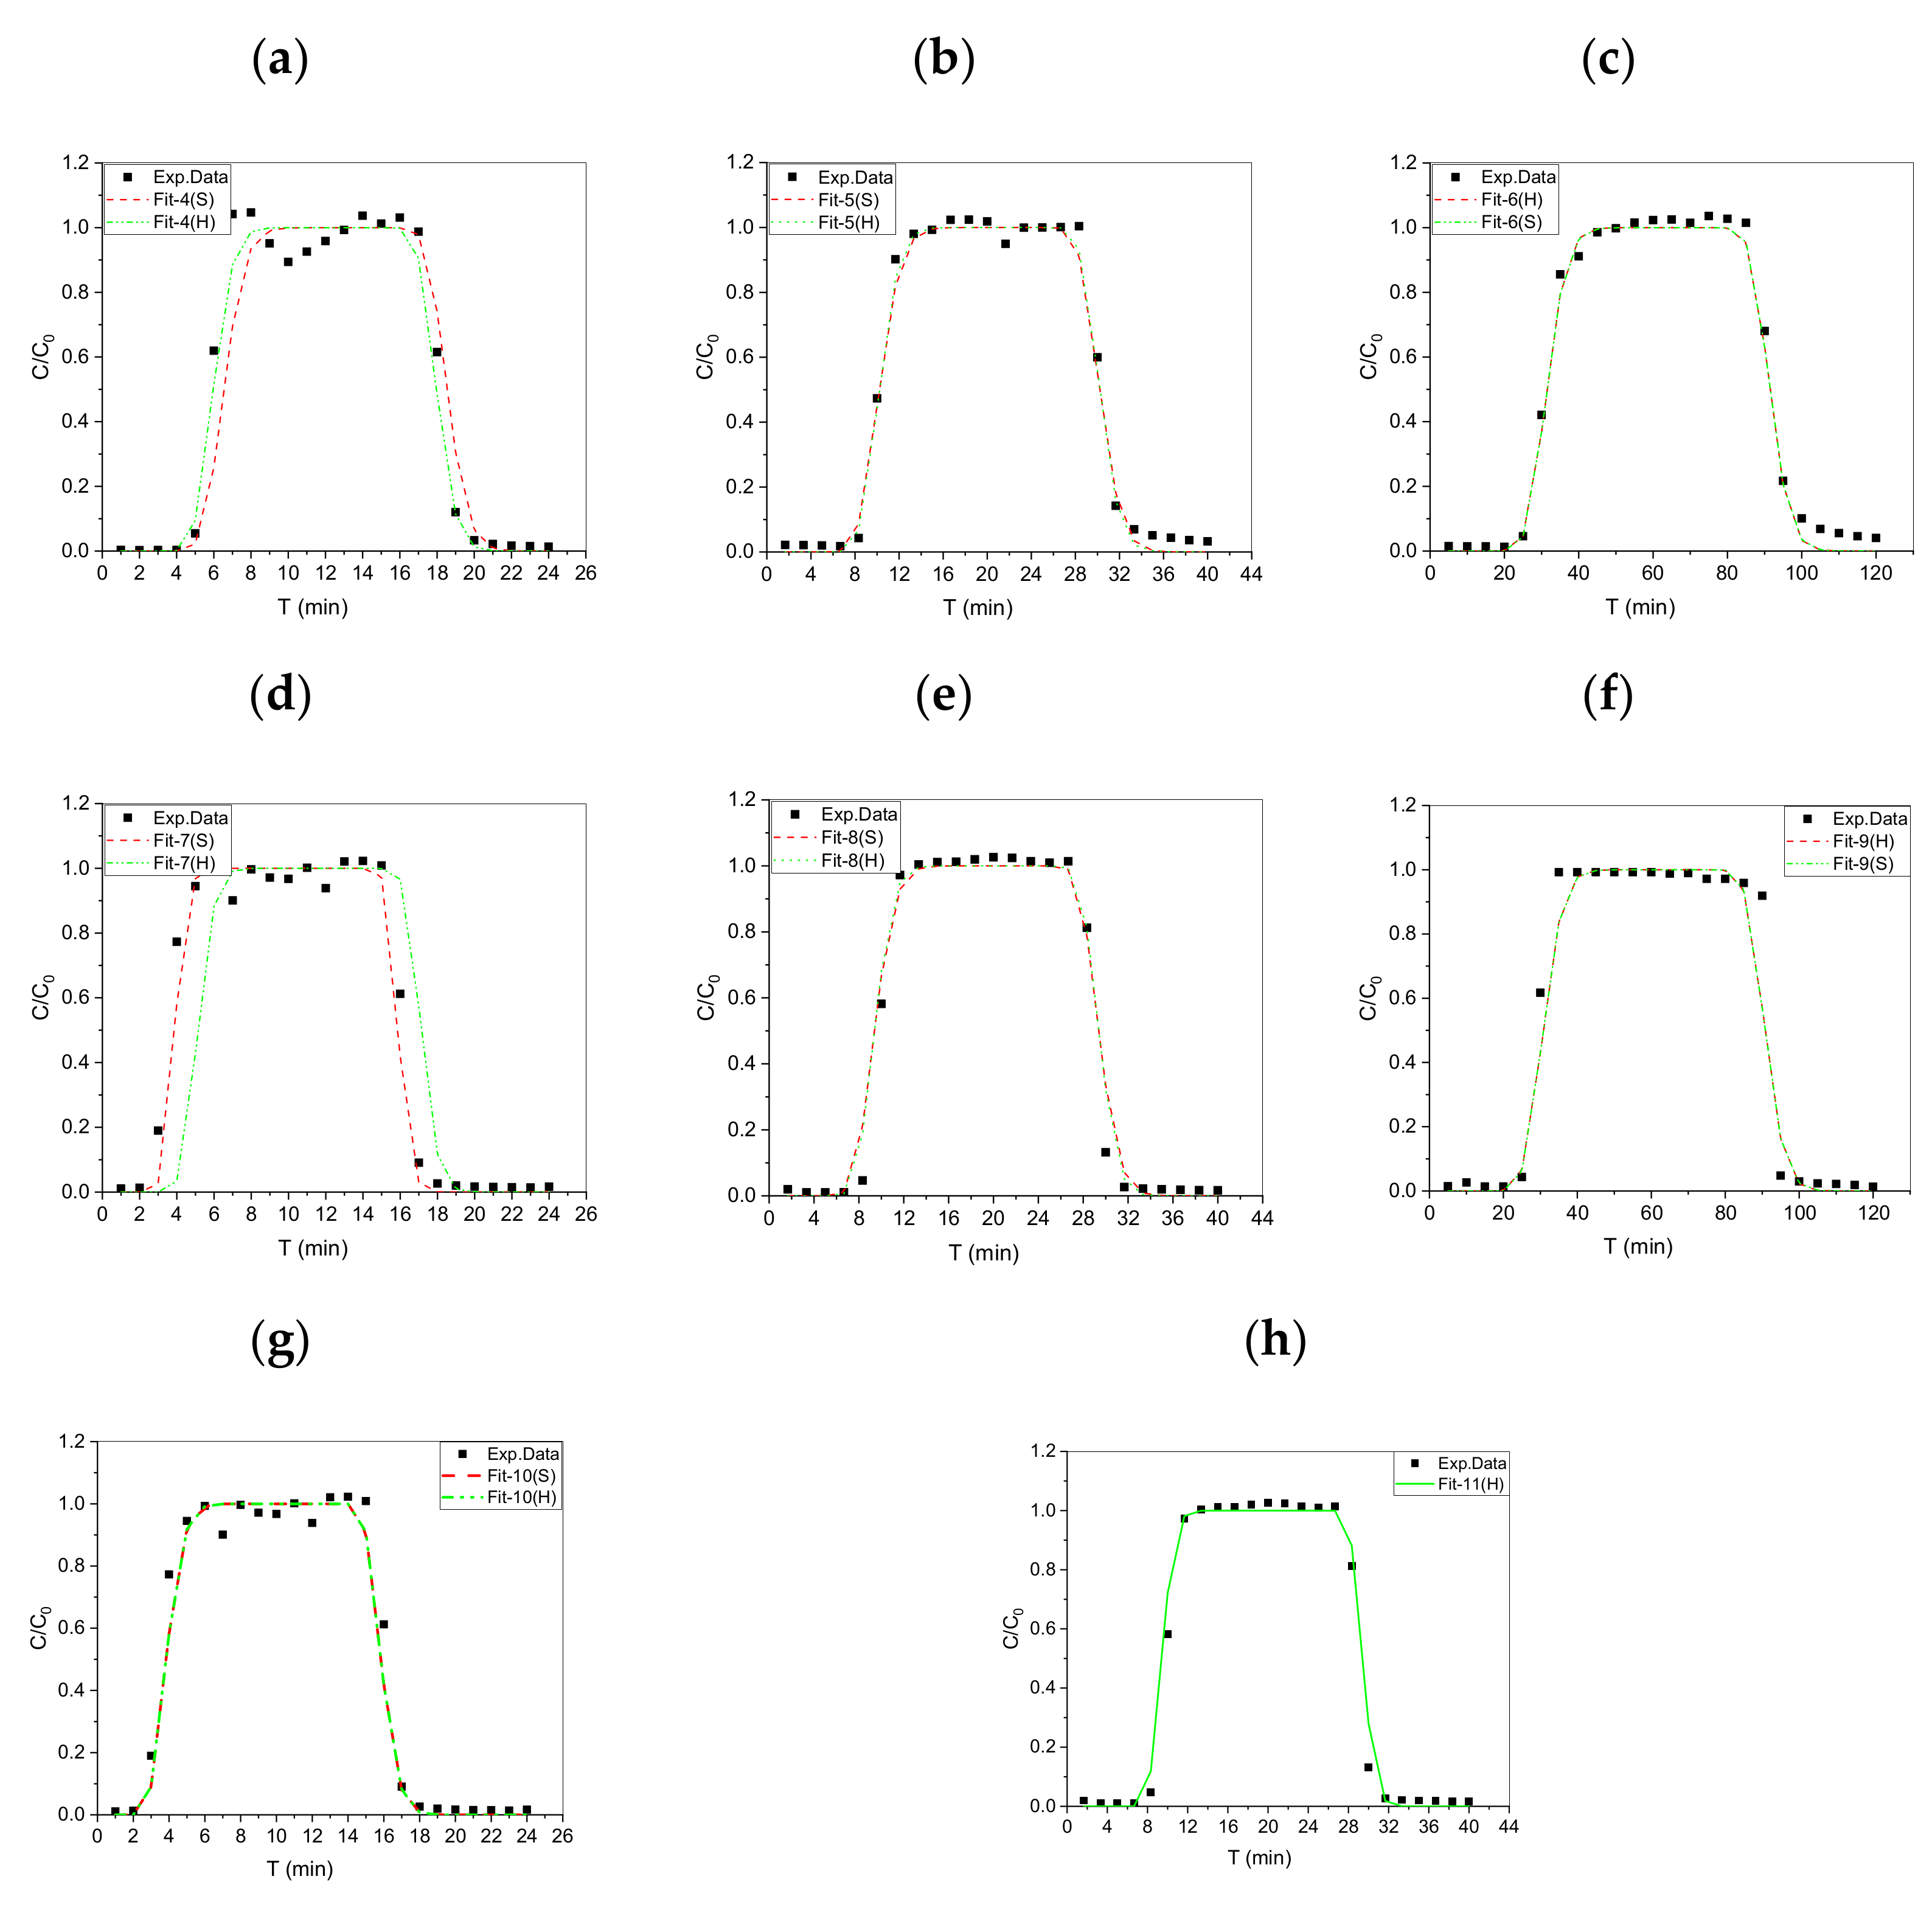
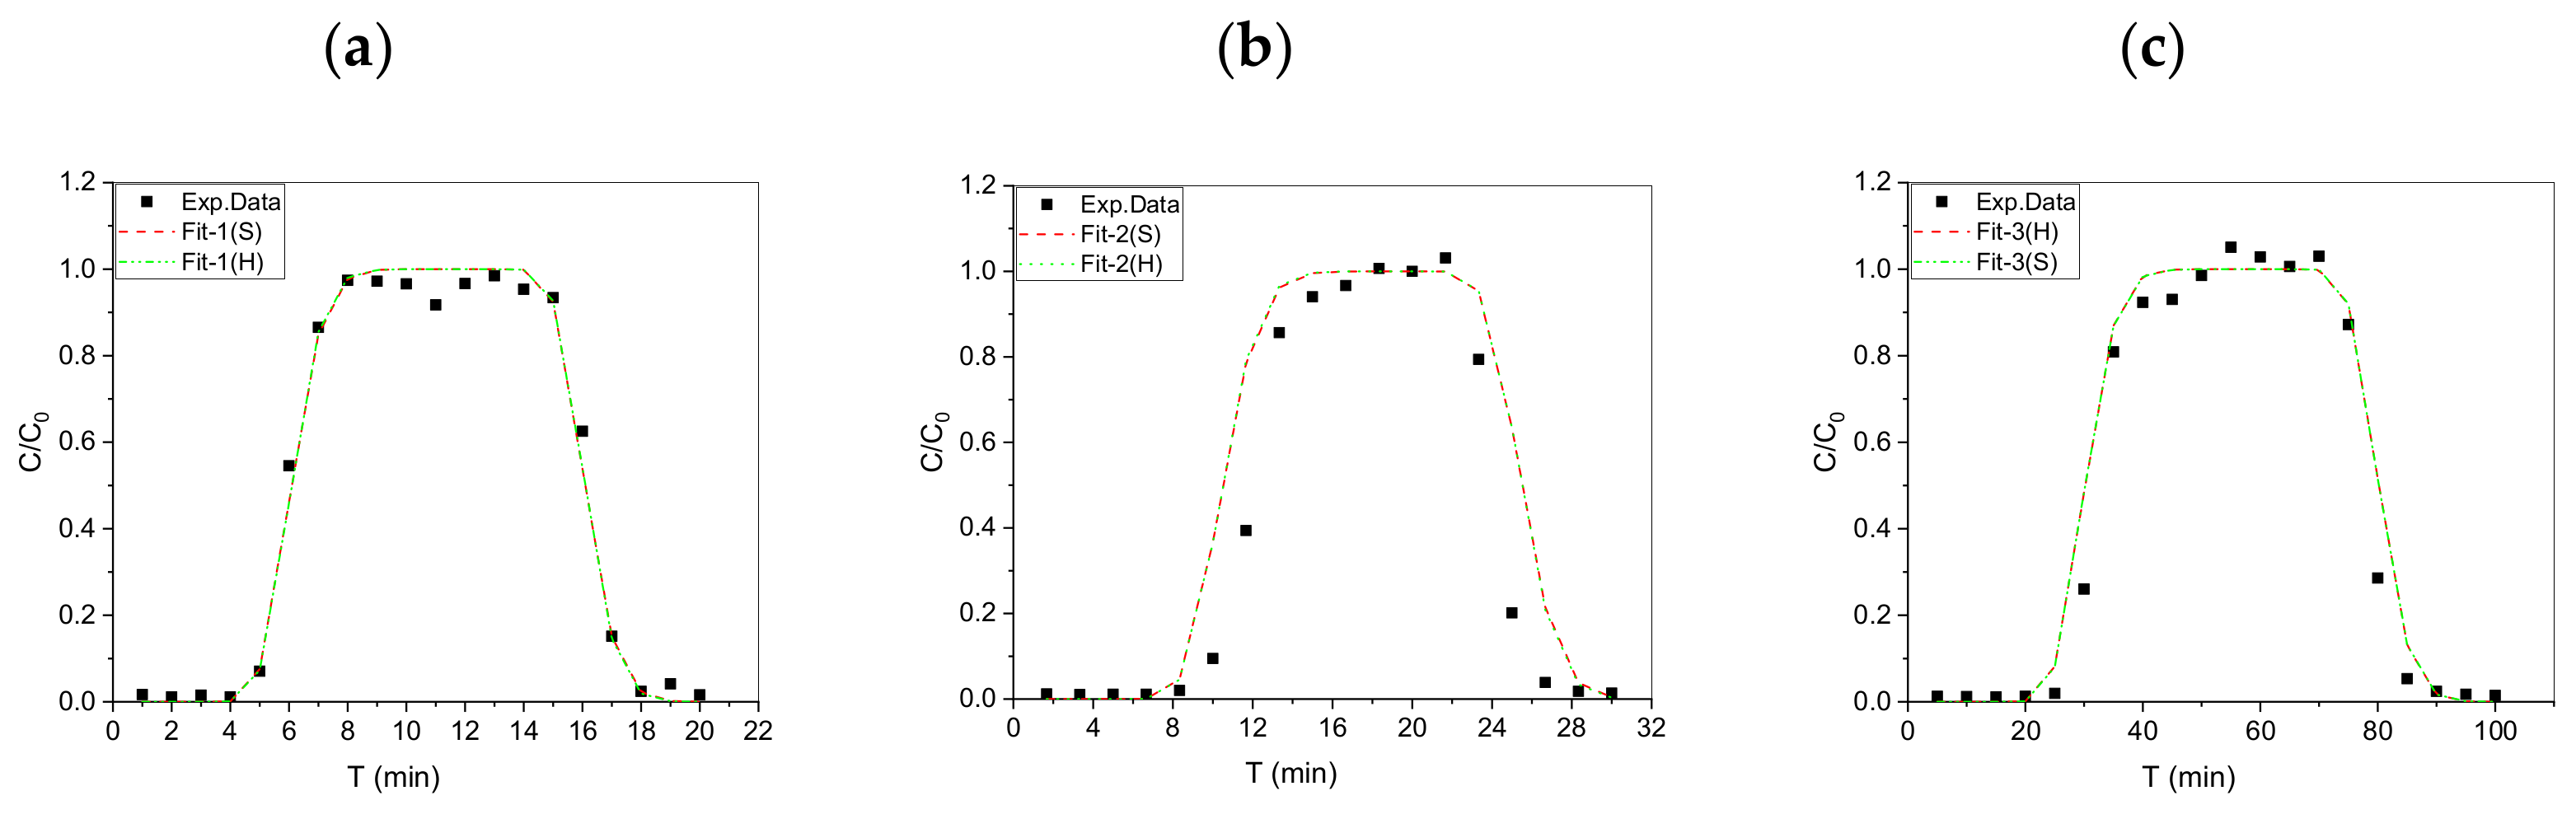
4.3. Fitting BTCs of Nonreactive Tracer (HTO)
4.4. Fitting BTCs of Anionic I− and IO3−
5. Conclusions
- 1.
- The BTCs for HTO were symmetrical at various flow rates (1.0 ± 0.1–5.0 ± 0.1 mL/min), and no significant differences were found in the accessible porosity and dispersivity values of HTO. Therefore, the experimental apparatus was highly reliable, and the granite samples filled and compacted in the column were almost homogeneous.
- 2.
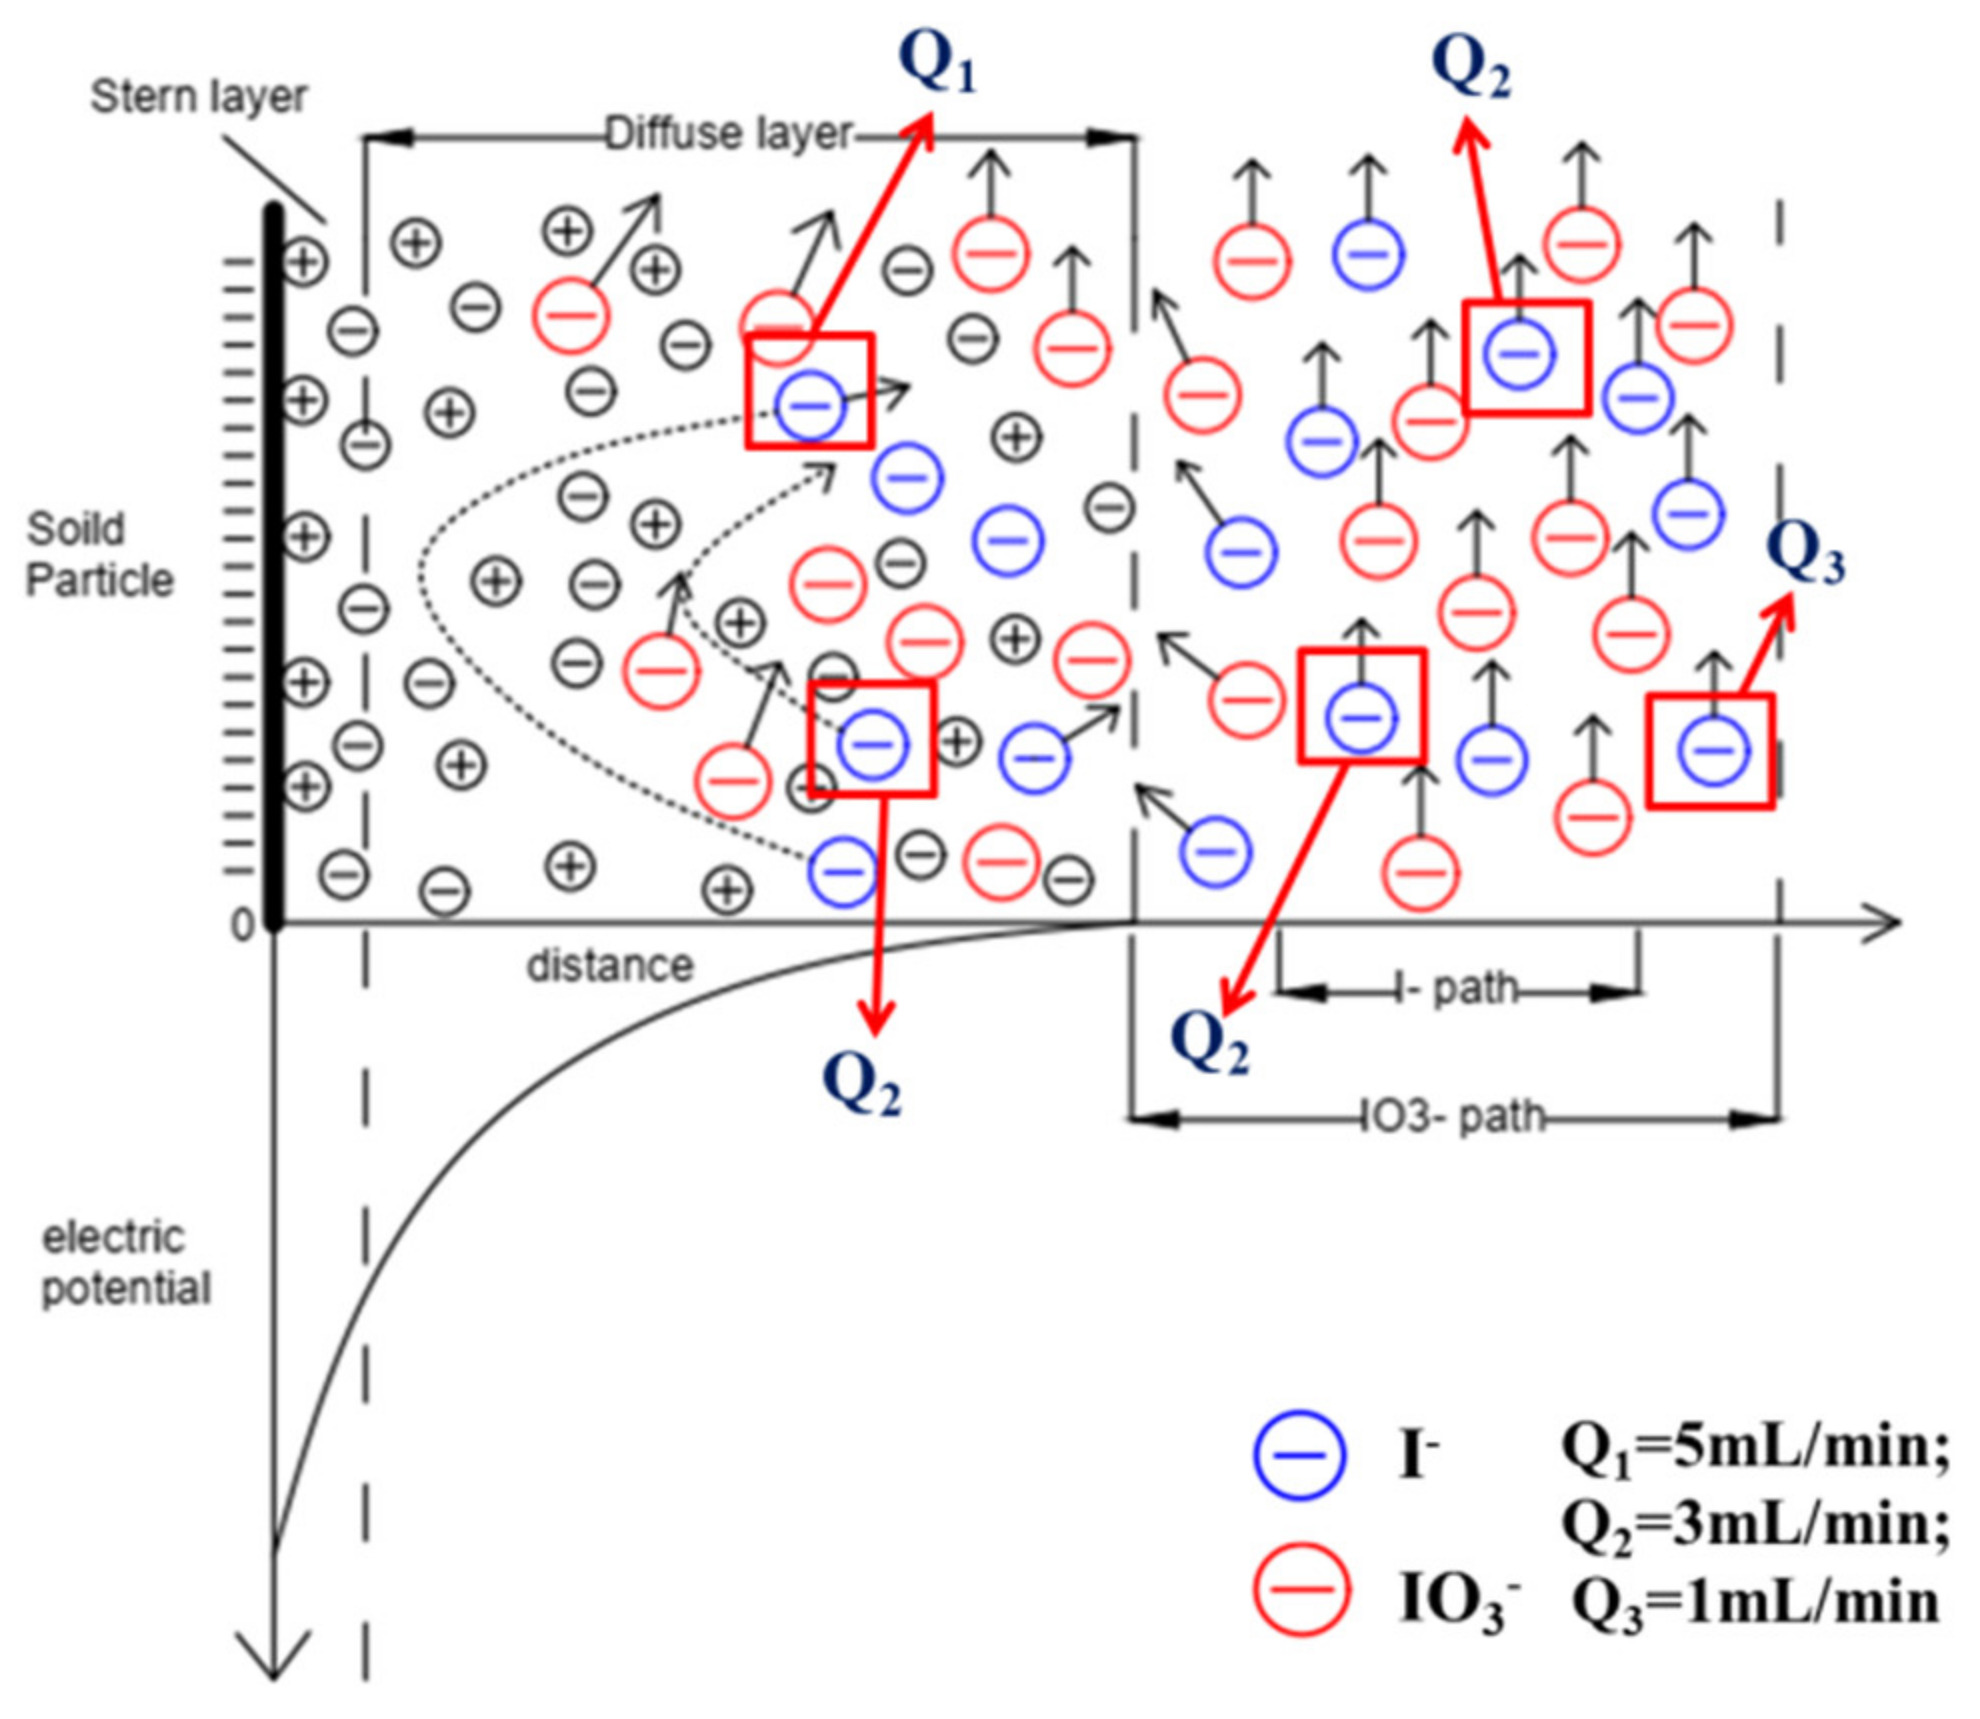
- Comparison with the BTCs of HTO, I−, and IO3− at different flow rates showed that obvious anion exclusion only occurred in I− transport by increasing the flow rate from 1 to 5. In fact, the anion exclusion (R < 1) only occurred for I− at a flow rate of 5 mL/min, and a relative Coulomb’s repulsive force may be caused by the smaller hydration radius of I−(3.31 Å) than that of IO3−(3.74 Å) according to electric DDL theory.
- 3.
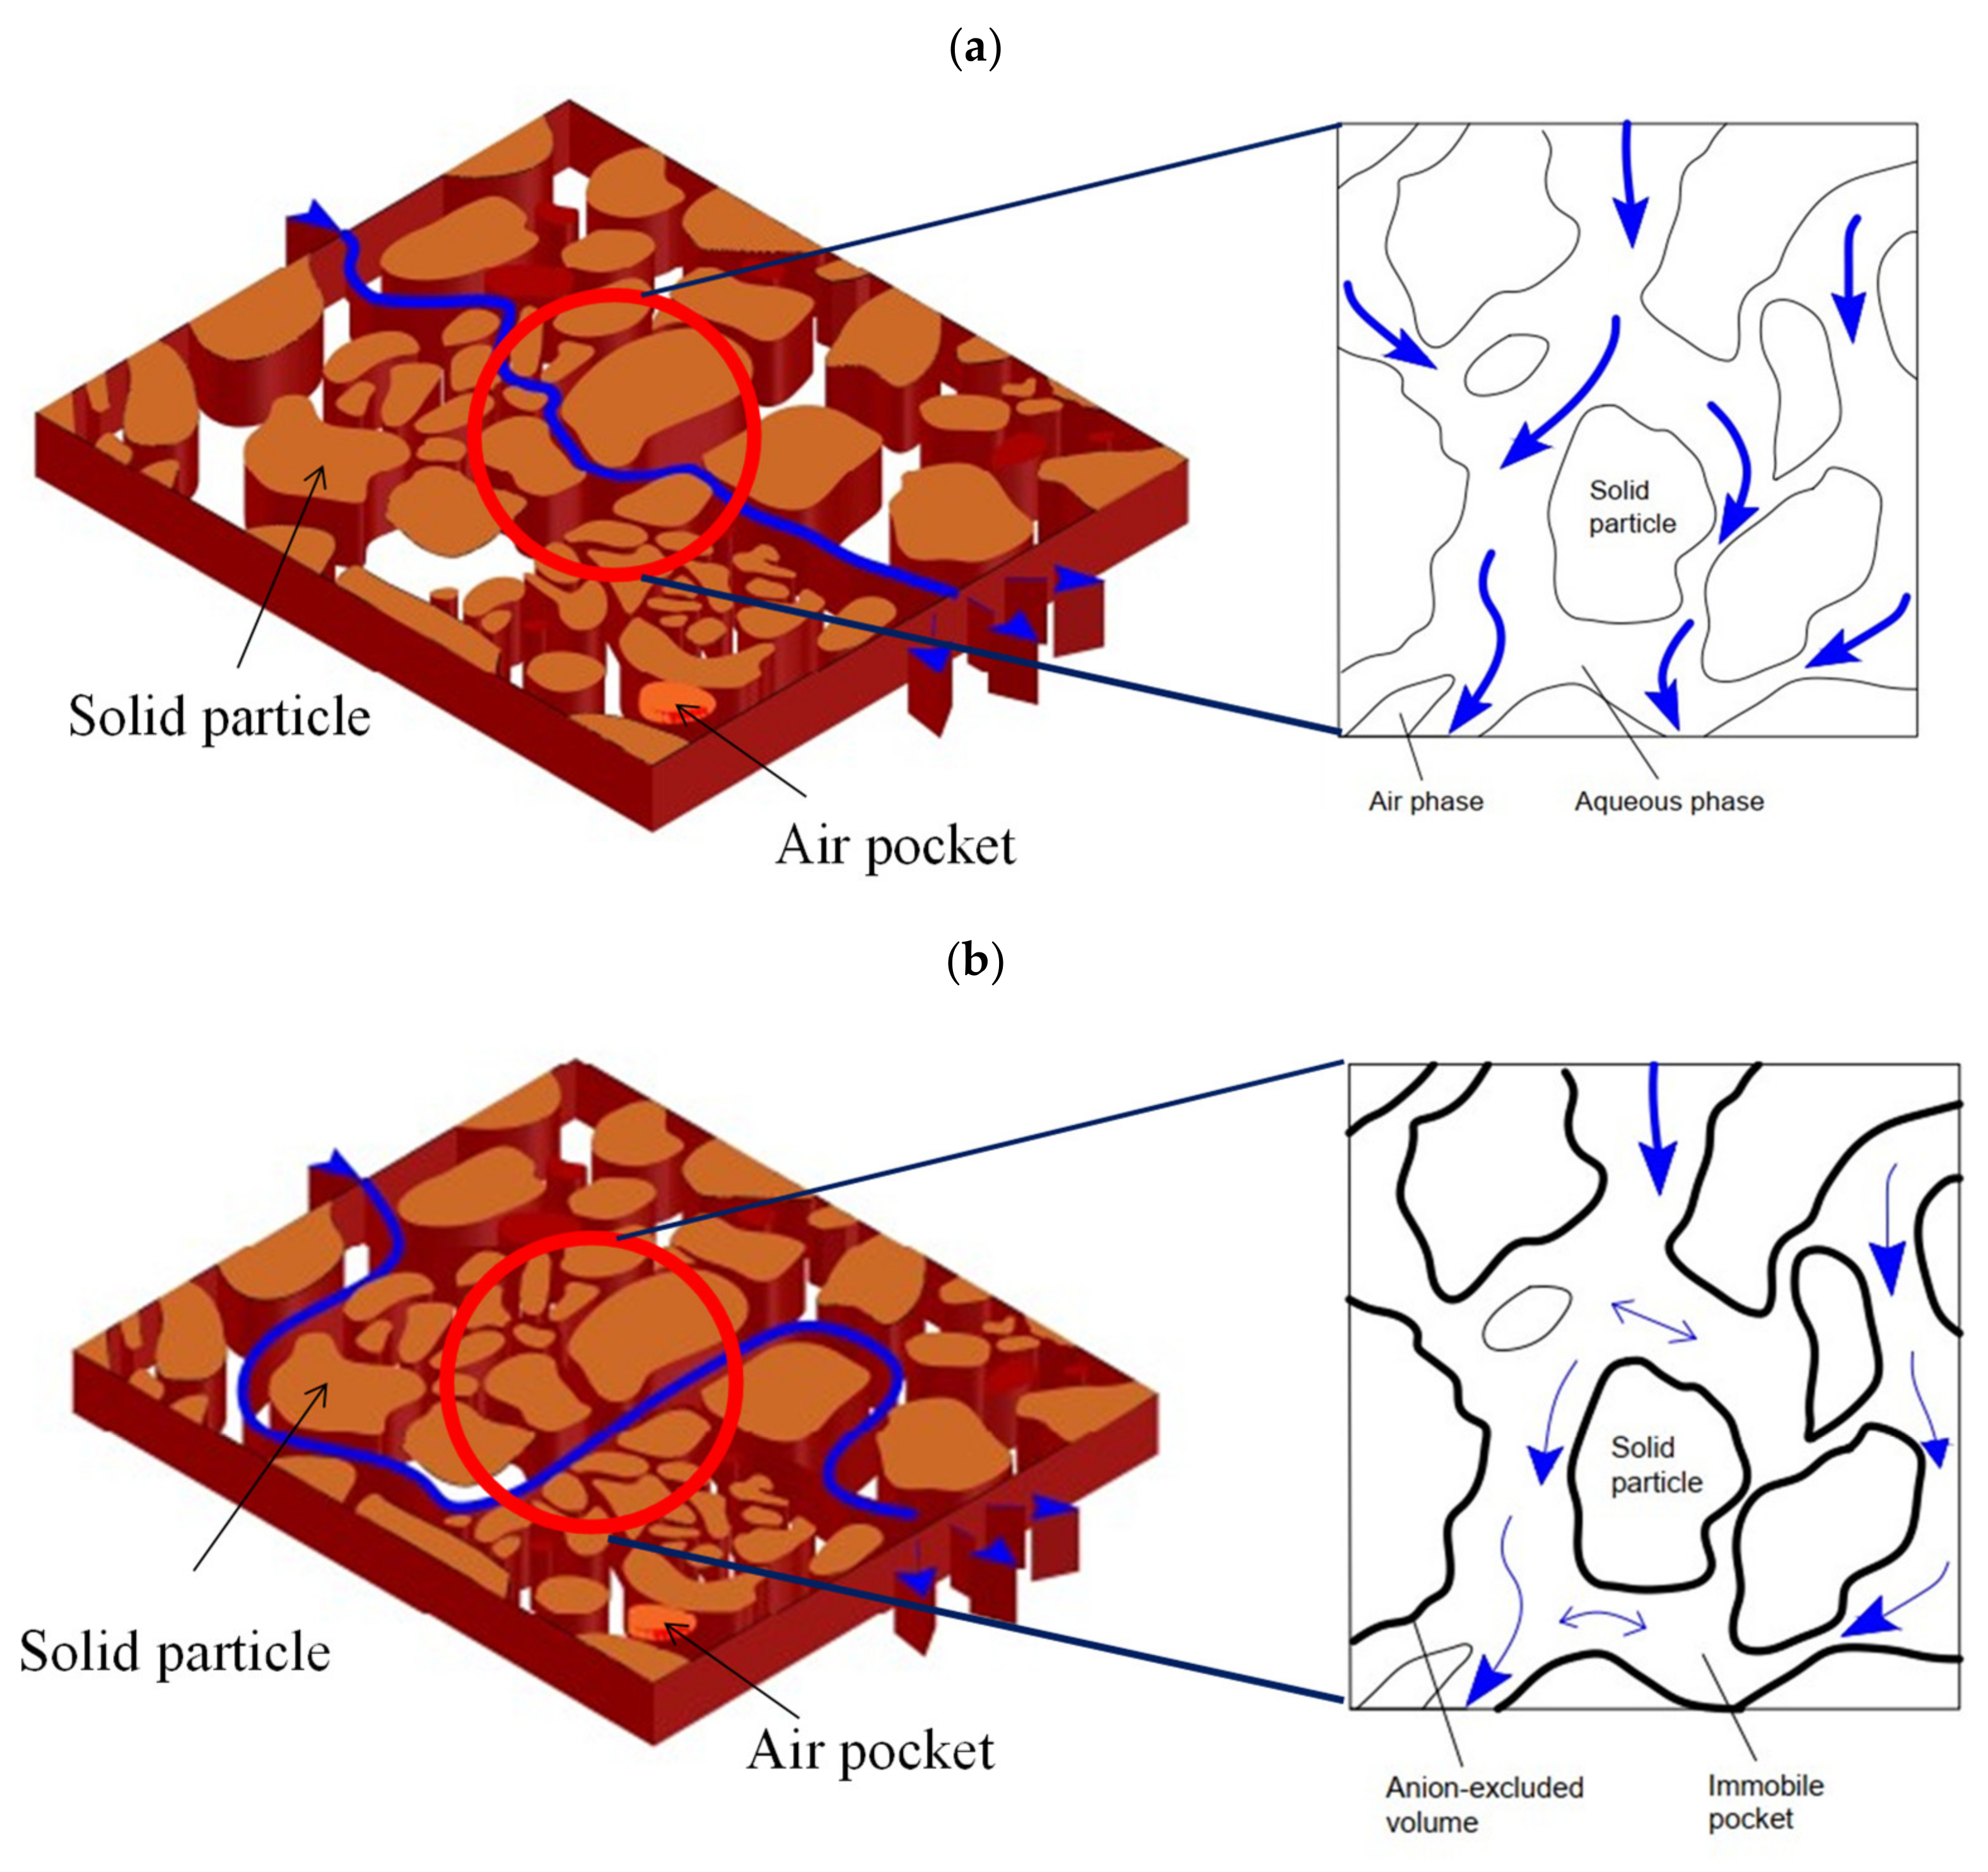
- The equilibrium and nonequilibrium transport models were used and compared to identify the mobile/immobile zones in the compacted granite column. The anion exclusion effect depended on the immobile zones in the column. In sum, the nonequilibrium model can well characterize the immobile regions of anion exclusion, which is obviously proportional to the value of immobile regions.
- 4.
- Since the experiment was conducted in laboratories, the environmental conditions were quite different from the actual environment. Whether the research results can be applied to the actual plant site needs to be demonstrated. It is recommended to carry out field experiments as soon as possible.
Author Contributions
Funding
Institutional Review Board Statement
Informed Consent Statement
Data Availability Statement
Acknowledgments
Conflicts of Interest
References
- IAEA. Joint Convention on the Safety of Spend Fuel Management and on the Safety of Radioactive Waste Management; INFCIRC/546; IAEA: Vienna, Austria, 1997. [Google Scholar]
- U.S. Nuclear Waste Technical Review Board. Survey of National Programs for Managing High−Level Radioactive Waste and Spent Nuclear Fuel: Update, A Report to Congress and the Secretary of Energy; U.S. Nuclear Waste Technical Review Board: Arlington, VA, USA, 2016.
- Hedin, A. Data Report for the Safety Assessment SR-Site TR 10-52; Svensk Kärnbränslehantering AB: Stockholm, Sweden, 2010. [Google Scholar]
- Japan Nuclear Cycle Development Institute. Japan, H12: Project to Establish the Scientific and Technical Basis for HLW Disposal in Japan; Japan Nuclear Cycle Development Institute: Naka, Japan, 2000. [Google Scholar]
- Wang, J. Progress of Geological Disposal of High−level Radioactive Waste in China in the 21st Century. J. At. Energy Sci. Technol. 2019, 53, 2072. [Google Scholar]
- Tsai, S.C.; Wang, T.H.; Jan, Y.L. Comparison of different methods to determine the retardation factor of 137Cs transport through granite in column experiments. J. Radioanal. Nucl. Chem. 2008, 275, 351–354. [Google Scholar] [CrossRef]
- Li, Y.; Zhang, A.; Chen, H. Migration Experiment of 238Pu in Sandy Soil in Vadose Zone of Chinese Arid Area. Environ. Sci. Technol. 2017, 41, 97–99. [Google Scholar]
- Yu, F.; Zuo, U.; Gou, Z. Migration Parameter Optimization Red Clay from Zhejiang of 237Np in Saturated Province. Earth Environ. 2014, 42, 502–504. [Google Scholar]
- Zhu, J.; Denu, A.; Zhang, A. Experiment on Nuclide Migration of Aquifer by Three−Dimensional Model in Laboratory Scale. J. Nucl. Radiochem. 2019, 42, 290–296. [Google Scholar]
- Lee, C.P.; Chen, D.; Hu, Y.; Jan, Y.L.; Shi, Y.; Wang, Z.; Wu, E.; Tien, N.C.; Sun, Y.; Tsai, S.C. An application of safety assessment for radioactive waste repository: Non-equilibrium transport of Tritium, Selenium and Cesium in crushed granite with different path lengths. Appl. Sci. 2021, 11, 9750. [Google Scholar] [CrossRef]
- Allred, B.J. Effects of nitrate concentration and ionic strength on nitrate anion exclusion under unsaturated flow conditions. Soil Sci. 2007, 172, 842–860. [Google Scholar] [CrossRef]
- Allred, B.J. Cation effects on nitrate mobility in an unsaturated soil. Trans. ASABE 2008, 51, 1997–2012. [Google Scholar] [CrossRef]
- Allred, B.J.; Brown, G.O.; Martinez, L.R. Laboratory investigation of boundary condition impacts on nitrate anion exclusion in an unsaturated soil. Soil Sci. Soc. Am. J. 2015, 79, 742–756. [Google Scholar] [CrossRef]
- Phillips, F.M.; Mattick, J.L.; Duval, T.A.; Elmore, D.; Kubik, P.W. Chlorine 36 and tritium from nuclear weapons fallout as tracers for long−term liquid and vapor movement in desert soils. Water Resour. Res. 1988, 24, 1877–1891. [Google Scholar] [CrossRef]
- Mäder, U. Advective displacement method for the characterization of pore water chemistry and transport properties in Claystone. Geofluids 2018, 2018, 819876. [Google Scholar] [CrossRef]
- McCarter, C.; Rezanezhad, F.; Gharedaghloo, B.; Price, J.S.; Van Cappellen, P. Transport of chloride and deuterated water in peat: The role of anion exclusion, diffusion, and anion adsorption in a dual porosity organic media. J. Contam. Hydrol. 2019, 225, 103497. [Google Scholar] [CrossRef]
- Kimmig, S.R.; Thompson, C.; Baum, S.; Brown, C.F. Evaluation of iodine speciation and 129I/127I ratios at low concentrations in environmental samples using IC−ICP−MS J. Radioanal. Nucl. Chem. 2021, 327, 929–937. [Google Scholar] [CrossRef]
- Van Loon, L.R.; Soler, J.M.; Jakob, A.; Bradbury, M.H. Effect of confining pressure on the diffusion of HTO, 36Cl− and 125I− in a layered argillaceous rock (Opalinus Clay): Diffusion perpendicular to bedding. Appl. Geochem. 2003, 18, 1653–1662. [Google Scholar] [CrossRef]
- Zhang, S.; Xu, C.; Creely, D.; Ho, Y.F.; Li, H.P.; Grandbois, R.; Schwehr, K.A.; Kaplan, D.I.; Yeager, C.M.; Wellman, D. Iodine-129 and Iodine-127 speciation in groundwater at the Hanford Site, U.S: Iodate Incorporation into Calcite. Environ. Sci. Technol. 2013, 47, 9635–9642. [Google Scholar] [CrossRef]
- Takeda, A.; Tsukada, H.; Takaku, Y.; Satta, N.; Baba, M.; Shinata, T.; Hasegawa, H.; Unno, Y.; Hisamatsu, S. Determination of iodide, iodate and total iodine in natural water samples by HPLC with amperometric and spectrophotometric detection, and off-line UV irradiation. Anal. Sci. 2016, 32, 839–845. [Google Scholar] [CrossRef]
- Fan, Y.; Hou, X.; Fukuda, M.; Zheng, J.; Aono, T.; Chen, N.; Zhang, L.; Zhou, W. 129I in a sediment core offshore Fukushima: Distribution, source and its implication. Chemosphere 2020, 252, 126524. [Google Scholar] [CrossRef]
- Cheng, H.P.; Li, M.H.; Li, S. A sensibility analysis of model selection in modeling the reactive transport of cesium in crushed granite. J. Contam. Hydrol. 2003, 61, 371–385. [Google Scholar] [CrossRef]
- Van Genuchten, M.T.; Wagenet, R.J. Two site/Two region models for pesticides transport and degradation: Theoretical development and analytical solutions. Soil Sci. Soc. Am. J. 1989, 53, 1303–1310. [Google Scholar] [CrossRef]
- Palagyi, Š.; Stamberg, K.; Vodickova, H.; Hercik, M. Transport parameters of I− and IO3− determined in crushed rock column and groundwater system under dynamic flow conditions. J. Radioanal. Nucl. Chem. 2014, 302, 647–653. [Google Scholar] [CrossRef]
- Rao, S.M.; Jain, S.K. Transport Modelling for Unsaturated Zone-Effect of Anion Exclusion and Immobile Water. Isot. Isot. Environ. Health Stud. 1985, 21, 433–438. [Google Scholar] [CrossRef]
- Babcock, K.L. Theory of the chemical properties of soil colloidal systems at equilibrium. Hilgardia 1963, 34, 417–542. [Google Scholar] [CrossRef]
- Krupp, H.K.; Biggar, J.W.; Nielsen, D.R. Relative flow rates of salt and water in soil. Soil Sci. Soc. Am. Proc. 1972, 36, 412–417. [Google Scholar] [CrossRef]
- Gvirtzman, H.; Gorelick, S.M. Dispersion and advection in unsaturated porous media enhanced by anion exclusion. Nature 1991, 352, 793. [Google Scholar] [CrossRef]
- Glaus, M.A.; Müller, W.; Van Loon, L.R. Diffusion of iodide and iodate through Opalinus Clay: Monitoring of the redox state using an anion chromatographic technique. Appl. Geochem. 2008, 23, 3612–3619. [Google Scholar] [CrossRef]
- Lee, C.P.; Hu, Y.; Chen, D.; Wu, E.; Wang, Z.; Wen, Z.; Tien, N.C.; Yang, F.; Tsai, S.C.; Shi, Y.; et al. An Improved Speciation Method Combining IC with ICPOES and its Application to Iodide and Iodate Diffusion Behavior in Compacted Bentonite Clay. Materials 2021, 14, 7056. [Google Scholar] [CrossRef]
- Lee, C.P.; Tsai, S.C.; Jan, Y.L.; Wei, Y.Y.; Teng, S.P.; Hsu, C.N. Sorption and diffusion of HTO and cesium in crushed granite compacted to different lengths. J. Radioanal. Nucl. Chem. 2008, 275, 371–378. [Google Scholar] [CrossRef]
- Lee, C.P.; Tsai, S.C.; Wu, M.C.; Tsai, T.L.; Tu, Y.L.; Kang, L.J. A comparative study on sorption and diffusion of Cs in crushed argillite and granite investigated in batch and through-diffusion experiment. J. Radioanal. Nucl. Chem. 2017, 311, 1155–1162. [Google Scholar] [CrossRef]
- Toride, N.; Leij, F.J.; van Genuchten, M.T. The CXTFIT Code for Estimating Transport Parameters from Laboratory on Field Tracer Experiments Version 2.1; Research Report No. 137; U.S. Salinity Laboratory, USDA, ARS: Riverside, CA, USA, 1999. [Google Scholar]
- Tsai, S.C.; Lee, C.P.; Tsai, T.L.; Yu, Y.C. Characterization of cesium diffusion behavior into granite matrix using Rutherford backscattering spectrometry. Nucl. Instrum. Methods Phys. Res. B 2017, 409, 305–308. [Google Scholar] [CrossRef]
- Nightinggale, E.R. Phenomenological theory of ion solvation: Effective radii of hydrated ions. J. Phys. Chem. 1959, 63, 1381–1387. [Google Scholar] [CrossRef]


| Item | Granite | SGW (M) | |||
|---|---|---|---|---|---|
| Location | Fujian Province, China | Ca2+ | 3.76 × 10⁻⁴ | F− | 1.85 × 10⁻⁴ |
| Particle Size (mm) | <1 | Mg2+ | 6.38 × 10⁻⁵ | HCO3− | 1.21 × 10⁻³ |
| Length (cm) | 30.0 | Na+ | 1.57 × 10⁻³ | pH | 8.0 ± 0.2 |
| Diameter (cm) | 1.6 | K+ | 9.22 × 10⁻⁵ | Eh | 220 ± 20 |
| Weight (g) | 85.40 ± 0.50 | Cl− | 9.77 × 10⁻⁴ | T(°C) | 20 ± 2 |
| bulk density (g/cm3) | 1.45 ± 0.05 | SO42− | 1.05 × 10⁻⁴ | I (M) | 3.11 × 10⁻³ |
| Porosity | 0.47 ± 0.03 | I: Ionic Strength | |||
| Batch | No. 1 | No. 2 | No. 3 | Remark | |
|---|---|---|---|---|---|
| RN | HTO: 50 Bq/mL (A0) | I− 7.78 (C0: ppm) | IO3− 5.41 (C0: ppm) | ||
| Flow Rate (mL/min) | |||||
| 5.0 ± 0.1 | U | U | U | U: up-flooding D: down-flooding V0 = 2000 mL | |
| D | D | D | |||
| 3.0 ± 0.1 | U | U | U | ||
| D | D | D | |||
| 1.0 ± 0.1 | U | U | U | ||
| D | D | D | |||
| STANMOD (S) | HYDRUS-1D (H) | |||||
|---|---|---|---|---|---|---|
| HTO | Fit 1 | Fit 2 | Fit 3 | Fit 1 | Fit 2 | Fit 3 |
| Q (mL/min) | 5.0 ± 0.1 | 3.0 ± 0.1 | 1.0 ± 0.1 | 5.0 ± 0.1 | 3.0 ± 0.1 | 1.0 ± 0.1 |
| DL (cm) | 0.268 | 0.331 | 0.268 | 0.270 | 0.270 | 0.269 |
| R | 1.11 | 1.07 | 1.29 | 1.17 | 1.21 | 1.16 |
| Kd (mL3/g) | =0 | =0 | =0 | =0 | =0 | =0 |
| RMSE/r2 | 4.05 × 10⁻² | 1.62 × 10⁻¹ | 8.58 × 10⁻² | 0.99 | 0.90 | 0.97 |
| ; Bulk Density = 1.45 ± 0.05 g/cm3; porosity = 0.47 ± 0.03 | ||||||
| STANMOD (S) | No | Flow Rate (mL/min) | v (cm/min) | D (cm2/min) | R | DL (cm) | RMSE |
| Fit 4 | 5.0 ± 0.1 | 5.41 | 1.45 | 1.19 | 0.268 | 0.14 × 10⁻¹ | |
| Fit 5 | 3.0 ± 0.1 | 3.02 | 1.00 | 1.04 | 0.331 | 0.15 × 10⁻² | |
| Fit 6 | 1.0 ± 0.1 | 1.27 | 0.34 | 1.34 | 0.268 | 0.15 × 10⁻² | |
| HYDRUS-1D (H) | No | Flow Rate (mL/min) | Ks (cm/min) | Kd (mL3/g) | DL (cm) | r2 | |
| Fit 4 | 5.0 ± 0.1 | 2.488 | 0.050 | 0.270 | 0.98 | ||
| Fit 5 | 3.0 ± 0.1 | 1.492 | 0.044 | 0.270 | 0.99 | ||
| Fit 6 | 1.0 ± 0.1 | 0.498 | 0.069 | 0.269 | 0.99 | ||
| STANMOD (S) | No | Flow Rate (mL/min) | v (cm/min) | D (cm2/min) | R | DL (cm) | RMSE |
| Fit 7 | 5.0 ± 0.1 | 5.41 | 1.45 | 0.71 | 0.268 | 0.55 × 10⁻² | |
| Fit 8 | 3.0 ± 0.1 | 3.02 | 1.00 | 0.96 | 0.331 | 0.37 × 10⁻² | |
| Fit 9 | 1.0 ± 0.1 | 1.27 | 0.34 | 1.31 | 0.268 | 0.87 × 10⁻² | |
| HYDRUS-1D (H) | No | Flow Rate (mL/min) | Ks (cm/min) | Kd (mL3/g) | DL (cm) | r2 | |
| Fit 7 | 5.0 ± 0.1 | 2.488 | =0 | 0.270 | 0.77 | ||
| Fit 8 | 3.0 ± 0.1 | 1.492 | =0 | 0.270 | 0.99 | ||
| Fit 9 | 1.0 ± 0.1 | 0.498 | =0 | 0.269 | 0.96 | ||
| STANMOD (S) | No | Flow Rate (mL/min) | v (cm/min) | D (cm2/min) | DL (cm) | α (min−1) | RMSE | ||
| Fit 10 | 5.0 ± 0.1 | 7.66 | 3.95 | 0.368 | 0.067 | 0.516 | 2.70 | 0.54 × 10⁻² | |
| Fit 11 | 3.0 ± 0.1 | 3.17 | 0.52 | 0.471 | 0.019 | 0.164 | 3.85 | 0.27 × 10⁻² | |
| HYDRUS-1D (H) | No | Flow rate (mL/min) | Ks (cm/min) | DL (cm) | A (min−1) | r2 | |||
| Fit 10 | 5.0 ± 0.1 | 3.279 | 0.358 | 0.102 | 0.530 | 3.04 | 0.98 | ||
Publisher’s Note: MDPI stays neutral with regard to jurisdictional claims in published maps and institutional affiliations. |
© 2022 by the authors. Licensee MDPI, Basel, Switzerland. This article is an open access article distributed under the terms and conditions of the Creative Commons Attribution (CC BY) license (https://creativecommons.org/licenses/by/4.0/).
Share and Cite
Shi, Y.; Yang, S.; Chen, W.; Xiong, W.; Zhang, A.; Yu, Z.; Lian, B.; Lee, C.-P. Study on Tritium and Iodine Species Transport through Porous Granite: A Non-Sorption Effect by Anion Exclusion. Toxics 2022, 10, 540. https://doi.org/10.3390/toxics10090540
Shi Y, Yang S, Chen W, Xiong W, Zhang A, Yu Z, Lian B, Lee C-P. Study on Tritium and Iodine Species Transport through Porous Granite: A Non-Sorption Effect by Anion Exclusion. Toxics. 2022; 10(9):540. https://doi.org/10.3390/toxics10090540
Chicago/Turabian StyleShi, Yunfeng, Song Yang, Wenjie Chen, Weijia Xiong, Aiming Zhang, Zhixiang Yu, Bing Lian, and Chuan-Pin Lee. 2022. "Study on Tritium and Iodine Species Transport through Porous Granite: A Non-Sorption Effect by Anion Exclusion" Toxics 10, no. 9: 540. https://doi.org/10.3390/toxics10090540
APA StyleShi, Y., Yang, S., Chen, W., Xiong, W., Zhang, A., Yu, Z., Lian, B., & Lee, C.-P. (2022). Study on Tritium and Iodine Species Transport through Porous Granite: A Non-Sorption Effect by Anion Exclusion. Toxics, 10(9), 540. https://doi.org/10.3390/toxics10090540