1. Introduction
The 2030 Agenda marked the adoption of the Sustainable Development Goals (SDGs) by the UN in 2015, wherein 17 targets were set to be achieved to alleviate poverty and bridge the inequality gap. The rise in the availability of multidimensional databases in sociopolitical and economic fields has caused a paradigm shift in techniques adopted for cross-country comparative analysis, leveraging key development indicators. The interplay between governance, development, and logistics has advanced beyond its simple correlation. Some of the many remaining challenges include the construction of analytical tools that preserve the basic structural characteristics of the data while achieving a reduction in dimensions. The Uniform Manifold Approximation and Projection (UMAP) method has gained traction as a powerful tool for highlighting local and global patterns in high-dimensional spaces while maintaining spatial organization and affiliation [
1,
2].
There is escalated urgency because countries today face a myriad of interrelated issues. The system’s institutional resilience, logistical capacity, access to services, and government efficiency are interwoven factors that operate within a complex system, not readily observable through conventional evaluations. Structural pairwise similarities within nations that undergo the same unifying challenges and opportunities, despite their setting and development stage, can be discovered through multidimensional exploration beyond the benchmark of regional or ranking averages. In this context, the combination of advanced dimensionality reduction techniques with unsupervised clustering provides a methodological alternative that reveals unexplored configurations.
Working with assorted, interdependent, and high-dimensional indicators often makes UMAP a more favorable choice over PCA [
3,
4]. It is intuitive to follow the UMAP data dimensionality reduction with clustering procedures, like K-means, to discover shared distinguishing features within clusters [
5,
6]. This combination of approaches enhances the visual understanding of the information while also improving its interpretive capacity by revealing hidden structures that would otherwise remain undiscovered [
7,
8].
This study examines the correlations between the LPI, HDI, and WGIs in relation to the SDGs using UMAP and K-means clustering on a dataset of 137 countries. This methodology provides both a reduction in dimensionality and a sound justification for clustering countries with comparable socioeconomic and logistical features, which is important from the perspective of public policy, international relations, and strategic foresight.
As noted above, these algorithms may adopt ID for shaping holistic images of regions and countries with respect to the level of development or advancement that they have reached and the factors that affect the level of governance in a country. The specialized clusters derived from UMAP and K-means clustering configurations enable tailored analysis and discerning understanding of emanating and consequent targeted strategies.
The objective of this study is to classify 137 countries according to their structural characteristics related to development, governance, and logistics performance using an unsupervised learning approach. Specifically, we aim to identify emergent country typologies that share similarities in key indicators drawn from the Human Development Index (HDI), the Worldwide Governance Indicators (WGIs), and the Logistics Performance Index (LPI). The main research question guiding this work is as follows: How does the combined use of nonlinear dimensionality reduction (UMAP) techniques and clustering algorithms (K-means) allow for the identification of structural typologies across countries based on multidimensional indicators of development, governance, and logistics, in line with the Sustainable Development Goals (SDGs)?
To achieve this, this article is structured as follows:
Section 2 presents a review of the recent literature on multidimensional country classification and the application of UMAP and K-means methods.
Section 3 describes the data and methodology employed, including variable selection, dimensionality reduction, and clustering validation procedures.
Section 4 presents the results of the analysis, highlighting the main typologies obtained.
Section 5 discusses the implications for SDG-oriented policy design and future research.
Section 6 outlines the main conclusions and limitations. This approach builds upon recent advances in data science and complements traditional techniques of international classification by offering a more flexible and nonlinear analytical perspective.
2. Literature Review
Country classification based on multiple dimensions has been a central theme in contemporary development, governance, and logistics studies. As global agendas have evolved toward more comprehensive approaches, multidimensional analysis has gained prominence, allowing for the capture of non-obvious relationships between social, economic, and institutional variables. This type of analysis is particularly useful in contexts where development dynamics can no longer be understood through individual or isolated indicators, but rather through systemic configurations that require more sophisticated analytical tools [
9,
10].
In this context, comparing countries using different indicators is something that is increasingly performed in different types of studies. The Logistics Performance Index (LPI), developed by the World Bank, assesses the efficiency of supply chains and global connectivity [
11,
12]. At the same time, the Human Development Index (HDI) has been widely used to measure progress in areas such as health, education, and income [
13,
14]. For their part, the World Governance Indicators (WGIs) show a measurement of institutional stability and the quality of governance in different regions of the world [
15,
16]. Each of these indicators, although developed with different objectives, can be combined to understand a reality that requires a comprehensive approach.
The problem is identifying how to integrate these indicators without losing relevant information and maintaining the quality of the interpretation. This is why dimensionality reduction techniques have become key tools for representing complex structures in more manageable spaces. Although principal component analysis (PCA) has been the most widely used method for this type of analysis [
17], its limitations in capturing nonlinear relationships have driven the development and application of more flexible approaches, such as UMAP.
The combined use of nonlinear dimensionality reduction techniques, like UMAP, and clustering algorithms, such as K-means, enables the identification of structural typologies among countries by transforming complex, multidimensional data—such as indicators of development, governance, and logistics—into a lower-dimensional space that preserves meaningful relationships and patterns. UMAP excels at capturing both local and global structures in high-dimensional data, making it particularly effective for visualizing and organizing countries based on their multidimensional SDG-related profiles [
18]. When UMAP is used as a preprocessing step, it enhances the performance and accuracy of clustering algorithms, like K-means, allowing for clearer separation and identification of distinct groups or typologies [
5]. This approach facilitates the discovery of clusters of countries that share similar structural characteristics, which can be directly linked to progress or challenges in achieving the Sustainable Development Goals. The resulting clusters provide actionable insights for policymakers by highlighting commonalities and differences in development trajectories, governance quality, and logistical capacities across nations [
19]. Moreover, the method supports robust visualization, making complex patterns accessible and interpretable for decision-makers and stakeholders 46. Overall, this integrated analytical framework offers a powerful tool for comparative analysis and strategic planning in the context of the SDGs.
UMAP has established itself as an efficient technique for preserving both the local and global structure of high-dimensional data, facilitating their visualization and interpretation [
20,
21]. Recently, it has been used in geospatial, medical, and data mining studies, with promising results in revealing nontrivial clustering [
22,
23,
24]. For example, in the classification of geochemical and medical data, UMAP has demonstrated a remarkable ability to identify nonlinear boundaries that other methods fail to identify [
25,
26]. This approach is particularly useful when working with structurally complex indicators, such as the LPI or WGIs, whose underlying interactions may exhibit topological relationships that are difficult to detect using conventional methods.
However, reducing dimensionality is not sufficient on its own to generate interpretable typologies. Once the data have been transformed into a reduced space using UMAP, it becomes necessary to apply clustering algorithms that allow for the identification of recurring patterns across countries. In this scenario, the K-means algorithm has been widely used for its simplicity, robustness, and ability to segment datasets into clearly differentiated groups [
27]. Although K-means is sensitive to the shape of the representation space, its combination with techniques such as UMAP has led to highly effective applications, especially when interpreting emerging clusters from nonlinearly transformed data [
3].
Recent research has started examining these integrations from a comparative as well as a classificatory perspective. For instance, UMAP and K-means combinations have been successfully utilized in the segmentation of patient profiles, urban mobility patterns, and also in multivariate analyses [
28,
29]. However, its use in studies on human development and governance research domains is still underdeveloped. This gap is particularly relevant for the current research, which intends to apply this method to construct an empirical typology of countries classified by their logistics, level of development, and governance structures.
Although there is a demonstrated success of UMAP and K-means in several domains, their use in cross-analyses concentrating on governance and logistics is still narrow. The combination of UMAP and K-means provides an approach to methodologically develop accurate but useful representations of complex data that could aid policymakers in shaping differentiated public policies focused on groups of countries with shared difficulties and strengths.
This form of classification is helpful in relation to the Sustainable Development Goals (SDGs) since it allows for the pinpointing of country groupings that share certain common traits in fundamental aspects like logistics infrastructure (SDG 9), a region’s democratic governance (SDG 16), educational equity (SDG 4), and income distribution (SDG 10). In this manner, the adopted approach aids in the relative assessment and tracking of the progress aligned with the 2030 Agenda and serves as a technical groundwork for differential partnerships and policy frameworks (SDG 17) based on the discerned shortfalls.
3. Methodology
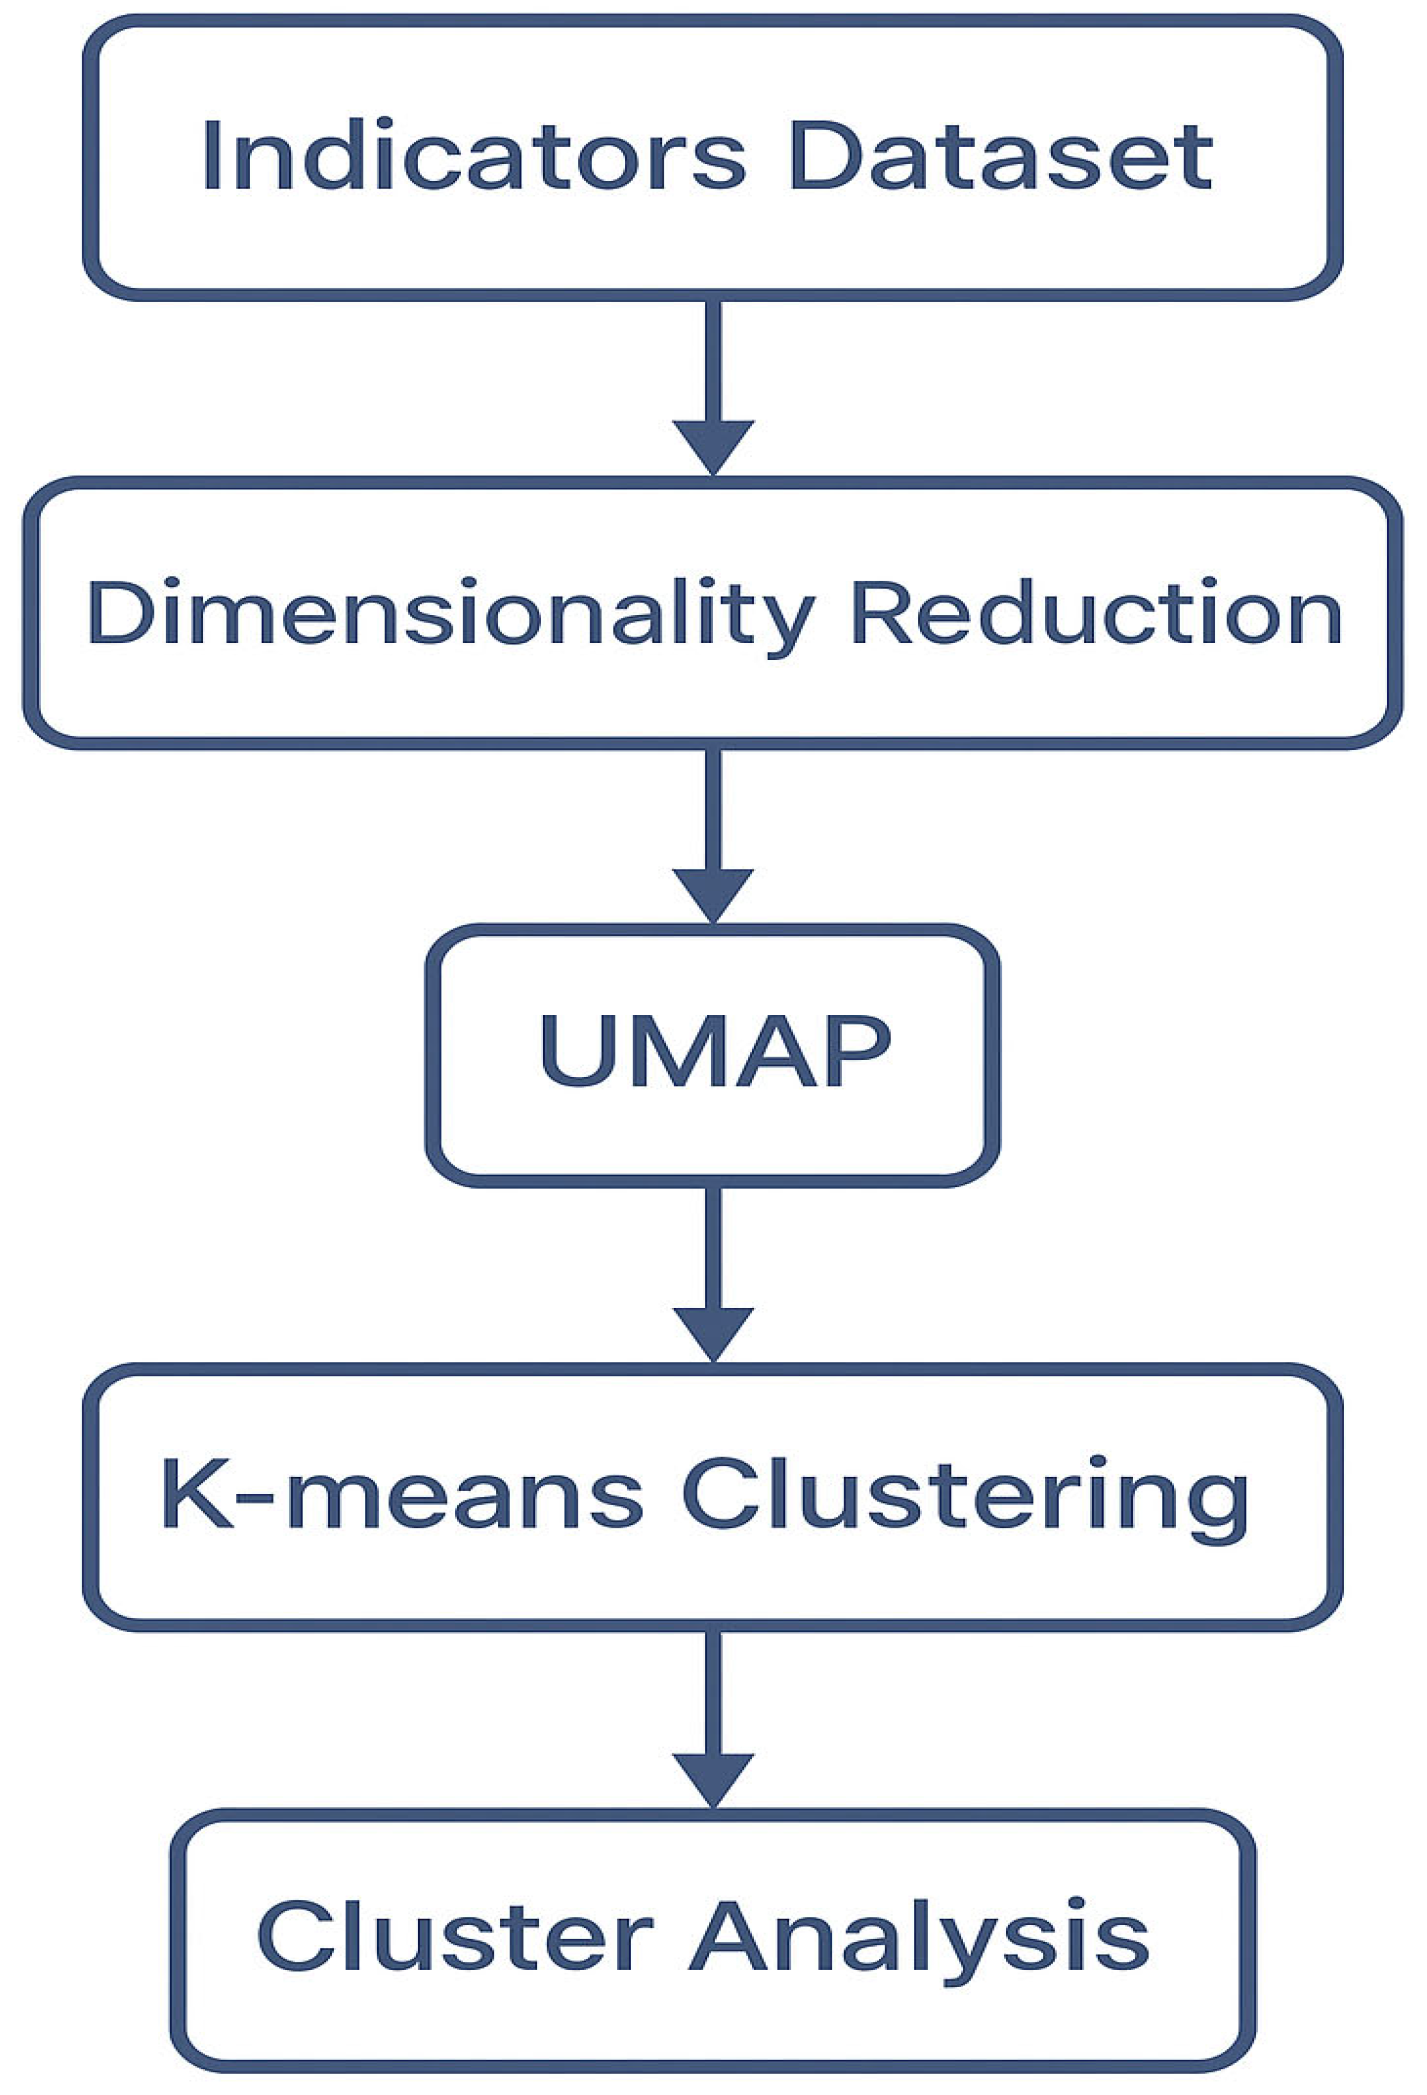
This paper develops an unsupervised analytical approach to rank countries based on logistics, human development, and governance. The strategy combines two or more methods of nonlinear dimensionality reduction and partitioning, so that intricate relationships among numerous dependent variables can be visualized in a simpler volume, referred to as “space,” or cluster (
Figure 1). This part outlines the methodology, which includes defining the indicators, selecting their values, and performing the execution of the clustering algorithm.
3.1. Selection of Variables and Indicators
The database used includes information on 137 countries from the year 2023. The indicators were selected considering their ability to capture relevant structural dimensions of national development. First, six components of the Logistics Performance Index (LPI) were included, as follows: Customs Score, Infrastructure Score, International Shipments Score, Logistics Competence and Quality Score, Timeliness Score, and Tracking and Tracing Score [
30]. These reflect each country’s operational capacity and logistics efficiency, essential aspects of global economic competitiveness.
Second, six dimensions from the Worldwide Governance Indicators (WGI) were incorporated, as follows: Voice and Accountability, Political Stability and Absence of Violence, Government Effectiveness, Regulatory Quality, Rule of Law, and Control of Corruption [
31]. These indicators have been widely validated as benchmarks for assessing institutional quality [
32,
33]. Finally, four variables from the Human Development Index (HDI) were added, as follows: Life Expectancy at Birth, Expected Years of Schooling, Mean Years of Schooling, and Gross National Income per Capita [
34]. This social and economic dimension provides interpretive depth to the analysis, reflecting the overall well-being of the population [
35], and is directly linked to SDGs 4, 8, and 10.
3.2. Dimensionality Reduction Using UMAP
In this study, the UMAP technique was applied to project the 16 selected variables into a two-dimensional space that would serve as input for cluster analysis. To achieve this, the parameters n_neighbors = 15 and min_dist = 0.1 were selected for their ability to preserve both the local structure and the visual stability of the data. This projection facilitated both the visualization of emerging patterns and their subsequent analysis using clustering techniques.
The procedure was implemented in R using the UMAP package, ensuring reproducible results by setting a random seed (set.seed = 42). This configuration allowed for the generation of a graphical representation consistent with the underlying relationships in the dataset, facilitating the subsequent application of the K-means algorithm.
3.3. Determining the Optimal Number of Clusters
Before applying any clustering method, it is essential to assess whether the dataset contains natural clusters (non-random structures) that support the application of these techniques. This process, known as cluster tendency assessment, enables the verification of both the existence of significant clusters and their optimal number, thereby ensuring the validity of the analysis [
36].
Clustering tendency was assessed using the Hopkins statistic, as implemented in the Hopkins package [
37] within R software. A Hopkins statistic value close to 1 (typically H > 0.75) suggests a clear clustering structure, as the data distribution differs significantly from a random uniform distribution. Conversely, a value close to 0.5 indicates spatial randomness (H ≈ 0.5 implies the absence of natural clusters), while values below 0.3 (H < 0.3) reveal highly uniform or dispersed data [
37,
38].
To select the number of clusters most representative of the structure of the projected data, the NbClust() function from the NbClust package [
39] in R software was used, utilizing the K-means method. This function calculates 30 internal validation indices, including silhouette, Dunn, CH, and gap statistics. Most of the indices agreed that three clusters constituted the most robust solution for this dataset. We ran the K-means algorithm with
nstart = 50 to ensure multiple random initial centroid selections. The clustering results remained stable across runs, with minimal changes in cluster assignments and consistent silhouette index values.
3.4. K-Means Clustering
Subsequently, the K-means algorithm was applied to the dimensions generated by UMAP, chosen for its ability to efficiently and reproducibly segment the dataset into homogeneous groups. For this purpose, a multiple random initialization was established to minimize the problem of convergence to local minima and ensure stability in cluster assignments. The K-means algorithm is an iterative process whose objective is to minimize the sum of the squared intra-cluster distances, thus optimizing the internal cohesion of each group [
40,
41].
Moreover, cluster compactness evaluations based on the silhouette index and explained variability ratio were calculated, confirming the quality of the clusters. This phase was accompanied by sensitivity analyses concerning different methodologies for convergence criteria, starting assumptions, and their influence on the outcome. Combos of UMAP with K-means were particularly effective because lower dimensions illustrated potential features, which led to splitting the data into clearly defined groups.
The variance explained ratio is a term and concept of the clustering problem, which makes it easier to evaluate how well the clustering algorithm has performed in capturing the structure of the data. Using the variance defined in the previous section, it indicates the amount of information (or variance) preserved in the clusters as compared to the dataset. A high explained variance ratio value means that the clustering method has effectively grouped similar data points, preserving the structure of the data at hand.
In the case of the K-means algorithm, the explained variance ratio can be calculated by finding the within-cluster variance and comparing it with the total variance in the dataset. In this context, the ratio allows us to determine what proportion of the total dispersion is captured by the cluster structure formed. Therefore, describing the ratio helps form conclusions about the clustering obtained [
42,
43].
Another metric for evaluating the quality of the clustering process is the silhouette coefficient, where a higher silhouette coefficient indicates a model with more coherent clusters. In other words, a silhouette coefficient close to one (1) means that the sample is far from neighboring clusters. A value of zero (0) means that the sample is on or very close to the decision boundary between two neighboring clusters, and negative values suggest that the samples may have been assigned to the wrong cluster.
3.5. Statistical Validation and Visualization
To statistically validate the significance of the differences between clusters, a multivariate analysis of variance (MANOVA) test was performed to confirm the multivariance between groups. An analysis of variance (ANOVA) was then performed for each of the original variables. The results showed statistically significant differences in all the indicators evaluated. Hence, consistency across the methods strengthens the empirical validity of the clustering. Finally, scatter plots, box-and-whisker plots, and bar charts were generated to facilitate the visualization of inter-cluster patterns, showing that countries exhibited systemic differences in logistics, governance, education, and income according to the segmentation obtained.
4. Results
The cluster analysis of the dimensions generated using UMAP identified three distinct groupings of countries, capturing underlying patterns related to logistics performance, governance quality, and human development. The applied methodology not only simplified the structural complexity of the 16 original indicators but also revealed latent structures that would have been difficult to detect using linear methods. The interpretation of these results was organized into three stages: validation of the cluster structure, analysis by region, and multivariate evaluation of the behavior of the variables. The indicators used in this study are presented in
Table 1.
Before applying the clustering algorithm, the original data were transformed into a two-dimensional space using UMAP [
44]. This dimensionality reduction preserved key topological relationships, enabling a more intuitive visualization and revealing underlying patterns that were not evident in the original space. The projected representation facilitated the preliminary identification of potential clusters and provided a structured basis for the subsequent application of the K-means algorithm.
4.1. Validation of the Number of Clusters
The clustering tendency was evaluated using the Hopkins statistic. The calculated value of the statistic is 0.984, allowing us to conclude that the dataset is significantly clusterable. The optimal number of clusters was determined using the NbClust() function under the K-means method. This function determines 30 internal validation indices [
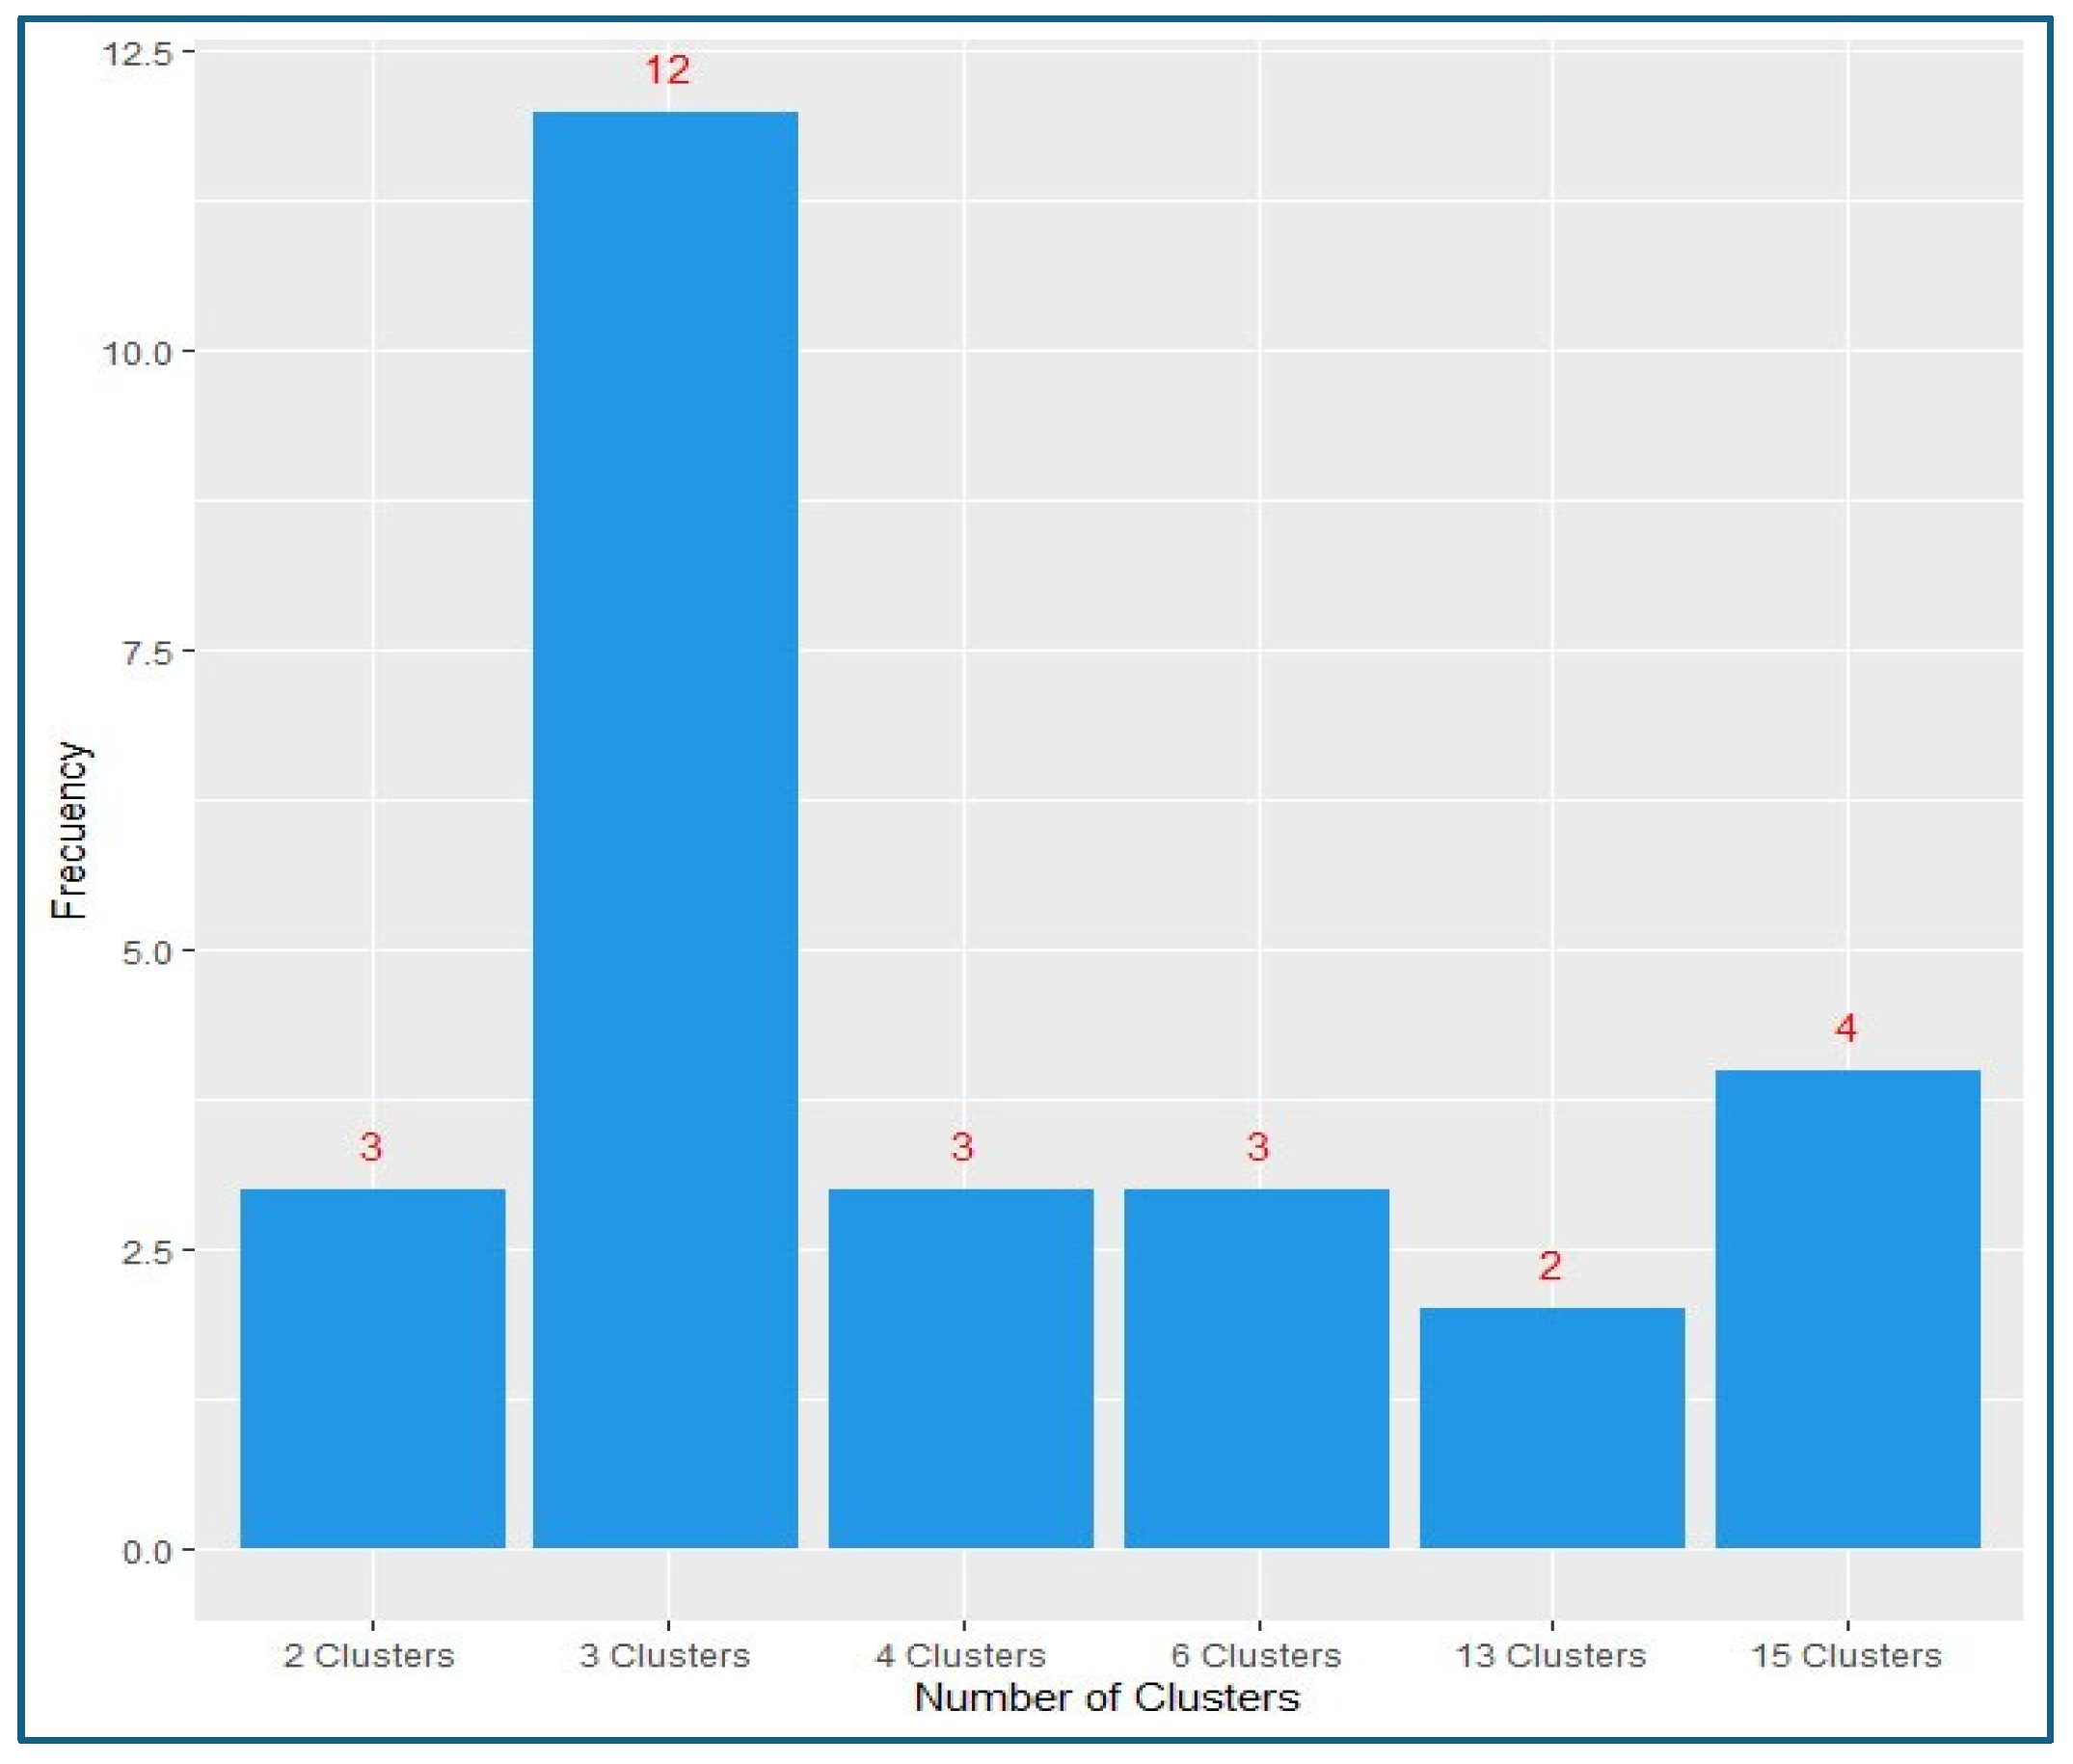
39]. The results for the various indices generated by the NbClust() function are presented in
Figure 2. It can be seen that 12 of the 27 indices suggest using three clusters. Therefore, according to the majority rule, the optimal cluster number is three.
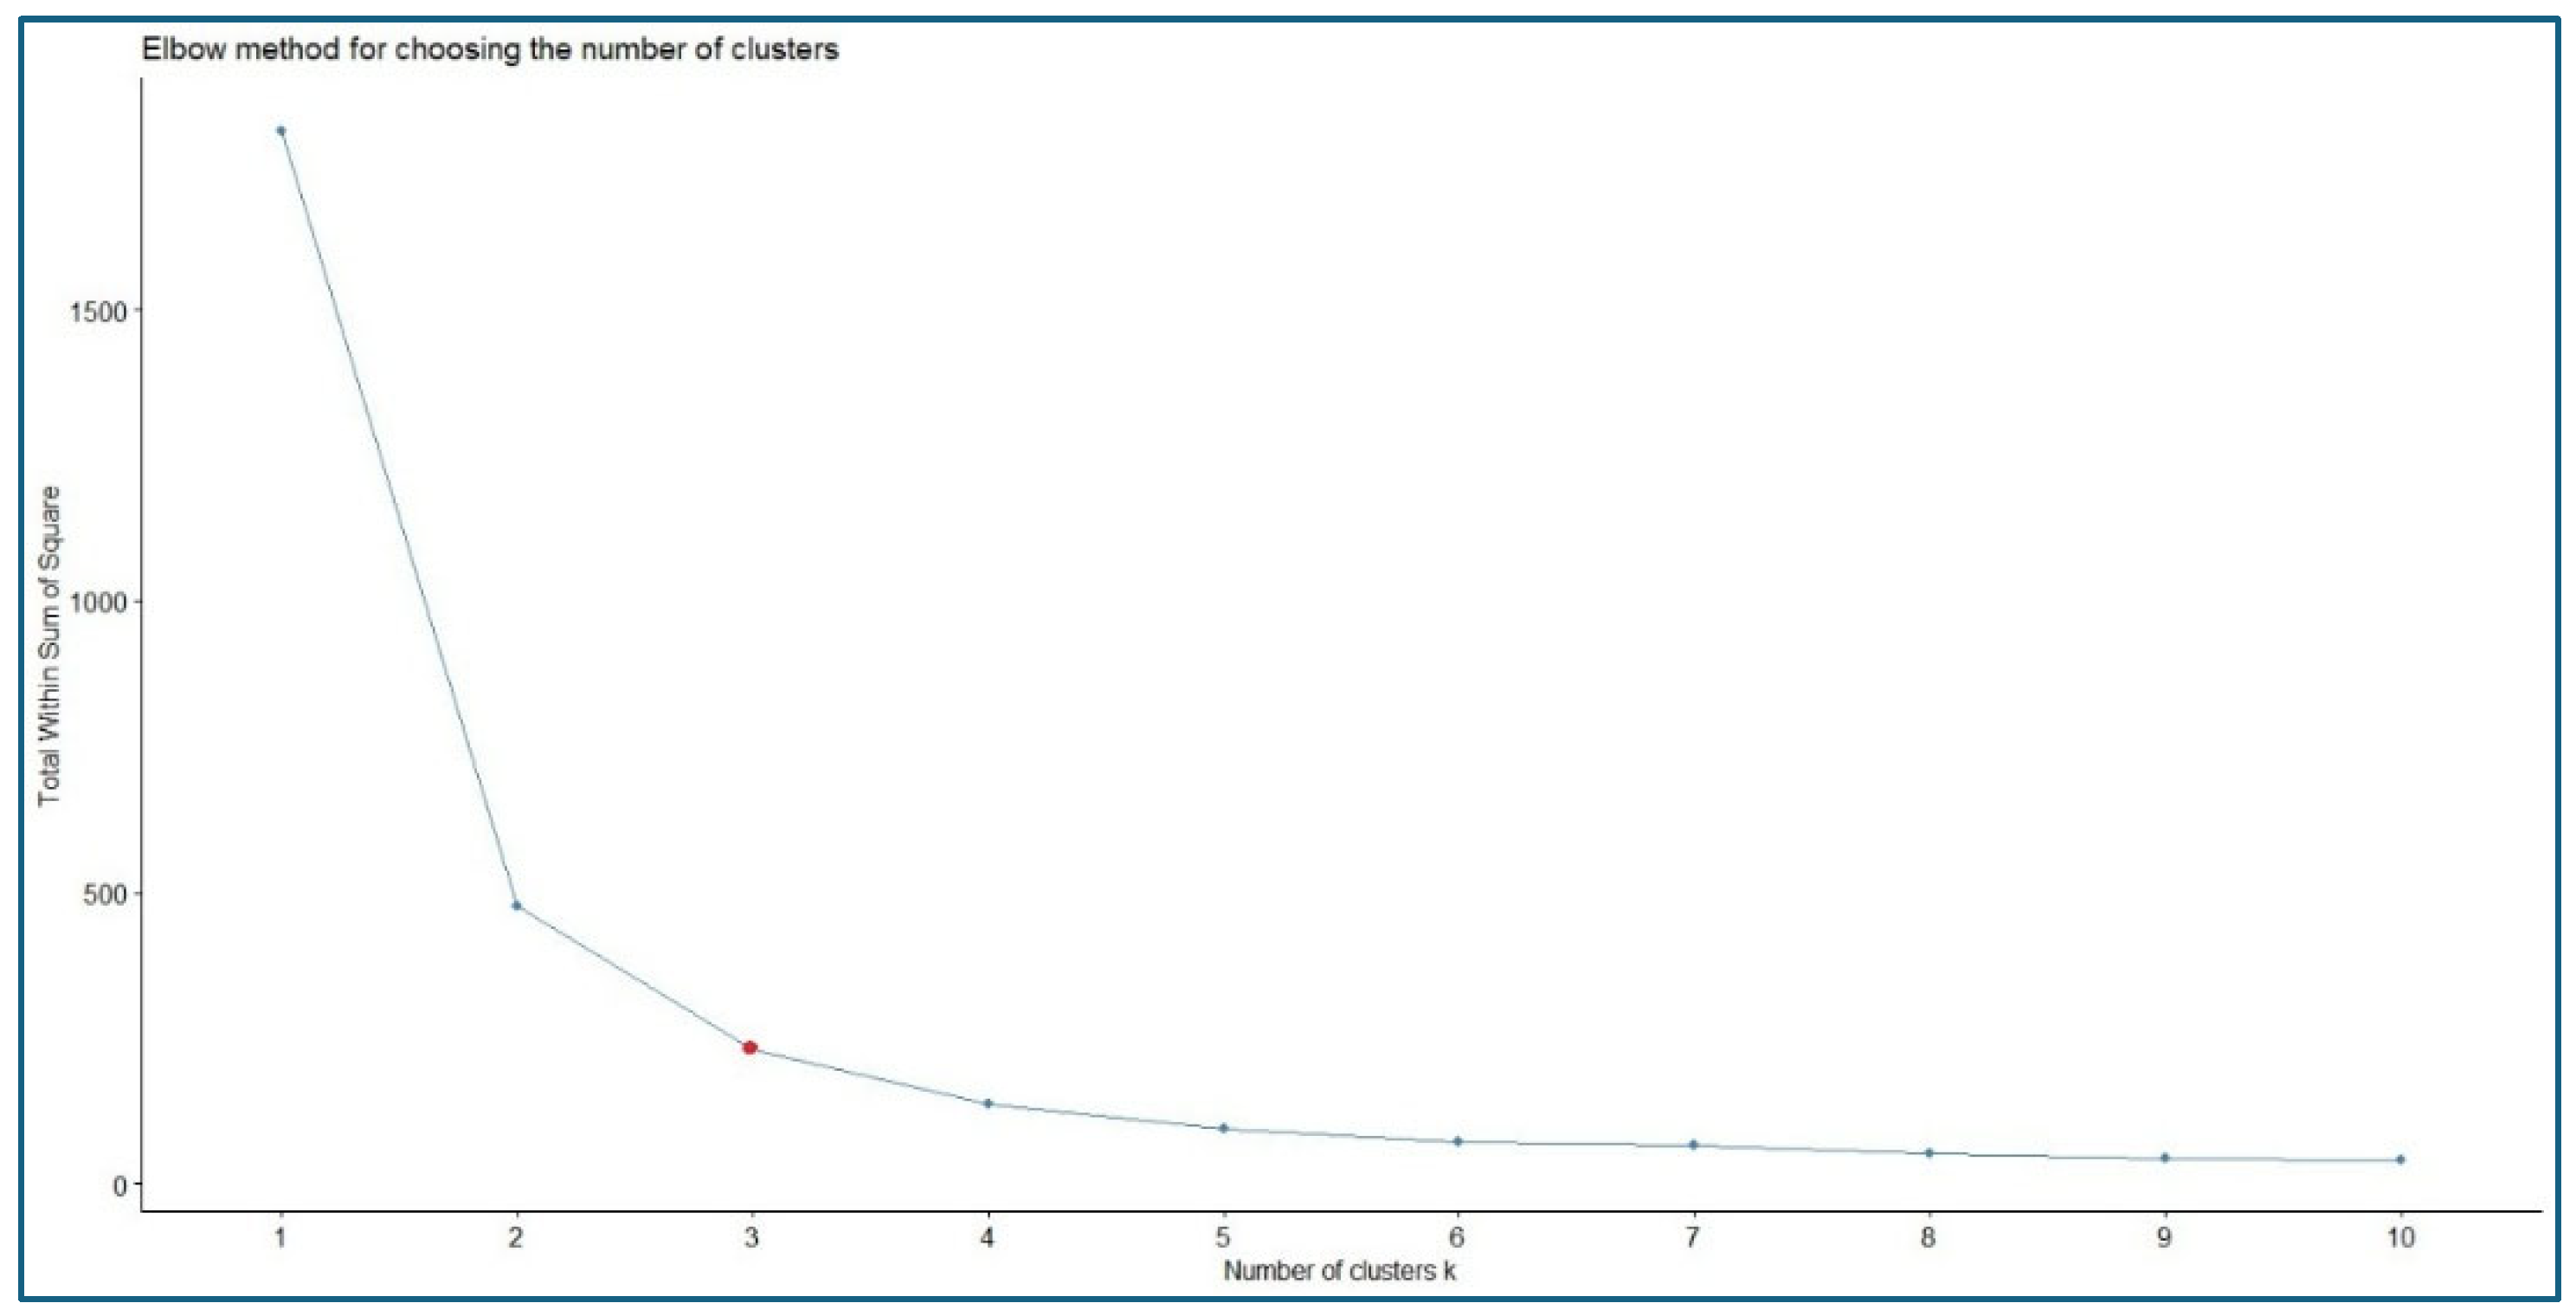
Figure 3 presents the results of the elbow method for clustering information on scores in the UMAP dimensions, which were obtained using the Factoextra package [
45].
Most of the criteria agreed that the most representative structure is one composed of three clusters.
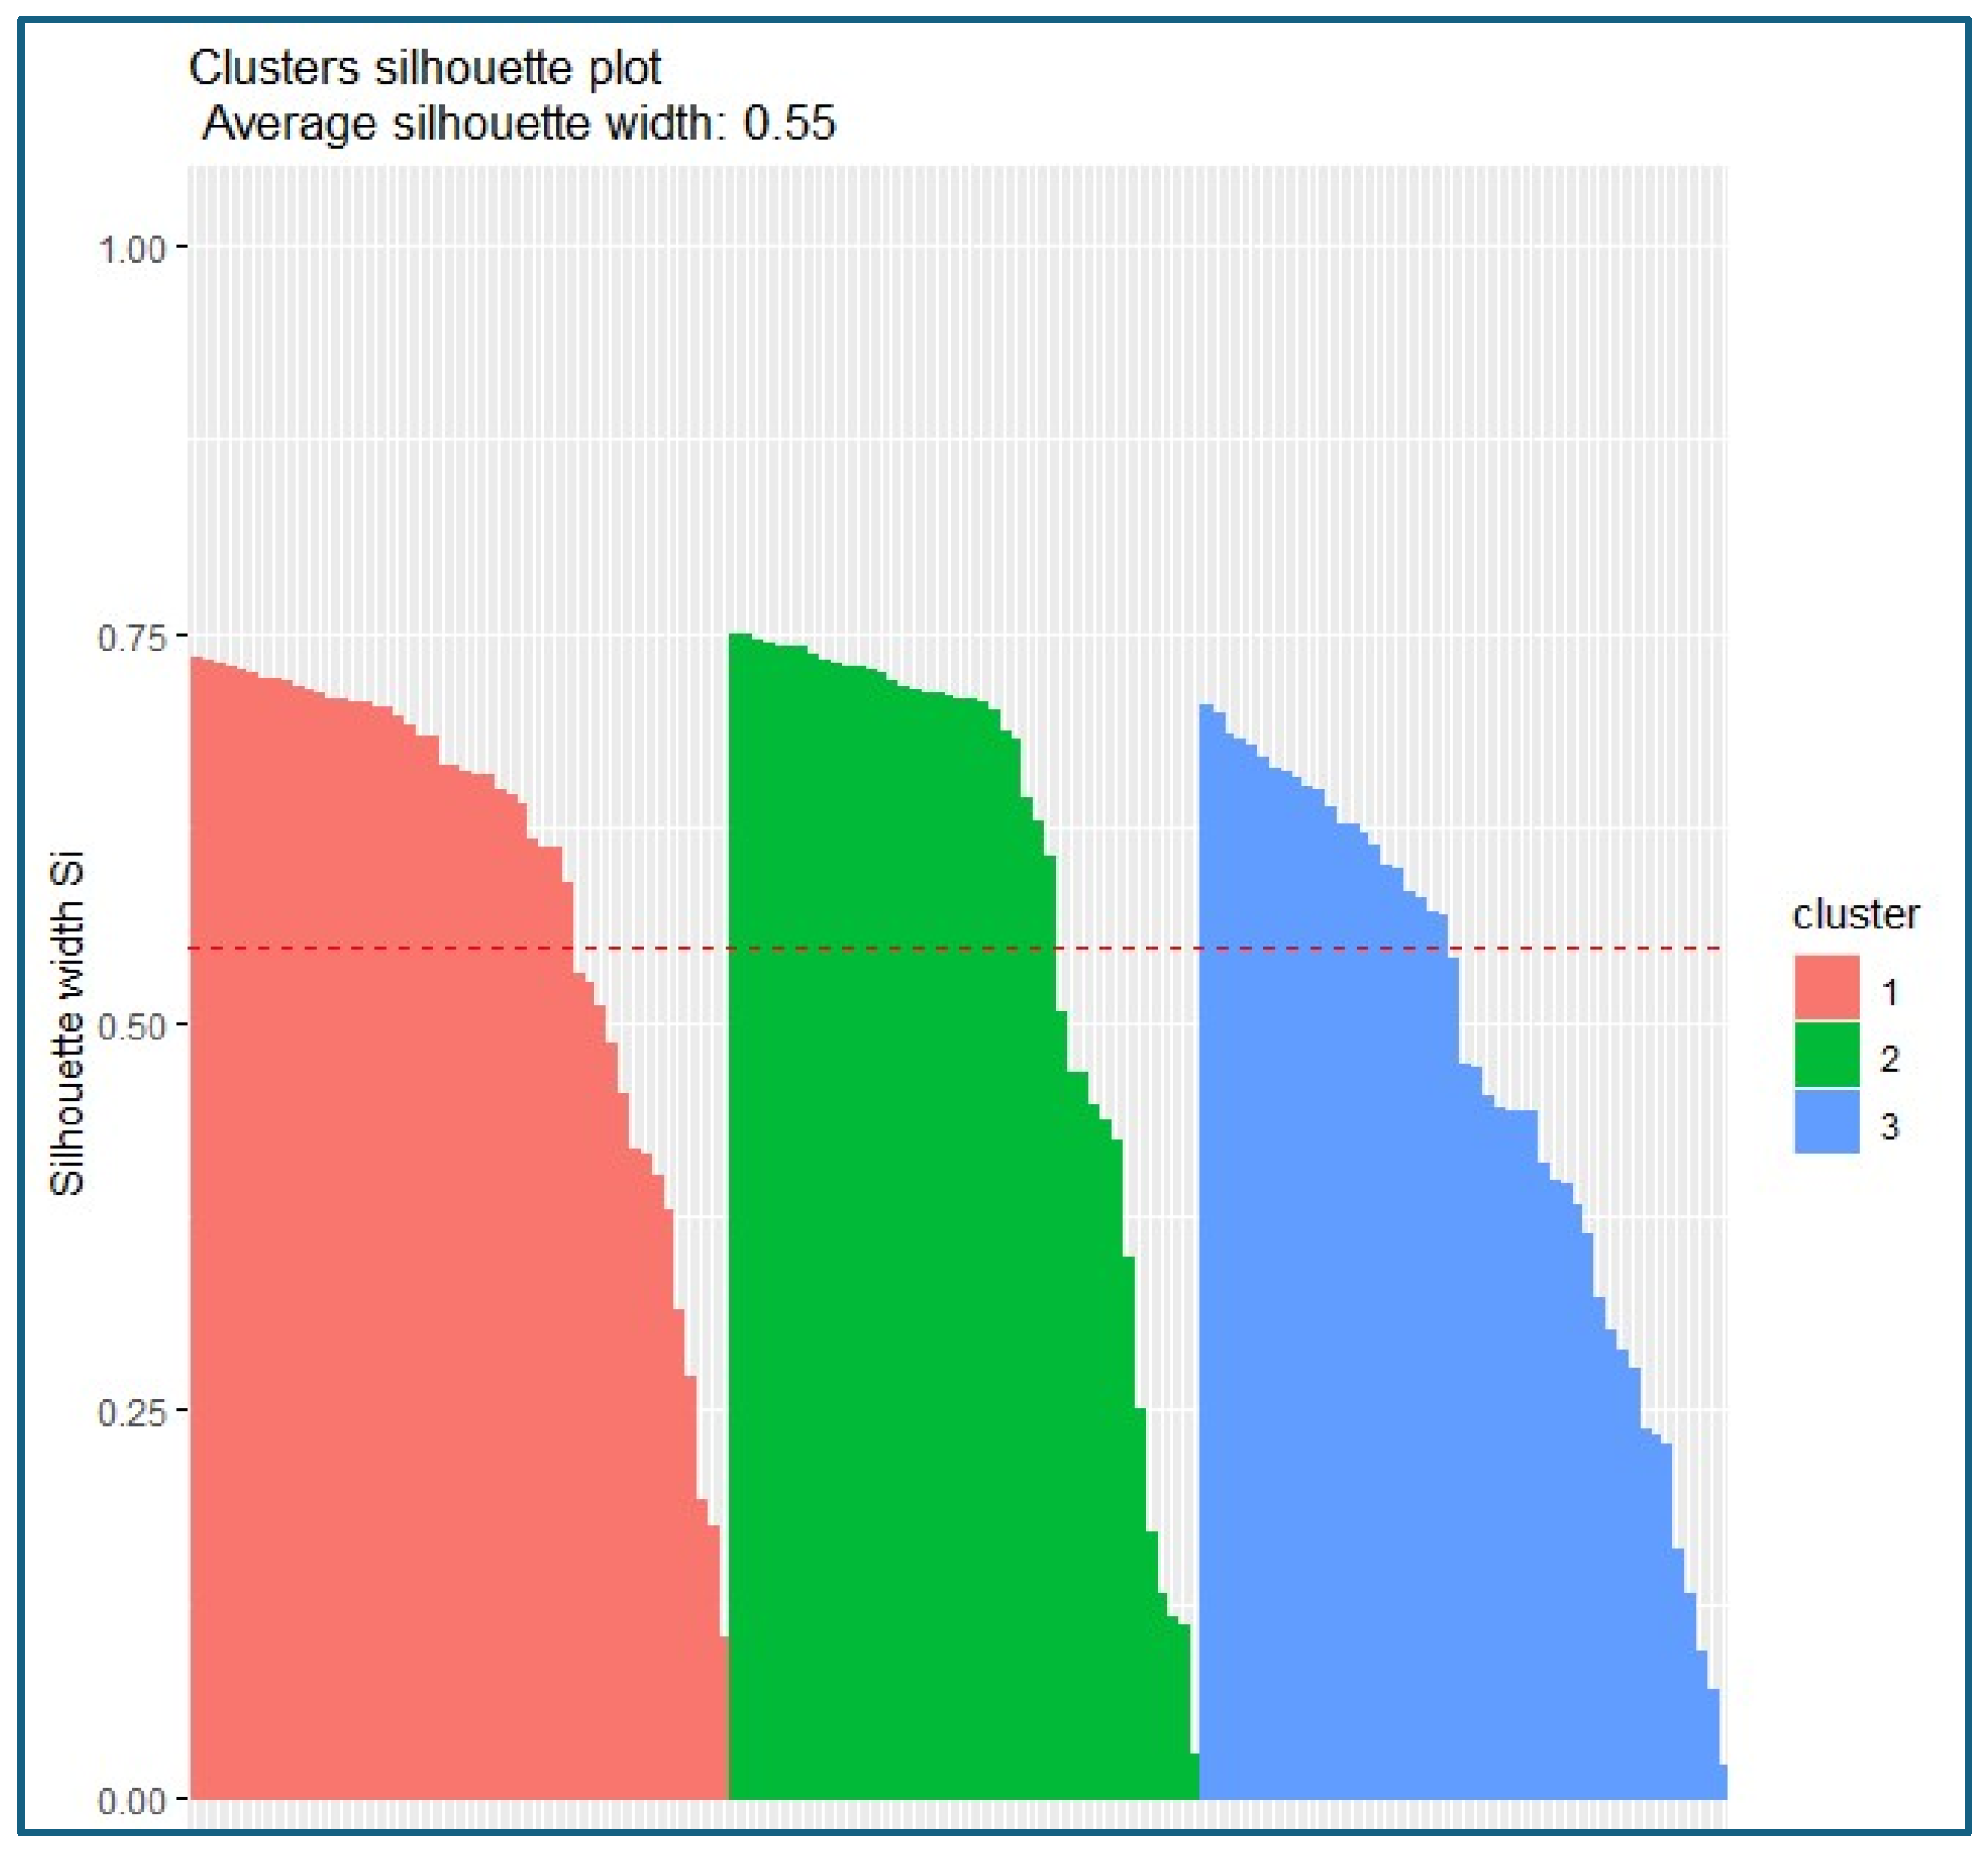
This selection was corroborated by the silhouette index, which yielded positive values for each of the observations, indicating good intra-cluster cohesion and adequate separation between groups. This is evident in the silhouette index illustrated in
Figure 4. It shows that no observation was assigned to the wrong cluster. This configuration supports the structural robustness of the clusters formed [
46].
The results of the clustering process yielded an explained variance percentage of 87.3%, indicating that the clusters capture most of the underlying structure of the data. The value of approximately 90% suggests that the algorithm grouped the data in a way that retains nearly all of the significant variability in the original data. Therefore, the clusters are well defined, and the intra-cluster distances (within each group) are small compared to the overall dispersion.
4.2. Regional Distribution of the Clusters
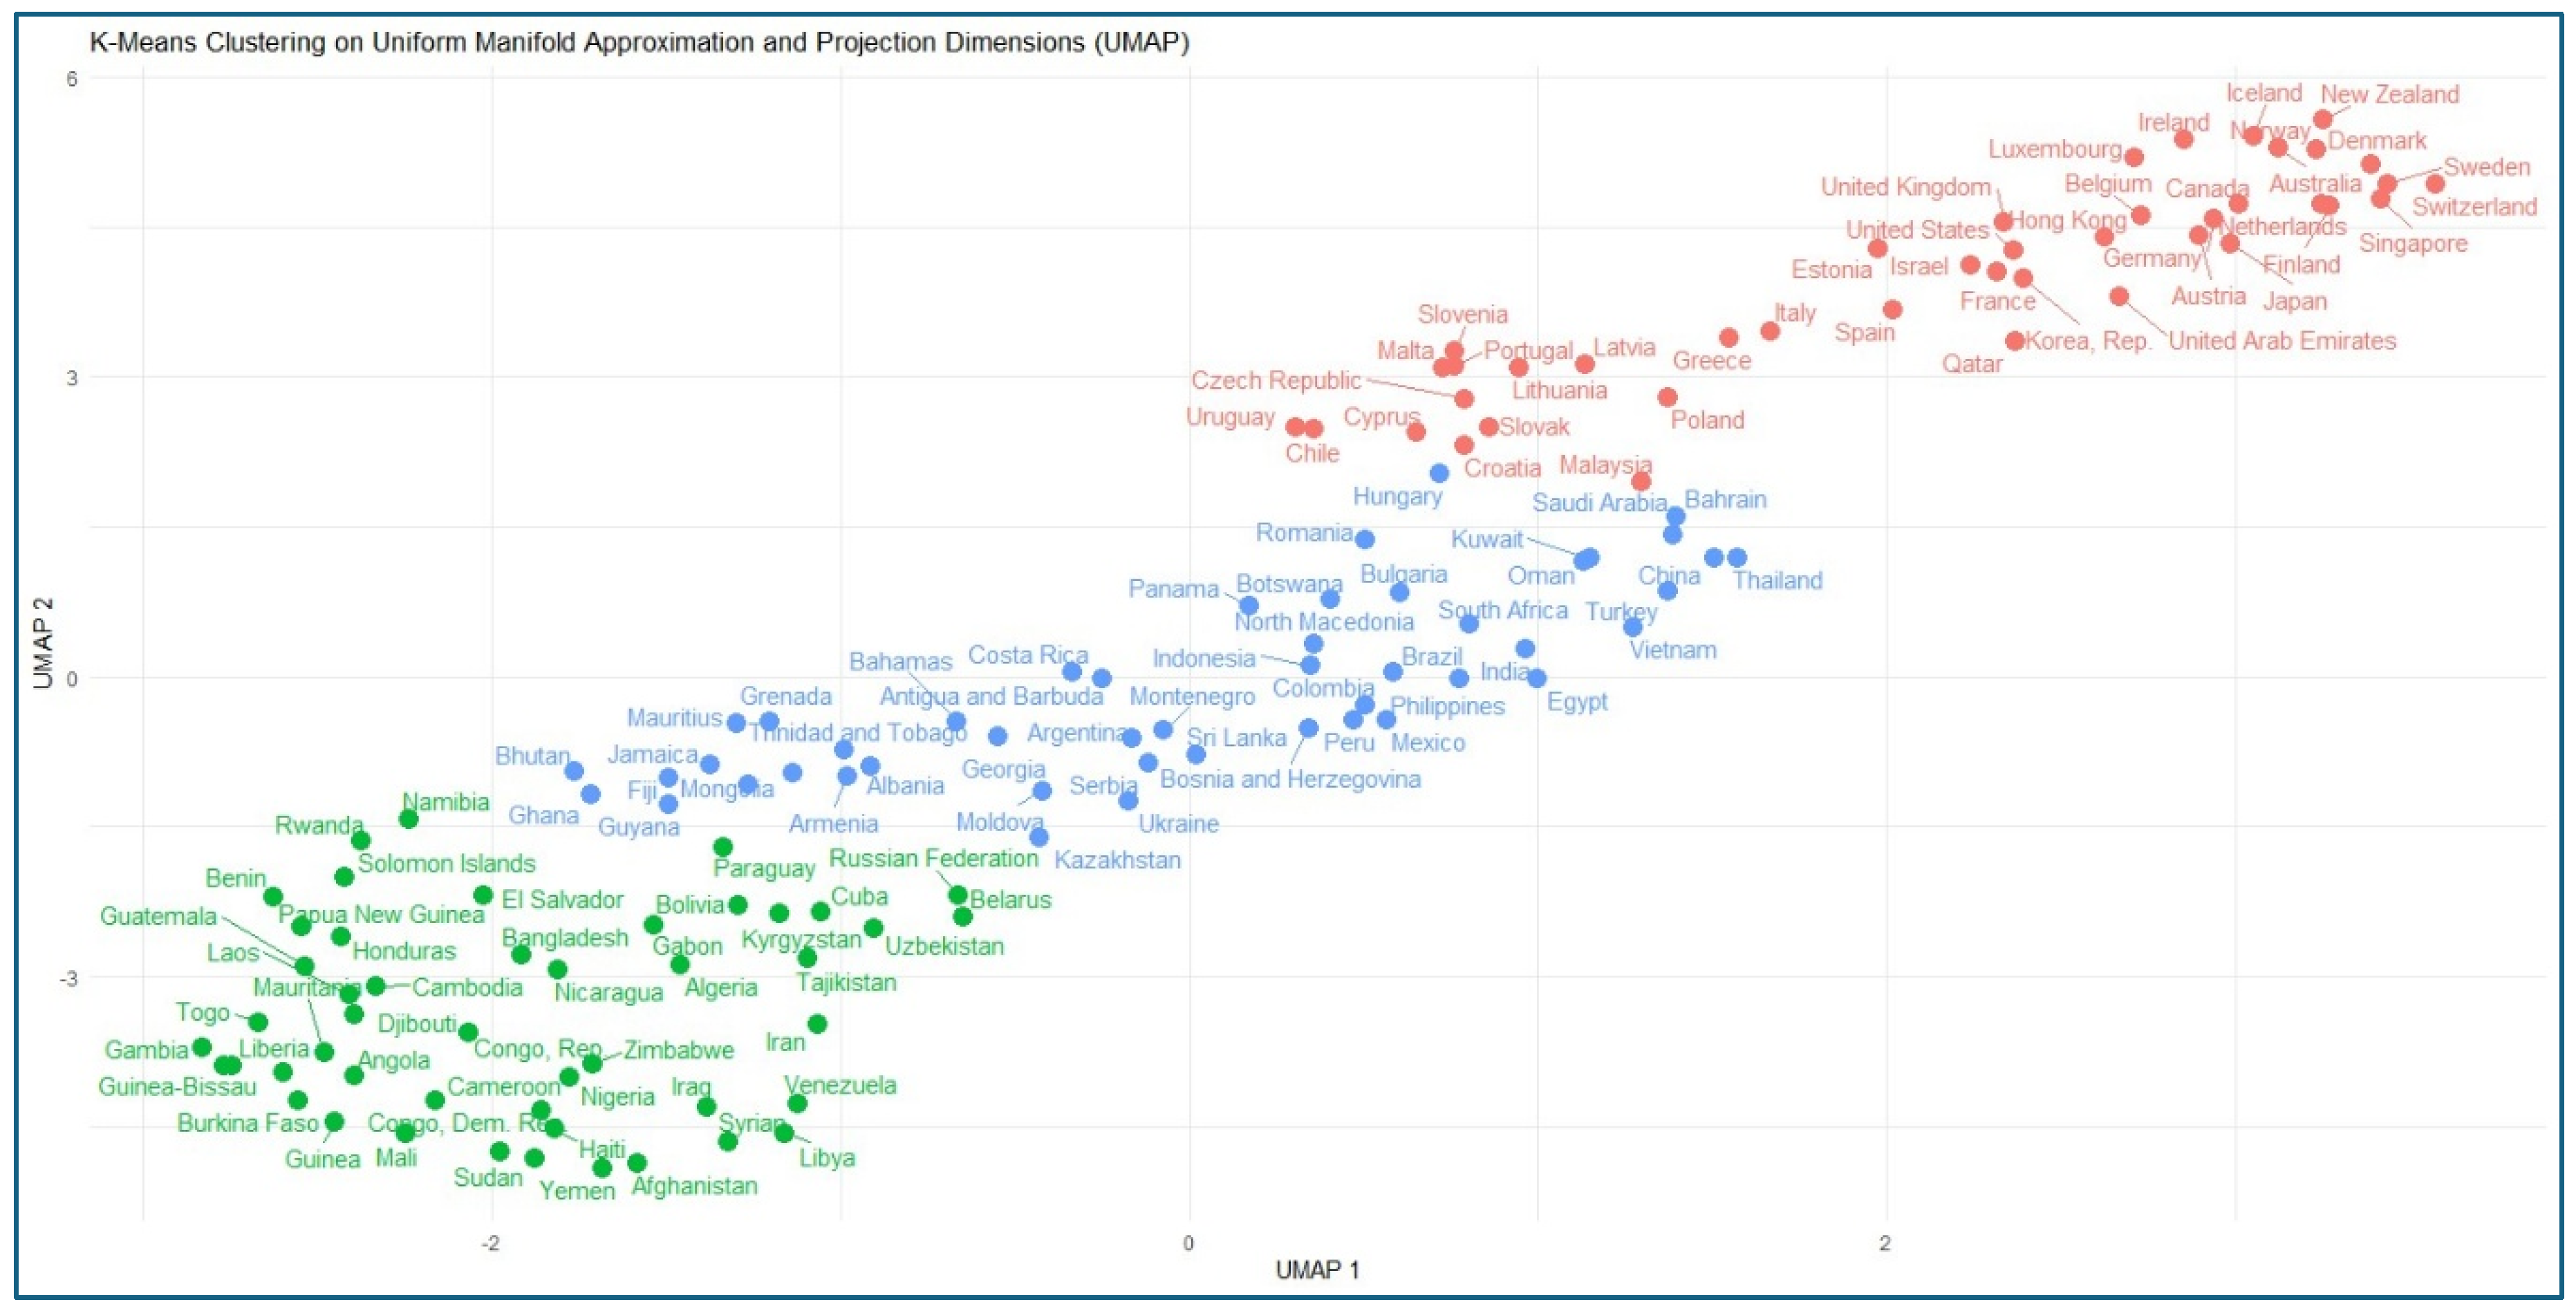
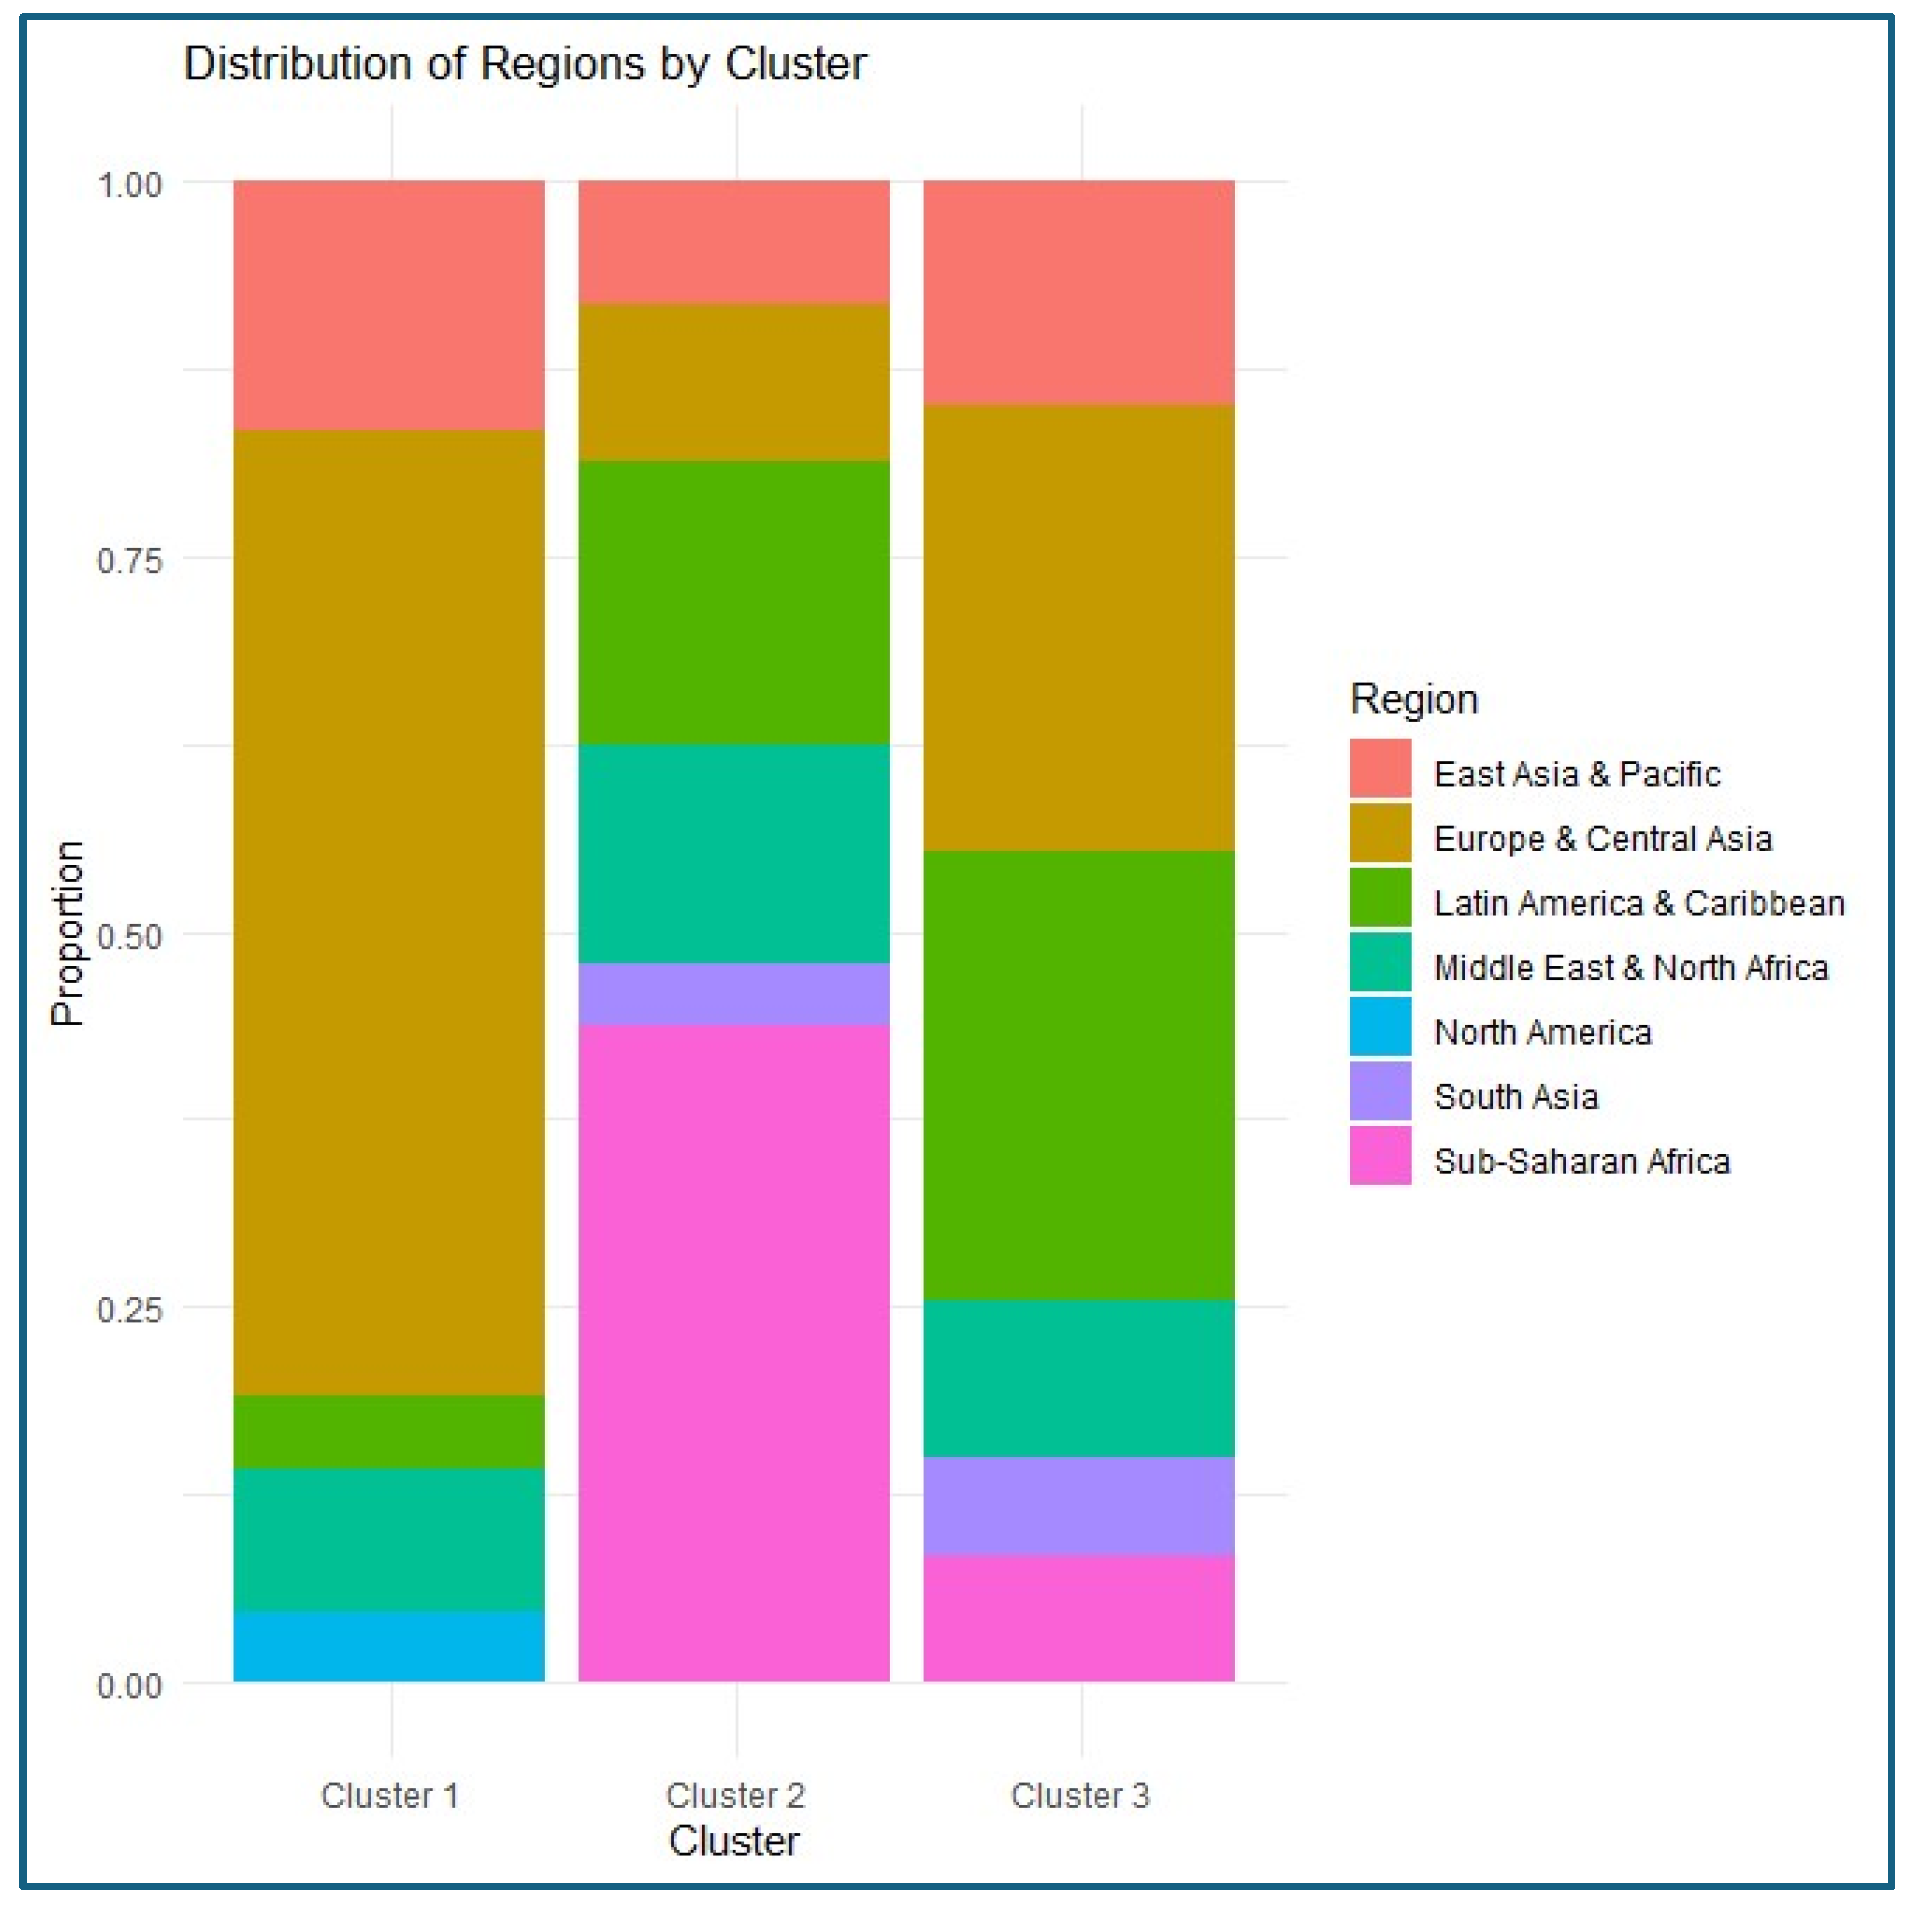
The clustering of the 137 countries generated three clusters with a fairly heterogeneous distribution by region: 42 countries were assigned to Cluster 1, 48 to Cluster 2, and 47 to Cluster 3. Examining the geographic composition revealed consistent regional patterns. Cluster 1 is primarily composed of countries from Western Europe, North America, and certain East Asian economies; Cluster 2 comprises a significant proportion of countries in Sub-Saharan Africa and South Asia; and Cluster 3 includes countries in Latin America, Eastern Europe, and transition economies in Asia. The spatial distribution of countries grouped by cluster is visualized on the global map shown in
Figure 5.
The distribution of countries by region per cluster is presented in
Table 2 and
Table 3.
Furthermore, this information is visually summarised in
Figure 6 using a stacked bar chart that facilitates comparative interpretation.
A chi-square test of independence confirmed that the association between geographic region and cluster membership is not random.
Table 4 presents the summary statistics from the chi-square test supporting the association between region and cluster. This relationship suggests that geography continues to play a structuring role in shaping logistical, institutional, and social capacities, directly linking to the territorial challenges for achieving SDGs 9 (infrastructure), 10 (reduced inequalities), and 16 (strong institutions).
4.3. Multivariate Analysis and Statistical Significance
The MANOVA analysis revealed highly significant differences between clusters across all 16 variables studied. The values obtained in the MANOVA analysis are detailed in
Table 5. This result was reinforced by the univariate analyses (ANOVA), which showed
p-values below 0.001 for each of the individual variables.
Consistently, Cluster 1 countries showed high scores in logistics (LPI), governance (WGIs), and human development (HDI), while Cluster 2 countries exhibited low or critical performance in most dimensions. Cluster 3, on the other hand, presented intermediate values, indicating a transition trajectory with partial progress and persistent challenges.
The ANOVA table shows that for each of the variables considered in this study, the
p-value associated with the "cluster" factor is highly significant. This means that for each of these variables, there are statistically significant differences between the means of the clusters formed. In other words, the methodology used (UMAP + K-means clustering) managed to identify clusters that are significantly different from each other in terms of the variables considered in this analysis. Cluster membership is strongly associated with the values of these variables; the ANOVA confirms that the segmentation generated by UMAP + K-means was effective in discriminating countries with substantially different logistical, institutional, and social profiles.
Table 6 shows the ANOVA results for some key variables.
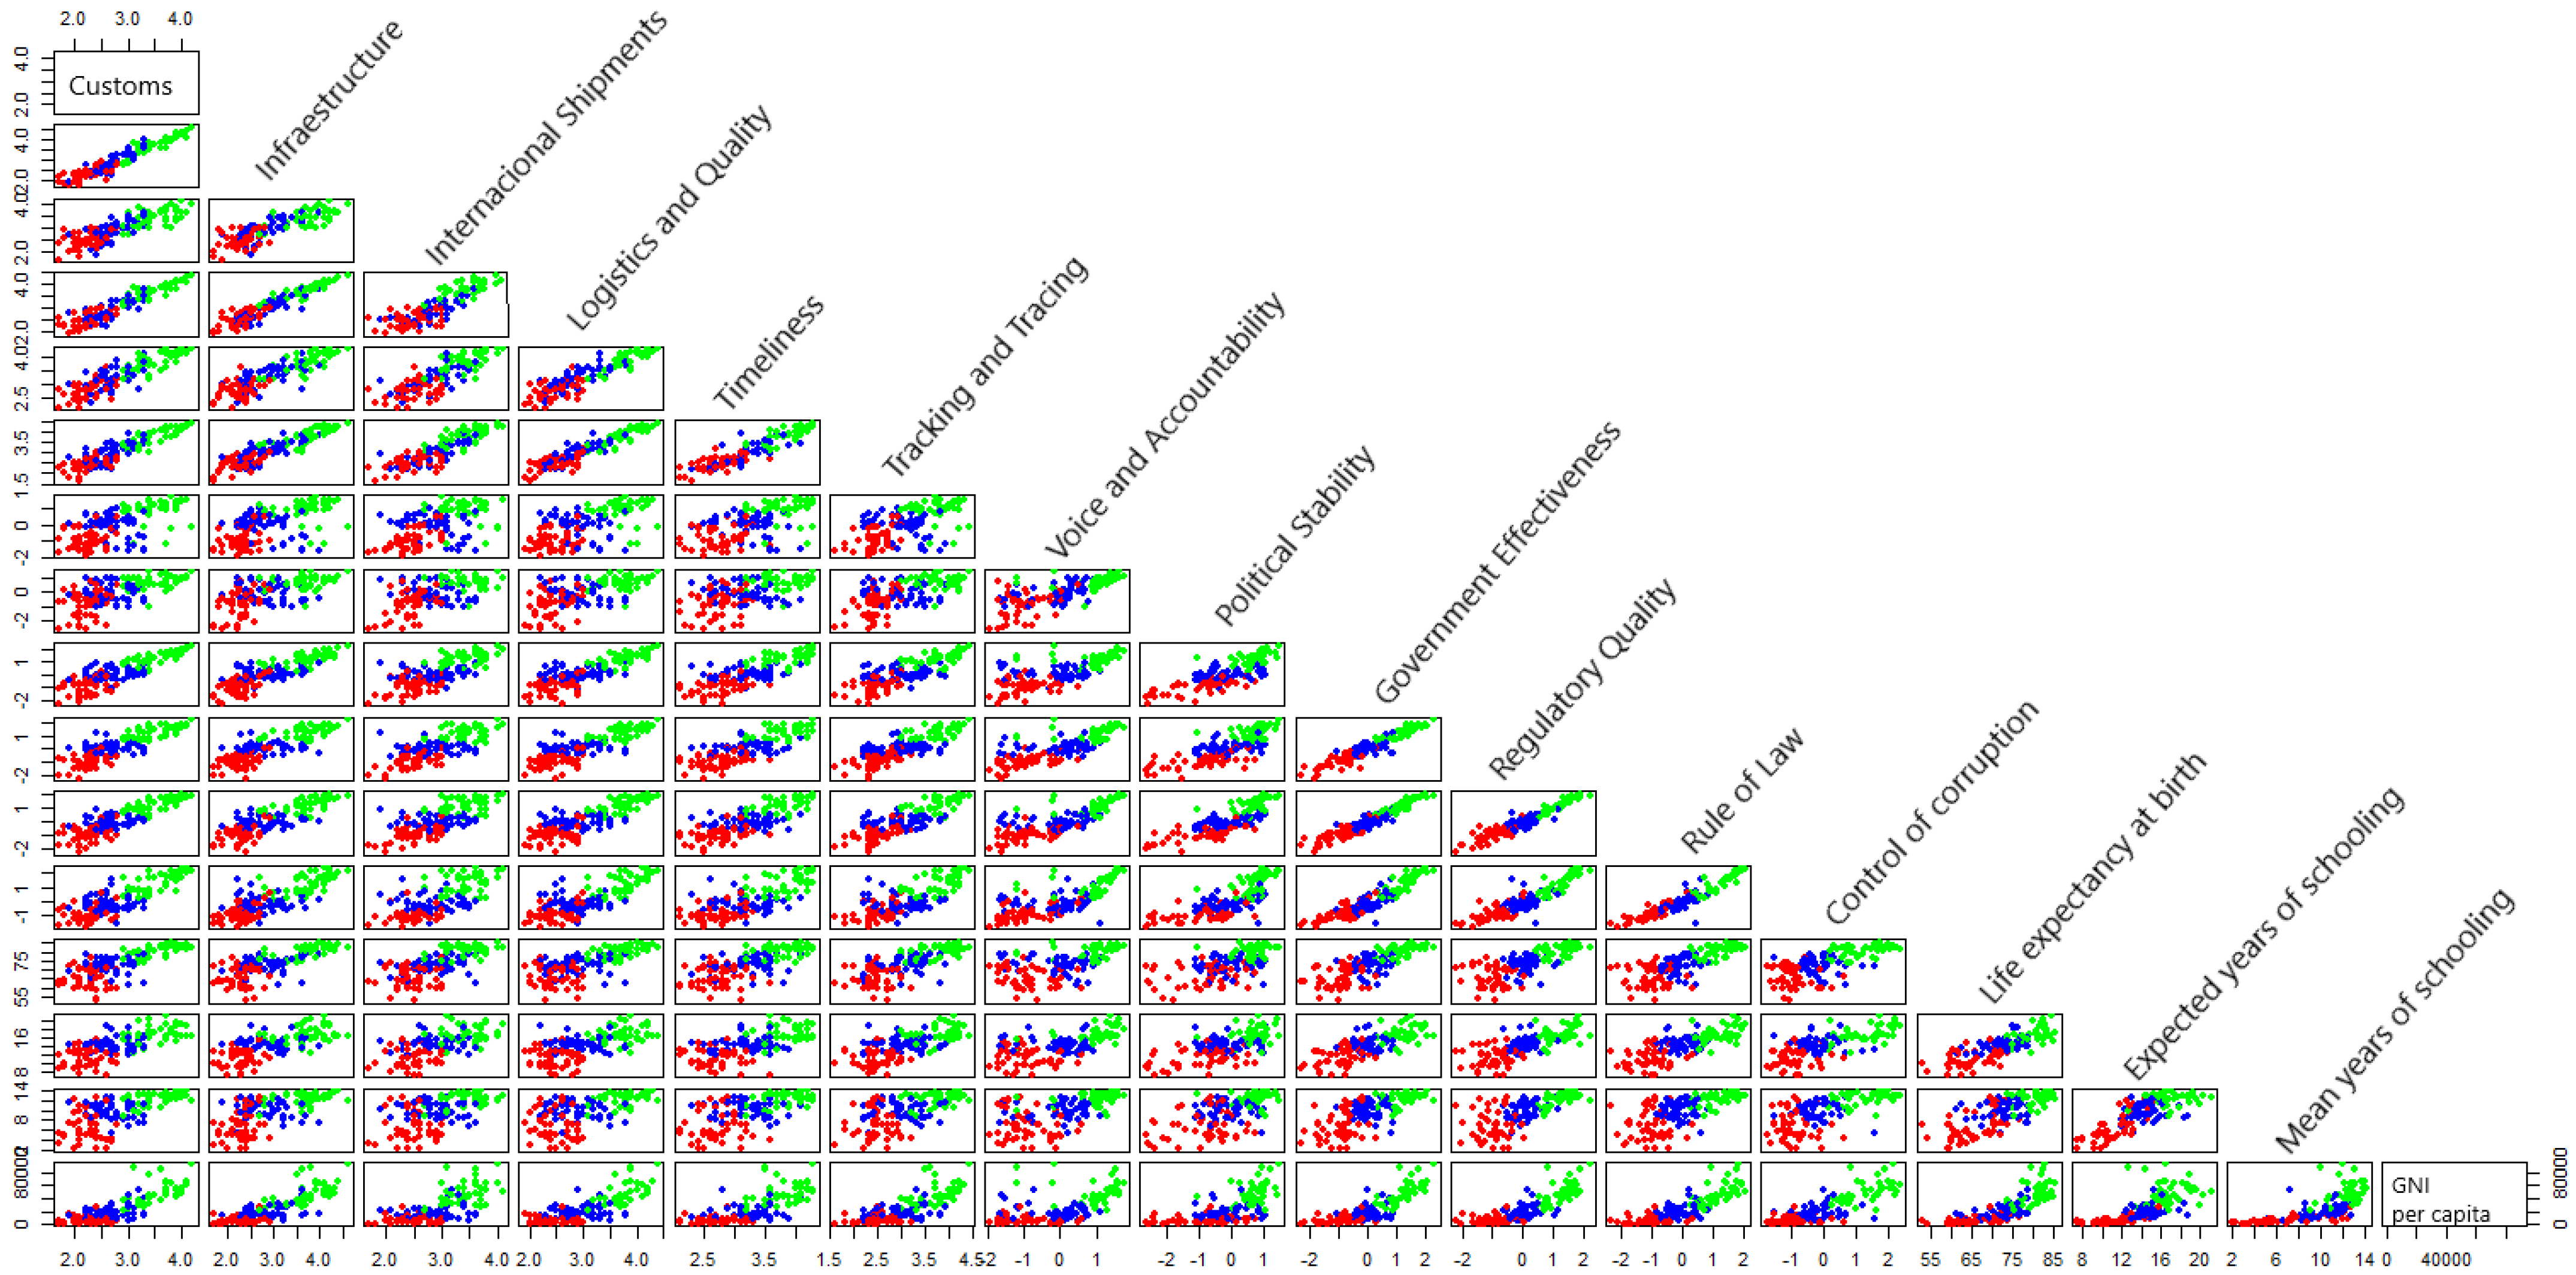
These differences are illustrated more clearly in
Figure 7, which presents a cluster-differentiated pairwise scatter matrix.
4.4. Visualization of Patterns and Internal Relationships
The pairwise scatterplots showed positive correlations between multiple variables, especially between logistics infrastructure, institutional quality, and income levels. This interdependence highlights how countries with better infrastructure also tend to have more effective institutions and higher educational levels, aligning with the targets of SDG 8 (economic growth) and SDG 4 (quality education).
Meanwhile, the boxplots (
Figure 8) revealed a clear hierarchy between clusters: Cluster 1 is systematically at the top of the distribution for all variables, followed by Cluster 3, while Cluster 2 groups the countries that lag the furthest behind. These patterns suggest that the classification is not only statistically valid but also substantively relevant for decision-making.
Figure 8 shows the boxplots for each of the study variables according to the three resulting clusters. The figure indicates that, in general terms, the countries in Cluster 1 exhibit better performance in all the variables considered, followed by the countries in Cluster 3. Cluster 2 presents the worst performance.
4.5. Cluster Characterisation
A detailed review of the countries comprising each cluster allows us to associate the observed characteristics with representative examples:
Cluster 1 comprises countries such as Germany, Japan, Canada, the United States, and Switzerland. These countries have high levels of logistics efficiency, a strong institutional framework, high per capita income, and high levels of schooling. Their position coincides with the highest levels of compliance with SDGs 8, 9, and 16.
Cluster 2 includes countries such as Afghanistan, Haiti, Nigeria, and Sudan. Severe infrastructure deficiencies, weak governance, and low human development indicators characterize them. This group represents nations that face multiple structural barriers to advancing the 2030 Agenda, particularly in SDGs 4, 9, and 16.
Cluster 3 groups emerging economies such as Brazil, China, Mexico, and India. Although their scores are mixed, they exhibit signs of improvement in governance and logistics performance, particularly among those with intermediate education levels and higher per capita income. This cluster has significant transformation potential, making it key to the overall success of the SDGs.
Table 7 provides a concise comparison of the key characteristics of each cluster, including examples from representative regions.
4.6. Strategic Implications
The resulting segmentation reveals that the paths to sustainable development are not homogeneous and that policies must be adapted to the structural conditions of each cluster. Cluster 2 countries require comprehensive interventions in infrastructure, education, and institutional strengthening, while Cluster 3 countries would benefit from targeted improvement strategies. Cluster 1 countries, for their part, can play a global leadership role, contributing with technical cooperation, knowledge transfer, and multilateral financing (SDG 17).
5. Discussion
The results obtained throughout this study not only reveal distinct patterns among groups of countries but also open up new possibilities for comparative analysis of the Sustainable Development Goals (SDGs), particularly those related to infrastructure (SDG 9), strong institutions (SDG 16), and reduced inequalities (SDG 10). The adopted methodological approach, which combines Uniform Manifold Approximation and Projection (UMAP) with K-means clustering, demonstrates high effectiveness in representing and segmenting multidimensional data without substantial loss of information. This combination overcomes the limitations of traditional linear methods, such as Principal Component Analysis (PCA), especially in contexts where data exhibit nonlinear relationships, as is the case with development, logistics, and governance indicators [
3].
Compared with previous studies that employed PCA or t-SNE, the approach developed in this work demonstrates clear advantages in accuracy and structural consistency. Zhang et al. [
4] and Mpaka and von der Heyden [
3] showed that UMAP outperforms traditional methods in preserving local and global structures, as well as in segmenting complex data. Similarly, Pletl et al. [
47] applied UMAP with K-means to hyperspectral images, concluding that this combination outperformed PCA and autoencoders in efficiency and meaningful clustering. Wang et al. [
48] validated the usefulness of UMAP in unsupervised variable selection in high-dimensional datasets. In this framework, this study integrates UMAP and K-means to classify 137 countries based on key indicators related to human development, logistics, and governance, achieving interpretable and robust results. Although their field of application is different, the shared methodological principle highlights the flexibility of UMAP as a dimensionality reduction tool in contexts where the structural complexity of the dataset is high.
Based on the above, this study proposes an unsupervised methodology that enables the identification of multidimensional patterns across countries, integrating variables of human development, logistics, and governance. The results can be compared with those of other recent research. For example, Lee and Zhao [
49] applied heterogeneity models to analyze factors influencing CO
2 emissions, while Surkalim et al. [
50] conducted a systematic review on the prevalence of loneliness on a global scale. Although both provide relevant evidence, they rely on unidimensional frameworks or traditional techniques that do not allow for the exploration of emerging structural clusters. Similarly, the work by Vaillancourt and Haavisto [
51] related logistics performance to the impact of disasters through regressions without applying dimensionality reduction techniques or cluster analysis. Even more methodologically relevant studies, such as that by Basel, Gopakumar, and Rao [
52], which combine gray relationship analysis with K-means to classify countries according to development indices, rely on methods that, while useful, do not capture the nonlinear structures present in complex and multidimensional data with the same effectiveness. In contrast, this study employs a robust methodological combination—UMAP to reduce dimensionality in nonlinear structures and K-means to automatically segment countries—that provides consistent and replicable segmentation. This strategy facilitates the formulation of differentiated policies aligned with the SDGs, strengthening their applicability in real-world territorial planning and assessment contexts.
Furthermore, this approach is particularly valuable for formulating differentiated public policies. The results enable us to characterize groups of countries not only by their relative position in international indicators but also by their structural gaps in terms of institutionalization, logistical connectivity, and social development. This can serve as a key input in the design of regional strategies, technical cooperation initiatives, or targeting of international aid, aligned with the 2030 Agenda. The typology of countries is presented in
Table 8.
The analysis of results allows articulating conclusions about the reasoning set forth by integrating UMAP with K-means. It enhances the exploratory analysis workflow related to more complicated datasets and adds value towards intelligence generation for multifaceted decision-making. The combination of techniques and real-world data, as explained in this study, enables reliance for further country classification attempts from a multidimensional angle by sophisticated methodologies meant for thorough, “recapturable” classifications.
6. Conclusions
The accepted hypothesis grants the application of these data modeling techniques, which are classified as unsupervised and nonlinear, to analyze multidimensional information, especially in public policy frameworks, at an international level. Employing UMAP in conjunction with the K-means algorithm made it possible to logically group 137 countries based on their underlying sustainability attributes—logistics performance, governance, and social indicators. This categorization was found applicable not only from a statistical perspective, giving rise to substantiability and empirical resistance, but also instrumentally, to straddle the structurally focused gaps that allow for decisions regarding regionally based cooperation, investment, and strategic decision planning.
In contrast to traditional methodologies based on linear models or predetermined segmentations, the approach proposed here offers a more flexible, adaptable, and revealing view, especially in contexts where the data structure is not evident. Furthermore, by directly aligning with the Sustainable Development Goals—particularly SDGs 9, 10, and 16—the results allow for more precise and differentiated lines of action to be drawn for different groups of countries. Finally, this study offers a replicable methodological basis for future research seeking to classify national or subnational entities from an integrative perspective. Although the combination of UMAP and K-means showed consistent results, it is worth noting that K-means assumes relatively symmetric cluster shapes, which could limit its capacity in contexts with more irregular structures. Future research could consider alternative algorithms that capture more complex configurations and incorporate dynamic or temporal variables that allow for the analysis of the evolution of these clusters over time, which would further expand the predictive and strategic value of the model proposed here. This study has several limitations that should be acknowledged. First, the analysis is based on cross-sectional data from a single year (2023), which constrains the ability to capture temporal dynamics or to analyze how clusters may evolve over time. Second, the use of the K-means algorithm assumes that clusters are relatively symmetric and spherical, which may limit its effectiveness in identifying more complex or irregular data structures. Although internal validation metrics, such as silhouette scores and explained variance ratios, supported the chosen clustering configuration, alternative algorithms (e.g., DBSCAN or Gaussian Mixture Models) could provide additional perspectives. Future research could build on this study in several directions. Incorporating temporal dynamics would allow for the analysis of how clusters evolve over time, providing a more nuanced understanding of development trajectories and policy effectiveness.
