Abstract
Background: The growing complexity of production processes in the metal–mechanical industry demands ever more effective strategies for managing machine and equipment maintenance, as unexpected failures can incur high operational costs and compromise productivity by interrupting workflows and delaying deliveries. However, few studies have combined end-to-end data analytics and data mining methods to proactively predict and mitigate such failures. This study aims to develop and validate a comprehensive framework combining data analytics and data mining to prevent machine failures and support decision-making in a metal–mechanical manufacturing environment. Methods: First, exploratory data analytics were performed on the sensor and logistics data to identify significant relationships and trends between variables. Next, a preprocessing pipeline including data cleaning, data transformation, feature selection, and resampling was applied. Finally, a decision tree model was trained to identify conditions prone to failures, enabling not only predictions but also the explicit representation of knowledge in the form of decision rules. Results: The outstanding performance of the decision tree (82.1% accuracy and a Kappa index of 78.5%), which was modeled from preprocessed data and the insights produced by data analytics, demonstrates its ability to generate reliable rules for predicting failures to support decision-making. The implementation of the proposed framework enables the optimization of predictive maintenance strategies, effectively reducing unplanned downtimes and enhancing the reliability of production processes in the metal–mechanical industry.
1. Introduction
The metalworking industry is one of the most crucial suppliers of parts and components to the automotive sector, where operational efficiency and equipment reliability are vital to success. With highly automated production lines and ever more complex manufacturing processes, the consequences of machine failures extend far beyond the immediate cost of repair. A single unplanned stoppage can inflict substantial productivity losses, jeopardize delivery deadlines, and compromise product quality.
To address these challenges, many metalworking companies equip their machines with Internet of Things sensors to generate vast streams of data [1]. By applying data-mining techniques, companies can uncover hidden insights that inform better decision-making [2,3]. Traditionally, maintenance in this industry has followed two main models: corrective maintenance, which occurs after a failure, and preventive maintenance, scheduled at fixed intervals or operational cycles. Both approaches have serious drawbacks. Corrective maintenance leads to unplanned—and often lengthy—downtime, while preventive maintenance can result in the premature replacement of components that still have useful life, driving up costs and wasting resources.
Predictive maintenance, powered by data analytics (DA) and data mining (DM), offers a revolutionary alternative. Rather than relying solely on fixed schedules, predictive maintenance uses real-time and historical data to identify patterns, detect anomalies, and forecast failures before they happen. This enables targeted, timely interventions that minimize downtime. Yet many data analysts in the metalworking sector lack the expertise to apply DA and DM methods effectively for accurate decision support [4,5]. As Medeiros et al. [6] argue, such approaches must be embraced as a core operational strategy for machine failure prediction.
Indeed, DM plays a critical role in mitigating failures and guiding production decisions [7]. By extracting and analyzing the hidden insights within machine-generated big data [8,9], companies can make more confident, mature decisions [10] and deploy preventive maintenance to eliminate unexpected stoppages [11].
Beyond maintenance, production logistics itself stands to benefit from advanced computational analysis—yet few studies have ventured into this area, with most research limited to simulations or literature reviews [12]. One investigation showed that optimizing production schedules via reinforcement learning can significantly enhance logistics decision-making [13]. Furthermore, integrating real-time deep learning and Long Short-Term Memory neural networks into logistics data enables precise production planning—especially when combined with predictive maintenance—yielding lower costs and reduced energy consumption [14].
Several case studies illustrate the power of these computational approaches. Sharanya et al. [15] used clustering to predict bearing failures by analyzing life-cycle data, while Salem et al. [16] compared Random Forest, XGBoost, K-Nearest Neighbors, Support Vector Machines, and Logistic Regression to detect vibration-related faults and anticipate bearing replacements. Both efforts produced promising results for scheduling maintenance before breakdowns. Similarly, Surantha and Gozali [17] addressed instability in production machinery and highlighted the need for maintenance plans that replace parts at end of life. More recently, Shahin et al. [18] and Hosseinzadeh et al. [19] demonstrated that Deep Forest and Gradient Boosting models can achieve over 90% accuracy in forecasting machine failures and preventing unplanned downtime.
Despite these advances, no study has yet combined DA and DM specifically to mitigate failures and support decision-making across both maintenance and production logistics in a metalworking setting. This gap underscores the theoretical and practical contribution of the present research. As an applied study, it offers operational managers a clear, actionable framework that can be adopted in an industrial setting. Accordingly, the central research question is as follows: how can DA and DM mitigate machine failures and enhance decision-making in both production and logistics in the metal–mechanical industry?
To address this, this study proposes a four-stage framework—comprising DA, preprocessing, DM, and interpretation—specifically tailored to the operational context of the metal–mechanical industry. In the first stage, DA was used to perform an exploratory analysis of the data, identifying trends and relationships among both process and logistics variables. In the second stage, preprocessing was conducted to clean and encode the data, select the most important variables, and perform resampling to address class imbalance. Next, in the DM stage, a decision tree (DT) was applied to identify critical conditions that characterize failures and to extract actionable insights—expressed as decision rules—from both operational and logistics data. In the fourth and final stage, the discovered patterns were interpreted, and the rules generated by the DT were reformulated in clear and concise language to facilitate understanding by decision-makers. In essence, the insights were synthesized at a higher level to support targeted maintenance actions, optimize production planning, and enhance logistics decision-making, ultimately contributing to greater overall operational efficiency.
This paper is organized into five sections: the Section 1, which presents the context, objectives, literature review, and relevance of the study; Section 2, which detail the methodological procedures, data collection, and analysis techniques; Section 3, which present the findings; Section 4, which interprets those findings in light of the objectives and reviewed literature; and Section 5, which synthesizes the main outcomes, discusses limitations, and offers suggestions for future research.
2. Materials and Methods
2.1. Data Collection
To conduct the experiments, the predictive maintenance dataset compiled by Matzka [20] was adopted. It comprises 10,000 records, each represented by the following attributes: UID—unique identifier, from 1 to 10,000; Product ID—product quality category: L (50% of all products), M (30%), or H (20%); Air Temperature [K]—generated via a random-walk process and normalized to a 2 K standard deviation around 300 K; Process Temperature [K]—generated via a random-walk process, normalized to a 1 K standard deviation, then offset by adding (air temperature + 10 K); Rotation Speed [rpm]—computed from a 2860 W power input with superimposed Gaussian noise; Torque [Nm]—normally distributed around 40 Nm (σ = 10 Nm), with no negative values; Tool Wear [min]—additional wear added based on quality: H + 5 min, M + 3 min, L + 2 min; Target Label—indicates whether the machine failed at that data point; and Failure Type—specific failure mode: no failure, heat dissipation failure, power failure, random failure, overstrain failure, or tool wear failure.
The dataset is imbalanced, with a low representation of certain failure types. It contains 9652 samples classified as no failure, followed by 112 samples of Heat Dissipation Failure, 95 samples of Power Failure, 78 samples of Overstrain Failure, 45 samples of Tool Wear Failure, and only 18 samples of Random Failure.
2.2. Proposed Framework
The proposed framework integrates DA and DM to mitigate machine failures and support decision-making in metalworking production processes to enhance operational reliability and optimize maintenance strategies. This integration is organized into a structured workflow consisting of four key stages, as highlighted in Figure 1.
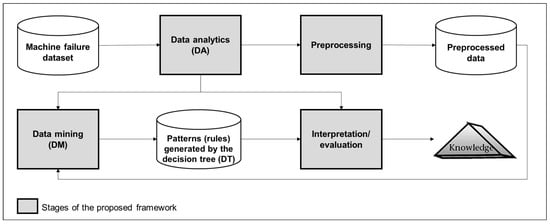
Figure 1.
A workflow of the proposed framework.
In the first stage, detailed in Figure 2, DA plays a critical role in the initial examination of the data, preparing and identifying operational patterns that guide the subsequent mining process. Exploratory analyses are conducted to reveal trends, distributions, and potential anomalies in sensor and monitoring data. For example, univariate analysis quantifies the frequency of specific failure modes, while bivariate analysis uncovers significant correlations—such as between process temperature and rotation speed—that signal critical conditions preceding failures. Notably, the absence of missing values in the original dataset allows this exploratory phase to proceed immediately, ensuring a robust and comprehensive analysis.
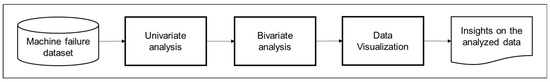
Figure 2.
Steps performed in the DA stage.
Building on these insights, the second stage—preprocessing—enhances the representativeness of the data used in the predictive model. Key operations include data cleaning, encoding, feature selection, and resampling, as illustrated in Figure 3 and described below.
- Data cleaning: The removal of records with values outside the expected range (outliers) and exclusion of inconsistent records that could compromise the predictive model’s accuracy.
- Data transformation (categorical encoding): The “Product ID” column, originally containing the categories {L, M, H}, is encoded to numeric values: L → 0, M → 1, H → 2. This transformation ensured compatibility with the decision tree algorithm adopted in this study—Classification and Regression Trees (CARTs)—which requires numeric inputs.
- Feature selection: Based on insights from the DA phase and using the Minimum Redundancy Maximum Relevance (mRMR) method [21], the most relevant attributes for failure prediction are selected.
- Data resampling: To correct class imbalance between failure and non-failure instances, the Synthetic Minority Over-Sampling Technique (SMOTE) is applied to increase the representation of minority classes.

Figure 3.
Steps performed in the preprocessing stage.
With the data prepared, the third stage of the framework—DM—applies DT to identify patterns and critical conditions that lead to machine failures, producing decision rules that are easily interpretable by maintenance managers, such as “IF Temperature > 300 K and Rotation < 1300 rpm, THEN there is a high risk of heat dissipation failure”. As previously mentioned, the CART algorithm [22] is employed to build the DT model used in this study. In the fourth stage, the results are evaluated and interpreted to support decision-making. These last two stages are detailed in Figure 4.

Figure 4.
Steps performed in the DM and interpretation stages.
Accuracy and the Kappa index [23] are employed to validate the DT model’s predictive capacity. Accuracy measures the proportion of correct predictions made by the model; however, in imbalanced datasets, it can be misleading. To overcome this limitation, the Kappa index adjusts for chance agreement, offering a more reliable assessment of model performance [23]. Based on the insights obtained from exploratory analysis and the rules generated by the DT, it is possible to plan targeted preventive maintenance, avoiding unplanned downtime and optimizing resource allocation. For example, when a recurring failure pattern is identified under specific operation conditions, interventions can be scheduled proactively. Furthermore, the practical implementation of the proposed framework enables lifecycle optimization components, prevents premature replacements, and reduces operational costs.
3. Results
3.1. Data Analytics
Univariate analysis was the initial step in exploring machine failure data, focusing on the distribution and behavior of each individual variable. First, the distribution of the “Failure Type” variable—shown in Figure 5—was examined to understand the frequency and relative proportions of each failure category in the available records. This was essential for establishing an overall picture of failure occurrence and identifying the most prevalent failure types, thereby guiding the prioritization of subsequent analyses and predictive-maintenance strategies.
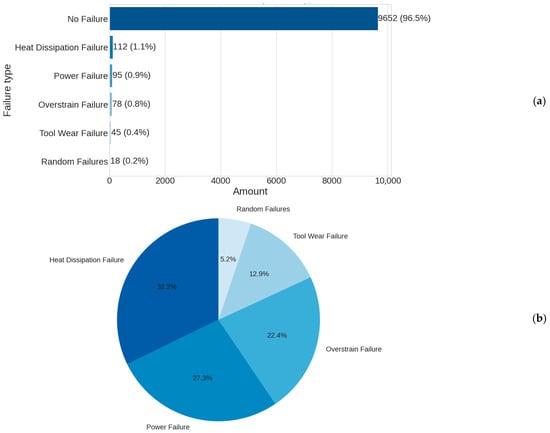
Figure 5.
Data distribution by failure types. (a) Considering “no failure”, (b) disregarding “no failure”.
The univariate analysis demonstrated a critical feature of the data: a highly imbalanced failure distribution, with 96.52% of records showing no failure and only 3.48% containing actual failure events. Among these failure events, “Heat Dissipation Failure” and “Power Failure” stood out as the most common types, accounting for 32.2% and 27.3% of all recorded failures, respectively.
This uneven distribution has important implications for both predictive model development and preventive maintenance strategies. It highlights the need for specialized techniques to handle imbalanced classes and indicates that prevention efforts should focus on the dominant failure modes—heat dissipation and power failures—to maximize maintenance impact.
The relationship between various machine operation parameters and heat dissipation failures, the most frequent failure type identified earlier, was also examined. This comparative approach aimed to identify the specific operating conditions and characteristic patterns that precede or accompany this failure mode, laying the groundwork for effective predictive indicators.
The bivariate analysis (Figure 6) revealed a distinct operational profile associated with heat dissipation failures, defined by a critical combination of synergistic parameters:
- Elevated air temperature (mean 302.57 K vs. 299.97 K under normal operation):The slight 2.6 K increase represents a crucial threshold for the system’s thermal dissipation capacity.
- Reduced rotation speed (mean 1337.96 rpm vs. 1540.26 rpm):The approximately 13% drop significantly impairs the natural ventilation and airflow needed for efficient cooling.
- Increased torque (mean 52.78 Nm vs. 39.63 Nm):The approximately 33% rise corresponds to substantially greater heat generation during machine operation.


Figure 6.
Bivariate analysis of failures.
A comparative visualization of these parameters’ distributions—using histograms and boxplots—confirmed the existence of critical operating ranges, as illustrated in Figure 6.
In particular, we found that heat dissipation failures rarely occur when air temperature is below 300 K or rotation speed exceeds 1450 rpm, even under high-torque conditions.
This clearly defined “failure signature” suggests a causal mechanism: the system cannot dissipate heat adequately when high torque (which generates more heat) coincides with low rotation speed (which reduces natural ventilation) in an already thermally stressed environment. Our analysis also quantified the critical thresholds for these parameters and showed how their interaction creates conditions of elevated failure risk.
A non-linear relationship between rotation speed and temperature was also uncovered. At very low speeds (below 1300 rpm), even small increases in ambient temperature (1–2 K) can trigger thermal failures, whereas at higher speeds (above 1500 rpm), the system tolerates temperature fluctuations more robustly.
These findings provide valuable insights for the development of early warning systems and predictive maintenance strategies, enabling the following actions:
- Establish evidence-based safe operating limits;
- Dynamically adapt monitoring thresholds to current operating conditions;
- Automate preventive interventions upon the detection of precursor conditions;
- Optimize cooling systems to increase capacity in response to high-risk parameter combinations.
Using advanced visualization (histograms, scatterplots, and boxplots) alongside other statistical methods, the failure records were examined to uncover distinct operational signatures and correlation structures for each failure mode, as demonstrated in Figure 7. The goal was to build a holistic view of the conditions that characterize and precede different types of failures.
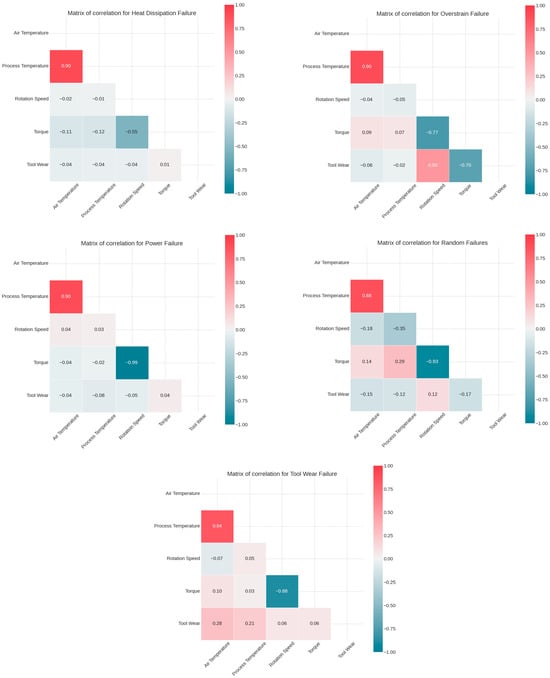
Figure 7.
Correlation analysis.
In Figure 7, a very strong positive correlation (≥0.84) is observed between air and process temperatures, indicating that increases in ambient temperature directly elevate process heat. A moderate negative correlation (≈−0.55) is also identified between rotation speed and torque: as speed decreases, torque increases, creating a high-heat, low-ventilation scenario conducive to heat failure. In contrast, the correlation profile for power failure is notably different.
These events tend to occur under significantly higher rotation speeds, and the temperature–speed correlation reverses the direction compared to heat failures. This pattern suggests a distinct causal mechanism—likely linked to electrical load stress rather than heat accumulation.
3.2. Data Mining
The DT model was developed and trained using the CART algorithm from the scikit-learn library “https://scikit-learn.org/stable/index.html (accessed on 25 May 2025) with carefully defined hyperparameters. Hyperparameter fine-tuning was performed using the Grid Search method to optimize the DT model, with k-fold cross-validation (k = 5). The search space included different criteria for split quality (gini, entropy, or log_loss), splitting strategies (best or random), maximum depths (3 to 5), minimum samples for node splitting (2, 5, or 10), and minimum samples per leaf (1, 2, 5, or 10). It also tested options for the number of features at each split (None, sqrt, or log2) and maximum leaf nodes (None, 5, or 10). A fixed random_state of 42 ensured reproducibility. The best configuration was defined as follows: criterion = entropy, splitter = best, max_depth = 5, min_samples_split = 2, min_samples_leaf = 1, num_features_split = none, and max_leaf_nodes = none. This setting provided a good balance between performance and interpretability while helping to prevent overfitting.
The feature selection process using the mRMR technique enabled the identification of the most relevant attributes for failure prediction while also removing low-impact variables such as air temperature and product type. This reduction was supported by the exploratory analysis results, which had indicated a low correlation of these variables with failure events, suggesting that their exclusion would not compromise predictive performance. Moreover, the data balancing strategy using SMOTE played a key role in increasing the representativeness of minority classes, ensuring that the DT model was trained in a fair manner. The results obtained from the application of the DT model showed strong performance in classifying failure data from the metal–mechanical industry, achieving an accuracy of 0.821 and a Kappa index of 0.785. These values reflect both a high prediction success rate and substantial agreement between the model’s predictions and the actual failure events, as shown in the confusion matrix presented in Figure 8. Furthermore, the Kappa index, by correcting accuracy for the probability of random successes, supports the consistency of the patterns identified by the rules generated by the tree. These results confirm the model’s ability to capture relevant operational characteristics, organizing them into clear and interpretable decision rules.
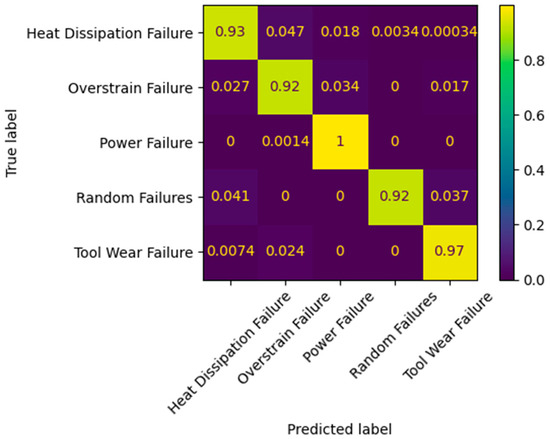
Figure 8.
The confusion matrix summarizing the performance of the DT in the predictions.
The rules generated by the DT model reveal critical operational patterns associated with different types of machine failures. Interpreting these rules enables the detection of specific conditions that precede failures, assisting in the creation of more effective predictive maintenance strategies. Below, the interpretations of main patterns related to each type of failure are presented, highlighting the corresponding rules that support these insights.
Heat dissipation failures are primarily identified when the process temperature (Proc_Temp) exceeds 309.80 K, tool wear (Tool_Wear) is below 186.50, and rotation speed (Rot_Speed) is less than 1378.50. The decision tree defines the following conditions:
- If process temperature exceeds 309.80 K and torque is less than or equal to 62.42, there is a high probability of heat dissipation failure (Rule: IF Tool_Wear ≤ 186.50 AND Rot_Speed ≤ 1378.50 AND Torque ≤ 62.42 AND Proc_Temp > 309.80 THEN class: Heat Dissipation Failure).
- If torque is less than or equal to 53.19 and process temperature is greater than 311.89 K, the failure is also classified as heat dissipation (Rule: IF Proc_Temp > 311.89 AND Torque ≤ 53.19 THEN class: Heat Dissipation Failure).
- Conversely, if torque exceeds 53.19 with process temperature above 311.89 K, the tree classifies the event as a random failure, indicating behavioral instability (Rule: IF Proc_Temp > 311.89 AND Torque > 53.19 THEN class: Random Failure).
This interpretation is consistent with the findings from DA, Section 4, which show that high temperatures at low rotation speeds are associated with an increased risk of thermal failure. The analysis underscores the importance of monitoring temperature and torque levels to mitigate these failures and improve process reliability.
Power failures are typically observed in two distinct scenarios. The first happens when the rotation speed is greater than 1378.50 rpm and the torque is less than 15.29. In these conditions, if the torque is even lower, below 13.50, the risk of failure increases in the following cases:
- If process temperature is less than or equal to 313.30 K, the condition is classified as a power failure (Rule: IF Rot_Speed > 1378.50 AND Torque ≤ 13.50 AND Proc_Temp ≤ 313.30 THEN class: Power Failure).
- If process temperature exceeds 313.30 K under the same configuration, the condition is classified as no failure (Rule: IF Rot_Speed > 1378.50 AND Torque ≤ 13.50 AND Proc_Temp > 313.30 THEN class: No Failure).
- Additionally, if the rotation speed exceeds 2328 rpm, the failure is classified as a power failure regardless of the torque value (Rule: IF Rot_Speed > 1378.50 AND Torque > 13.50 AND Rot_Speed > 2328.00 THEN class: Power Failure).
This behavior suggests that operation at high rotation speeds, combined with low torque levels, compromises the machines’ power-sustaining capacity, aligning with DA results, which identify elevated speeds as a significant risk factor for power failures. Thus, strategies for rotation control and energy quality verification should be considered to mitigate these events.
Random failures are associated with specific operating ranges identified by the decision tree: rotation speed between 1378.5 rpm and 1687.5 rpm and torque between 15.29 and 58.40. In these scenarios, instability in operational parameters leads to failures that do not follow a fixed pattern and are therefore classified as random failures (Rule: IF Rot_Speed > 1378.50 AND Torque > 15.29 AND Torque ≤ 58.40 AND Rot_Speed ≤ 1687.50 THEN class: Random Failures). Conversely, if the rotation speed exceeds 1687.50 under the same torque conditions, the decision tree classifies the event as no failure, indicating a safer operational zone (Rule: IF Rot_Speed > 1378.50 AND Torque > 15.29 AND Torque ≤ 58.40 AND Rot_Speed > 1687.50 THEN class: No Failure). This operational signature underscores the need for continuous monitoring within intermediate rotation ranges, as parameter fluctuations may lead to unpredictable, difficult-to-control failures.
Tool wear failures typically occur when the tool wear exceeds 186.50, the rotation speed is less than or equal to 1417.50, and torque is less than or equal to 40.53. The decision tree classifies these conditions as tool wear failure (Rule: IF Tool_Wear > 186.50 AND Tool_Wear ≤ 199.50 AND Rot_Speed ≤ 1417.50 AND Torque ≤ 40.53 THEN class: Tool Wear Failure). Additionally, if tool wear exceeds 199.50 and the process temperature is less than or equal to 310.38 K, the model confirms tool wear failure (Rule: IF Torque ≤ 48.01 AND Tool_Wear > 199.50 AND Rot_Speed ≤ 1375.50 AND Proc_Temp ≤ 310.38 THEN class: Tool Wear Failure). These scenarios show that increasing tool wear, when combined with low rotation speeds, intensifies the likelihood of operational failure. Predictive maintenance focused on tool wear helps prevent downtime and extend the lifespan of components.
Overstrain failures are observed when torque is greater than 48.01 and less than or equal to 58.91, rotation speed is less than or equal to 1334.50, and process temperature is less than or equal to 309.83 K. Under these conditions, the decision tree classifies the event as overstrain failure (Rule: IF Torque > 48.01 AND Torque ≤ 58.91 AND Rot_Speed ≤ 1334.50 AND Proc_Temp ≤ 309.83 THEN class: Overstrain Failure). Furthermore, the model indicates that when tool wear exceeds 237.50, the risk of overstrain becomes more pronounced, suggesting excessive mechanical stress on the machine’s structural components. The interpretation of these rules aligns with the DA exploratory analysis, which confirms that high torque loads at low rotation speeds considerably increase the risk of structural failure.
The rules generated by the DT provide an intuitive way to interpret the critical factors that precede each failure type. The logical representation of operational paths enables industrial managers to identify risk conditions in advance, allowing for timely operational adjustments and preventive interventions.
Such insights support the implementation of effective real-time monitoring, allowing operators to configure alarms that detect critical levels of temperature, torque, and rotation speed, thus preventing equipment from reaching failure-triggering conditions. Furthermore, they support targeted predictive maintenance by facilitating early interventions for machines operating within identified risk ranges, minimizing unexpected downtime and optimizing maintenance schedules. Additionally, these insights contribute to the optimization of operational parameters by establishing safe limits to prevent overload and excessive wear, thereby extending equipment lifespan. Finally, they support the prevention of overheating and overstrain by enabling the real-time adjustment of operating parameters, reducing mechanical stress, and enhancing the reliability and efficiency of industrial processes.
4. Discussion
This study applied DA and DM techniques to mitigate machine failures and support decision-making in a metalworking production environment—an area that remains underexplored in practice. As Chimunhu et al. [12] observe, computational approaches such as DA and DM have rarely been applied to production logistics, with most existing research limited to simulations or literature reviews. By clearly demonstrating a replicable machine failure analysis framework, the present study advances both theory and industrial application.
In the DA stage, the analysis revealed a strong correlation between air and process temperatures, while mRMR ranked process temperature as slightly more informative. This suggests that air temperature can be excluded from the predictive model without a significant loss of information. Prior studies have used clustering to estimate bearing lifespan [15], employed XGBoost for detecting vibration-related faults [16], and used deep forest and gradient boosting models to forecast machine failures with over 90% accuracy [18,19], while other authors have addressed machine instability through computational solutions [17]. Building on these foundations, the proposed framework uses DA to uncover initial patterns and guide the DM process, yielding robust predictive models that enhance reliability, reduce costs, extend equipment life, and improve process predictability, supporting Industry 4.0 and Maintenance 4.0 principles.
The robust and accurate results achieved during the DM stage are largely attributed to the effective application of DA and preprocessing. These stages not only enhance the quality of the input data by identifying critical features, eliminating inconsistencies, and addressing class imbalances but also provide valuable insights into data patterns and correlations. As a result, the predictive DT model becomes more reliable and interpretable, enabling the identification of failure patterns with greater precision and supporting informed decision-making in industrial environments.
To identify the most relevant variables for failure prediction, we applied the mRMR during the preprocessing stage, as reported in [21], ensuring that the input data fed into the model were both informative and efficient. Subsequently, the DT model itself contributed to the interpretation of feature importance by ranking the selected attributes based on their role in data classification. This ranking is inherently defined by the tree structure, in which attributes used closer to the root node have a greater influence on the model’s decision-making process. In our study, the DT assigned the following order of importance to the features—based on their respective weights: torque (0.4284), tool wear (0.3427), rotation speed (0.1909), and process temperature (0.0380). These weights quantify each attribute’s contribution to the classification process and served as the basis for their prioritization. Together, mRMR and the DT provided a robust approach to identifying and interpreting the key factors associated with machine failures.
The choice of DT over more complex models such as Artificial Neural Networks or Support Vector Machines is justified by its simplicity, and low computational cost. Regarding computational complexity, the CART algorithm used in this study can be analyzed in terms of both training and inference. During the training phase, the algorithm evaluates potential splits across all features to maximize information gain, resulting in a computational complexity of approximately O(n · d · log n), where n is the number of instances and d is the number of attributes. This cost arises from sorting operations and iterative evaluations performed at each node. During the inference phase, the computational complexity is considerably lower, approximately O(h), where h denotes the depth of the tree. Since decision trees typically have shallow depths, especially in our study where the maximum depth is limited to five levels, inference remains computationally efficient.
Furthermore, the simplicity and interpretability of decision trees [24], along with low inference cost, make this technique suitable for real-time predictive maintenance applications in industrial settings. This characteristic enables operators and managers to clearly understand which factors influence the occurrence of failures and identify critical combinations of variables that increase the risk of undesirable events.
In the context of predictive maintenance 4.0, this study recommends the following: (i) implementing real-time monitoring systems—as suggested by [25,26]—that leverage DA and DM to track multiple critical parameters concurrently and trigger alerts for each distinct failure signature; (ii) defining safe operating zones by setting multidimensional limits to prevent prolonged operation under high-risk parameter combinations; (iii) developing targeted preventive strategies—such as auxiliary cooling systems that activate when elevated temperature, increased torque, and reduced speed coincide (for thermal failures), and power-quality monitoring with backup systems (for power failures); (iv) integrating predictive models into computerized maintenance management systems to automatically generate preventive work orders upon the detection of risk patterns; and (v) establishing a continuous feedback loop by feeding new failure data and records of successful interventions back into the models to refine their accuracy over time.
Although a formal sensitivity analysis was not conducted in this study, future work could explore how small perturbations in the input variables affect the model’s predictions. By varying one or more parameters within realistic operational ranges, it would be possible to assess the robustness and stability of the decision rules derived from the model. This type of analysis could provide valuable insights for identifying critical thresholds, refining preventive strategies, and defining safe operating margins.
5. Conclusions
This work presented a framework combining DA and DM for machine failure mitigation and supporting decision-making in the metal–mechanical industry. During the DA stage, exploratory analysis highlighted significant correlations between key variables, such as process temperature, rotation speed, and torque, with specific types of failures, particularly heat dissipation failures and power failures. The analysis revealed that failures follow predictable patterns associated with specific combinations of operational parameters. Heat dissipation failures occur under conditions of high temperature, low rotation speed, and high torque. In contrast, power failures present a distinct profile, characterized by significantly higher rotation speeds. Moreover, each type of failure exhibits a unique multivariate signature that can be detected in advance, allowing for more precise monitoring and preventive actions. These insights were further validated by the DT, which not only mapped these relationships into clear decision rules but also provided a high level of explainability. The explicit representation of decision paths allows operators and managers to intuitively understand the critical conditions that lead to failures, supporting more effective preventive actions. This consistency between the exploratory analysis and the DT model reinforces the reliability of the proposed framework.
Although the data used in this study may not represent all situations encountered in various industrial contexts—which can be seen as a limitation of this study—the proposed framework demonstrates its continued relevance, particularly for the metal–mechanical industry, serving as a structured guide for analyzing machine failure data. It became evident that the integration of DA, rigorous preprocessing, and DM using DT allows for the identification of critical conditions and the anticipation of failures in a precise and interpretable manner. More than an isolated solution, the framework clearly guides how to analyze both operational and logistical data and transform this knowledge into actionable rules that can support strategic decisions aimed at optimizing material, human, and financial resources in the metal–mechanical industry. This promotes reliability, cost reduction, and productivity, contributing to more resilient and efficient industrial processes, aligning with the principles of Predictive Maintenance 4.0, and strengthening decision-making. It is recommended to initiate a pilot implementation on a critical production line, with a careful documentation of outcomes to build a robust business case for broader deployment. This evidence-based approach will position the organization at the forefront of operational excellence, converting analytical insights into tangible value and sustainable competitive advantage.
Future research should explore the application of the proposed framework in different industrial contexts to validate its adaptability and robustness across diverse manufacturing environments. Expanding the analysis to include more complex machine learning models—such as ensemble methods—and exploring sensitivity analyses is recommended to better assess the robustness, interpretability, and scalability of the proposed framework.
Author Contributions
Conceptualization, G.C.d.O.N., S.A.d.A. and U.I.; methodology, G.C.d.O.N. and S.A.d.A.; software, S.L.B. and S.A.d.A.; validation G.C.d.O.N., S.R.L., D.T.B. and S.A.d.A.; formal analysis, S.L.B., G.C.d.O.N. and S.A.d.A.; investigation, G.C.d.O.N. and S.A.d.A.; resources, G.C.d.O.N. and S.R.L.; data curation, G.C.d.O.N. and S.A.d.A.; writing—original draft preparation, G.C.d.O.N. and S.A.d.A.; writing—review and editing, G.C.d.O.N., D.T.B. and S.A.d.A.; visualization, S.L.B., G.C.d.O.N. and S.A.d.A.; supervision, G.C.d.O.N. and S.A.d.A.; project administration, G.C.d.O.N. and S.R.L.; funding acquisition, G.C.d.O.N. All authors have read and agreed to the published version of the manuscript.
Funding
The authors are grateful to FUNDAÇÃO DE DESENVOLVIMENTO DA PESQUISA—FUNDEP (Number: 27194.C+NE.01/2024.12-00).
Data Availability Statement
The dataset used in this research was collected from UCI Machine Learning Repository, available at https://archive.ics.uci.edu/dataset/601/ai4i+2020+predictive+maintenance+dataset. (accessed on 25 May 2025). Python scripts developed in this research can be made available upon request to the authors.
Acknowledgments
The authors also gratefully acknowledge the Conselho Nacional de Desenvolvimento Científico e Tecnológico (CNPq) for Research Productivity Grant PQ-2 (Process 305950/2023-1) and the Universidade Federal do ABC for their continued support.
Conflicts of Interest
The authors declare no known competing financial interests or personal relationships that could have influenced the work reported in this paper.
Abbreviations
The following abbreviations are used in this manuscript:
| CART | Classification and Regression Tree |
| DA | Data Analytics |
| DM | Data Mining |
| DT | Decision Tree |
| mRMR | Minimum Redundancy–Maximum Relevance |
| SMOTE | Synthetic Minority Over-Sampling Technique |
References
- Jha, A.K.; Agi, M.A.N.; Ngai, E.W.T. A note on big data analytics capability development in supply chain. Decis. Support Syst. 2020, 138, 113382. [Google Scholar] [CrossRef]
- Awan, U.; Shamim, S.; Khan, Z.; Zia, N.U.; Shariq, S.M.; Khan, M.N. Big data analytics capability and decision-making: The role of data-driven insight on circular economy performance. Technol. Forecast. Soc. Change 2021, 168, 120766. [Google Scholar] [CrossRef]
- Tabesh, P. Who’s making the decisions? How managers can harness artificial intelligence and remain in charge. J. Bus. Strategy 2022, 43, 373–380. [Google Scholar] [CrossRef]
- Prashar, A. Production planning and control in industry 4.0 environment: A morphological analysis of literature and research agenda. J. Intell. Manuf. 2022, 34, 2513–2528. [Google Scholar] [CrossRef]
- Büttner, K.; Antons, O.; Arlinghaus, J.C. Applied Machine Learning for Production Planning and Control: Overview and Potentials. IFAC-PapersOnLine 2022, 55, 2629–2634. [Google Scholar] [CrossRef]
- Medeiros, G.H.A.; Cao, Q.; Zanni-Merk, C.; Samet, A. Manufacturing as a Service in Industry 4.0: A Multi-Objective Optimization Approach. In Intelligent Decision Technologies. IDT 2020. Smart Innovation, Systems and Technologies; Czarnowski, I., Howlett, R., Jain, L., Eds.; Springer: Singapore, 2020; Volume 193. [Google Scholar] [CrossRef]
- Cañas, H.; Mula, J.; Campuzano-Bolarín, F.; Poler, R. A conceptual framework for smart production planning and control in Industry 4.0. Comput. Ind. Eng. 2022, 173, 108659. [Google Scholar] [CrossRef]
- Romsdal, A.; Sgarbossa, F.; Rahmani, M.; Oluyisola, O.; Strandhagen, J.O. Smart production planning and control: Do all planning environments need to be smart? IFAC-PapersOnLine 2021, 54, 355–360. [Google Scholar] [CrossRef]
- Oluyisola, O.E.; Bhalla, S.; Sgarbossa, F.; Strandhagen, J.O. Designing and developing smart production planning and control systems in the Industry 4.0 era: A methodology and case study. J. Intell. Manuf. 2022, 33, 311–332. [Google Scholar] [CrossRef]
- Colangelo, E.; Fries, C.; Hinrichsen, T.F.; Szaller, Á.; Nick, G. Maturity Model for AI in Smart Production Planning and Control System. Procedia CIRP 2022, 107, 493–498. [Google Scholar] [CrossRef]
- Padovano, A.; Longo, F.; Nicoletti, L.; Gazzaneo, L.; Chiurco, A.; Talarico, S.A. Prescriptive maintenance system for intelligent production planning and control in a smart cyber-physical production line. Procedia CIRP 2021, 104, 1819–1824. [Google Scholar] [CrossRef]
- Chimunhu, P.; Topal, E.; Ajak, A.D.; Asad, W. A review of machine learning applications for underground mine planning and scheduling. Resour. Policy 2022, 77, 102693. [Google Scholar] [CrossRef]
- Harjunkoski, I.; Ikonen, T.; Mostafaei, H.; Deneke, T.; Heljanko, K. Synergistic and intelligent process optimization: First results and open challenges. Ind. Eng. Chem. Res. 2020, 59, 16684–16694. [Google Scholar] [CrossRef]
- Morariu, C.; Morariu, O.; Răileanu, S.; Borangiu, T. Machine learning for predictive scheduling and resource allocation in large scale manufacturing systems. Comput. Ind. 2020, 120, 103244. [Google Scholar] [CrossRef]
- Sharanya, S.; Venkataraman, R.; Murali, G. Estimation of remaining useful life of bearings using reduced affinity propagated clustering. J. Eng. Sci. Technol. 2021, 16, 3737–3756. [Google Scholar]
- Salem, K.; AbdelGwad, E.; Kouta, H. Predicting forced blower failures using machine learning algorithms and vibration data for effective maintenance strategies. J. Fail. Anal. Prev. 2023, 23, 2191–2203. [Google Scholar] [CrossRef]
- Surantha, N.; Gozali, I.D. Evaluation of the improved extreme learning machine for machine failure multiclass classification. Electronics 2023, 12, 3501. [Google Scholar] [CrossRef]
- Shahin, M.; Chen, F.F.; Hosseinzadeh, A.; Zand, N. Using machine learning and deep learning algorithms for downtime minimization in manufacturing systems: An early failure detection diagnostic service. Int. J. Adv. Manuf. Technol. 2023, 128, 3857–3883. [Google Scholar] [CrossRef]
- Hosseinzadeh, A.; Chen, F.F.; Shahin, M.; Bouzary, H. A predictive maintenance approach in manufacturing systems via AI-based early failure detection. Manuf. Lett. 2023, 35, 1179–1186. [Google Scholar] [CrossRef]
- Matzka, S. Explainable artificial intelligence for predictive maintenance applications. In Proceedings of the 2020 Third International Conference on Artificial Intelligence for Industries (ai4i), Irvine, CA, USA, 21–23 September 2020; IEEE: New York, NY, USA, 2020; pp. 69–74. [Google Scholar] [CrossRef]
- Bezerra, F.E.; Neto, G.C.d.O.; Cervi, G.M.; Mazetto, R.F.; de Faria, A.M.; Vido, M.; Lima, G.A.; de Araújo, S.A.; Sampaio, M.; Amorim, M. Impacts of feature selection on predicting machine failures by machine learning algorithms. Appl. Sci. 2024, 14, 3337. [Google Scholar] [CrossRef]
- Mitchell, T.M.; Mitchell, T.M. Machine Learning; McGraw-Hill: New York, NY, USA, 1997; Volume 1, No. 9. [Google Scholar]
- McHugh, M.L. Interrater reliability: The kappa statistic. Biochem. Medica 2012, 22, 276–282. [Google Scholar] [CrossRef]
- de Araújo, S.A.; de Barros, D.F.; da Silva, E.M.; Cardoso, M.V. Applying computational intelligence techniques to improve the decision making of business game players. Soft Comput. 2019, 23, 8753–8763. [Google Scholar] [CrossRef]
- Ahatsi, E.; Olanrewaju, O.A. Enhancing Humanitarian Supply Chain Resilience: Evaluating Artificial Intelligence and Big Data Analytics in Two Nations. Logistics 2025, 9, 64. [Google Scholar] [CrossRef]
- Rezig, S.; Turki, S.; Chakroun, A.; Rezg, N. Optimal Strategy of Unreliable Flexible Production System Using Information System. Logistics 2024, 8, 62. [Google Scholar] [CrossRef]
Disclaimer/Publisher’s Note: The statements, opinions and data contained in all publications are solely those of the individual author(s) and contributor(s) and not of MDPI and/or the editor(s). MDPI and/or the editor(s) disclaim responsibility for any injury to people or property resulting from any ideas, methods, instructions or products referred to in the content. |
© 2025 by the authors. Licensee MDPI, Basel, Switzerland. This article is an open access article distributed under the terms and conditions of the Creative Commons Attribution (CC BY) license (https://creativecommons.org/licenses/by/4.0/).