1. Introduction
In order to achieve efficient business performance, it is primarily necessary to ensure a balance between the needs, requirements, and expectations of the users of a particular service. It is necessary to make constant measurements and strive to determine the planned set of values that need to be achieved. Logistics, which provide answers to efficiency and optimization issues, taking into account the indicators that most influence rationalization, play a very important role in all this. The rationalization of logistics activities and processes, according to Stević et al. [
1], is of utmost importance in the functioning and the fulfillment of the set goals of every company. This is also confirmed in the study [
2] that emphasizes that the rationalization of primary logistics subsystems plays a key role in achieving the efficiency and effectiveness of companies.
On the one hand, the transport subsystem of logistics represents the largest percentage of logistic costs, while on the other hand, it enables achieving the purpose and objectives of logistics, as it affects the economic system of every country. In order to rationalize the logistic costs incurred by performing various transport activities, good management that will define adequate strategies is required. Micro, small, and medium-sized enterprises are suitable and interesting when considering the adoption of strategies for business process management. In this regard, human resource evaluation is important since it influences defining business processes and structuring that, according to Dobrosavljević and Urošević [
3], influence the development of business activities of organizations as well as represents a starting point on the path to establishing an organization for mature processes. According to Gürbüz and Albayrak [
4], human performance evaluation is one of the most important areas for analyzing the continuity of an enterprise.
When it comes to developing countries, companies have recognized and accepted the importance of logistics and have begun to pay more attention to this area over the last few years. This is especially important for transport companies, as it is necessary to take into account the fleet structure, human resources, and managers in the subsystems. Thus, there is a need for timely and high-quality decision-making that positively affects the efficiency of transport companies, since they occur with the role of a logistics provider obliged to ensure the required quality of service at the lowest possible cost. The fulfillment of the above is dependent on the age of the fleet, drivers who operate the vehicles, and decision-makers. In companies that provide logistic services, as is the case in this paper, a large share of costs is fuel consumption influenced by drivers knowingly or unknowingly. One way to reduce fuel consumption is to introduce a reward system for drivers who achieve the best results in terms of fuel consumption.
In this paper, a study has been conducted at a company primarily engaged in international transport. It is noted that there are significant differences in fuel consumption depending on drivers individually, even referring to the same transport routes. Therefore, a driver evaluation model has been created in this study. The most important goal in this paper is the formation of a new model that should be used for the human resource management in a transport company in order to minimize costs and increase productivity. The model involves constant driver performance evaluation and most often, on a monthly basis, the introduction of additional financial reword in order to increase drivers’ motivation. The second goal is the integration of the new MCDM model, which includes The Full Consistency Method (FUCOM) and Measurement Alternatives and Ranking according to Compromise Solution (MARCOS) methods, both developed by the first author of this study.
The proper evaluation and selection of personnel in logistics is a very important factor for optimization, since according to Klumpp and Abidi [
5], one of the most important tasks in logistics in the future is the selection of employees in accordance with their competence and level of knowledge. Chang [
6] created an integrated MCDM model for evaluating employees in a logistics company based on four criteria: potential for the future, corporate business achievement, organizational commitment, and working ability. In the paper [
7], various investment strategies in the field of human resources in a logistics company have been evaluated using system dynamics modeling. The research has also examined the impact of employees on the logistics performance index. Kampf and Ližbetinová [
8] used the AHP method in their research to identify talents in logistics since they saw it as a way to increase competitiveness. The goal is that after identifying such human resources, they bring new values to the company. Similar research was carried out in [
9,
10,
11], where it was observed that the results obtained could serve as a reference for companies and provide long-term development strategies. Kucharčíková and Mičiak [
12] carried out research in the field of logistic distribution and explained how human resources and investment in that area could contribute to improving the enterprise’s own performance and increase its competitiveness in the market. The aim of creating such models, according to Yue [
13], is to understand the degree of correspondence between the demands of the workplace and the employees in those workplaces, as well as the opportunity to obtain a clearer picture of human resources in a logistics company.
After the introductory part presenting the significance of the research, motives for its realization, goals, and a brief review of the situation in the field, the paper is divided into the following sections. The second section presents the methods used in this study and their steps: FUCOM and MARCOS. The third section is a case study that involves the evaluation of driver performance. A sensitivity analysis through the comparison of the applied model with other methods, and calculation of Spearman’s correlation coefficient (SCC) is provided in the fourth section. In addition, the obtained results are discussed and compared with other methods in this section. The fifth section includes the conclusion with the contributions of the study and directions for future research.
3. Case Study
The research was carried out at an international transport company. Due to the high criteria and professional attitude of the analyzed transport company, the fleet consists of the most modern transport units that today’s market has to offer. Such a fleet structure results in low maintenance costs since the vehicles are extremely young, lower toll costs due to cheaper tariffs for vehicles with the highest Euro standards, and lower costs of consumables such as oil, petroleum, and AdBlue. Due to the large number of clients of this company, besides trucks, this company possesses the most modern and extremely young trailers for goods that require transport under tarpaulin or thermal mode, semi-trailers equipped for ADR shipments, as well as semi-trailers intended for the transport of working machines with the ability to move poles for their easier loading or unloading. Despite these advantages, segmentation and diagnostics of the whole system have been performed in order to identify potential structures for improvement.
Throughout the detailed research within the company, improvement activities have been defined for each subsystem. In order to create a set of actions to improve the logistics performance of the company, human resource management has been identified as a potential part of the business performance that can be significantly improved. It should be emphasized that currently, there is quite a good system of employee motivation. However, the management of human resources, i.e., drivers of freight road vehicles, is a potential area for increasing the efficiency of the company since the adequate performance of the transport service is practically most dependent on their engagement. It has been found that there is a need to evaluate the performance of drivers periodically and to reward two to three best drivers on a monthly basis. In accordance with that, it may be noted that there is a need to develop such an integrated multi-criteria approach.
3.1. Forming a Multi-Criteria Decision-Making Model
In order to evaluate the performance of drivers adequately and to solve problems, the criteria for human resource evaluation have been defined. The established set of criteria consists of a combination of quantitative and qualitative criteria, and there are five criteria in total. List of criteria for evaluation has adopted in cooperation with manager in the company according to their needs. The first criterion (C1) is fuel consumption, which is expressed in liters per 100 km. The criterion belongs to the cost group and it should be minimized. It also belongs to the group of quantitative criteria. This information is available from the database maintained on a daily basis for each vehicle, for each driver and for kilometers traveled. The second criterion (C2) is damage per kilometer and is reflected in the monetary expression of the damage to the vehicle caused by the driver’s carelessness and negligent behavior. The criterion covers all damages regardless of the amount of damage and it is of quantitative and cost type. The third, fourth, and fifth criteria need to be maximized and they are of a qualitative type, i.e., they are determined on a basis of linguistic scale. The third criterion (C3) refers to the adequacy of vehicle maintenance by drivers, which is periodically controlled by the manager. The fourth criterion (C4) refers to the driver’s ability to provide information timely and adequately. This criterion primarily refers to the driver’s ability to communicate adequately and timely with a dispatcher. This is very important in certain unforeseen circumstances, which are relatively common situations in a transport process. The fifth criterion (C5) is loyalty, which means performing all the obligations without complaint and therefore the flexibility of drivers to perform the tasks.
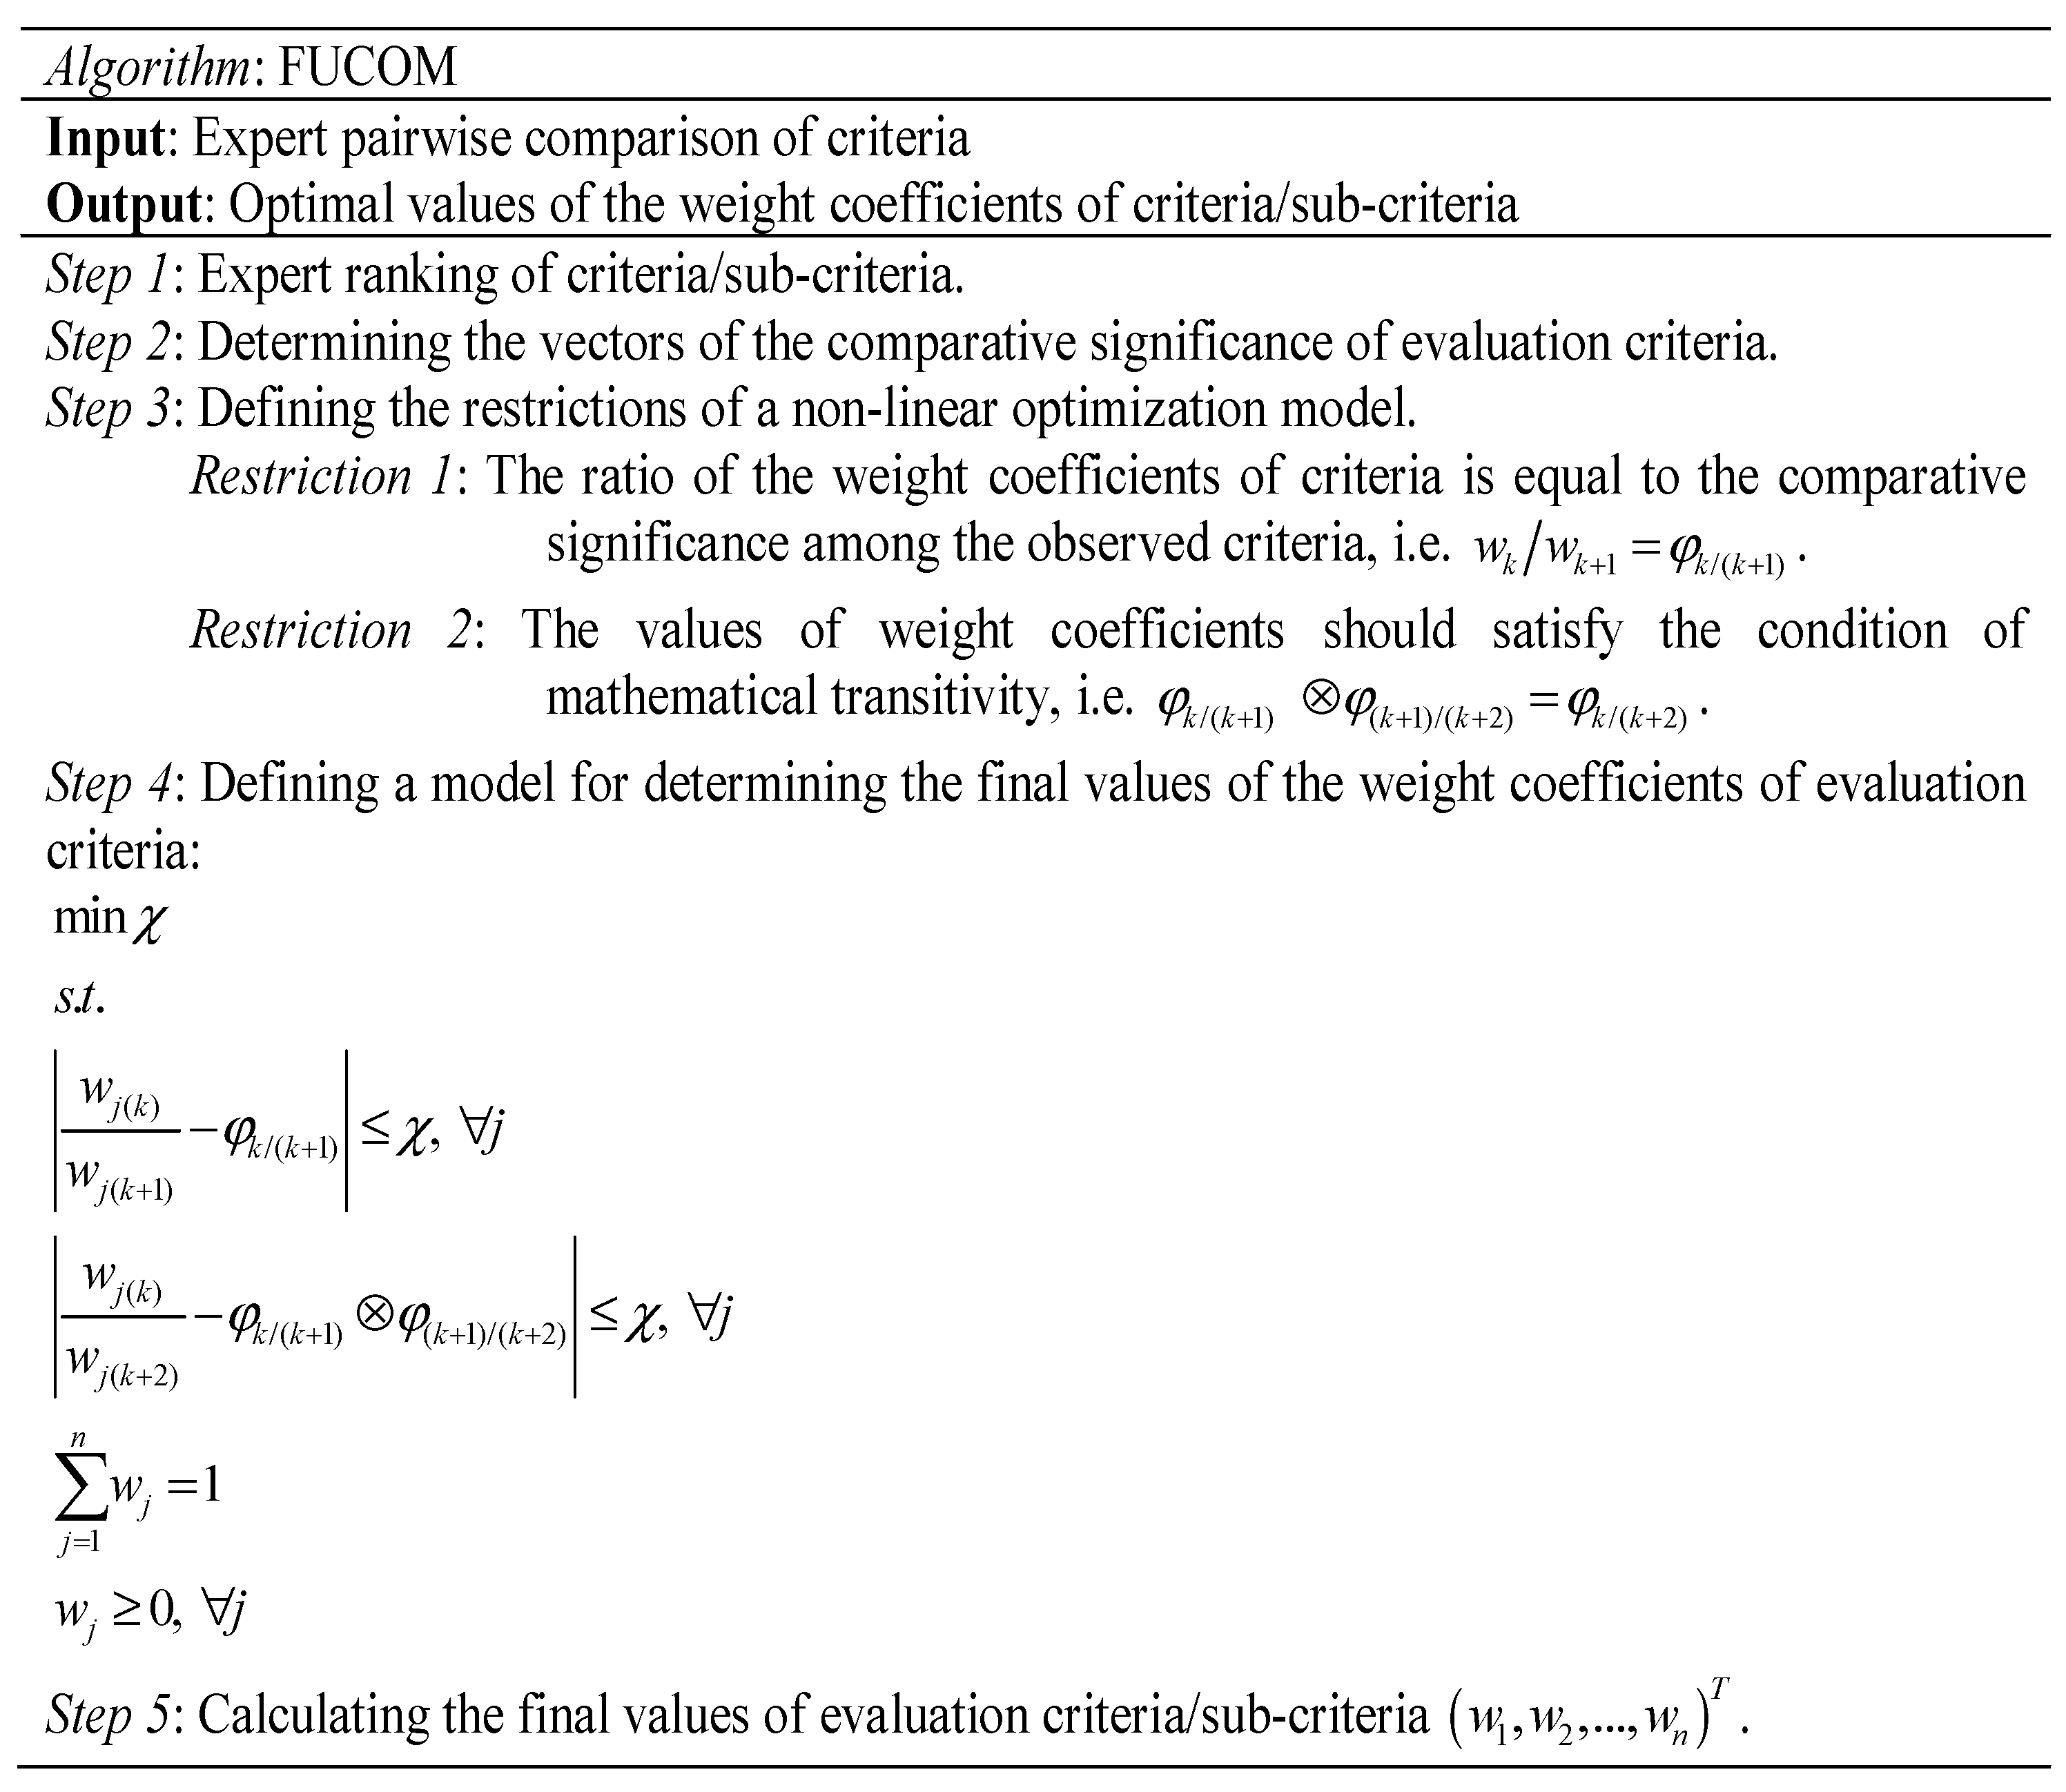
3.2. Determining the Weights of Criteria Using the FUCOM Method
In order to be able to evaluate the performance of drivers, it is necessary to determine the significance of the criteria first. For this purpose, the FUCOM method is applied. In the first step, the ranking of criteria according to the real needs of the company, i.e., C1 > C2 > C4 > C3 > C5 is determined. Subsequently, based on the preference of decision-makers who made it by consensus, the criteria are compared by applying the scale 1–9, which is shown in
Table 1.
The procedure for determining the significance of the criteria is as follows:
First, the comparative priority of the criteria is determined:
In the next step, the final values of the weight coefficients are calculated, and they should meet the two conditions:
Condition (1):
and Condition (2):
The final model from which the final criteria values are obtained is presented:
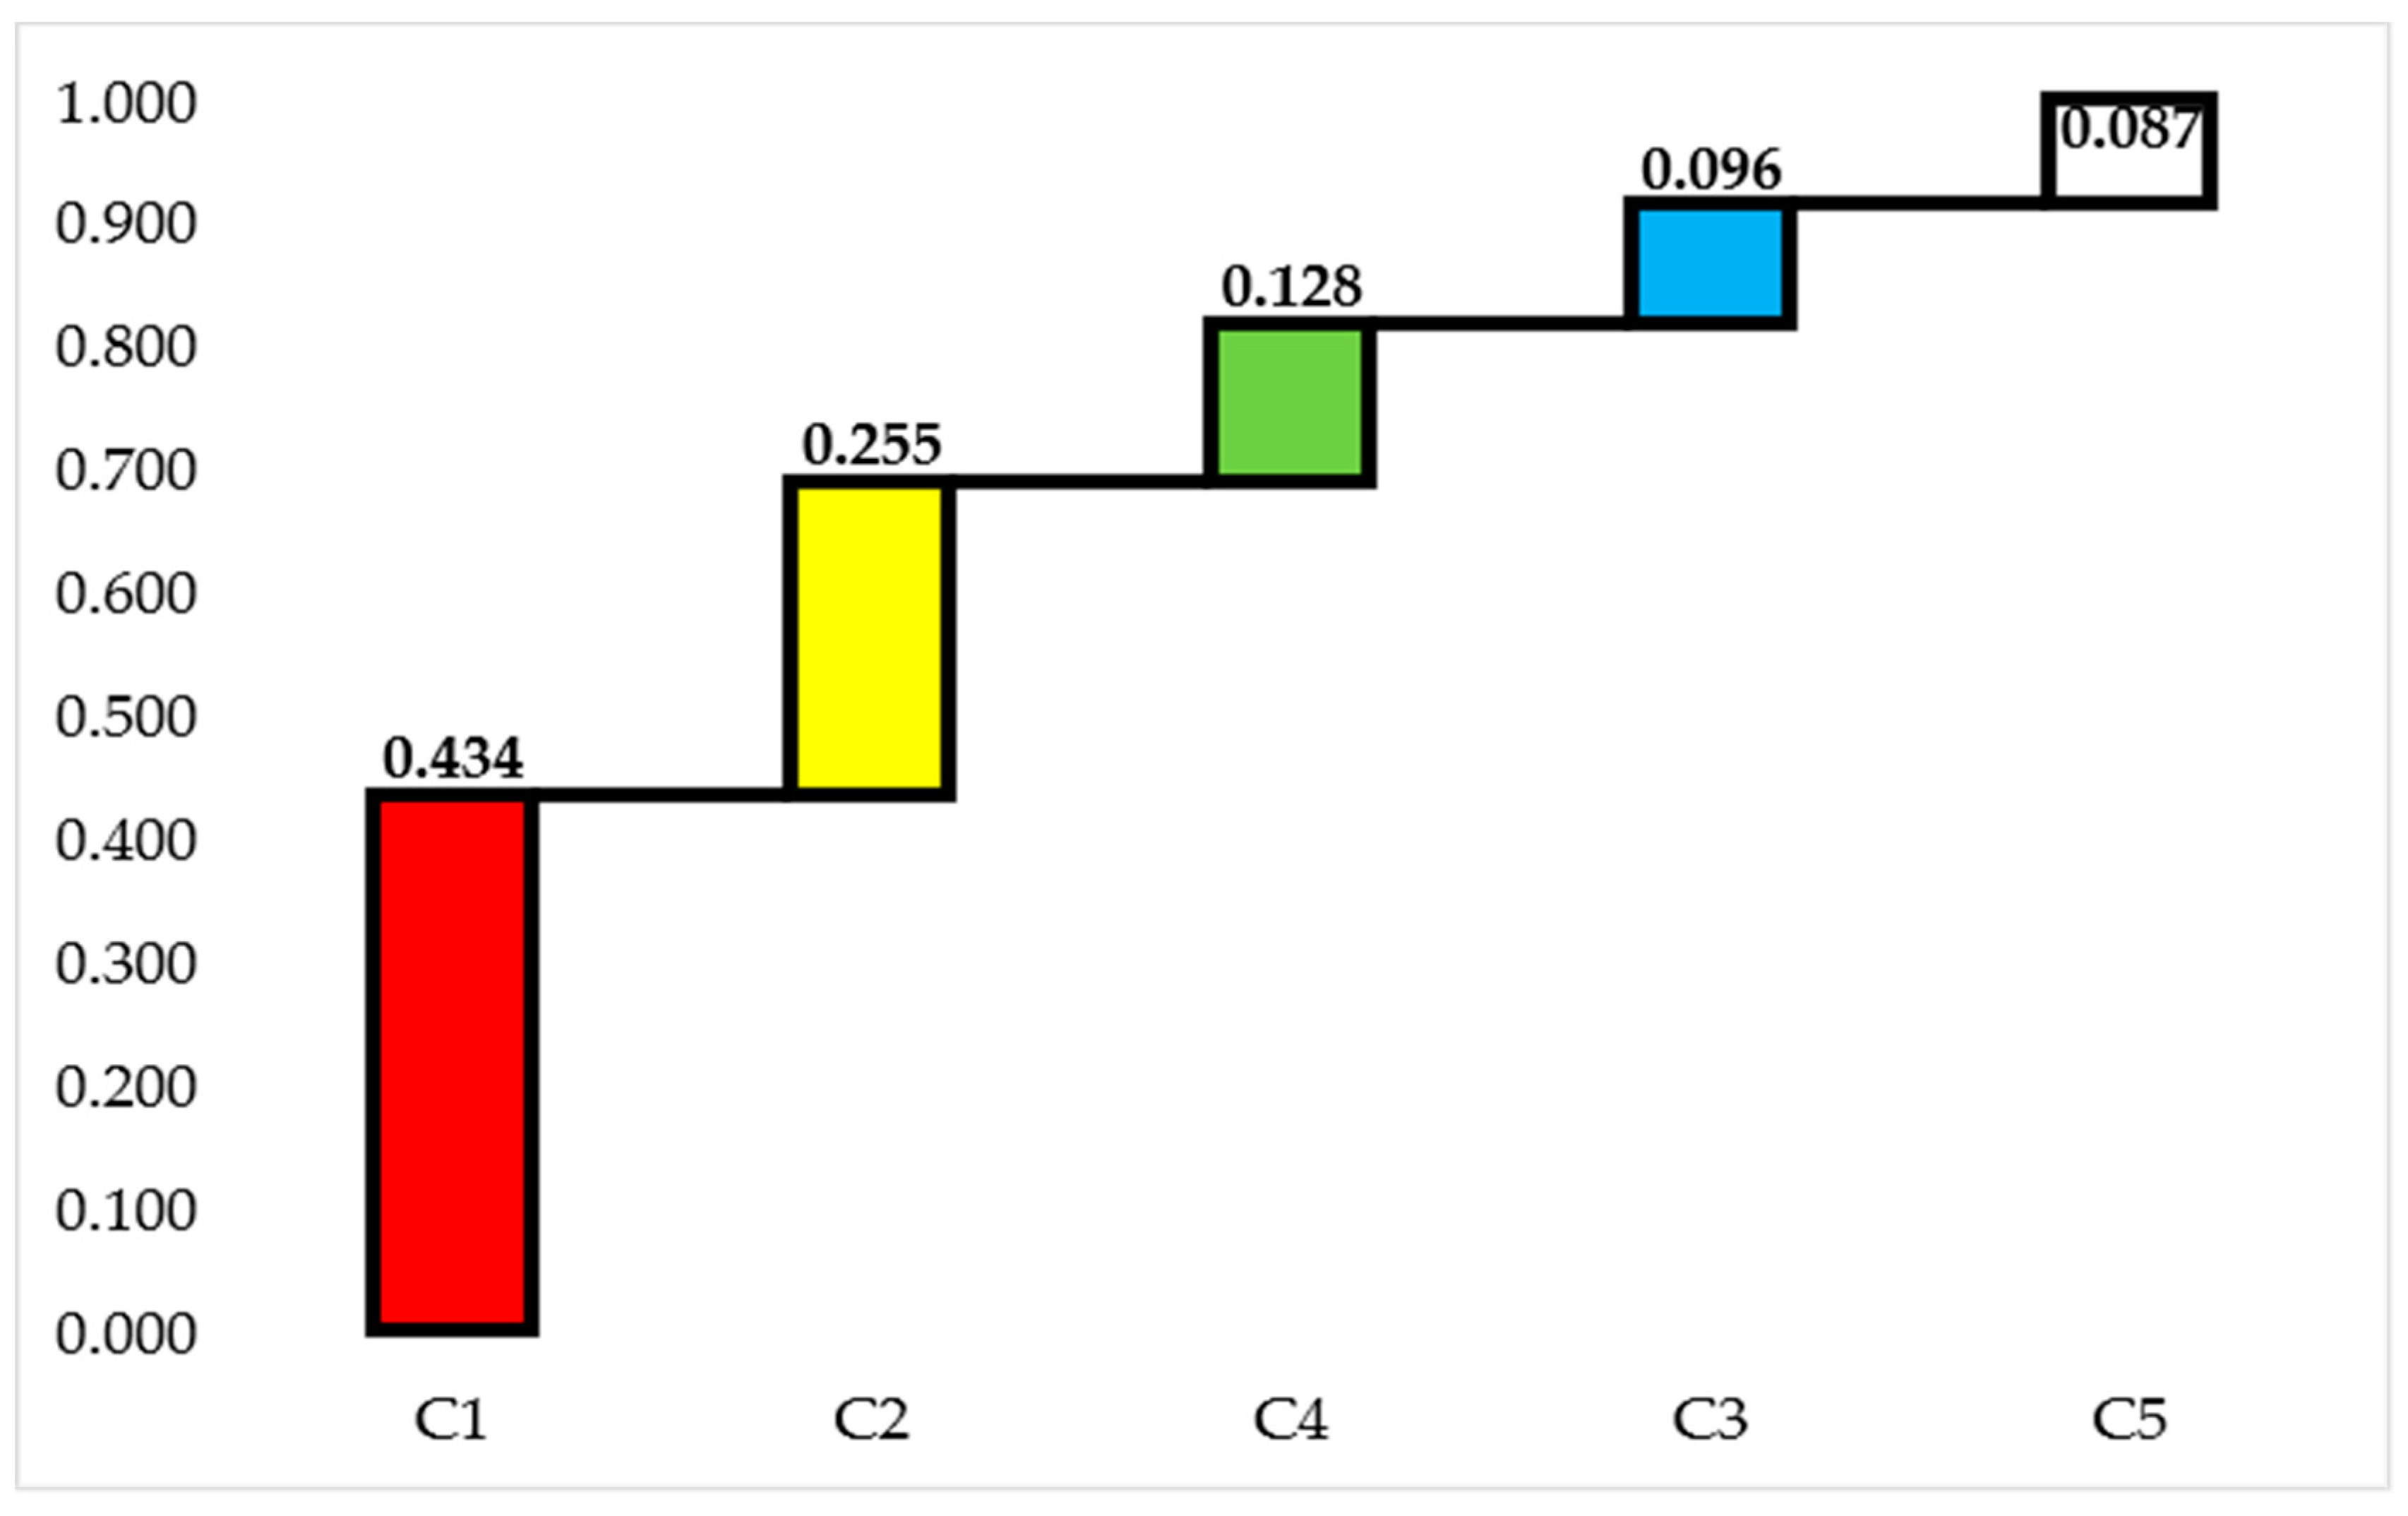
Subsequently, using the Lingo software (17 version), the following model is obtained with the weights of the criteria shown in
Figure 2.
As can be seen in
Figure 2, the most important is the first criterion, fuel consumption, with a value of 0.434, which is understandable since the most important improvements in savings are expected from this criterion. This is followed by the second, cost criterion, that relates to the damage caused and has a value of 0.128. The other three criteria, which are of a qualitative type, have much less values than the first two and therefore much less significance.
3.3. Evaluation of Human Resources Using the MARCOS Method
The initial matrix, which has been extended in accordance with the second step of the MARCOS method, i.e., Equations (1)–(3), is shown in
Table 2. The first and second criteria are of cost type and according to Equation (2), the anti-ideal solution (
AAI) is the highest characteristic, which is 35.7 for the first and 0.100 for the second criterion. For the third, fourth, and fifth criteria, the least values of 5, 5 and 3, respectively, are included in the
AAI solution. Applying Equation (3), the values included into the ideal solution (
AI) are determined. For the cost criteria, those are the smallest values of 25.8 and 0.001, while for the benefit criteria, the highest values are included in
AI, which is a value of 9 for all the criteria. It is important to note that a value of 0.001 in the extended initial matrix indicates that the drivers did not make any damage, but that indicator is used for the purpose of calculation and to avoid a value of zero.
After expanding the initial matrix, normalization should be performed by applying Equation (4) for cost and Equation (5) for benefit criteria. An example of the normalization shown in
Table 3 is as follows:
The next step is to calculate the weighted normalized matrix by multiplying the previous normalized matrix by the values of the criteria obtained using the FUCOM method. The weighted normalized matrix is shown in
Table 4.
Applying Equations (7)–(12), the final results, which are shown in
Table 5, are obtained using the MARCOS method. The results are obtained as follows:
By applying Equation (9), all the values (by rows) for alternatives are summarized as follows:
Similarly, the values for the remaining alternatives are obtained.
By applying Equation (7), the utility degrees in relation to the anti-ideal solution are calculated. The example of calculation is:
while using Equation (8), the utility degrees in relation to the ideal solution are obtained, e.g.,:
The utility function in terms of the anti-ideal solution is obtained using Equation (11) as follows:
while the utility function in terms of the ideal solution is obtained using Equation (12) as follows:
Finally, the utility function of Alternative A1 is obtained by applying Equation (10):
Other values shown in the final results (
Table 5) are obtained in the same way.
According to the results obtained using the integrated FUCOM-MARCOS model, the alternative, i.e., the driver under code 8, represents an employee with the best performance for the month of October when the evaluation was performed. Furthermore, drivers under the numbers 19 and 18 represent employees who occupy the second and third place, respectively, in overall ranking. According to the goals of the model created, the top three drivers will be rewarded depending on the resources created by their improved driving behavior and by certain savings. When looking further at the rankings, it is important to emphasize that there is a very small difference from the third to the sixth position and a change in ranking can be expected in the next evaluation period, depending on the drivers themselves. It is also important to note that in such a created model, only the manager in the company knows the code of drivers and each driver for themselves. This is formed in such a way as to avoid any possible turmoil among drivers, which could have adverse effects.
4. Sensitivity Analysis and Discussion
In this section, previously obtained results are compared using other MCDM methods: Simple Additive Weighting (SAW) [
20], Additive Ratio Assessment (ARAS) [
21], Weighted Aggregated Sum Product Assessment (WASPAS) [
22], Evaluation based on Distance from Average Solution (EDAS) [
23], Combined Compromise Solution (CoCoSo) [
24], Multi-Attributive Border Approximation area Comparison (MABAC) [
25], and Technique for Order Preference by Similarity Ideal Solution (TOPSIS) [
26].
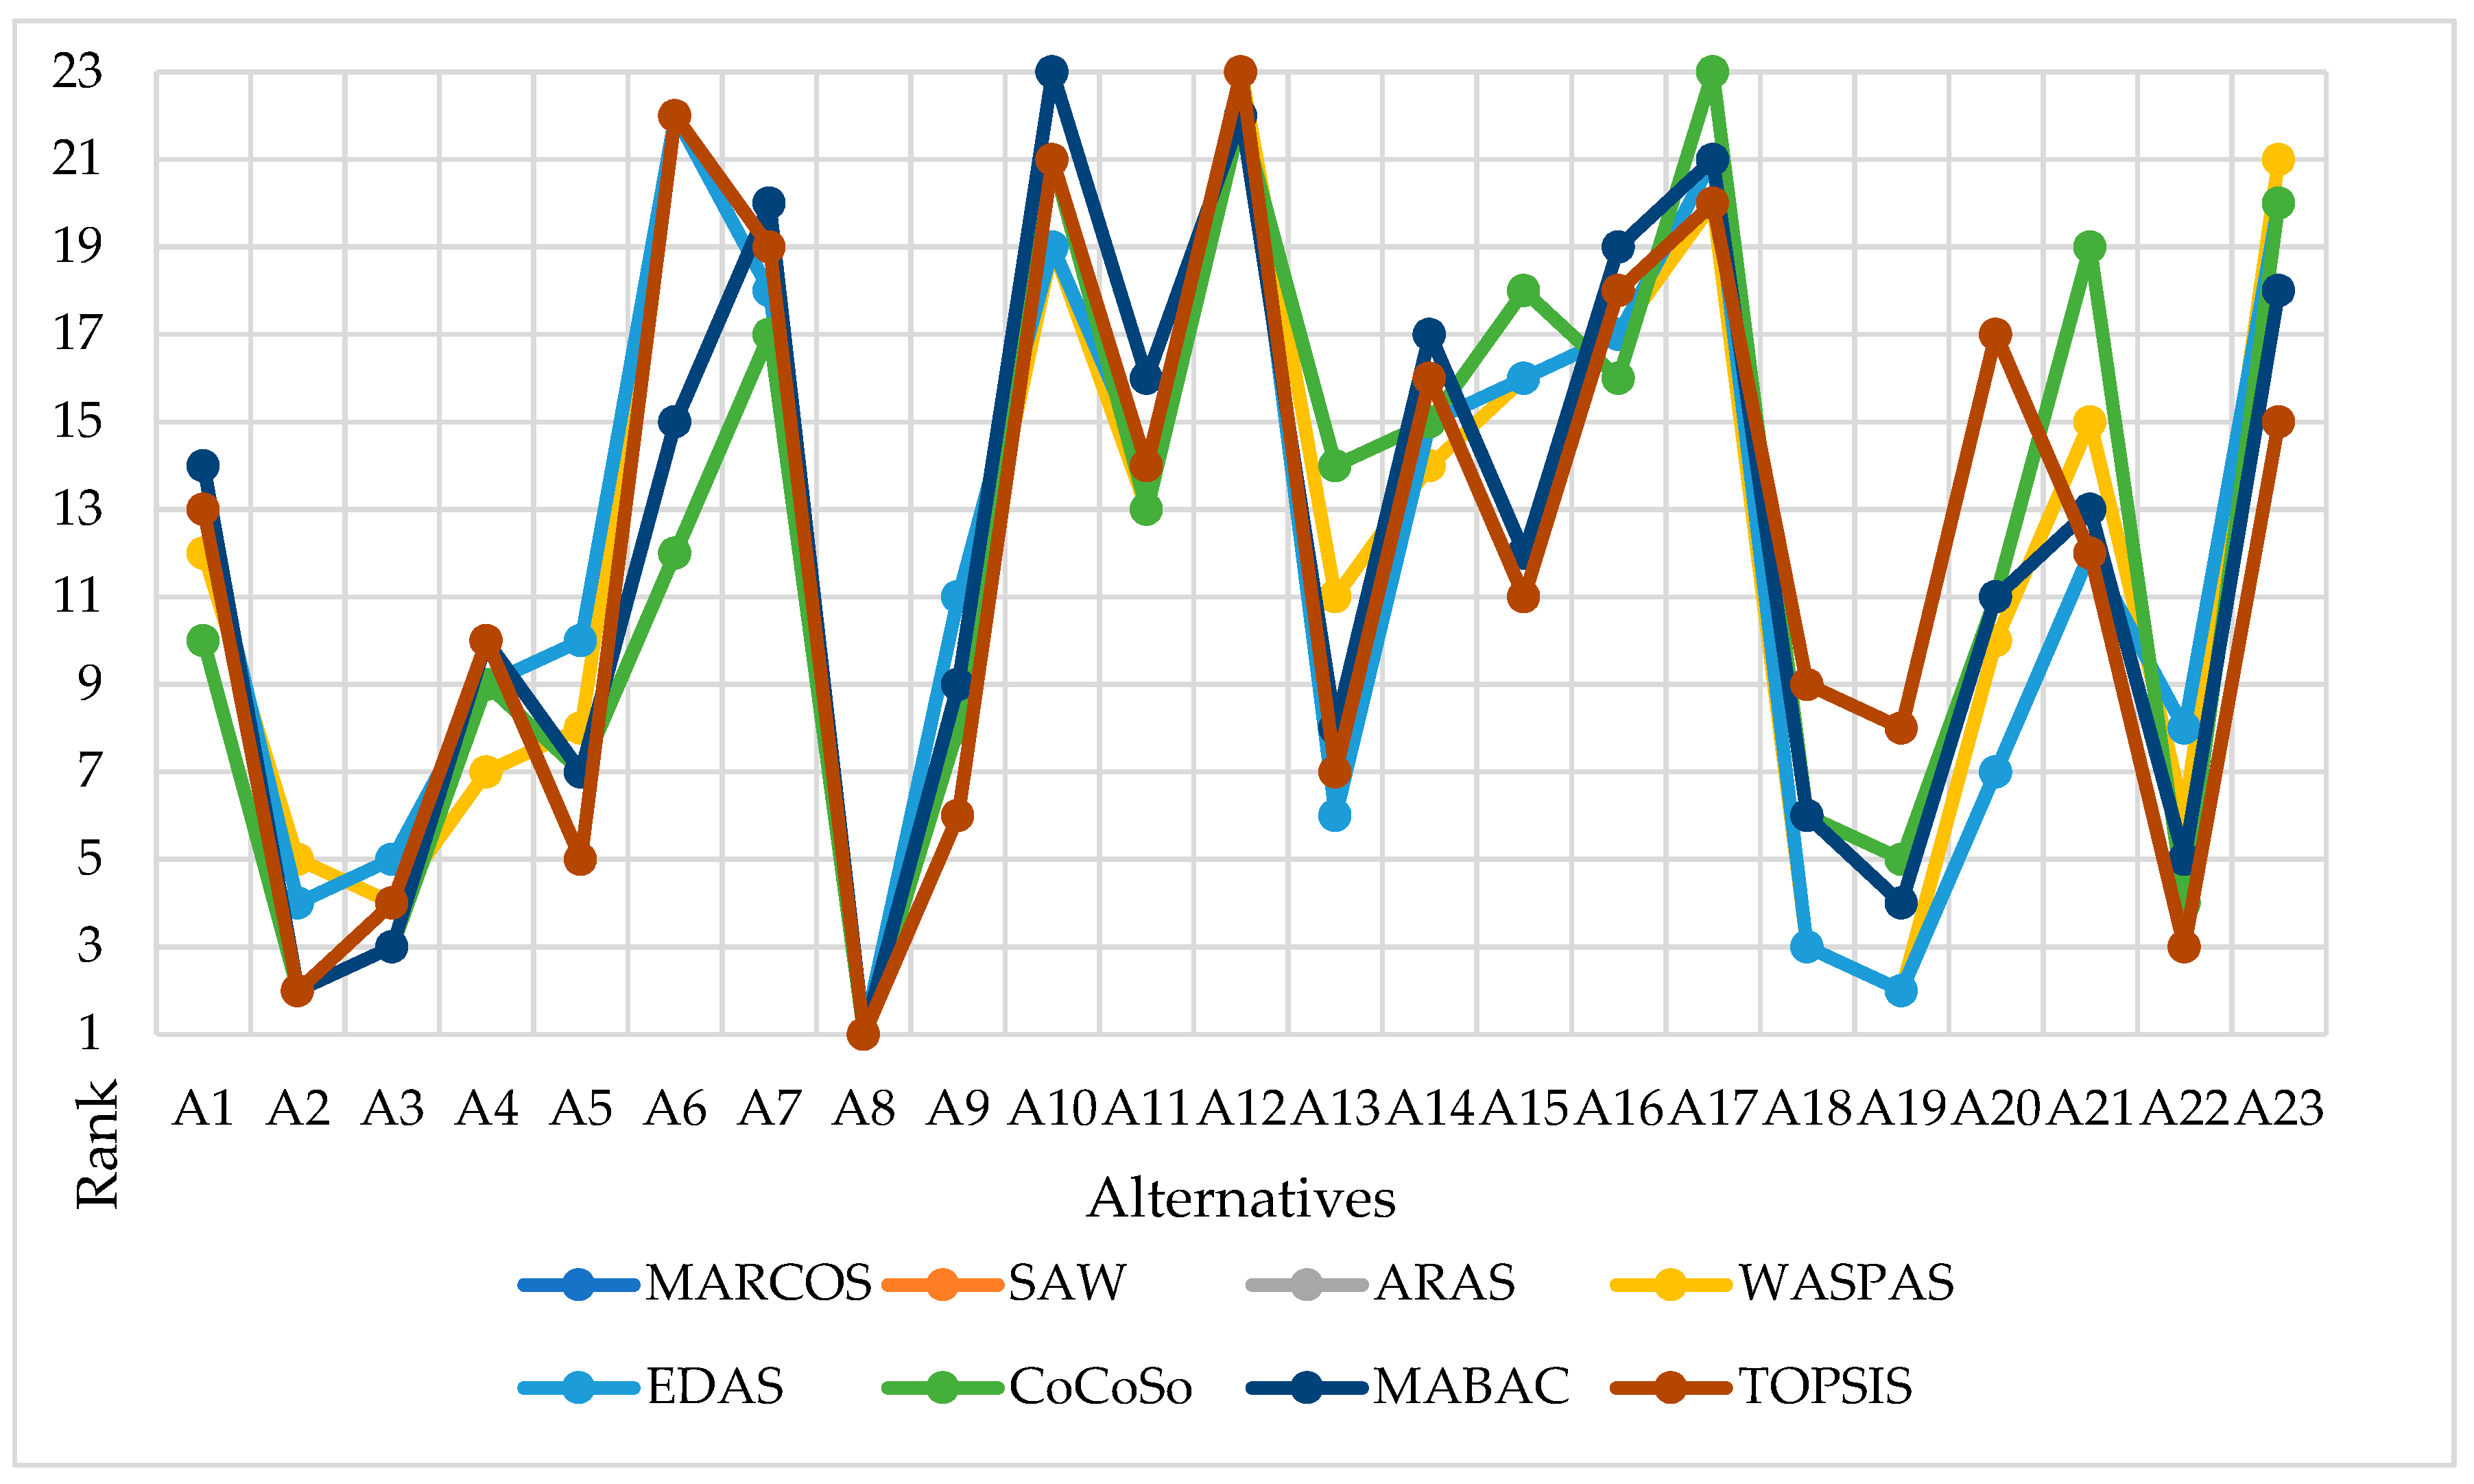
From
Figure 3, the ranks of alternatives for a total of eight MCDM methods can be observed. It is important to emphasize that the best alternative does not change its position no matter which method is used. Thus, the eighth alternative retains its first position. Alternative 19 takes second place by MARCOS, SAW, ARAS, WASPAS, and EDAS, while its ranking changes by CoCoSo, MABAC, and TOPSIS methods and it takes fifth, fourth and eighth place respectively, and A2 takes the second position by all three methods. The MARCOS, SAW, and ARAS methods are consistent for all alternatives since there is no ranking change at all. Considering the WASPAS method and the three aforementioned methods, there is only one rank change where A17 and A23 change their places taking the 20th and 21st position, respectively. Regarding the comparison of rankings using the MARCOS and EDAS methods, it can be concluded that there are some changes in the rankings that are not drastic, while the rankings change much more when comparing the rankings using the CoCoSo, MABAC, and TOPSIS methods.
Since there are some changes in the ranking, which is understandable because the model has a very large number of alternatives, the statistical correlation of ranks is calculated further using the Spearman’s correlation coefficient (SCC) as shown in
Table 6.
Considering the overall correlation coefficient of 0.945, it can be concluded that the rankings of the alternatives are in very high correlation since all values above 0.80 can be characterized as such [
27]. As already noted, MARCOS, SAW, and ARAS are consistent and are in complete correlation SCC = 1.000, i.e., no alternative changes rank. When it comes to the correlation of the MARCOS and the WASPAS methods, they are in almost complete correlation of 0.999 since there is a change of ranking for only two alternatives changing their positions. MARCOS has a slightly lower correlation with the EDAS method and it is 0.968, with CoCoso 0.909, with MABAC 0.919, while with the TOPSIS method it has the largest differences, i.e., the least correlation SCC = 0.875. Observing the average correlation of the MARCOS method with the others, it is 0.959, which is a very high correlation. The SAW and ARAS methods have the same correlation with other methods as well as MARCOS, since they are in complete correlation with each other. The WASPAS method, compared to the aforementioned methods, has a slightly lower correlation, but still very high. EDAS with CoCoSo and TOPSIS methods has a slightly lower correlation of 0.845 and 0.846, respectively, while it has an SCC of 0.917 with the MABAC method. The lowest correlation in the overall sensitivity analysis is between the CoCoSo and TOPSIS methods and it is 0.819, while CoCoSo and MABAC have SCC = 0.911. MABAC and TOPSIS have SCC of 0.924. As stated previously, based on the overall analysis, it is concluded that the results, i.e., the rankings are in a very high correlation.
5. Conclusions
In this paper, a new integrated FUCOM-MARCOS model for the evaluation of human resources in a transport company has been formed. The integration of the two methods has been performed for the first time in this research, which is one of the major contributions. In addition to certain scientific contributions, this study also indicates the professional contribution that is reflected through the creation of the model and the application for calculation made available to executives in a transport company. It enables very fast and easy evaluation of human resources, which will be performed at certain intervals during the year, usually on a monthly basis. Contributions of the proposed integrated model can be expressed through benefits that are determinative for the application of such model. FUCOM has the only n-1 comparison of the criteria, the ability to validate the results by defining the deviation from full consistency (DFC) of comparison, and appreciating transitivity in pairwise comparisons of criteria. Unlike other subjective models, FUCOM has shown minor deviations in the obtained values of the weights of criteria from optimal values. MARCOS method is based on testing the reference values of alternatives in relation to ideal values and on a comprehensive rational and reasonable application methodology. The model is very flexible and simple so it can also be applied to other problems of multi-criteria analysis.
The FUCOM method has been applied to determine the significance of the weight values of the criteria with a degree of deviation from complete consistency of zero, while the MARCOS method has been applied to evaluate potential solutions. The total number of drivers in the transport company located in Bosnia and Herzegovina is 23, and the effectiveness of the company largely depends on them. Following the application of the integrated model, a sensitivity analysis has been performed to test the sensitivity and stability of the model using seven other MCDM methods. SCC has been applied to check ranking correlation showing extremely high correlation of ranks.
The continuation of this research is related to the constant monitoring and periodic evaluation of drivers, as well as the possibility of eco-driving training [
28], which can further contribute to cost rationalization and increase market competitiveness. Except these used methods for rationalization, logistics activities can be implemented other approaches developed by the first author, such as fuzzy PIPRECIA [
29], rough WASPAS [
30], rough ARAS [
31], rough SWARA [
32], and others.


