

Systematic Review

Integrating Demand-Responsive Transportation into Smart City Strategies: Implications for Sustainable Urban Mobility in the European Union—A Systematic Literature Review and Survey Analysis


Department of Corporate Leadership and Marketing, Kautz Gyula Faculty of Business Economics, Széchenyi István University, Egyetem Tér 1, 9026 Győr, Hungary
*
Author to whom correspondence should be addressed.
Logistics 2026, 10(6), 138; https://doi.org/10.3390/logistics10060138
Submission received: 3 February 2026 / Revised: 15 April 2026 / Accepted: 24 April 2026 / Published: 17 June 2026

Abstract

Background: This study seeks to explore the link between smart city development and demand-responsive transport, analyze the ways of integrating demand-responsive transport into smart mobility concepts, estimate public perceptions about those phenomena, and review any international efforts aimed at promoting sustainable environmentally friendly transport options for cities in the EU. Methods: A systematic literature review was used as a basis for the current study; it is grounded in the analysis of scientific sources available in Scopus with the application of both PEO and PRISMA models. Survey analysis was also applied in order to examine public perception towards smart cities and DRT. Results: The results show that, even though the topics of smart cities and smart mobility have received significant attention in scholarly research, their links to demand-responsive transport still need more exploration. This paper describes the main features of smart mobility, urban mobility, and demand-responsive transport as well as the implications associated with each concept from an environmental, social, and operational perspective. In addition, the current international activities and examples of sustainable and flexible mobility systems are discussed. Conclusions: This paper presents a thorough examination of the relationships among smart mobility, urban mobility, and demand-responsive transportation.

1. Introduction

The urban population is anticipated to increase in the coming years, rendering cities increasingly important and emphasizing the significance of urban infrastructure. Around 82% of the population in North America lives in urban areas, whereas about 73% of the population lives in urban areas in Europe, with an estimated 60% of the global population living in urban areas [1]. The growing trend towards urbanization has increased the focus on creating smart cities that can tackle urban problems using technology and sustainable solutions. While there have been numerous studies on the definition of a smart city, with aspects ranging from sustainability, the environment, accessibility, transparency, and stakeholder involvement considered, a clear-cut definition is yet to be found [1].
The notion of a smart city has traditionally been subdivided into several related aspects, including the concepts of smart governance, smart economy, smart environment, smart people, smart living, and smart mobility [2]. All these aspects are tightly related and can affect one another. At present, one of these aspects, namely smart mobility, has acquired special importance because of problems related to traffic jams, environmental friendliness, effectiveness of movement, and accessibility. The current research is dedicated to the concept of smart mobility and its implementation within the European Union.
Demand-responsive transportation (DRT) refers to flexible transport services that dynamically adjust routes and schedules based on real-time passenger demand, typically coordinated through digital platforms and intelligent transport systems. Unlike fixed-route public transport, DRT operates using adaptive routing and scheduling algorithms to improve efficiency and service accessibility. Within the smart city framework, DRT contributes to smart mobility by enhancing system flexibility, improving resource utilization, and supporting sustainable urban logistics. While DRT systems have historically been applied in rural and low-density areas, their relevance in urban environments has grown substantially due to increasing congestion, environmental concerns, and the need for integrated multimodal mobility solutions. This study focuses primarily on urban contexts, as cities represent the most complex transport environments where smart mobility integration and logistics optimization can generate significant sustainability and operational efficiency benefits.
Smart mobility is a dimension within the smart city. It has been defined in various ways, and its definition continues to evolve even further [3,4]. Smart mobility is defined as the integration of advanced technologies, data-driven decision making, and multimodal transport systems to improve transportation efficiency, sustainability, accessibility, and operational performance. A key operational manifestation of smart mobility is Mobility as a Service (MaaS), which integrates multiple transportation modes into a single digital platform, allowing users to plan, book, and pay for multimodal transport services seamlessly. MaaS systems rely heavily on ICT infrastructure, real-time data exchange, and platform-based coordination to optimize mobility services and improve user experience.
Demand-responsive transportation represents an important operational component within MaaS ecosystems, providing flexible first-mile and last-mile connectivity and improving overall system efficiency. Previous studies have demonstrated that MaaS platforms enhance transport system utilization, reduce congestion, and support sustainability objectives by enabling efficient multimodal transport integration [5]. It should also be noted that some studies position DRT between conventional fixed-route bus services with variable routes and highly personalized transport services such as taxis [5].
The main purpose of this research is to analyze the place of urban mobility in the concept of smart cities and then to study the incorporation of DRT based on that analysis. While much attention has been paid to DRT in recent years, the connection between it and smart mobility and smart city technology has not yet been thoroughly studied. Thus, this research seeks to fill the research gap between smart city technology, smart mobility, urban mobility, and DRT [6]. To accomplish this goal, the following research questions have been developed:
(R1) What are the definitions of smart mobility, urban transportation and demand-responsive transportation in the literature and what are the similarities and differences between them?
(R2) What is the link between smart mobility and demand-responsive transportation?
(R3) Could the link between smart mobility and demand-responsive transportation result in a more sustainable and environmentally friendly future?
(R4) Are there any examples of smart mobility and demand-responsive transportation within and outside the European Union?
(R5) What are the opinions of the people regarding the smart city concept and on-demand transportation? How many people know about these concepts, and what are the connections between their assumptions?
Demand-responsive transportation has evolved significantly over the past two decades, transitioning from traditional dial-a-ride services toward digitally enabled, integrated mobility solutions that complement conventional public transport systems. Early DRT systems primarily served low-demand rural or peripheral areas; however, recent developments demonstrate their increasing role in urban mobility ecosystems as flexible, technology-enabled transport services integrated with real-time data and platform-based coordination [3,5,7]. Contemporary DRT solutions are often implemented as part of integrated multimodal transport systems, supporting first-mile/last-mile connectivity and enhancing overall system efficiency, accessibility, and sustainability. This evolution positions DRT not merely as an isolated transport service but as a core operational component of smart mobility and intelligent transport systems.
The first research question aims to define what smart mobility is, what urban transportation is, and what demand-responsive transportation means. Considering the different terminologies used by researchers and conceptualizations of these phenomena, it is vital to create an organized framework that can be used to understand these concepts. The second research question highlights the literature gap related to the link between smart mobility and demand-responsive transport. The third research question seeks to investigate whether the incorporation of smart mobility and DRT can lead to environmental sustainability. Transportation is one of the significant sources of greenhouse gases. It has been established that about 25% of all greenhouse gases are emitted during transportation processes, and 40% of transportation carbon dioxide emissions are generated through urban transportation [8]. The fourth research question involves looking at past implementations of smart mobility as well as DRT to find best practices and lessons that could be applied in the future. Lastly, the fifth research question revolves around the issue of public knowledge of smart city ideas and demand-responsive transport. Public attitude towards this technology is an important factor in implementing successful mobility policy.
Over the past two decades, the concept of smart cities has evolved alongside advances in digitalization, intelligent transport systems, and data-driven decision making. Early smart city initiatives focused primarily on infrastructure digitalization, while more recent approaches emphasize integrated service systems, user-centered mobility, and sustainability-oriented logistics management. Smart mobility emerged as a key pillar of smart city development, aiming to improve the efficiency, sustainability, and accessibility of transportation systems through technological integration and real-time data utilization.
Similarly, demand-responsive transportation has undergone significant evolution, transitioning from traditional dial-a-ride services toward digitally coordinated mobility solutions integrated with multimodal transport systems. Modern DRT systems utilize mobile applications, optimization algorithms, and real-time data to dynamically match transport supply with passenger demand, improving operational efficiency and reducing unnecessary vehicle circulation. Previous studies have highlighted both the benefits and challenges of DRT implementation, including improved accessibility, reduced emissions, enhanced service flexibility, and operational complexity related to system coordination and cost optimization.
Despite increasing research attention, the integration of DRT within smart city mobility frameworks remains insufficiently explored, particularly from a logistics and systems integration perspective. This study addresses this research gap by systematically analyzing the relationship between smart mobility and DRT systems, supported by empirical survey analysis [9].
The European Union has guidelines towards implementing the smart city ecosystem and has identified different barriers both on local and EU policy levels. The report done by the European Union highlights that local and EU-level adoption is required, but without implementation capacity on the ground level, the incentives are meaningless. A report done by the European Union highlights different barriers regarding the implementation of the process, for example, inappropriate levels of competence and inefficient administrative capacity. Some other studies also highlight some of these issues, like monetary and funding issues, and solutions [7]. The European Commission identifies three fundamental pillars of smart city development: transport, energy, and information and communication technologies (ICTs), which together enable sustainable, efficient, and integrated urban systems. Smart mobility represents the transport dimension of this framework, while ICT enables real-time monitoring, coordination, and optimization of mobility services, including demand-responsive transport systems. Energy efficiency is closely linked to transport decarbonization through electrification, optimization of vehicle utilization, and modal shift strategies. Demand-responsive transportation contributes directly to these pillars by improving transport efficiency, reducing unnecessary vehicle circulation, and enabling ICT-based coordination of mobility services. Therefore, analyzing DRT within the smart city framework aligns directly with European smart city policy priorities and sustainability objectives [10].
The research is divided into five main parts and several subsections. The Introduction gives a thorough explanation of the study, the research goal and questions. The second part, Materials and Methods, describes the methodology of the study and what techniques were used in this study to achieve its results. The third part, Results, delves into the results of the methodologies and what conclusion could be made. Moreover, it is divided into two main parts, one addressing the systematic literature review, the other one addressing the survey analysis. The Discussion section interprets the results and examines their implications. Finally, the last part concludes this study and talks about the results and possible future directions.

2. Materials and Methods

2.1. Systematic Literature Review Methodology

To achieve the goal of the study, several methodological frameworks have been used. This research employs a systematic literature review (SLR) to examine the uses and relationships between the terms smart mobility, urban mobility, and demand-responsive transportation within the European Union.
The SLR was conducted following the PRISMA 2020 guidelines for transparency, reproducibility, and methodological rigor in the study selection process (Table S1: PRISMA Checklist). In the literature search the Scopus database was utilized. The search string included combinations of keywords related to smart cities, smart mobility and demand-responsive transportation. The study selection process followed the PRISMA framework with the help of keyword selection by the PEO framework, and a search strategy was designed using population, exposure and outcome frames as a basis [6,9]. Titles and abstracts were firstly screened to remove any irrelevant studies, after which full-text articles were assessed according to the predefined inclusion and exclusion criteria defined by the research goal and research questions. Data extraction was performed manually by reviewing each selected study and recording relevant information including research focus, methodology, geographical context, and key findings regarding smart mobility or demand-responsive transportation. The extracted data included publication year, journal source, research objectives, methodological systems, and key findings relevant to the integration of smart mobility and demand-responsive transportation systems. No prior protocol registration was conducted for this systematic literature review.
Regarding the risk of bias assessment, the study is a qualitative systematic literature review and does not include quantitative meta-analysis. Effect measures were not applicable because no quantitative synthesis or meta-analysis was performed. Reporting bias assessment was not applicable due to the absence of statistical synthesis. Certainty assessment was not applicable because the review is descriptive and does not evaluate intervention effectiveness. The review focused on peer-reviewed journal articles published between 2015 and 2025 to capture recent developments in smart mobility and demand-responsive transportation systems.
The population, exposure, outcome (PEO) framework and PRISMA methodology are widely used in systematic literature reviews to ensure structured, transparent, and reproducible article selection processes [8,11]. The PEO framework was used to structure the systematic literature review and ensure methodological rigor. The PEO framework is commonly applied in systematic reviews to define research scope and guide literature selection. In this study, the population refers to urban mobility systems and smart city environments, particularly within the European Union context. The exposure refers to demand-responsive transportation and related flexible mobility solutions as operational interventions affecting transport systems. The outcome refers to the expected impacts of these systems, including improved sustainability, operational efficiency, accessibility, and system optimization. For visualization purposes, a table was made to better understand the PEO framework, seen in Table 1. This structured approach ensures that the literature selection process remains focused on studies directly relevant to the interaction between smart mobility and demand-responsive transport systems [8,11].
This research is interested in how these subjects can be dealt with or analyzed. It is crucial to define the outcome clearly, so that we can understand what this research aims to study, mainly efficiency and sustainability.
As seen above in the table, many keywords, 16 to be exact, have been used but only led to 87 results. The following keyword string was applied in the search: (“European Union” OR “Eu” OR “Intelligent City” OR “Smart dimensions” OR “Smart city”) AND (“On demand transportation” OR “Urban transportation” OR “Demand responsive transportation” OR “Dial-a-ride” OR “Demand adaptive transportation” OR “Smart mobility”) AND (“Sustainable” OR “Sustainability” OR “Sustainable development” OR “Efficiency” OR “Optimization”). This keyword string was applied in order to get the most precise articles for the research.
Different inclusion and exclusion criteria were applied in a particular order. Firstly, the articles had to appear in one of 4 main fields, those being social sciences, business, management or finance. Secondly, the articles had to be freely accessible. Thirdly, they had to be in English. Fourthly, this research wanted to delve into the recent past, so a time frame was set between 2015 and 2025. Last, but not least, the articles went through a manual screening, where their relevance was evaluated.
The first filter limited the subject areas to three main ones (“Social Sciences”, “Business, Management and Accounting” and “Economics, Econometrics and Finance”), and a significant drop is noticeable, as the number of articles is more than halved, with 400 papers remaining. The explanation for this might be the fact that these keywords appear in other subjects, not only these ones, mainly in engineering. Another huge exclusion factor was that they had to be open access, which also contributed to the loss in articles, and so 132 remained. The other criteria were not as significant but still drained the number of articles to be studied.
The publication year was used as one of the other inclusion criteria where the selected articles were restricted to those published from 2015 to 2025. With the inclusion of the publication year criteria, 127 articles were left. Additionally, only peer-reviewed journal articles were included in the study, reducing the number of articles to 87. From the total number of articles obtained, 37 articles were finally included after performing a thorough manual screening process. The overall screening and selection process was performed using PRISMA 2020 criteria as shown in Figure 1.

2.2. Bibliometric Analysis

The last step of the study selection procedure was performed manually and was based on an assessment of the suitability of the articles under review for inclusion in the analysis, depending on how well they correlated with the goals of the research. As a result of this assessment, 37 articles were chosen for further analysis. The articles were chosen among journals with various levels of quality: Q1, Q2, Q3, and Q4 journals. In particular, there were 29 articles found in the Q1 category, 5 articles in the Q2 category, 2 articles in the Q3 category, and 1 article in the Q4 category. These statistics demonstrate that most of the selected literature appeared in high-ranking scientific journals. The papers under consideration were published in journals dealing with the issues of sustainability, smart cities, transport systems, urban planning, engineering, and logistics.

2.3. Survey Methodology

These results were further supplemented by the results of a questionnaire survey which aimed to evaluate the public opinion towards the smart city concepts and on-demand transport systems. The questionnaire was conducted using both English and Hungarian versions to attract as wide an audience as possible. The total number of valid questionnaires reached 102. One should take into account the fact that this research constitutes a pilot study since the questionnaire was conducted 10 days before analyzing the results.
Three main aims were associated with the survey. Firstly, it was aimed at assessing how familiar respondents were with the smart city concept and demand-responsive transport. Secondly, the survey sought to investigate public opinion and preference towards these two types of mobility solutions. Lastly, the survey sought to determine public readiness for future developments in transportation that would involve the application of innovative technologies. Survey results have provided useful information concerning public awareness and acceptance of smart mobility ideas.
The questionnaire was divided into four major parts. The first part gathered data on demographics such as age and nationality, along with the number of people in each household who hold a valid driver’s license, the number of vehicles owned, and respondents’ understanding of smart city and demand-responsive transport systems. The second part concerned the transportation behaviors of participants such as the regularity of travel and common modes of transportation. Participants’ choices included personal vehicles like cars and motorcycles, as well as bicycles and walking. Other means of transport included buses and trains.
In the third part, participants were offered several hypothetical examples of mobility to test whether certain adjustments to the existing transport system would motivate respondents to opt for public transport services. The questions of the section were partly inspired by a study conducted earlier [12], yet included a few extra statements to fit the current research aims. Overall, the questionnaire allowed gathering further information on public awareness, transport preferences, and attitude towards smart mobility and demand-responsive transport systems. Moreover, the survey results confirmed the validity of the interpretation of the systematic literature review outcomes and helped answer the research questions of the study.

3. Results

3.1. Thematic Analysis

The aim of the thematic analysis was to show information of the papers analyzed which addresses the smart mobility and demand-responsive system in the smart city context, particularly from a sustainability perspective [11].
Due to the interdisciplinary nature of the literature that was included (case based, conceptual, and empirical research designs), an exclusive tool for risk of bias cannot be directly utilized, thus it was used as a lightweight, non-design-specific quality tester to label each included study as high/medium/low for methodological rigor [13]. Various quality levels were assigned to different studies, depending on multiple factors such as clarity and aims of context, clarity and context, transparency of the study and design procedures, adequacy of data, appropriateness of method to the stated aims, treatment and validity and reproducibility or traceability [13].
Table 2 presents the abridged evidence map and the complete evidence map (of 37 studies). An analysis was applied to the studies to make the methodology more clear, each study having different a study type (1), analysis type (2), theory used (3), data type (4), key categories coded (5) and quality (6).

3.1.1. Smart City

The smart city has many definitions depending on the author and the focus. One study says that the smart city concept was conceived in the 1990s. The concept includes technology, innovation and globalization, and on top of that it builds upon the idea of smart growth and supports improved urban planning and Wi-Fi-enabled devices [42]. The study of Heddebaut also said that smart city consists of many different components, such as technological, human and institutional, but the emphasis in this study was put onto technical aspects and particularly information and communication technologies [15], from which it is possible to see that the smart city as a concept and idea was already thoroughly investigated, even before the start of the century. Of course, both quantitative and qualitative information gathering are crucial for a good smart city project [16]. A proponent of the smart city has said that shared mobility services would provide flexibility, so called on-demand transportation. These shared services are car sharing, bike sharing, moped sharing and scooter sharing [33]. According to another study, the naming convention of smart cities has gone through an evolution. Firstly, it was sustainable city, intelligent city, green city, then in the 2000s turning into smart community and eventually knowledge city [17]. The European Commission defines smart city as: cities which are using technological solutions to improve the management and the efficiency of the urban environment [18]. It is said that smart cities are an answer to urban challenges [19]. One study suggests that no uniform definition has been accepted yet [3], and there is an existing research gap [43]. According to previous research, the concept of smart cities is not defined by a universal definition but should be considered an aggregation of interrelated ideals and strategies for urban development such as intelligent cities, digital cities, sustainable cities, technocities, well-being cities, walkable cities, future cities, and ecocities [17]. Despite their similarities, each concept has unique features that set them apart from each other. Intelligent cities, for instance, place emphasis on knowledge creation and evidence-based urban management, whereas digital cities put greater importance on ICT integration. Sustainable cities, on the other hand, emphasize minimizing emission and resource use. As for the attributes of smart cities, they tend to be sustainable and aim for transparency and efficiency, although a study supports the idea that smartness does not directly mean intelligent solutions but rather user friendliness [2]. Some studies also argue that the Internet of Things (IoT) is a part of the smart city ecosystem [20].

3.1.2. Smart Mobility

Smart mobility is considered one of the six key dimensions of the smart city concept, which includes such important spheres as smart economy, smart living, smart people, smart governance, and smart environment. Despite being more and more widely discussed among scientists and policymakers in recent years, the notion of smart mobility lacks a universal definition due to its ongoing development. There are diverse ideas and directions in the case of smart mobility [17]. There are different synonyms for smart mobility, and can be referred to differently, as pointed out in one study [21]. One study argues that sustainability and smart go hand in hand and one cannot exist without the other [8].
Sustainability is a crucial component in the study of smart cities and smart mobility, but the meaning of sustainability changes from one source to another. In the most commonly used definition, sustainability means the process by which current needs can be met without affecting the ability of future generations to meet their own needs [19]. Sustainability has been defined in some studies with respect to the carrying capacity of ecosystems. With respect to smart mobility, existing literature provides insights on three key aspects: mobility services, business models, and the transformative capability of transportation systems. In addition to the above, smart mobility can be defined as the combination of mobility services in cities by offering different forms of transportation. From the aforementioned interpretations, the concept of smart mobility for the current research can be defined as the use of smart technologies and smart transportation systems to enhance the efficiency, sustainability, safety, and access of urban transport systems. The smart mobility concept therefore incorporates the use of multimodal transport approaches, which include walking, cycling, public transport, and personal mobility options facilitated through information and technology-based transport systems [22].
A study also investigated the usage of autonomous vehicles in the smart city environment [23], but another study suggests that more research is needed to implement autonomous vehicles into the smart city environment [24]. Overall, it is recommended that the usage of electrical vehicles can be implemented when an adequate level of infrastructure is met [12]. Sustainability refers to a stage in the economy where the requirements posed on the environment by humans and business activities can be met without affecting the ability of the environment to cater to future generations. It can also be stated in simple economic terms in relation to a restorative economy as follows: leave the world a little better than you came into it, take only what you need, do not harm life and the environment, and apologize if you do, as mentioned in an article [25]. Sustainability generally carries a positive meaning, but many without ill intent use it without a proper and concise definition in mind. One study stated that through the lenses of Mobility as a Service (MaaS) there are diverse keywords for smart mobility: integration, real-time data, multimodality, and user-centric were the main ones among many others [27]. Mobility as Service proves to have potential, but its effectiveness is dependent on multiple factors such as price or travel time [44]. Through analyzing these studies, we can conclude that smart mobility strives for: sustainability, efficiency, ease of access and use.

3.1.3. Urban Transportation

Urban transportation encompasses a diverse range of transportation methods, including private vehicles, public transport, shared mobility services, and other active mobility options such as cycling and walking. Urban transportation contributes to different areas of transportation and sustainability, those being: private transportation, public transportation, professional transportation, walking, emerging shared transportation, intra-city air, water transportation, etc. A shift has been noticed in urban transportation, a shift into private car use, which was more notable in the COVID-19 pandemic, due to the virus situation [28]. It is argued that the improvement of urban mobility is crucial for the improvement of the smart city system [29] and for shrinking congestion and private car usage [28]. Sustainable urban mobility can lead to social inclusion and congestion and air pollution reduction [44]. What would lead to people using public transportation instead of private cars has been researched, and the main points are faster journey time, express services and real-time information systems, which suggests that people want more flexibility [28]. Real-time information is important for optimization [30], which in turn would lead to optimal fuel usage and less carbon emission. Another study also suggests that a rework of timetables of public transportation can lead to benefits, as it is both important for the economy and society [25,30]. It is important to include that there are studies encouraging using bikes and walking lanes [32] in order to relieve the burden on roads. However, a boost injection into the infrastructure is needed for this, as some areas may not be well equipped for bike and scooter usage [33].

3.1.4. Demand-Responsive Transportation

As for demand-responsive transportation, only a few articles were found within the PRISMA framework. For easier understanding, demand-responsive transportation has many synonyms: on-demand transportation, demand-adaptive transportation, dial-a-ride etc. According to a study demand-responsive transportation has existed for decades, but in a more simplistic form: taxis. The taxi service evolved into phone services which allowed the user to book a car in advance, and then app-based services which directly linked people to privately owned vehicles. Shared services also may mean on-demand transportation [33]. Furthermore, communication is pivotal in demand-responsive transportation. It is important to note that demand-responsive transportation argues for a more sustainable and efficient transportation method, where the passenger and commuters gain access to major transport infrastructure. Demand-responsive transportation, if implemented, decreases traffic congestion, assisting the switch away from private car use.

3.1.5. Examples

This subsection highlights examples of smart city and smart mobility projects, such as demand-responsive transport, which has similarities to these notions and therefore still needs mass populization. The role of public organizations and policymakers in populizing smart mobility through digital platforms and social media is essential in making public policies understood in digital platforms and social media [41]. Digital platforms like the X social media platform help bring together policymakers, industry leaders, press representatives, and citizens in a manner which makes for easy raising of awareness related to smart mobility projects [40]. For the European Union, organizations like the European Commission, European Parliament, European Council, European Economic and Social Committee, and Committee of the Regions have a very important role in promoting sustainable urban mobility plans or SUMPs to make people-centered and demand-driven approaches in urban mobility a reality within cities in the European Union [24,26]. But a successful smart mobility scheme also demands public investments and stability in politics along with regulation and participation of different stakeholders in the initiatives of smart mobility projects in a sustainable manner [22].
There are a number of case studies that demonstrate diverse degrees of smart mobility on various levels of implementation. In Portugal, the case of Lisbon shows smart city elements at a metropolitan level, with integrated transportation systems, cycling, and smart mobility, albeit with a confined geographic focus [34]. The 15 min city concept in the Italian region of Lombardy supports a polycentric approach by optimizing access to local amenities and transportation, showing a nascent smart city ambition that, notwithstanding, lacks a focus on smartness metrics [35]. Big cities in Croatia show higher degrees of smart mobility than smaller/medium-sized counterparts because of institutional capacities, again evidencing sustainability as a smart city element [36]. In Poland, an evaluation of the top 18 cities ranked smart mobility based on infrastructural innovation, ecologically friendly rolling stock, technological innovation, and strategic innovation, and Białystok, Warsaw, and Toruń ranked top [45]. However, a comparative analysis showed that Cagliari is actually less advanced globally as a smart city, specifically in terms of smart mobility [37]. In Estonia, there are varying priorities by local authorities in smart mobility according to local regulations, and sustainability in Tartu, innovation in Viimsi, and accessibility and safety in Pärnu rank high [38]. In Saudi Arabia, smart city analyses for Riyadh, Mecca, Jeddah, and Medina demonstrate a very strong smart economy, by far exceeding that for smart mobility, due to inadequate public means and related infrastructure [39]. In South Africa, a case study in Gauteng identifies a possible convergence between green modes of transport, ICT, and real-time data for a cleaner and a more connected city [14] In a similar manner, for a better Bloemfontein, its new smart city needs a balanced evolution in transport mobility, governance, and economies that prioritizes a green transport network, ICT integration, and a sharing, cooperative form of governance and enhanced urban living [46].

3.2. Survey Analysis

In the following section the survey and its responses will be empirically analyzed. This part of the research mainly answers the last question but will help to see the previous answers in new light. This part seeks to bridge the gap in research to see the view on public transportation, the smart city concept, and on-demand transportation. In total, 102 people filled out the survey, of which 84 people filled out the Hungarian version and 18 people filled out the English version.

3.2.1. Descriptive Statistics

To add context to the results and assist in interpreting the responses given by the respondents, demographic data was also collected. The part of the questionnaire relating to demographics attempted to capture some of the basic demographic attributes of the respondents, which include gender, age, educational level, location, nationality, and employment status. Moreover, information was requested from respondents regarding the number of drivers’ licenses, bicycles, private cars, and e-scooters they had at home. This was done to understand better how the ownership of vehicles could have affected their travel behaviors. Special emphasis was placed on determining whether the respondents were aware of the concepts of the smart city and demand-responsive transport. Such questions were purposely asked right at the beginning of the survey to minimize any potential bias brought about by questions in other parts of the survey related to smart city concepts and mobility scenarios.
The questionnaire was developed in Hungarian and English languages; both sets of results have been compiled, so this investigation will examine both questionnaires simultaneously. Of a total of 102 participants, 44 participants were males while 58 participants were females. As for the age category, the following can be seen: two people belonged to the under 18 category, 57 people belonged to the 18–25 age group, 17 people belonged to the 26–35 age range, 16 participants belonged to the 36–45 age category, nine participants belonged to the 46–65 age group, and finally one participant belonged to the over 65 category.
Regarding education level, there were six categories: primary school, secondary school, vocational school, bachelor’s degree, master’s degree and PhD or doctoral degree. Only one has only primary-school-level education, 46 respondents have secondary-school-level education, 23 had vocational-school-level education, 15 had a bachelor’s degree, 13 had a master’s degree and four had a doctoral degree.
The nationalities of the respondents were asked, and an overwhelming majority of the people identified themselves as Hungarian, 84 to be exact, while there were two respondents who were from Jordan and one each of the following: German, Liberian, Bangladeshi, Moroccan, Lao, Pakistani, Sri Lankan and Kenyan.
Regarding employment status, most of all the responders, 60, were still in education, 37 were employed, two people were unemployed, two people were retired and there was one stay at home person.
Questions regarding numbers of driving licenses, cars, bicycles and E-scooters were also asked. In each category:
Driving licenses: There were four people who answered that there are no driving licenses within the household, 22 people answered that there was one, 48 answered that there are two driving licenses, 18 responded that there are more than 3 and 10 people have answered that there are 4 or more than 4 within their households.
Number of cars: Car nowadays have become pivotal in our everyday lives and the survey also resembles this, as only 12 people did not have a car within their household, 33 people had one, 45 people had two, 10 people had three and two people had two or more.
Number of cycles: Bicycles offer a healthier and more engaging way to travel. They are also more suitable for short-distance travel and are cheaper, both in terms of maintenance and fuel. Only nine people had no bicycles, 15 had one, 21 people had two, 28 people had three and 29 people had four or more in their household.
Number of E-scooters: Electronic scooters have become a craze in city management, as they are intended to promote the usage of micromobility devices within a city to reduce rush hour congestions and take the burden off roads. Although they have become more popular over the years, this does not show in the results, as only 11 people have responded that there is an electronic scooter in their household, and one person answered that they have two. All the other people have no e-scooters in their household, 91 precisely.
Most respondents said that they had at least one driver’s license in their household. The most frequent answer category was two driver’s licenses in a single household. Twelve people responded that there were no private cars in their household. Ninety people answered that there was at least one car in their household. It was surprising that bicycle ownership was higher compared to car ownership among the respondents. It could suggest that the surveyed group preferred non-motorized transportation. On the contrary, only a few people owned an electric scooter. When comparing bicycles and electric scooters, bicycles were more frequently used over shorter distances.
Lastly, the demographic portion assessed participants’ awareness about the terms “smart cities” and “demand-responsive transport”. With regard to the former, a total of 67 respondents acknowledged having heard of the concept before, whereas 35 admitted having no previous knowledge of the term. Therefore, one can argue that there was a decent level of awareness of the term used to describe smart city initiatives. With regard to the latter term, however, participants were much less familiar with it; a total of 67 participants stated that they had not heard of the term before, as opposed to the 35 who claimed otherwise.

3.2.2. Chi-Square Analysis

In order to gain additional insight into the correlations among some of the chosen variables, various statistical tests were carried out. Among these tests, the chi-square test of independence was used to determine whether there were any correlations among the categorical variables incorporated in the survey. The statistical technique helped discover any connections between the demographic factors, transportation practices, and knowledge about smart cities and demand-responsive transportation of the participants. Chi-square tests were conducted for different combinations of the variables, and their outcomes were analyzed in detail.
D e g r e e   o f   f r e e d o m = N u m b e r   o f   c o l u m n s 1 ( n u m b e r   o f   r o w s 1 )
E x p e c t e d   v a l u e = r o w   t o t a l c o l u m n   t o t a l t o t a l   v a l u e   o f   o b s e r v a t i o n s
X 2 = ( O b s e r v e d   v a l u e e x p e c t e d   v a l u e ) 2 E x p e c t e d   v a l u e
The chi-square analysis is approriate, because it is a statistical test to see if there is a significant relationship between the variables. It compares the observed frequencies in each category with the frequencies that would be expected if there were no associations between the variables. By evaluating the differences between observed and expected values, the chi-square test determines whether any deviation is likely due to random chance or indicates a meaningful relationship. The resulting chi-square statistic and its corresponding p-value allow researchers to assess the strength and significance of this association. This method is particularly useful in survey-based research, where it can reveal patterns or dependencies between demographic characteristics and opinions, preferences, or behaviors.
Firstly, this kind of analysis was performed to see if there is a significant relationship between the knowledge of smart cities and on-demand transportation, age and knowledge of smart cities, age and knowledge of on-demand transportation, education level and knowledge of smart cities, education level and knowledge of on-demand transportation, gender and smart cities, and gender and on-demand transportation. The results are shown in the tables below, in Table 3 and Table 4.
The results show that there are no significant associations between age and knowledge about smart cities (SCs) or on-demand transportation (DRT), as their p-values are above the critical threshold of 0.05, although there may be some relevance.
The same could be said of the relationship between education level and smart cities and on-demand transportation, as they do not meet the threshold associated with rejecting the null hypothesis.
In contrast there is a large relevance regarding gender and knowledge about smart cities and on-demand transportation as the p-values are smaller than the threshold (respectively: 0.00279886 and 0.003655699).
Finally, a strong and highly significant association was found between familiarity/support for the smart city concept and for demand-responsive transportation (chi-square = 19.34, p < 0.00001), implying that those who are positive about or aware of smart city initiatives are likewise more likely to understand on-demand mobility solutions. Overall, these findings suggest that, while age and education do not appear to shape attitudes toward the examined mobility concepts in this sample, gender and conceptual familiarity are important correlates.

3.2.3. Correlation Analysis

Transitioning from the previous parts, statements were given to the respondents and they had to evaluate whether or not they agreed with the different notions of public transport development and what they associated the smart city with.
There were seven statements regarding public transportation development: frequency of the service, better coverage of the city, lower costs, safety, comfort, available information and sustainability.
People had to evaluate them on the scale from 1 to 5, where 1 represented the least or not at all important notions and 5 the most important ones. It can be seen that, if asked about preferences during development of public transportation, people focus more on safety, available information, frequency of services, and better coverage of the city. Sustainability was another important aspect, but it was not as important as the previously mentioned aspects despite having more “very important” than “rather important” responses. Safety and lower costs are important, but not as important as the previously mentioned notions, and people would put frequency, better coverage, safety and information in higher regard.
Progressing to the next part, people had to consider different factors regarding what they associate smart cities with. They once again had to work with a Likert scale, from 1 to 5, where 1 meant that they did not associate the term with smart cities, those being: sustainability, efficiency in transportation, flexibility, digital solutions, innovativeness, autonomous vehicles, electric vehicles.
According to the research, people have agreed with sustainability, efficiency, flexibility, digital solutions and innovativeness being part of smart cities, as many people responded “associated” and “rather associated”, to be precise 56, 67, 57, 53 and 51 people have said that they associate them with the smart city concept, and 31, 30, 35, 33 and 27 people have said that they rather associate them with it.
Regarding the last two questions, there are more varied answers. Autonomous vehicles are much more controversial and, although many people say they are neutral about them [38], many people did associate them with smart cities [22]. In this research, 21 people agreed they should be part of a smart city, 12 people did not associate them with it, and 15 people responded “rather associated”, suggesting that people have different ideas about autonomous vehicles.
Meanwhile, electric vehicles are not overwhelmingly associated with smart cities, but still are the public mind, because 35 people responded “rather associated” and 25 people responded “associated”. Thirty people were neutral about them, nine people did not find them that important and three people thought they are not part of them, suggesting that electric vehicles have a place within smart cities but are not the highest priority.
Transitioning from the last part, this research arrives at the correlation test. The correlation test was conducted to ascertain whether there exists a significant relationship among the previously examined variables: frequency of the service, better coverage of the city, lower costs, safety, comfort, available information, sustainability and, in the second part: sustainability, efficiency in transportation, flexibility, digital solutions, innovativeness, autonomous vehicles, electric vehicles. The correlation test was done with values from 1 to 5.
C o r r e l a t i o n   c o e f f i c e n t = n x y ( x ) ( y ) n x 2 ( x ) 2 n y 2 ( y ) 2  
Correlation values range from −1 to 1, with results close to −1 indicating a strong negative correlation, values near 1 representing a strong positive correlation, and values around 0 suggesting little or no relationship. A positive value or outcome means if one variable changes in one direction, the other one will increase, depending on the strength of the correlation. In the case of a negative correlation value, if a variable changes in one direction, the other will change in the opposite direction, e.g., if one increases, the other will decrease and, if one decreases, the other will increase.
The categorization of correlation strength is inherently subjective; however, for the purposes of this research, specific definitions have been established to provide clarity and consistency in addressing the research question. Specifically, correlations are categorized as weak between 0 and 0.3, moderate between 0.3 and 0.6, and strong between 0.6 and 1. The same applies for the opposite, the negative side: between 0 and −0.3 as weak, between −0.3 and −0.6 as moderate, and between −0.6 and −1 as strong.
What may be surprising in the analysis is that there is no moderate negative connection, only weak negative correlation, meaning that most of these terms are considered to go hand in hand with public transportation and the smart city concept. The three biggest values are 0.69035, 0.59744, 0.58589, which correspond to the ideas of autonomous vehicles and electric vehicles, better coverage and frequency in public transportation and sustainability and innovativeness.
Of these values only the first one is higher than 0.6, meaning that there is a strong correlation between autonomous vehicles and electric vehicles, because many people think they are closely connected within the smart city. The other two numbers do not meet the 0.6 threshold but are very close to it. According to the majority, coverage and frequency of public transportation should confirm each other’s existence. Regarding the last mentioned strong moderate correlation, people do believe that innovativeness can give a way for sustainability, and sustainability needs innovativeness in technology and new methods in transportation.
Regarding the negative correlations, there are no strong or even moderate values, meaning that people do not necessarily think that one variable is to the detriment of the other. The lowest negative correlation is between innovativeness and lower costs, meaning that people do not think innovativeness is cheap, and the same goes for digital solutions and lower costs, meaning the development of digital solutions does not happen without the light or heavy appliance of money. The third lowest value is between digital solutions and comfort which means that people do not necessarily think that comfort in public transportation translates to comfort in digital solutions, possibly meaning that the usage of them is uncomfortable due to different factors.

3.2.4. Transportation Habits

The second part of the study consisted of questions regarding transportation habits: how much they travel on a day-to-day basis, what transportation methods they use. Among the 102 respondents, daily travel times varied considerably: eight individuals reported traveling less than 10 min a day, 11 between 10 and 20 min, 32 between 20 and 30 min, 30 between 30 min and 1 h, 15 between 1 and 2 h, and six respondents indicated traveling more than 2 h each day. Both the preference and the usage of different transportation methods have been measured on a 1 to 5 Likert scale. These two questions were asked because the usage and preference may not line up, and they did not line up.
In this section the fondness for different public transportation methods and their frequency of usage will be discussed. The questionnaire also asked the participants to rate different ways of transportation on the basis of how much do they like the listed transportation methods and how often they use these kinds of transportation methods.
Regarding how often they use these kinds of transportation methods, cars are overwhelmingly liked, with 67 people out of 102 saying that they are a liked transportation method, 17 saying that they rather like them, 11 people being neutral about cars, five people rather not liking them and two people disliking them. Motorcycles are not commonly used nowadays for everyday travel, and not many people like them. In the survey, 31 people have said that they do not like traveling by motorcycle, 22 people have stated that they rather not like them, 22 people were neutral about this option and only nine people rather liked them and eight people liked them. Cycling is generally well-liked, as shown by the questionnaire, in which 35 people rather liked them, 29 people liked them, 25 people were rather neutral about this transportation method, nine people were uninterested in cycling, and four people do not like to cycle. Walking is part of everyday travel, so it makes sense that people prefer it not preferring it. In the survey, 46 people have expressed that they like walking, 33 people rather like walking, 28 are neutral about walking, five people rather not liked walking and three people do not like to walk.
Regarding public transportation, buses, trains, trams and subways generally received neutral ratings, with trains being the most liked out of them. Buses received an overall 23 liked, 33 rather liked, 28 neutral, 13 rather not liked and five not liked ratings. Trains received 25 liked, 32 rather liked, 33 neutral, seven rather not liked and six not liked ratings. Trams and subways received more neutral ratings but trams received 20 liked, 19 rather liked, 39 neutral, 11 rather not liked and 13 not liked ratings, while subways received 30 liked, 20 rather liked, 31 neutral, 10 rather not liked and 11 not liked ratings. Regarding other options, people had the option to rank other transportation methods that they use, and were given the choice to write down their methods, and the following methods were mentioned: running, horse, air vehicle, water vehicle, airplane, tractor, trolleybuses and air balloon. Here it is not possible to associate ratings with these kinds of answers, as not every respondent thought of the same transportation methods.
Moving on to the frequency of how much people use different transportation methods, a 1 to 5 Likert scale has been applied here to measure how much people use each transportation method. The values meant: 1—never, 2—rarely (less than once a month), 3—sometimes (a few times a month), 4—often (a few times a week), 5—every day.
The questionnaire showed that cars are quite commonly used, as people have marked this option mostly as often used, 45 to be exact, 20 people chose the every day option, 28 people have responded with sometimes. Only nine people chose the rarely option, and there are no people who would not use a car at least once a year, showing that cars have become quite integral to humanity. Motorcycles on the other hand are not so well used, as 81 people have said that they never use motorcycles, 11 people rarely use them, three people use them sometimes, six people use them often and only one person uses them every day. The answers for cycling are varied, as 19 people never use them, 28 people use them only rarely, 31 people use them sometimes, 17 use them often and seven people use them every day.
Regarding public transportation, buses are not used by nine recipients, 26 use them only rarely, 22 people use them sometimes, 26 use them often and 19 people use them every day. Trains are used less, as 16 people never use them, 34 use them only rarely, 17 sometimes, 27 people use them often and eight people use them every day. The same question has been applied for electronic scooters too, and with an overwhelming majority, 77 people never use them, 10 use them rarely, 11 people use them sometimes, three use them often and only one person said that they use them every day. Other options here were once again optional, but should not be considered, as almost every single person thought of different transportation methods, so they should not be accounted for.

3.2.5. Evaulation of the Last Question

As for the final part of the questionnaire, the authors were curious about the free opinion of the people regarding smart cities, so the option was given to answer a few questions with their own words and opinions to see if people have individual insights into these terms. The following questions were asked:
  • What do you think a smart city is?
  • In what way would you improve your city to become more smart?
  • How do you think smart public transportation should work within a smart city?
  • How could your city be more sustainable?
The first question was asked not necessarily to see definitions but to see what people think about smart cities and what they associate with smart cities. The second question was deemed worthy to be in the questionnaire, so that people can imagine themselves in the places of policymakers and see how they would change their city to become smarter, depending on what that means. The third question is akin to the previous question but specifically asked how they would integrate public transportation into a smart city. And one of the most important notions within the smart city is sustainability, so a question about this was also asked. This part of the research was done by choosing some of the most innovative and interesting ideas provided by the respondents.
The first question was answered by 49 people. A recurring notion within the smart city was the heavy usage of technology to make life more efficient and comfortable. Of course, this technology usage would not be blind to the people, but it should be considerate towards the people and consider people’s needs and wants. Connected to the previous train of thought, data usage of these concepts should be a priority too, said one commenter. This kind of real-time data should be used to increase the quality of life of the people. For this kind of service to exist, a good flow of data must also exist. Technology and comfortability are not the only ideas mentioned here, as sustainability and eco-friendliness also come to mind for the people. A critique was also made, but not regarding the smart city itself, but rather the people. People have said that it is not enough for the city to be smart and people should be smart too. A merit can be drawn here, as not only should the service be smart but the consumers too and how they use it. A person even suggested that, instead of politicians running cities and day-to-day activities, there should be specialized policymakers and specialists running these kinds of services.
The second question delved into how people would try to make their cities smarter. A common argument from the people was to make public transportation more frequent, to give trains more frequent routes and even lanes, so people could use them easily to get from one place to another. A connected idea was to make additional subway lanes. A user has also mentioned that there should be no-car zones, where people can only use cycles, scooters and walk. This argument was made for relieving stress from roads and from people and to also decrease carbon emissions. However, a person has said that firstly the infrastructure should be modernized, as it does not stand ready to accommodate these kinds of smart changes and systems.
The third question was to see how people would imagine smart public transportation within a smart city system. Almost everyone has mentioned that they should base their schedule on real-time data, and it should be flexible and punctual. This could be achieved through connecting different digital devices, so the flow of data is much faster than otherwise, hinted one commenter. Attached to this idea, people have also mentioned that electric buses should also be introduced. Sustainability and eco-friendliness came up once again and are intertwined with the previous idea, that electrical transportation vehicles reduce pollution and carbon gas emission. Many people have also complained that buses are not connected to each other and there should be better coverage. Through these kinds of ideas, it is possible to see that people are not satisfied with the current state of transportation, for example, because they want more environmentally friendly solutions.
Finally, the last question regarded sustainability. Many respondents have repeated themselves that there should be better waste management, there should be smart people too, and more electric vehicles should be introduced, but new ideas have also arisen from. Public transportation should be free, and many people agreed on this idea, and another person suggested that these kinds of projects should receive more funding. But this should not only be seen in quantitative terms but in qualitative terms as well, as argued by several people, who want better quality in transportation and living within cities. Connected to electrical vehicles, devices and vehicles should not only use carbon-based fuels but renewable energy sources, and solar energy plants should also be built in the city.
As we can see, the opinions of the people vary, but there are many common characteristics, for example: technological advancements in digital devices, solutions, frequency, innovation, and transportation methods within a smart city, which should be data driven and sustainable. There were more who knew about smart cities than on-demand transportation, as there were 67 people who have heard about the smart city concept and there were only 35 people who have heard about on-demand transportation out of the 102 people who have filled out the survey. According to the chi-square analysis, there is a strong dependency between knowing about smart cities and on-demand transportation, and there was a not so strong dependency between gender and the previously mentioned terms. It is important to note that this survey is not representational, as the population is too small to conclude anything for sure. Nonetheless, it gives important insight and theories about these topics.

4. Discussion

This section addresses the research questions of the study. The first research question of the study examines the definitions of smart mobility, urban transportation and demand-responsive transportation in the literature, as well as the similarities and differences between them.
Studies examined smart mobility, as one of the six dimensions of the smart city concept, aimed at enhancing transportation systems through technology to improve efficiency, safety, sustainability, and accessibility. It involves integrating multiple modes of transport (walking, cycling, public transit, private vehicles) while leveraging real-time data and user-centered design to deliver seamless and personalized mobility services. Sustainability is considered inseparable from smart mobility, as it seeks to meet present needs without compromising future generations. Urban transportation, by contrast, is a broader umbrella concept encompassing all modes of transport operating within a city, including private and public transportation, professional transport, walking, shared mobility, and even intra-city air and water transport. It focuses on improving accessibility, reducing congestion, and encouraging modal shifts from private cars to more sustainable options like public transit, cycling, and walking. While smart mobility is inherently technology driven, urban transportation improvement can be achieved through both technological and non-technological interventions such as infrastructure upgrades and flexible solutions or timetable optimization. Demand-responsive transportation refers to flexible, on-demand services—sometimes called on-demand transportation, dial-a-ride, or demand-adaptive transportation—designed to match passenger needs in real time. Demand-responsive transportation aims to reduce congestion, improve access to major transport hubs, and support modal shifts away from private cars. In terms of interchangeability, the three concepts can overlap but are not synonymous. Demand-responsive transportation is a part of both urban transportation and smart mobility, serving as one possible service model within them. Smart mobility often incorporates demand-responsive transportation as a technology-enabled solution, but it extends further to include integrated, sustainable, and multimodal transport systems. Urban transportation is the broadest category, with smart mobility representing a technologically advanced, sustainability-focused approach within it. The key differences lie in scope—urban transportation is the overall system, smart mobility is the innovation-driven dimension of that system, and demand-responsive transportation is a specific operational model.
The second research question of the study was about the link between smart mobility and demand-responsive transportation. As stated before, smart mobility and demand-responsive transportation have similarities and differences. Demand-responsive transportation can be regarded as a strategy within the smart mobility system, but smart mobility includes various strategies and initiatives aimed at improving efficiency, sustainability, and accessibility through technologies such as data integration. Demand-responsive transportation represents a unique operational model that directly supports these objectives. Demand-responsive transportation can respond to real-time passenger needs and new adoption needs and is generally flexible. The aforementioned transportation method also reduces reliance on private vehicles, alleviates congestion and improves connectivity to major transport infrastructure. Its emphasis on communication technologies, multimodal integration, and resource optimization aligns closely with the core principles of smart mobility, making demand-responsive transportation not only a compatible component but also a practical enabler of its vision. Overall, demand-responsive transportation can be considered a targeted application of smart mobility principles, translating these concepts into practical solutions that enhance efficiency and sustainability in urban transport.
The third research question examines whether the integration of smart mobility and demand-responsive transportation can contribute to a more sustainable and environmentally friendly future. The integration of smart mobility and demand-responsive transportation initiatives has significant potential to contribute to a more sustainable and environmentally friendly future. Both terms already focus on environmental friendliness, and in addition, smart mobility emphasizes multimodal integration, real-time data utilization, and being more user centric, while demand-responsive transportation focuses on flexibility and optimization for passengers. By reducing the reliance on private car usage and instead promoting using public transportation or shared, technology-enabled transport options, this synergy can decrease traffic congestion, lower greenhouse gas emission and improve energy efficiency in urban environments. As society increasingly prioritizes sustainability and seeks to address climate challenges, the coordinated deployment of smart mobility strategies and demand-responsive transportation solutions represents a tangible path toward cleaner, more efficient, and socially inclusive transportation networks.
The fourth research question investigates whether there are any examples of smart mobility and demand-responsive transportation within and outside the European Union. Researchers indicate that smart mobility initiatives exist both within and outside the European Union. Considering only the results of the PEO framework, notable examples are Lisbon, Warsaw, Białystok, Toruń, and German-speaking major cities. Moreover, without the limitations of the systematic literature review, examples could likely be identified in all European Union countries. Cities such as Białystok, Warsaw, and Toruń in Poland demonstrate advanced smart mobility through extensive bike networks, hybrid bus fleets, and integrated traffic management. In rural Spain, a company connects remote areas via demand-responsive transportation services linked to main transport lines, illustrating how demand-responsive models can fill accessibility gaps. Beyond the European Union, South Africa and Saudi Arabia shows that such initiatives exist, but depending on the region, there are different results. Bloemfontein focuses on combining innovative transport solutions with governance reforms to boost mobility and sustainability. In Saudi Arabia, despite strong progress in other smart city dimensions, the low progress of public transport limits smart mobility potential, highlighting the need for robust infrastructure as a foundation for both smart and demand-responsive solutions.
The fifth research question examines public perceptions of smart cities and on-demand transportation, levels of awareness, and potential relationships between these variables. The opinions of the respondents are varied; however, a few commonalities do exist. Most of the participants associated the concept of a smart city with technological advancement: development of digital devices, innovative solutions, use of data for decision making, and ecological urban mobility. The smart city concept is more recognized among the citizens than on-demand transport: 67 out of 102 have at least heard about it, whereas 35 out of 102 people knew about on-demand transportation. Chi-square analysis showed a strong dependence of knowledge concerning the smart city and on-demand transportation concepts, meaning that whoever knows one is likely to understand or support the other. The relationship between gender and the concepts was weak, whereas age and education level were not related significantly. It should be underlined that this survey cannot be considered representative due to the relatively small size and narrow scope of the sample. Still, its results provide useful insights into current levels of awareness and perception of these emerging trends of urban mobility. Such results also theoretically underpin further, larger-scale research, with the technological awareness–familiarity relationship standing as central to people’s attitudes toward innovative transportation and smart city solutions. Also, correlation and chi-square analyses were done, and their results have been presented in the previous section, which further reinforces the trends in the survey data.
The findings of this study are consistent with previous research highlighting the importance of flexible mobility systems in improving urban transport sustainability and efficiency. Previous studies have demonstrated that demand-responsive transportation enhances accessibility, reduces unnecessary vehicle circulation, and improves overall system efficiency when integrated into smart mobility frameworks. Similar to findings reported by Lopez-Carreiro et al. [26], this study confirms that ICT integration, multimodal coordination, and flexible service models are critical components of smart mobility systems. Furthermore, the survey results align with previous research indicating that public awareness and acceptance are key factors influencing the successful implementation of innovative mobility solutions.

5. Conclusions

Despite the fact that smart mobility, urban transportation, and demand-responsive transportation represent different concepts, there is considerable conceptual similarity between them. These approaches to mobility have a lot in common as far as they are characterized by such factors as sustainability, flexibility, accessibility, and passenger-focused transport services. In addition, all these concepts refer to activities aimed at decreasing greenhouse gas emissions, decreasing congestion in cities, and increasing transportation efficiency and passenger comfort. According to the results of the survey conducted, people’s views on the related concepts correspond to these characteristics. Despite lack of awareness of demand-responsive transportation, respondents were able to identify some features of this concept. The use of PRISMA approach, PEO approach, systematic literature review, survey and statistical analysis helped in identifying the connections and real-world applications associated with smart mobility and demand-responsive transport systems. It can be observed from the analysis that sustainability, flexibility and a user-centric approach are some of the key principles behind these concepts of mobility.
However, there are a few limitations that need to be noted. First, the research is based mainly on a systematic review of literature and statistics, which might not allow for capturing the full spectrum of issues associated with these concepts and their practical application. Secondly, the research gap related to demand-responsive transportation might be partly due to the chosen keywords and the insufficient number of studies on the topic. Potential areas for future research include using bibliometric tools like VOSviewer and Dimensions to analyze the trends in research related to demand-responsive transport and smart mobility. Future work could also look into the relationship between DRTs, mobility policies in the European Union, the SDGs, and other aspects of smart cities. Finally, larger datasets, more qualitative approaches, and expanded geographic reach can help make future research even more effective and relevant.

Supplementary Materials

The following supporting information can be downloaded at: https://www.mdpi.com/article/10.3390/logistics10060138/s1, Table S1: PRISMA Checklist.

Author Contributions

Conceptualization, P.E. and L.B.; methodology, P.E. and L.B.; software, P.E.; resources, L.B.; writing—original draft preparation, P.E.; writing—review and editing, P.E. and L.B.; visualization, P.E.; supervision, L.B.; project administration, L.B. All authors have read and agreed to the published version of the manuscript.

Funding

This research received no external funding.

Institutional Review Board Statement

Ethical review and approval were waived for this study by Institution Committee due to Legal Regulations. (This study did not require ethical review because, in accordance with Article 4(1) of the General Data Protection Regulation (EU 2016/679), the present study collected no personal data, and all responses were fully anonymous and voluntary. The study posed no physical or psychological risk to participants. Furthermore, in Hungary, there is no national legislation requiring ethics committee approval for anonymous, non-invasive social science research involving adult participants and no sensitive or personal data).

Informed Consent Statement

Informed consent was obtained from all subjects involved in the study.

Data Availability Statement

The raw data supporting the conclusions of this article will be made available by the authors on request.

Conflicts of Interest

The authors declare no conflicts of interest.

References

  1. Perboli, G.; Rosano, M. A taxonomic analysis of smart city projects in north America and Europe. Sustainability 2020, 12, 7813. [Google Scholar] [CrossRef]
  2. Popova, Y.; Popovs, S. Impact of Smart Economy on Smart Areas and Mediation Effect of National Economy. Sustainability 2022, 14, 2789. [Google Scholar] [CrossRef]
  3. Pavanini, T. Demand Responsive Transport: A Short Review; Springer: Cham, Switzerland, 2025. [Google Scholar]
  4. Bıyık, C.; Abareshi, A.; Paz, A.; Ruiz, R.A.; Battarra, R.; Rogers, C.D.F.; Lizarraga, C. Smart mobility adoption: A review of the literature. J. Open Innov. Technol. Mark. Complex. 2021, 7, 146. [Google Scholar] [CrossRef]
  5. Campisi, T.; Chiara, S.; Antonio, R.; Giovanni, T. The Development of Integrated Public Transport and on Demand Services (PTs-DRTs) for Greater Flexibility and Complementarity of Transport Mode Choices. Comput. Sci. Its Appl. 2025, 6, 1958–1972. [Google Scholar]
  6. Buics, L.; Prayogo, A.; Balassa, B.E. The Role of Demand-Responsive Transport Systems in Sustainable Urban Mobility: A Systematic Literature Review and Stakeholder Analysis. Eng. Proc. 2024, 79, 40. [Google Scholar] [CrossRef]
  7. Gorev, A.; Popova, O.; Solodkij, A. Demand-responsive transit systems in areas with low transport demand of “smart city”. Transp. Res. Procedia 2020, 50, 160–166. [Google Scholar] [CrossRef]
  8. Pinna, F.; Masala, F.; Garau, C. Urban policies and mobility trends in Italian smart cities. Sustainability 2017, 9, 494. [Google Scholar] [CrossRef]
  9. Quynh, T.N.N.; Buics, L. The Evolution of Digitalization Transformation and Industry 4.0 in Supply Chain Management: A Systematic Literature Review. Eng. Proc. 2024, 79, 65. [Google Scholar] [CrossRef]
  10. Ferrer, J.N.; Taranic, I. The Making of a Smart City: Policy Recommendations; European Commission, Smart Cities Information System (SCIS): Brussels, Belgium, 2017. [Google Scholar]
  11. Page, M.J.; McKenzie, J.E.; Bossuyt, P.M.; Boutron, I.; Hoffmann, T.C.; Mulrow, C.D.; Shamseer, L.; Tetzlaff, J.M.; Akl, E.A.; Brennan, S.E.; et al. The PRISMA 2020 statement: An updated guideline for reporting systematic reviews. BMJ 2021, 372, n71. [Google Scholar] [CrossRef] [PubMed]
  12. Wang, C.; Yin, F.; Zhao, Y.; Yin, L. Making Transportation Systems in U.S. Cities Smarter and More Inclusive: A Synthesis of Challenges and Evaluation of Strategies. ISPRS Int. J. Geoinf. 2023, 12, 72. [Google Scholar] [CrossRef]
  13. Muñoz-Sánchez, C.; Menéndez-García, J.; Silva, J.A.; Garza-Reyes, J.A.; Monroy-Becerril, D.M.; Hakizimana, E. Blockchain Technology and Maritime Logistics: A Systematic Literature Review. Logistics 2025, 10, 12. [Google Scholar] [CrossRef]
  14. Oke, A.E.; Aghimien, D.O.; Aigbavboa, C.O.; Akinradewo, O.I. Appraisal of the drivers of smart city development in South Africa. Constr. Econ. Build. 2020, 20, 109–126. [Google Scholar] [CrossRef]
  15. Heddebaut, O.; Di Ciommo, F. City-hubs for smarter cities. The case of Lille “EuraFlandres” interchange. Eur. Transp. Res. Rev. 2018, 10, 10. [Google Scholar] [CrossRef]
  16. Nixon, D.V.; Schwanen, T. Community Smarts in Grassroots Initiatives to Support Cycling and Walking in Large Urban Areas. J. Urban Technol. 2024, 31, 9–28. [Google Scholar] [CrossRef]
  17. Modarelli, G.; Sadraei, R.; Rainero, C. How to perceive sustainable moving and smart mobility today?: A cross-national comparative longitudinal perspective and the controversy of alternative transport systems. J. Clean. Prod. 2024, 468, 143121. [Google Scholar] [CrossRef]
  18. Müller-Eie, D.; Kosmidis, I. Sustainable mobility in smart cities: A document study of mobility initiatives of mid-sized Nordic smart cities. Eur. Transp. Res. Rev. 2023, 15, 36. [Google Scholar] [CrossRef]
  19. Margherita, E.G.; Escobar, S.D.; Esposito, G.; Crutzen, N. Exploring the potential impact of smart urban technologies on urban sustainability using structural topic modelling: Evidence from Belgium. Cities 2023, 141, 104475. [Google Scholar] [CrossRef]
  20. Musa, A.A.; Malami, S.I.; Alanazi, F.; Ounaies, W.; Alshammari, M.; Haruna, S.I. Sustainable Traffic Management for Smart Cities Using Internet-of-Things-Oriented Intelligent Transportation Systems (ITS): Challenges and Recommendations. Sustainability 2023, 15, 9859. [Google Scholar] [CrossRef]
  21. Dousa, M. Smart transport in the conditions of the cities in the Slovak Republic. Eur. J. Sustain. Dev. Res. 2023, 7, em0218. [Google Scholar] [CrossRef] [PubMed]
  22. Situm, M.; Sorrentino, G.; Mangafić, J.; Lazović-Pita, L. Smart Mobility in German-Speaking Cities and Sarajevo: Differences, Challenges, Opportunities, and Lessons for Implementation Success. Sustainability 2024, 16, 7108. [Google Scholar] [CrossRef]
  23. Lim, H.S.M.; Taeihagh, A. Algorithmic decision-making in AVs: Understanding ethical and technical concerns for smart cities. Sustainability 2019, 11, 5791. [Google Scholar] [CrossRef]
  24. Yigitcanlar, T.; Wilson, M.; Kamruzzaman, M. Disruptive impacts of automated driving systems on the built environment and land use: An urban planner’s perspective. J. Open Innov. Technol. Mark. Complex. 2019, 5, 24. [Google Scholar] [CrossRef]
  25. Olesków-Szlapka, J.; Pawlyszyn, I.; Przybylska, J. Sustainable urban mobility in Poznan and oslo-actual state and development perspectives. Sustainability 2020, 12, 6510. [Google Scholar] [CrossRef]
  26. Lopez-Carreiro, I.; Monzon, A.; Lopez, E. MaaS Implications in the Smart City: A Multi-Stakeholder Approach. Sustainability 2023, 15, 10832. [Google Scholar] [CrossRef]
  27. Rutka, A.; Michnej, M.; Zwoliński, T.; Gabory, M. Core Indicators for Monitoring the Sustainable Urban Mobility Plan: A Case Study. Sustainability 2024, 16, 5632. [Google Scholar] [CrossRef]
  28. Liang, Y.; You, J.; Wang, R.; Qin, B.; Han, S. Urban Transportation Data Research Overview: A Bibliometric Analysis Based on CiteSpace. Sustainability 2024, 16, 9615. [Google Scholar] [CrossRef]
  29. Toth, S.; Bittner, B.; Kovacs, T.Z.; Nagy, A.S. Digital transformation possibilities in public transportation in Debrecen. Issues Inf. Syst. 2022, 23, 305–319. [Google Scholar] [CrossRef]
  30. Aldossary, M. Enhancing Urban Electric Vehicle (EV) Fleet Management Efficiency in Smart Cities: A Predictive Hybrid Deep Learning Framework. Smart Cities 2024, 7, 3678–3704. [Google Scholar] [CrossRef]
  31. Tomaszewska, E.J. Barriers related to the implementation of intelligent transport systems in cities—The Polish local government’s perspective. Eng. Manag. Prod. Serv. 2021, 13, 131–147. [Google Scholar] [CrossRef]
  32. Tao, X.; Cheng, L.; Zhang, R.; Chan, W.K.; Chao, H.; Qin, J. Towards Green Innovation in Smart Cities: Leveraging Traffic Flow Prediction with Machine Learning Algorithms for Sustainable Transportation Systems. Sustainability 2024, 16, 251. [Google Scholar] [CrossRef]
  33. Wolniak, R.; Turoń, K. The Problems of Scooter-Sharing in Smart Cities Based on the Example of the Silesian Region in Poland. Smart Cities 2025, 8, 16. [Google Scholar] [CrossRef]
  34. Lemonde, C.; Arsenio, E.; Henriques, R. Integrative analysis of multimodal traffic data: Addressing open challenges using big data analytics in the city of Lisbon. Eur. Transp. Res. Rev. 2021, 13, 64. [Google Scholar] [CrossRef]
  35. Borghetti, F.; Longo, M.; Mazzoncini, R.; Somaschini Cl Cesarini, L.; Contestabile, L. Relationship between railway stations and the territory: Case study in LombardY—Italy for 15-min statioN. Int. J. Transp. Dev. Integr. 2021, 5, 367–378. [Google Scholar] [CrossRef]
  36. Mutavdžija, M.; Kovačić, M.; Buntak, K. Moving towards Sustainable Mobility: A Comparative Analysis of Smart Urban Mobility in Croatian Cities. Sustainability 2024, 16, 2004. [Google Scholar] [CrossRef]
  37. Garau, C.; Masala, F.; Pinna, F. Cagliari and smart urban mobility: Analysis and comparison. Cities 2016, 56, 35–46. [Google Scholar] [CrossRef]
  38. Kirejev, M.; Gerstlberger, W.D.; Niine, T. Contrasting “Smart Mobility” and “Sustainable Mobility” in Transport Governance: The Case of Municipalities in Estonia. Sci. Pap. Univ. Pardubic. Ser. D Fac. Econ. Adm. 2024, 32, 1891. [Google Scholar] [CrossRef]
  39. Aldegheishem, A. Assessing the Progress of Smart Cities in Saudi Arabia. Smart Cities 2023, 6, 1958–1972. [Google Scholar] [CrossRef]
  40. Deka, U.; Varshini, V.; Dilip, D.M. The journey of demand responsive transportation: Towards sustainable services. Front. Built Environ. 2023, 8, 942651. [Google Scholar] [CrossRef]
  41. Nikolaidou, A.; Kopsacheilis, A.; Gavanas, N.; Politis, I. Assessing the EU Climate and Energy Policy Priorities for Transport and Mobility through the Analysis of User-Generated Social Media Content Based on Text-Mining Techniques. Sustainability 2024, 16, 3932. [Google Scholar] [CrossRef]
  42. Alanazi, F.; Alenezi, M. A framework for integrating intelligent transportation systems with smart city infrastructure. J. Infrastruct. Policy Dev. 2024, 8, 3558. [Google Scholar] [CrossRef]
  43. Meloni, I.; Musolino, G.; Piras, F.; Rindone, C.; Russo, F.; Sottile, E.; Vitetta, A. Mobility as a Service: Insights from pilot studies across different Italian settings. Transp. Eng. 2024, 18, 100294. [Google Scholar] [CrossRef]
  44. Hajduk, S. Assessment of urban transport—A comparative analysis of selected cities by taxonomic methods. Eng. Manag. Prod. Serv. 2016, 8, 67–74. [Google Scholar] [CrossRef][Green Version]
  45. Ogrodnik, K. Multi-criteria analysis of smart cities in Poland. Geogr. Pol. 2020, 93, 163–181. [Google Scholar] [CrossRef]
  46. Das, D.K. Perspectives of smart cities in South Africa through applied systems analysis approach: A case of Bloemfontein. Constr. Econ. Build. 2020, 20, 65–88. [Google Scholar] [CrossRef]
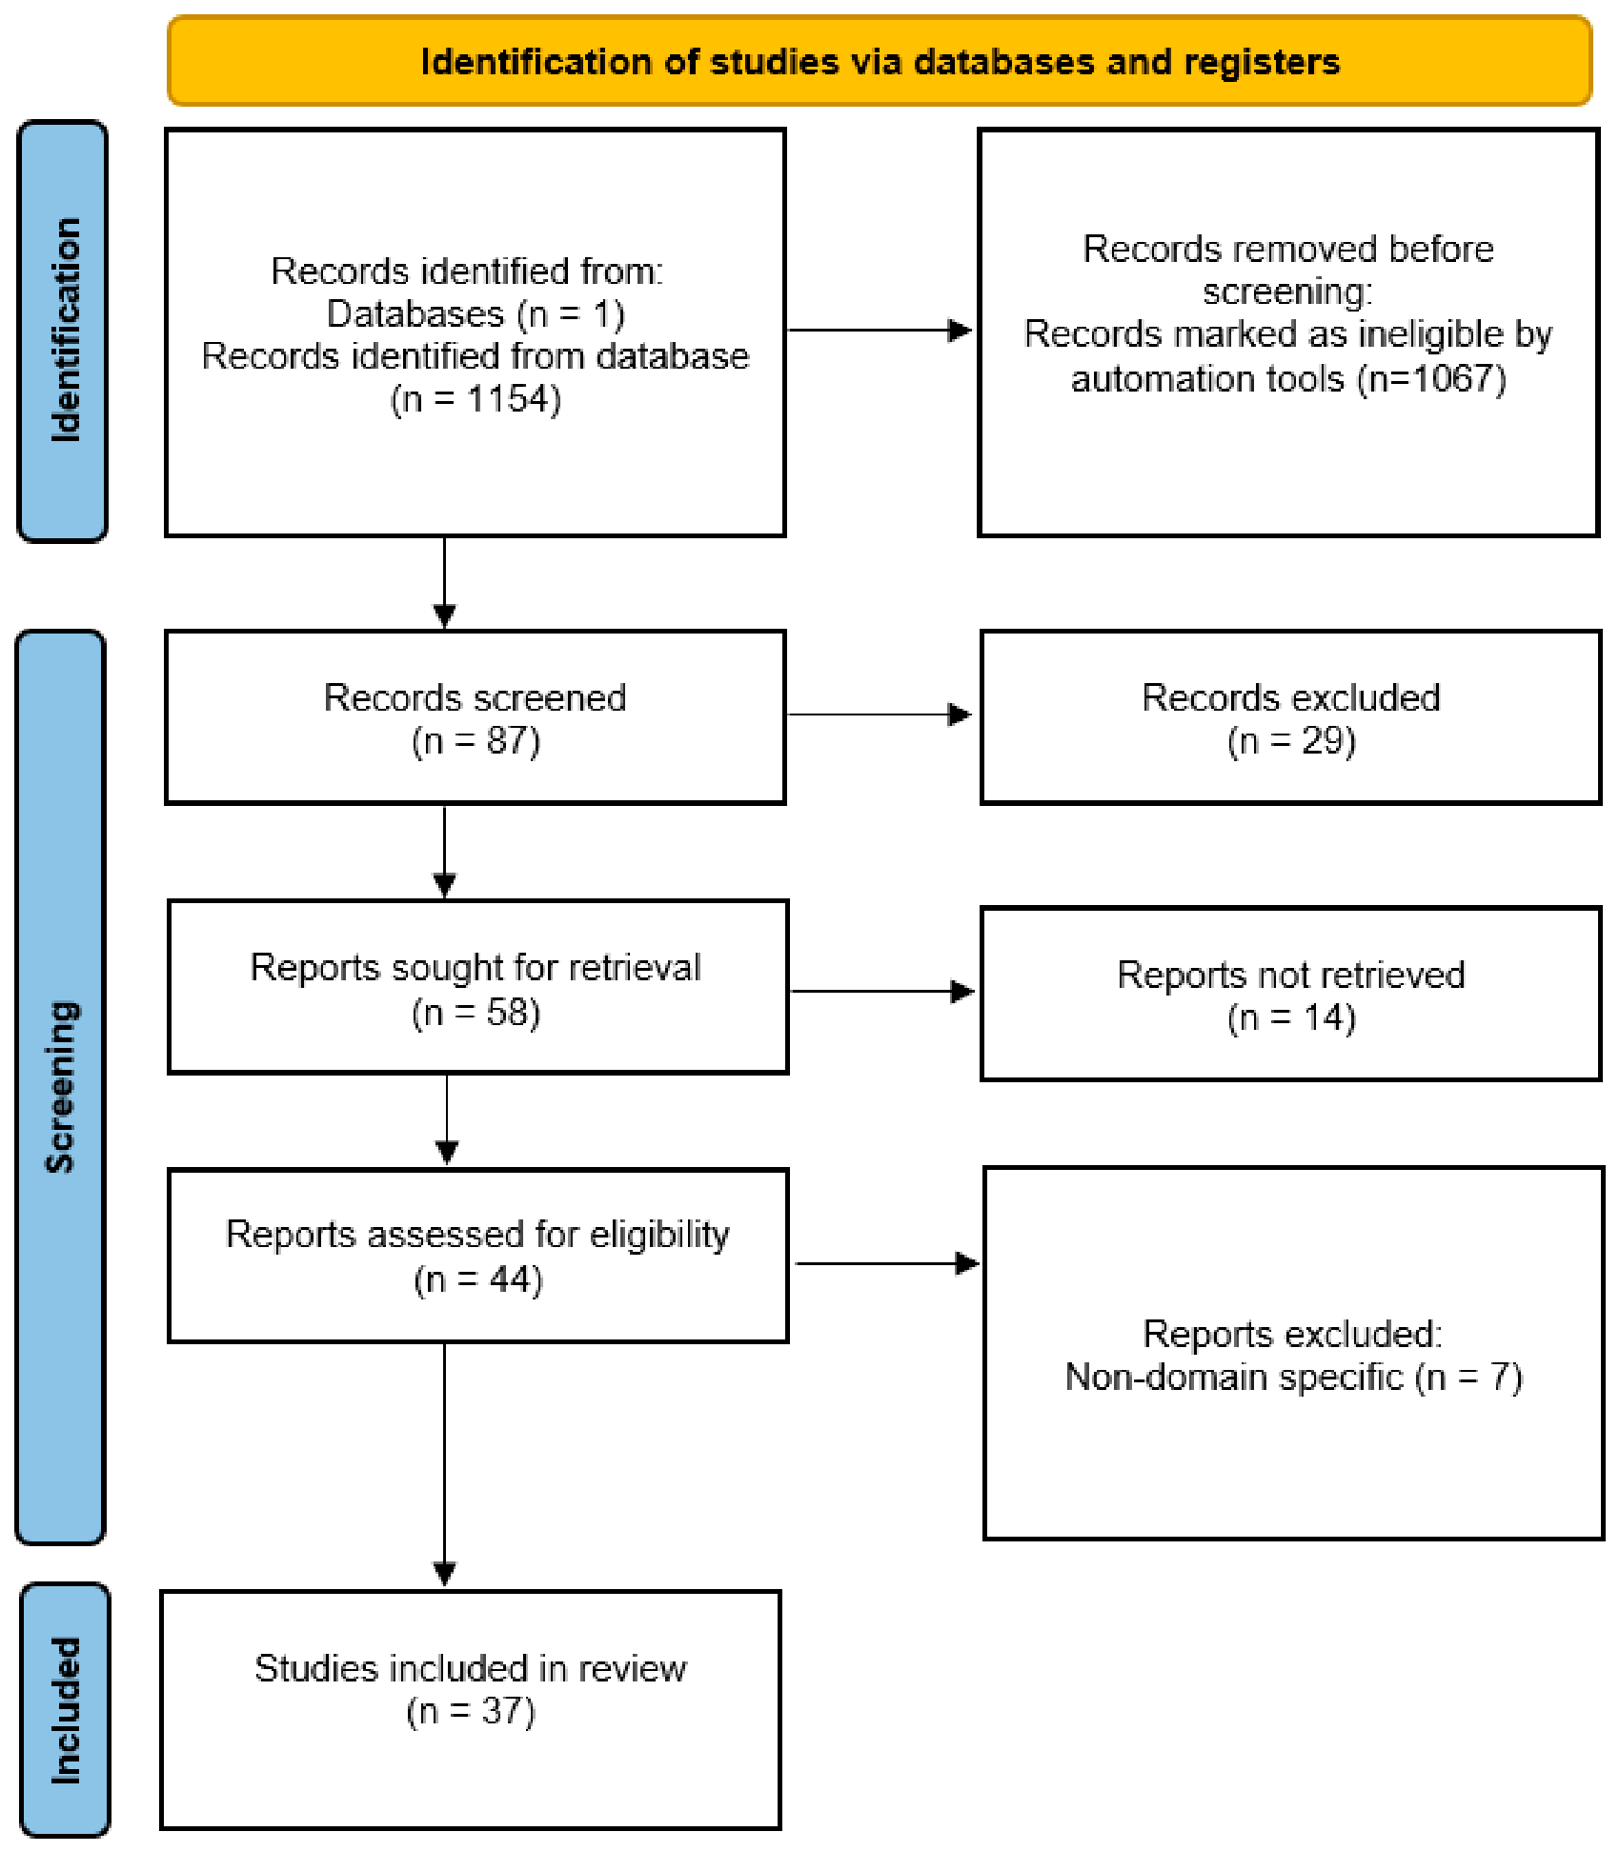
Figure 1. SLR selection criteria based on PRISMA method (Source: Authors’ own creation).
Logistics 10 00138 g001
Table 1. PEO framework.
PopulationExposureOutcome
European UnionOn-demand transportationSustainable
EUUrban transportationSustainability
Intelligent CityDemand-responsive transportationSustainable development
Smart DimensionsDial-a-rideEfficiency
Smart CityDemand adaptive transportationOptimization
Smart mobility
Table 2. Evidence map of 37 included studies (coding used for comparative synthesis and quality appraisal).
StudyStudy TypeUnit of AnalysisTheory UsedData TypeKey Categories CodedQuality Tier
[1]Model/FrameworkSmart city projectsNone statedSecondaryGISMedium
[2]Model/FrameworkSmart city—smart dimensionsPLS-SEMSecondarySCMedium
[3]Model/FrameworkSmart cityNone statedNone/ConceptualEXLow
[4]Bibliometric/SLRSmart mobility adoptionNone statedNone/ConceptualGISMedium
[5]Model/FrameworkSmart citiesNone statedSecondaryGISLow
[7]Bibliometric/SLRTransit systemsNone statedNone/ConceptualGISLow
[8]Case studyMobility trends in smart citiesNone statedSecondarySMMedium
[12]ConceptualAutonomous vehiclesNone statedNone/ConceptualSMMedium
[14]Model/FrameworkSmart cityNone statedSecondaryEXMedium
[15]Model/FrameworkSmart cityNone statedPrimarySCMedium
[16]Case studySmart cityNone statedPrimarySCMedium
[17]ConceptualSmart cityNone statedPrimarySCMedium
[18]Case studyScooter sharingNone statedPrimaryDRTLow
[19]ConceptualSmart mobilityNone statedPrimarySCMedium
[20]Model/FrameworkSustainable mobility in smart citiesNone statedNone/ConceptualSCLow
[21]Model/FrameworkSmart urban technologiesNone statedSecondarySCMedium
[22]Model/FrameworkSustainable traffic management for smart citiesNone statedNone/ConceptualSCLow
[23]ConceptualSmart transportNone statedSecondarySMMedium
[24]ConceptualSmart mobilityNone statedPrimarySMLow
[25]Bibliometric/SLRAutomated driving systemsNone statedNone/ConceptualSMLow
[26]ConceptualTransportation systemNone statedNone/ConceptualSC, SMLow
[27]Model/FrameworkUrban mobilityNone statedPrimarySMMedium
[28]ConceptualMaaS implicationsNone statedPrimarySMLow
[29]Case studyUrban mobilityNone statedSecondarySMMedium
[30]Bibliometric/SLRUrban transportationNone statedNone/ConceptualUTLow
[31]ConceptualPublic transportationNone statedPrimaryUTMedium
[32]Bibliometric/SLRUrban transportationNone statedSecondaryUTLow
[33]Model/FrameworkElectric vehicleNone statedNone/ConceptualUTLow
[34]ConceptualIntelligent transportation systemNone statedPrimaryUTMedium
[35]Model/FrameworkSustainable transportation systemsNone statedSecondaryUTMedium
[36]Model/FrameworkTransport and mobilityNone statedPrimaryGISLow
[37]Model/FrameworkMultimodal traffic dataNone statedSecondaryEXMedium
[38]Model/Framework15 min cityNone statedNone/ConceptualEXMedium
[39]Model/FrameworkSustainable mobilityNone statedSecondaryEXLow
[40]Model/FrameworkTransportation systemNone statedSecondaryUTMedium
[41]Model/FrameworkSmart urban mobilityNone statedSecondaryEXLow
[42]Case studySmart mobilityNone statedSecondaryEXMedium
Note: Key characteristics code: SC—Smart city and subtypes, EX—Examples, DRT—Demand-responsive transportation, UT—Urban transportation, GIS—General information and suggestions, SM—Smart mobility. Quality tier reflects the manuscript’s appraisal rubric based on information available in the extracted study summaries.
Table 3. Connection between variables (1).
VariableChi-Squarep-Value
Age and Smart City8.130.15
Age and Demand-Responsive Transportation7.750.24
Education Level and Smart City6.780.17
Education Level and Demand-Responsive Transportation0.170.37
Table 4. Connection between variables (2).
VariableChi-Squarep-Value
Gender and SC8.930.00279886
Gender and Demand-Responsive Transportation8.450.003655699
Smart City and Demand-Responsive Transportation19.341.09622 × 10−5
Disclaimer/Publisher’s Note: The statements, opinions and data contained in all publications are solely those of the individual author(s) and contributor(s) and not of MDPI and/or the editor(s). MDPI and/or the editor(s) disclaim responsibility for any injury to people or property resulting from any ideas, methods, instructions or products referred to in the content.


