
Article

A Refined Kano Model Approach to Sustainable Last-Mile Convenience Services and Customer Satisfaction

1
Institute of Business Studies, Budapest Metropolitan University, 1148 Budapest, Hungary
2
Doctoral School of Economic and Regional Sciences, Hungarian University of Agriculture and Life Sciences, 2100 Gödöllő, Hungary
3
Institute of Agricultural and Food Economics, Hungarian University of Agriculture and Life Sciences, 2100 Gödöllő, Hungary
*
Author to whom correspondence should be addressed.
Logistics 2026, 10(4), 86; https://doi.org/10.3390/logistics10040086
Submission received: 2 February 2026 / Revised: 30 March 2026 / Accepted: 7 April 2026 / Published: 13 April 2026

Abstract

Background: Last-mile logistics is one of the most complex and cost-intensive segments of supply chains, particularly in densely populated urban environments where rising customer expectations, sustainability requirements, and operational constraints increasingly intersect. Despite growing academic interest, empirical evidence remains limited regarding how convenience-related last-mile service attributes influence customer satisfaction, while the sector is undergoing a revolutionary transformation. Methods: This study applies a refined Kano model to classify last-mile convenience services according to their differentiated effects on customer satisfaction. Data were collected through a structured questionnaire administered to active e-commerce users in a metropolitan area. The methodological approach modifies and extends the traditional Kano framework. Results: The findings reveal clear patterns among last-mile service attributes. Online tracking and preferred payment options function as One-dimensional attributes, proportionally influencing customer satisfaction. Time-based delivery, flexible pickup options, and sustainability-oriented service features appear as Attractive attributes, generating additional increases in service value. In contrast, advanced technological solutions such as drone or autonomous vehicle delivery were perceived as Indifferent attributes. These interpretations are further nuanced by the fuzzy approach. Conclusions: The results provide important insights and validation for consumer-centered service design and support the prioritization of investments aimed at developing sustainable and customer-oriented last-mile logistics systems.

1. Introduction

This study examines how convenience shapes customer satisfaction (customer service level) in last-mile logistics—an increasingly critical factor as e-commerce expands and consumer expectations rise [1]. Last-mile delivery represents the most costly and operationally complex segment of the supply chain, particularly in urban areas where demand for speed and flexibility drives the adoption of services and trends such as same-day delivery, adjustable time windows, and hybrid models including Click-and-Collect or parcel locker systems [2].
Sustainability has become an indispensable factor today. Companies increasingly employ electric vehicles, bicycle couriers, and environmentally friendly packaging to reduce environmental impact, while digital solutions—such as real-time tracking—enhance transparency and reliability. The most prominent development trend in last-mile logistics is the growing demand for fast and flexible delivery convenience options, which inevitably increases service complexity and operational costs. At the same time, this demand appears to conflict with the broader transformation of the sector, where companies must balance sustainability, efficiency, and technological innovation under intensifying societal expectations and regulatory pressures.
In this study, sustainability attributes are not treated merely as contextual trends affecting logistics, but rather as a fundamental dimension of last-mile service design. Sustainable last-mile convenience services refer to delivery solutions that are closely connected to consumer convenience and may in some cases interact with it in a conflicting manner, potentially reducing perceived convenience while simultaneously exerting beneficial effects on environmental impact by lowering harmful emissions and improving the efficiency of urban logistics systems. A specific characteristic of sustainability-oriented services within the last-mile logistics context is that they typically integrate three interrelated dimensions: (1) environmental sustainability (e.g., low-emission vehicles, lower-impact or more resource-efficient delivery solutions, or environmentally friendly packaging), (2) economic efficiency (e.g., less wasteful routing practices, consolidated and distributed delivery systems), and (3) societal impacts (e.g., it includes the recognition that last-mile deliveries represent a significant contributor to urban congestion, parking pressure, and dynamic stopping patterns, while also influencing broader aspects of urban quality of life). From a service design perspective, sustainability should therefore not be interpreted solely as a trade-off with convenience, but also as an additional value dimension that increasingly shapes customer expectations. In rapidly evolving urban e-commerce environments, many delivery attributes simultaneously influence convenience, environmental performance, and perceived service quality. Accordingly, based on the above considerations, sustainable last-mile convenience services can therefore be defined as delivery solutions that integrate last-mile logistics operations from environmental, economic, and societal sustainability perspectives. While these solutions may in some cases appear as constraints on consumer convenience, their objective is to reduce environmental impact, improve the efficiency of urban logistics systems, and provide broader societal benefits.
By applying a refined Kano model, the study classifies last-mile service attributes according to their impact on customer satisfaction. In doing so, it extends service quality research into the domain of logistics and provides practical guidance for managers and policymakers in developing customer-centric and sustainable delivery strategies. As an example, the review article by Kilibarda et al. [3] examined research on logistics service quality and, based on the critical research issues analyzed, found that studies focusing on customer expectations, perceived service quality, customer satisfaction, and loyalty accounted for approximately 72% of the reviewed publications from a customer-oriented perspective in both B2B and B2C contexts. In contrast, research addressing the quality of logistics processes, quality management, partnerships, and collaboration—representing a service-provider-oriented perspective—accounted for 18% of the studies. At the same time, we found that consumer convenience and last-mile logistics do not appear directly in this body of literature, and that the interpretation and analysis of consumers’ psychological expectations are negligible. The number of Kano-based publications within the examined scope was only six. As highlighted in this review article, the dimensions of logistics service quality (LSQ) are diverse and lack standardization; research in this field is largely customer-oriented and tends to focus on topics such as operational efficiency and time-related performance. Existing studies primarily measure outcomes but rarely examine the underlying causes of service quality. Moreover, there is a lack of deeper analysis of fundamental drivers and dynamically evolving service attributes, as well as their interrelations and their connections to sustainability-oriented services—an area that remains underexplored, particularly in rapidly changing logistics environments. There is no clear consensus on how these attributes relate to one another or what constitutes emerging trends, (a gap which also confirmed by this review study).
In the context of last-mile logistics, this limitation becomes particularly critical, as sustainability and service convenience are inherently intertwined—indeed, they can be considered inseparable concepts. In essence, almost every satisfaction-related attribute carries significant sustainability implications. Sustainability-oriented solutions such as electric vehicles, parcel lockers, or consolidated delivery systems simultaneously influence operational efficiency, environmental impact, and customer experience. These interventions often involve trade-offs: for instance, parcel lockers may enhance environmental efficiency while potentially reducing perceived convenience.
The evaluation and empirical validation of the relationships between these dimensions remain underrepresented in the literature. It is still unclear how these attributes contribute asymmetrically to customer satisfaction, which constitutes a core principle of the Kano methodology. Consequently, analyzing sustainability within a static service quality framework may lead to misleading conclusions regarding its actual impact on customer satisfaction.
The Kano model has been widely used in service quality analysis; however, (1) it has rarely been applied in the context of last-mile logistics, and even less frequently (2) in connection with sustainability-related attributes, which would allow a more complex evaluation of service attributes. Such an approach also recognizes that convenience dimensions (such as speed, flexibility, and delivery modes) and sustainability considerations are not independent factors but rather multidimensional systems, which help explain the convenience–sustainability paradox in last-mile logistics. Furthermore, we identify a clear research gap in (3) the limited incorporation of the consumer perspective, which examines these attributes from the viewpoint of the end user rather than as elements of a provider-side service portfolio. An additional research gap is (4) the limited application of the Kano model in the last-mile context, as well as (5) the need to address methodological shortcomings associated with the traditional Kano method.
To address these research gaps, and in line with the conceptual framework of this study, the present research applies a refined Kano framework to examine how convenience- and sustainability-related service attributes interact within the context of last-mile logistics. The Kano model is particularly well-suited for examining last-mile logistics convenience services in urban e-commerce environments, as the classification of service types enables the development of practical service design priorities, while explicitly capturing the asymmetric and non-linear relationships between service attributes and customer satisfaction [4,5]. In contrast to traditional linear service quality models, the Kano framework allows attributes to be differentiated according to their distinct satisfaction effects (Must-be, One-dimensional, Attractive, and Indifferent), which is especially relevant for the evaluation and customization of high-complexity logistics performance in urban last-mile contexts characterized by congestion and sustainability constraints. Applying the Kano model in this context constitutes a theoretical contribution by offering a sustainability-oriented interpretation of Kano categories [6] and by enabling the analysis of category shifts and ambiguous attribute classifications—particularly within the refined interpretative framework proposed in this study. The service quality and operations management literature emphasizes the Kano model’s ability to capture asymmetric and non-linear relationships between service attributes and customer satisfaction. The refinement applied in this study addresses three conceptual challenges that arise when using the traditional Kano model.
  • The original questioning approach may induce implicit cognitive dissonance, particularly in the case of less familiar or less frequently used services, as it simultaneously requires respondents to evaluate and rank preferences (e.g., like, must-be, can live with, etc.). In contrast, we propose a simpler Likert-based question structure, which reduces cognitive burden and emotional bias.
  • The contradiction between the qualitative nature of the Kano concept and its discrete, matrix-based classification. To address this, we introduce a continuous two-dimensional agreement surface, which enables a more nuanced interpretation and better aligns with the original qualitative intent of the Kano model.
  • In our interpretation, Kano categories should not be treated as strictly discrete classes. The evaluation of convenience-related attributes often exhibits transitional characteristics between categories, aggregates multiple layers of consumer perceptions, and may change rapidly in dynamic service environments. Furthermore, the interpretation of attribute positions near category boundaries remains hidden in a purely discrete (crisp) classification framework. For example, in urban e-commerce logistics, attributes such as delivery flexibility, tracking transparency, or sustainability-related solutions may simultaneously exhibit characteristics of Attractive, One-dimensional, or emerging Must-be categories. Therefore, the refined framework interprets Kano categories as overlapping satisfaction domains rather than strictly separated classes.
Kano-based categorization highlights fundamental trade-offs inherent in sustainable last-mile service design. Attributes that enhance immediacy and flexibility may increase customer satisfaction, while simultaneously intensifying environmental or operational burdens. Conversely, sustainability-oriented measures may initially be perceived as neutral or performance-related attributes, but may gain prominence over time and shift toward attractive or even must-be categories as urban consumer expectations evolve. In this sense, the Kano model goes beyond simple classification and functions as a prioritization and decision-structuring tool that supports managerial decision-making in allocating limited resources across competing service attributes. Prior research has demonstrated that Kano-based approaches effectively translate customer perceptions into concrete service design priorities and strategic decisions, particularly in service-intensive contexts, including logistics [4,5,6,7]. Accordingly, the present study extends the theoretical applicability of the Kano model by demonstrating its decision-support value in sustainable urban last-mile logistics service design. For example, within the refined Kano framework applied in this study, sustainability-related delivery attributes are primarily identified as Attractive quality elements. These attributes provide additional customer value while their absence does not necessarily cause dissatisfaction; therefore, they do not yet function as universal baseline expectations (Must-be requirements). However, the analysis indicates an observable tendency toward such a transition, suggesting that decision-makers should approach these attributes with particular strategic attention.
In light of these considerations and the identified research gaps, the following research questions are formulated.
  • RQ1: How can last-mile logistics convenience services—including sustainability-related characteristics—be systematically identified, and to what extent do they influence consumer satisfaction?
  • RQ2: How can last-mile logistics convenience service attributes—including sustainability-related characteristics—be classified within the refined Kano framework?
  • RQ3: Which convenience services exhibit transitional characteristics?
  • RQ4: What role do sustainability-related last-mile solutions play in shaping customer expectations and satisfaction categories?
  • RQ5: How do consumers evaluate future-oriented, high-technology last-mile innovations?
  • RQ6: How can the methodological framework of the Kano model be refined to better capture transitional and ambiguous satisfaction effects in last-mile logistics convenience services?
Research Objectives (where O1–O5 focus on empirical investigation, while O6 addresses methodological refinement):
  • O1: To systematically map and typologize last-mile logistics convenience services including sustainability-related delivery attributes from a consumer perspective.
  • O2: To empirically apply the refined Kano model in order to assess how convenience and sustainability-related service attributes influence consumer satisfaction.
  • O3: To identify and verify convenience services that currently provide multiplicative and Attractive competitive advantages, as well as those that exhibit transitional characteristics and are beginning to evolve into must-be expectations.
  • O4: To examine the actual role of sustainability-related delivery solutions in shaping customer satisfaction and expectation structures in last-mile logistics.
  • O5: To investigate the actual impact of future-oriented technological innovations on consumer satisfaction.
  • O6: To contribute to the methodological advancement of logistics service quality research and Kano theory by presenting a refined model.

2. Literature Review

2.1. Last-Mile Delivery and Consumer Preferences in Urban Distribution

Last-mile logistics—the segment of the supply chain responsible for transporting products from distribution centers to end consumers—has become one of the most critical and costly challenges in modern commerce. This stage accounts for more than half of total transportation costs [8], making it not only the most expensive but also the most resource-intensive segment, whose criticality directly contributes to shaping customer satisfaction. Performance in this stage becomes particularly complex in urban environments, where traffic congestion, limited parking availability, zoning regulations (restrictions), and road construction all contribute to unpredictable delivery times and rising operational costs [9]. In addition, heavy vehicles often face restricted access to city centers, creating further obstacles to the efficient handling of high-volume deliveries. These factors explain why last-mile logistics is frequently regarded as the “bottleneck” of the supply chain –not only from a logistical standpoint but also in terms of service performance quality.
In parallel with these structural challenges, consumer expectations are also undergoing continuous transformation. The explosive growth of e-commerce has not only increased the volume of parcel deliveries but has also reshaped customer priorities. Today’s consumers expect convenience to be an integral part of the delivery process, seeking fast, flexible, and reliable solutions [10]. Same-day or instant delivery, adjustable delivery time windows, and flexible pickup options—such as parcel lockers and Click-and-Collect services—have rapidly evolved from differentiating features (key differentiator or competitive advantage factor) into basic expectations [11]. Meanwhile, real-time notifications and tracking technologies have also become industry standards, enabling transparency and predictability throughout the entire delivery process [12,13]. This latter trend further reinforces the notion that customer satisfaction is now more closely tied to last-mile delivery strategies (and logistics service level) than ever before.
While these developments clearly enhance consumer satisfaction and trust, they also introduce new layers of complexity and operational burden. Logistics service providers must manage increasingly fragmented delivery schedules and reorganize the failed deliveries (and now, combined with reverse logistics at an entirely new level—the authors’ note) while simultaneously absorbing the additional costs associated with maintaining or increasing flexibility, as demonstrated by the work of Esper et al. [14], which examined the relationship between higher satisfaction levels and the online experience. The article, despite acknowledging the explosive growth of e-commerce, does not examine the emerging convenience service attributes or the paradox between delivery flexibility and operational efficiency.
Alongside convenience, sustainability is also gaining increasing prominence. Growing environmental awareness and stricter regulatory requirements are encouraging companies to reduce their emissions and adopt greener practices [15]. The study highlights the challenge of balancing sustainability measures with operational efficiency and points to the need for further empirical investigation in this area. Electric vehicles, bicycle couriers, and environmentally friendly packaging solutions have now become established tools for reducing the ecological footprint of urban logistics. According to surveys, up to 60% of consumers are willing to pay more for sustainability-oriented delivery options [16], illustrating the growing market significance of “green” services [17]. The authors also identify significant differences in carbon intensity among delivery models and recognize an indirect relationship—and potential tension—between these and consumer delivery preferences; however, this relationship is not explored in detail. These trends, however, also pose new challenges for practice and are drastically reshaping the interpretive categories and performance dimensions of customer satisfaction and customer service levels in logistics—an evolution that must also be recognized by practitioners and industry stakeholders. As e-commerce continues to grow in volume, sustainable delivery solutions will be necessary not only from an ecological perspective but also as a source of strategic advantage, as they help companies align more accurately with consumers’ perceived value dimensions and achieve long-term competitiveness [18,19]. We share the view that the rapid diffusion of electric vehicles and the increased use of non-motorized transport in many cities across Southeast Asia, China, and India is primarily driven by cost-related factors at the macro level. However, from the perspective of urban residents as end users, improvements in air quality and reductions in traffic noise have produced perceptible benefits at both the micro and macro levels in the short term—changes that have already become evident in several Chinese metropolises over the past decade. Such changes are supported by consumers from a demand-side perspective and provided they do not impose a substantial additional cost burden, are also reflected in their actual choices, which may constitute a competitive advantage.
Technological innovations are further accelerating the radical transformation (indeed, revolution) of last-mile logistics. The development of drones, autonomous robot vehicles, and advanced tracking systems is opening entirely new possibilities for enhancing efficiency and responsiveness, which has become not only an economic necessity but increasingly a customer expectation—particularly in the organization of last-mile delivery. Although these technologies are still largely in the experimental stage, their potential to reduce costs and shorten delivery times is already widely recognized [20,21]. Nevertheless, these studies also exemplify a common tendency in the literature to prioritize the examination of the adoption and acceptance mechanisms of autonomous delivery technologies, while emphasizing the operational advantages of technological and organizational innovations, whereas a more detailed and comparative analysis of consumer preferences remains insufficiently addressed. Moreover, data analytics, artificial intelligence (AI), and dynamic route planning enable companies to respond in real time to traffic disruptions and changing consumer demands, thereby improving both cost efficiency and environmental performance [22].
New models—such as micromobility solutions and crowd-based delivery platforms (e.g., Uber Eats, Wolt)—provide additional flexibility in densely built urban environments and illustrate how digitalization and the consumer-driven platform economy are reshaping the delivery ecosystem [23,24].
Taken together, these trends depict a sector in constant flux—one that must continually balance efficiency, innovation, sustainability, and shifting customer expectations. Although previous studies have examined individual aspects of last-mile logistics—such as delivery speed, alternative delivery technologies, green solutions, or consumer acceptance—these dimensions are often treated separately rather than as interacting service attributes within a unified customer satisfaction framework. Consequently, earlier linear service quality models are unable to capture the non-linear or asymmetric satisfaction effects and prioritization patterns that arise from trade-offs between convenience, flexibility, speed, and sustainability-oriented delivery solutions.
This limitation is particularly relevant in urban e-commerce contexts, where operational efficiency, environmental expectations, and customer control frequently intersect. For this reason, the application of a refined Kano model is methodologically justified, as it enables the differentiated classification of service attributes beyond linear service quality assumptions and allows the identification of whether a given feature functions as a basic expectation, a proportional performance factor, or a value-adding attractive element.
Research interest in last-mile logistics is increasing, the consumer perspective on last-mile convenience service needs remains relatively underexplored, representing both a scientific gap and a source of uncertainty. Most studies focus on operational efficiency and cost optimization, while limited empirical evidence exists regarding how individual convenience factors shape customer satisfaction—an aspect that ultimately defines the most critical direction for the sector’s development within complex urban infrastructures and for society at large, particularly when this development is intertwined with sustainability and cutting-edge technological innovation.
Although the Kano model is a widely used tool in service quality research [25,26,27,28,29], its application in the field of last-mile logistics remains highly limited—only a single study has incorporated it into this context [30]. The referenced study provides a rapid, purely descriptive evaluation of a single company without critical assessment, while relying on overly general categories such as safety and convenience without interpretative clarification. Moreover, it applies a simple majority-based classification approach that implicitly assumes the presence of sample bias and does not account for its potentially distorting effects.
These gaps limit both theoretical understanding and practical guidance in developing consumer-centric and sustainable delivery strategies.
Building on this background, the present study applies a revised and refined Kano model to systematically examine how individual last-mile convenience services relate to consumer satisfaction. Our research contributes to academic discourse in several ways. First, it extends the application of the Kano framework to the domains of logistics and sustainability, offering new insights into evolving consumer preferences within last-mile logistics. Second, it seeks to address and improve upon previous methodological limitations in the use of the Kano model, thereby enhancing its reliability.
A further aim of the research is to ensure that its empirically validated results can offer practical guidance for managers and policymakers on how to prioritize delivery attributes in order to maximize consumer satisfaction while simultaneously supporting innovative and environmentally sustainable urban logistics strategies.
The remainder of the paper reviews the relevant literature, presents the methodology, outlines the empirical findings, and subsequently discusses the theoretical and practical implications.

2.2. Convenience Services in Last-Mile Logistics

As a synthesis of the literature review, and building on the existing sources while extending them, a comprehensive taxonomy of convenience services emerging within last-mile logistics has been developed (see Table 1). This taxonomy table identifies the most important categories and guiding trends. These services are typically provided by express delivery operators that handle the distribution of non-palletized parcels under 50 kg, commonly referred to as CEP (Courier-Express-Parcel) service providers [31].
As shown, time-based services continue to play a central role, as time-constrained consumers increasingly demand fast and accurate delivery. However, logistics performance today extends far beyond basic delivery parameters, encompassing value-added services that are gaining prominence and emerging as key sources of competitive advantage. In the realm of time-based delivery competition, available options range from standard and express delivery to same-day, next-day, and scheduled services [46]. More recent trends include instant delivery, flexible time windows, and subscription-based models.
Taken together, the above categories illustrate the rapid evolution of last-mile logistics. Service providers must integrate convenience, sustainability, and flexibility to meet rising consumer expectations while simultaneously ensuring operational efficiency. As shown in the table, Eco-friendly and sustainability-related last-mile logistics services contribute to sustainability through different mechanisms and represent interventions with varying levels of practical impact.
Although attention to last-mile logistics has been increasing, existing research has predominantly focused on operational efficiency and cost reduction, while consumer perspectives have received comparatively little emphasis. Empirical evidence remains limited regarding how individual convenience attributes influence customer satisfaction—particularly when combined with sustainability considerations and technological innovation. Using the advanced search function of the Web of Science database, and focusing on logistics and delivery in relation to operational efficiency and cost reduction, a total of 90 publications were identified over the past ten years using the following search query:
TS = (“service quality” AND (“logistics” OR “distribution”) AND (“efficiency” OR “cost reduction” OR “operational” OR “optimization”) AND (“review” OR “survey”))
In contrast, when the search was refined to last-mile logistics and explicitly included consumer-oriented aspects–typically representing a broader conceptual domain–the number of relevant studies dropped substantially to only 14, of which 8 were published after 2023:
TS = (“service quality” AND ((“last mile” OR “last-mile”) AND (“logistics” OR “distribution”)) AND (“customer satisfaction” OR “consumer needs” OR “convenience” OR “user experience”) AND (“review” OR “survey” OR “state-of-the-art”))
After examining the 14 studies, it becomes evident that they rarely address sustainability trade-offs, the prioritization of attributes, or the asymmetric nature of satisfaction effects. This limits the understanding of how convenience, speed, and sustainability interact in complex ways. This analytical gap therefore justifies a more thorough examination of convenience services.
Accordingly, in the model we aim to develop, customer-oriented convenience-related services—understood in the above sense—are placed at the center of last-mile logistics evaluation, rather than external or contextual factors. Using lexicographic analytical methods, we developed a taxonomy of convenience services, providing a theory-driven and structured categorization of delivery attributes.
The Kano model, although widely applied in service quality research, has been used only rarely in the context of last-mile delivery; only a single prior study has attempted to apply it in this domain. This knowledge gap constrains both theoretical advancement and managerial practice. Existing studies seldom reflect the dynamic and sustainability-driven decision environment characteristic of e-commerce logistics. The present study seeks to address this gap by employing the Kano model to classify convenience-based decision dynamics and sustainability considerations alongside the characteristic categories of consumer behavior.
This study employs a refined Kano model to systematically examine how individual convenience attributes influence consumer satisfaction with last-mile logistics. The research has three objectives. First, it classifies consumers’ perceptions of time-based delivery, flexible pickup, value-added services, and sustainability-oriented solutions. Second, it identifies which attributes most strongly enhance satisfaction and differentiate service providers in competitive e-commerce markets. Third, it offers practical guidance for logistics managers and decision-makers in designing a more consumer-centric, sustainable, and technologically adaptive delivery system. Fourth, it helps address complex questions such as how Eco-friendly and sustainability-related convenience services behave within the Kano categories, what their transitional character means in practice, and what kind of dynamic trajectories they follow across Kano satisfaction categories.
The present analysis contributes to the service quality literature, enriches logistics research, and offers practical guidance for those seeking to align consumer convenience with environmental responsibility and urban mobility objectives.

2.3. Societal Sustainability Implications of E-Commerce

In the context of this study, the concept of socially sustainable e-commerce is discussed primarily to highlight the broader societal challenges generated by the rapid expansion of e-commerce, which increasingly manifest in urban logistics systems and last-mile delivery operations.
One of the most promising avenues in e-commerce is the exploration and alignment of the various dimensions of sustainable development with operational practices, as well as the establishment of a balance among them. Sustainable development in e-commerce can enhance operational efficiency, minimize resource consumption, reduce costs, generate social benefits through less harmful products and services, and create additional employment opportunities [47]. The article examines sustainable e-commerce models at both societal and macro levels; however, it does not provide a detailed comparison with specific service attributes or their portfolios. E-commerce contributes to sustainable development through measures such as energy efficiency, digitalization and collaborative technologies, the reduction in delivery time (“click to order”), and improvements in supply chain efficiency [48].
From a practical perspective, convenience attributes should be prioritized to maximize customer satisfaction and strengthen competitiveness [12]. For example, preferred payment methods and real-time tracking emerge as critical features, indicating that service providers must establish seamless digital platforms and reliable monitoring systems as fundamental investments [22,45]. At the same time, attractive services such as flexible time windows, sustainable delivery modes, and value-added offerings provide opportunities for differentiation within highly competitive e-commerce markets. By prioritizing the development of these attributes, logistics providers can increase customer loyalty [10], reduce churn, and improve their competitive positioning.
The concept of sustainable e-commerce is not yet clearly defined. According to a general perspective offered by [49], “e-commerce should be conducted in a way that minimizes the environmental footprint of technology use while supporting products or services that offer environmental and social benefits compared to traditional alternatives”. Policymakers can draw on research findings to develop regulatory and supportive frameworks that foster innovation while ensuring accessibility and equity. Incentives aimed at promoting green transportation solutions—such as support for electric vehicle fleets or urban logistics centers—not only reduce environmental impact but also enhance the competitiveness of the entire sector [18]. Integrating consumer-centered service evaluations into urban mobility planning enables policymakers to align the public-interest goals of efficiency and sustainability with overall quality of life [12].
From a societal perspective, sustainable delivery services can encourage more responsible consumer behavior. Consumers are increasingly assigning greater importance to sustainability-oriented solutions, and research shows that many are willing to pay a premium for sustainable delivery options [16]. The visible integration of green practices—such as electric vehicles, recyclable packaging, or shared urban distribution centers—not only reduces emissions but also signals corporate responsibility, thereby shaping consumer norms and preferences [15,19,50]. Over time, this may accelerate a cultural shift toward low-impact consumption and delivery patterns, where sustainability is no longer a niche preference but a mainstream expectation [41].
The growth of e-commerce has led to an increase in the number of deliveries made directly to customers, resulting in high CO2 emissions and exacerbated urban congestion [51]. At the societal level, the widespread adoption of sustainable last-mile solutions contributes to reducing congestion, air pollution, and noise in urban areas. Community-based initiatives—such as crowdfunding projects or shared distribution centers—demonstrate that logistics can evolve into collective systems that generate broader societal benefits [43]. The interaction between consumer demand, corporate innovation, and policy support thus creates a self-reinforcing cycle: the more visible and accessible green services become, the greater their consumer acceptance, which in turn encourages further investment and regulatory support. These societal challenges underline the importance of developing last-mile logistics solutions that balance consumer convenience with environmental and societal sustainability considerations.

2.4. Linkages and Research Domains at the Intersection of Last-Mile Logistics, Customer Satisfaction, and Sustainability

Last-mile logistics represents the final—and increasingly challenging—stage of the supply chain, during which goods are transported from distribution centers to end consumers. Its growing significance stems from its cost intensity and environmental impacts, particularly in urban settings. Empirical research increasingly highlights the role of delivery quality in shaping customer satisfaction [52]: analysis of major Saudi Arabian cities indicates that on-time delivery and tracking significantly enhance online shoppers’ perceptions of service quality and their retention.
Consumer choices and sustainability strategies are reshaping delivery models in European cities. Alternative delivery locations—such as micro-hubs and parcel lockers—reduce failed deliveries and emissions while preserving convenience [53]. Research on retailers’ value propositions [54] further emphasizes that aligning last-mile strategies with sustainability creates competitive advantage and enhances customer loyalty.
These findings highlight three interconnected dimensions in sustainable last-mile logistics: convenience, satisfaction, and sustainability. Convenience encompasses speed, tracking accuracy, and flexible pickup options (as well as value-added services), all of which enhance perceived service quality [15,53]. Satisfaction—often driven by delivery reliability and transparency—is shaped by consumers’ perceptions of service performance and responsiveness [54,55]. Sustainability involves reducing emissions through green vehicles, low carbon–intensity infrastructure, and optimized routing, simultaneously improving operational efficiency and societal acceptance [56]. Sharing the above perspective, this study considers sustainability-oriented delivery service types (see Table 1—Eco-friendly and sustainability-related services) as solutions addressing the same fundamental logistical challenge and its negative consequences: reducing CO2 emissions, mitigating urban congestion, and improving energy and resource efficiency in urban logistics systems.
Taken together, these dimensions suggest that firms should not treat customer satisfaction and sustainability as separate objectives, but rather integrate them into a unified last-mile strategy [57].
The literature remains incomplete in examining convenience attributes and customer satisfaction within a sustainability-oriented framework. We still lack empirical evidence supporting the complex perspective that Eco-friendly, and sustainability-related convenience services initially appear in the Attractive service quality category and only later evolve into basic expectations (Must-be category) as environmental awareness and regulatory pressures increase or as a supportive institutional environment emerges.
Previous research has typically treated operational and environmental performance separately [55,56]. Few studies systematically analyze how individual attributes—such as time windows, delivery locations, or payment flexibility—jointly influence satisfaction and sustainability outcomes. This new approach builds on emerging research that integrates environmental and behavioral science insights into logistics service design [53,57].

3. Materials and Methods

3.1. Description of the Refined Kano Model

The original purpose of the Kano model was to categorize and prioritize customer requirements, thereby providing a more precise understanding of the factors that influence different levels of customer satisfaction. Noriaki Kano et al.’s [58] seminal study sought to offer a deeper analysis of consumers’ expectations regarding products and services, and to demonstrate that customer satisfaction is neither a linear nor a one-dimensional function of service performance. The analysis distinguishes four plus one types of product or service attributes: (1) Must-be attributes (features), which represent basic expectations whose absence causes dissatisfaction, whereas their presence does not generate satisfaction because they are taken for granted; (2) One-dimensional performance attributes, for which higher performance increases customer satisfaction proportionally, while lower performance reduces it to a similar extent; (3) Attractive attributes, which customers do not necessarily expect, but whose presence produces disproportionately high satisfaction, and whose absence does not create dissatisfaction; and (4) Indifferent (or neutral) attributes, which customers do not care about and which have no impact on satisfaction regardless of whether they are present or absent [58].
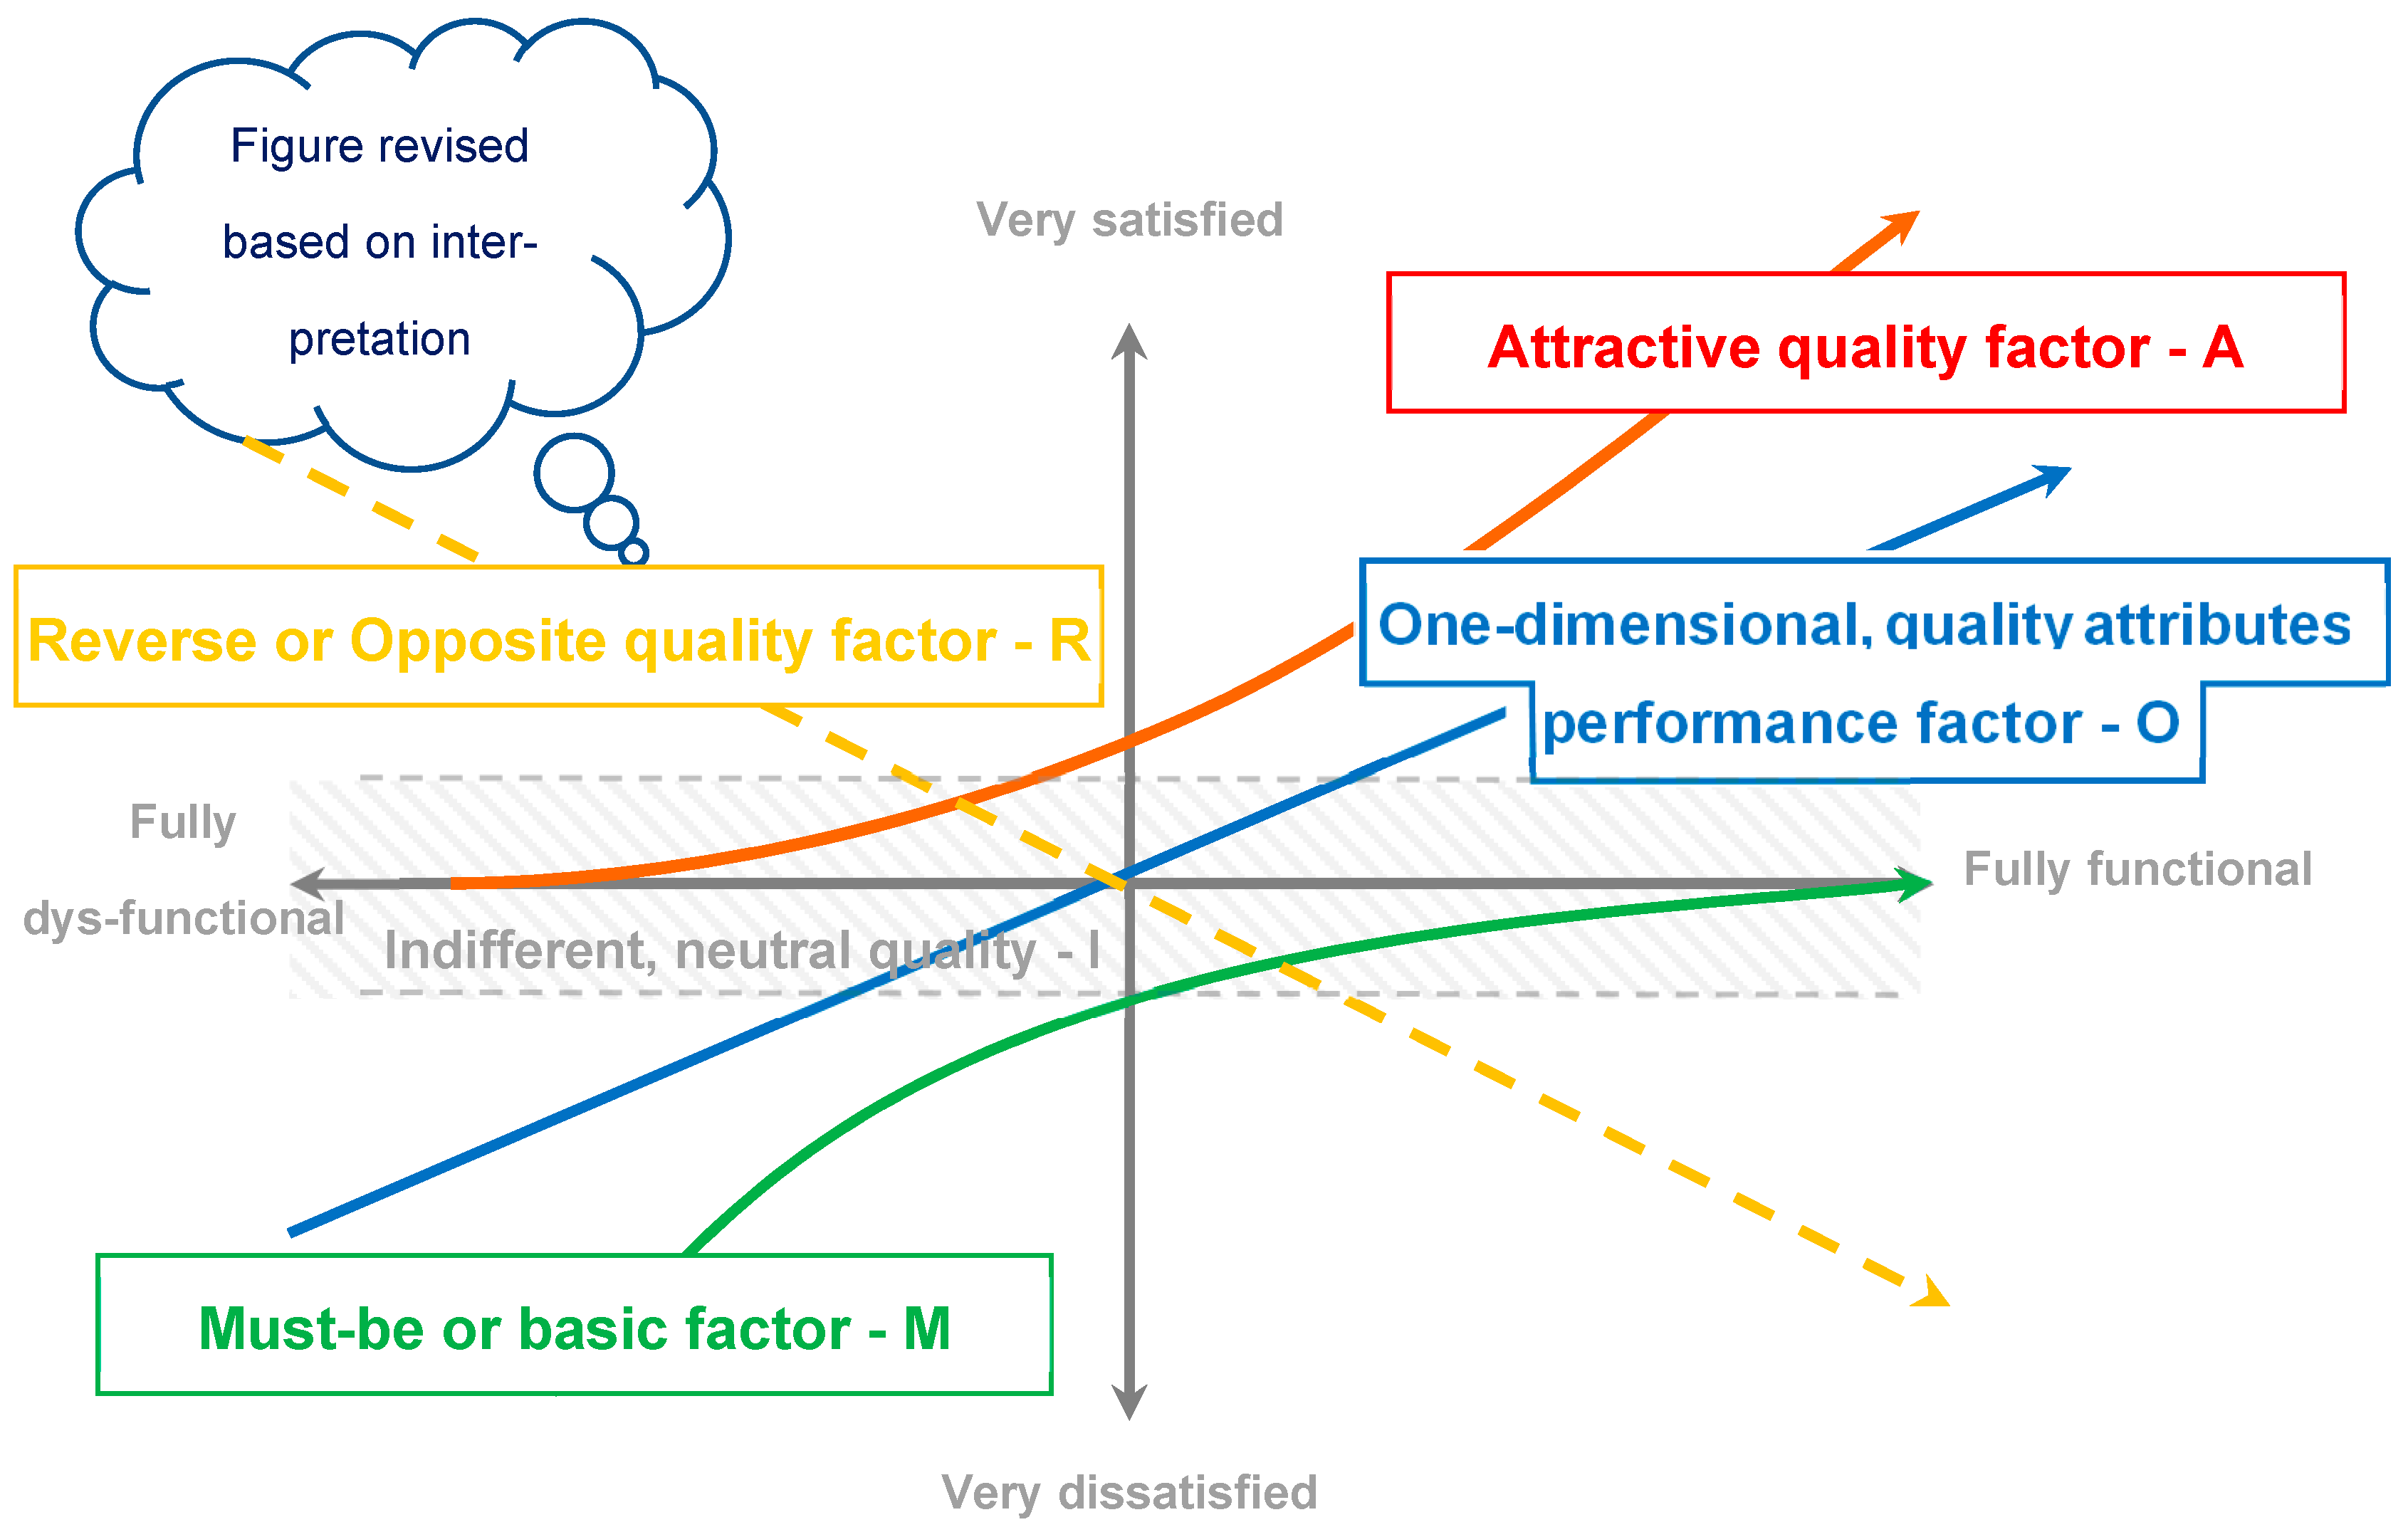
In the Kano model, product attributes can be positioned within a coordinate system. The y-axis represents the level of customer excitement, while the x-axis reflects the degree or level of requirement fulfillment or realization (see Figure 1). The Kano model is applied most effectively through a questionnaire-based survey method. During the assessment, respondents are presented with one functional question (“How would you feel if the product/service had this attribute?”) and one dysfunctional question (“How would you feel if the product/service did not have this attribute?”).
According to the literature, both the functional and dysfunctional dimensions are typically evaluated using a five-point scale. The combination of the two responses is then classified qualitatively [60] using an evaluation table—also referred to as a discrete membership table (see Table 2)—which determines the attribute category into which the response falls. An interesting feature of the method is that the five response categories correspond directly to the classification illustrated in Figure 1. The categories are as follows [59]. We consider the works of the cited authors to be foundational analytical contributions that synthesize the core principles, development, and most significant directions of the Kano methodology (original model interpretation).
Functional statements:
1—I like this feature included.
2—I need this feature included.
3—I am neutral about this feature.
4—I can live with including this feature.
5—I dislike including this feature.
Dysfunctional statements:
1—I like this feature omitted.
2—I need this feature omitted.
3—I am neutral about this feature.
4—I can live with omitting this feature.
5—I dislike omitting this feature.
As shown, these statements (which also represent ordinal scale categories) are semantically associated with the A, M, I, O, and R classifications. For example, the second statement can be linked to the Must-be category, stemming from two distinct attitudes or habitual perspectives. The categorization of response outcomes is enabled by the evaluation table (see Table 2 and Table 3) [59].
Given the multitude of Kano-model variants (there is no single unified version of the Kano model or a standard type of Kano evaluation table) and the various methodological adaptations presented in the literature [59], product attributes can be classified into five fundamental categories based on respondents’ evaluations, typically through some form of statistical aggregation. However, two important considerations must be emphasized. (1) The classification of individual product attributes is not static; it may evolve over time. Kano himself noted this character, and several authors have attempted to integrate this dynamic aspect into the model [59]. An attribute that is initially attractive may gradually become a One-dimensional attribute and eventually a Must-be requirement [61]. (2) Shahin et al. [59] also highlight that respondents participating in Kano evaluations must be trained in the structure and interpretation of the model categories. Furthermore, it can be argued that interpreting the semantic meaning of the ordinal-scale statements used in the model may be challenging for respondents without substantial expertise. Different individuals may rely on entirely different mental logics when imagining or evaluating purchase decisions and preferences, making coherent responses difficult to obtain.
For instance, the literature shows that assessing the extent to which a given product attribute satisfies customer needs (particularly if one assumes that the categories may represent dynamic transitions) can be inherently difficult. Therefore, respondents are often instructed to classify an attribute as Indifferent if they are unable to determine whether it should be placed in the Must-be or Attractive categories [59]. It should also be noted that a cognitive contradiction arises from the fact that categories (1) Attractive motivation and (2) Must-be necessity motivation are not hierarchical levels of the same construct—just as categories (3) One-dimensional performance way of thinking and (4) Reverse or contradictory one-dimensional thinking are likewise not graded levels of each other. This mismatch can generate a form of emotional dissonance in respondents, who may unintentionally mix up hierarchical (scale-based) thinking with the categorical logic of the Kano model. Without expert knowledge, everyday respondents often cannot resolve this tension.
We note that these methodological challenges—and the associated scientific uncertainties—have led us to develop an entirely new methodological approach, stepping back to the foundational idea of the original Kano model and reinterpreting it. The problem has been further complicated by the substantial evolution of the model over the years: during this period, Shahin et al. [59] introduced a more complex and accurate multi-dimensional version that allows distinctions among sublevels within each category and enables a more realistic representation of the curves, with more plausible starting and ending points as well as varying slopes—yet still purely qualitative in nature. One possible way to incorporate quantitative measurement is to assign numerical scales to the levels of customer satisfaction or dissatisfaction [62]. However, even with such extensions, the resulting Kano categories remain qualitative and cannot accurately capture the degree to which customers are satisfied [7]. The classification of customer needs—elicited through subjective opinion-based assessments—into one of the four categories remains inherently ambiguous, as the meanings of the categories are not unequivocally defined. Consequently, assignment is not straightforward, even when using discrete evaluation tables. (These issues simultaneously represent some of the key criticisms of the Kano methodology.)
To address these issues, we introduce a new, modified version of the Kano model along with a revised evaluation table that differs substantially from previous approaches and seeks to overcome the limitations outlined above, particularly the challenges associated with interpreting satisfaction levels. To achieve this, we return to an earlier version of the Kano model and reinterpret it, employing a different type of customer inquiry as the basis for our method.
Based on the authors’ proposal, the traditional Kano question types were abandoned and replaced with a much more easily interpretable and widely used five-point symmetric ordinal Likert-scale format. This approach asks respondents only to indicate the degree to which they would be satisfied with the presence or absence of a given option. The scale thus measures the two sides of satisfaction far more reliably and in a way that is easier for respondents to answer, while the functional or dysfunctional nature of the attribute is embedded directly in the wording of the question itself. For example: Functional question: How would you feel if the …XY… option (feature or service possibility) were available in … [this or that context]? Dysfunctional question: How would you feel if the …XY… option (feature or service possibility) were not available in … [this or that context]?
Responses identical for both the functional and dysfunctional questions:
1—I would be very satisfied
2—I would be satisfied
3—I would be neutral
4—I would be dissatisfied
5—I would be very dissatisfied
It is important to note that we did not aim to measure variations in satisfaction intensity, since within the domain of last-mile logistics even the identification of the general character and directional trend of newer service types (for example, drone-based home delivery) constitutes a meaningful contribution, enabling us to provide clearer insights for market practitioners.
In developing our model, we took into account that the satisfaction categories are closely related to Herzberg’s two-factor motivation model, in which factors on both sides of neutrality are distinguished as either “hygiene” or “motivator” elements. Hygiene factors correspond to the Must-be category; their absence leads to increasing (and not necessarily proportional) dissatisfaction, while their presence does not generate satisfaction—only a certain level of neutrality. Motivator factors align with the Attractive category, where it is evident that a unit increase in performance yields a more-than-proportional increase in satisfaction—the well-known WOW effect. In contrast, One-dimensional performance factors behave proportionally: each incremental investment in these attributes results in a corresponding, linear increase in satisfaction. Reverse or negative factors represent one-dimensional attributes that users disagree with or evaluate negatively, where reducing their presence leads to increased satisfaction.
The motivation for modifying the evaluation table was that the interpretive domain had fundamentally changed, necessitating its alignment with the dimensions of the Likert scale. The coefficients in the revised table were determined qualitatively on the basis of semantic meaning, similar to the approach applied in the original Kano model. As expected, logical contradictions appear in the upper-left and lower-right corners, marked with Q. When, by definition, the presence of a feature generates strong satisfaction while its absence does not produce dissatisfaction, an Attractive relationship is implied (see Table 4—upper central area, slightly to the left). Conversely, when the absence of a feature generates strong dissatisfaction, but its presence does not produce an equivalent level of satisfaction, a Must-be relationship is implied (see Table 4—upper right section). Where a clear and opposing antagonistic relationship appears, it corresponds to a One-dimensional performance relationship (see Table 4—upper right corner). Naturally, the center of the table represents the Indifferent category, extending along the diagonal, while the lower-left corner aligns with the Reverse one-dimensional relationship.
Although the inclusion table defined here is clearly discrete, our assumption is that these categories exhibit more diffuse boundaries, owing to the qualitative nature of their definitions.
It is worth noting that the distributions reveal a markedly stronger dominance of the functional positive statements (“that is, what respondents likes or would prefer…”) compared to the dysfunctional statement. While an in-depth examination of this pattern lies beyond the scope of the present study, it is highly plausible that this asymmetry arises from customers’ inherently acquisitive orientation, that is, a motivational predisposition toward gains rather than losses. This disproportionately shapes the resulting distribution table.
In the methodology presented in this study, no explicit measurement of “importance” or importance weights was applied for ranking the examined product or service features (quality factors or attributes), based on the implicit assumption that perceived importance is inherently reflected in satisfaction levels. In the literature, Pouliot [7] and Yang [63] introduced subcategories for expectations, which later studies further refined into subcategories such as highly attractive, less attractive, high added value, low added value, critical, necessary, potential, and indifferent (care-free). Shahin et al. [59] criticized earlier models for inadequately defined starting points of the satisfaction functions. Our assumption is that the results obtained in this study allow for the meaningful grouping of service features without the need to introduce additional subcategories.
The objective of the present research is to develop a categorization framework that reflects the rapidly evolving environment of last-mile logistics. Given the dynamic nature and extraordinarily rapid development of consumer preferences and service characteristics there remains considerable scientific uncertainty in the field. Accordingly, our primary aim is to provide a descriptive exploration and classification of the current landscape rather than to establish causal or hierarchical relationships. Interactions among the identified components, as well as potential hierarchical effects, cannot be fully captured or modeled with sufficient reliability within the framework employed. Therefore, the study focuses on systematic categorization and descriptive analysis, which may serve as a foundation for future model development and empirical validation.
The Kano-based methodological approach presented here enables the classification of service attributes according to their impact on customer satisfaction, without presuming linear or hierarchical relationships. This approach is particularly appropriate in the current environment, where decision-making processes are increasingly shaped by dynamic, convenience-oriented factors and thus require analytical tools that are flexible, rapidly applicable, and adaptive. The assumptions used and taken as the starting point for the present analysis are as follows:
  • The quality categories defined on a qualitative basis are diffuse; the discrete inclusion table describes fuzzy sets with overlapping regions. The resulting categories are therefore neither clear-cut nor strictly discrete, but rather continuous in nature.
  • We assume that the empirical results allow for examining and grouping product or service features without the need to introduce additional subcategories.
  • We assume that individual product or service features evolve dynamically over time and that their categorical classification may shift as customer expectations change. While several authors agree on the possible sequence and direction of such transitions (e.g., the notion that quality itself has a life cycle [59]), our interpretation diverges in that we do not consider these transitions to necessarily follow a predetermined path or life cycle. Instead, we posit that they are primarily shaped by the sometimes erratic fluctuations in consumer preferences. We continue to maintain that respondents—even when provided with guidance—may not reliably interpret original Kano type quality categories in relation to product attributes and potential cognitive dissonances, whereas they are able to provide more dependable assessments regarding their level of satisfaction.
  • We assume that category transitions occur primarily as a function of changing customer expectations and only secondarily as a consequence of firms’ product or service development intentions (customer-centered design) [64,65]
  • We assume that convenience services in last-mile logistics are fundamentally novel and, apart from the most basic distribution and delivery parameters, do not yet possess established, that is, traditional customer expectations.
In our methodology, respondents’ answers were positioned within a continuous membership field based on partial weighted frequencies in order to determine the quality categories in which they reside. The detailed methodology is presented in Section 4, integrated closely with the empirical findings.

3.2. The Author’s Comprehensive Reflections on the Major Shortcomings of the KANO Model

Despite the indisputable theoretical significance of the Kano model, the theory has been subject to substantial criticism. Several authors have questioned the adequacy of its engineering-level functional analysis and function representation, criticizing, for example, the initial points, ordering, and slopes of the theoretical curves, as well as the inconsistent behavior of the evaluation table coding [4,59]. The classification mechanism itself and the related theoretical biases have also been criticized, with multiple alternative approaches proposed in the literature (e.g., the classical Kano questionnaire, direct classification, PRCA, importance grid, among others) [4]. Many authors further highlight the qualitative nature of the data collection as a limitation, as it does not allow for an exact and proportion-preserving quantification of “how much,” while, at the same time, the resulting classification remains overly discrete (A/O/M/I/R/Q) [66]. Another well-documented issue concerns the frequent inconsistencies arising from the paired functional/dysfunctional question structure, which reduces the reliability of the resulting classifications [67]. Moreover, Kano categories are temporally unstable, and strategic conclusions may become rapidly outdated due to the natural transition of attributes from Attractive to One-dimensional and eventually to Must-be (A→O→M) over time [59]. Several authors have therefore argued against strictly discrete interpretations of Kano categories and have proposed fuzzy approaches as a more appropriate alternative [68]. In addition to these well-established issues in the literature, we draw attention to respondent-related biases (i.e., interference arising from subjectivity). First, there is no guarantee that respondents interpret functional and dysfunctional questions symmetrically, which may lead to analytical contradictions. Second, sampling-related issues arise when evaluations rely solely on aggregation and averaging methods or when respondents are directly asked to assign theoretical categories; under such conditions, results become highly dependent on the composition of the sample and on respondents’ levels of expertise and domain-specific experience. Third, the qualitative nature of the Kano model’s theoretical constructs conflicts with assumptions of temporal and contextual invariance. Accordingly, we support dynamically time-adjusted and fuzzy approaches over exact categorical classifications.

3.3. Questionnaire Respondents

Our questionnaire was published on social media platforms between 1 November 2024 and 20 December 2024, and a total of 214 responses were collected. The survey consisted of 12 pairs of questions related to last-mile logistics. In each pair, one item assessed the extent to which respondents consider the presence of a given function or service important (functional statements), while the other examined how problematic they would perceive its absence to be (dysfunctional statements). Responses were recorded using a five-point Likert scale, and the data were analyzed using descriptive statistical methods. The distribution of respondents is presented in the following Table 5.

3.4. Sample Profile and Validity Considerations

The determination of the sample size was based on statistical power analysis. For this purpose, G*Power version 3.1 was applied using a statistical power of 0.80, a significance level (α) of 0.05, a medium effect size of 0.15 according to Cohen’s conventions, and a minimum of 12 predictors, given that 2–3 independent variables were assumed for each Kano attribute. Based on these parameters, the minimum required sample size was 127 respondents (Multiple linear regression, F-test). In order to enhance reliability and robustness, the planned sample size exceeded this minimum requirement by more than 60%, resulting in a target sample of 214 respondents. The size of the underlying population only has a material effect on the results in the case of small, finite populations; in the present study, the population size was sufficiently large, as the Budapest metropolitan area comprises approximately 2 million inhabitants, representing roughly one-fifth of the national population.
To further examine the robustness of the Likert-based Kano categorization, additional distribution-based analyses were conducted. Attribute-level response distributions show strong Top2 “satisfied” concentration patterns for the functional questions, ranging between 61–93%, with several attributes exceeding 80% (e.g., payment options, same-day delivery, and online tracking). At the same time, the proportion of opposite responses is extremely low (typically <2–3%), indicating very small dispersion. Dysfunctional responses also display internal consistency, accompanied by a strong concentration of answers in the neutral range. Chi-square goodness-of-fit tests confirmed that the observed response distributions significantly and strongly differ from random patterns for all attributes (p < 0.001). This indicates that the responses do not follow random distributions but reflect stable and interpretable preference structures.
Entropy and concentration indices likewise indicate strong response concentration, further supporting the stability of the attribute categorizations. For most attributes, the observed entropy values remain substantially below the theoretical maximum entropy (Hmax = 1.609), indicating a high degree of response concentration. In addition, the response distributions differ substantially across attributes (e.g., strong positive preference for payment options and online tracking, while drone delivery shows a high neutral response ratio). This demonstrates that respondents clearly differentiate between service attributes. These results also indicate that the Likert responses used in this study do not constitute a psychometric scale or the reflective measurement of a latent construct; rather, they serve as input for attribute classification according to the Kano logic.
To assess potential response bias, an additional ANOVA analysis was conducted across educational level groups. The results did not reveal statistically significant differences in attribute evaluations, suggesting that the structure of the sample does not introduce unintended measurement bias in the assessment of service attributes and supports the robustness of the sample.
Although the present research is based on a non-probability sampling approach and the resulting sample exhibits a systematic demographic bias toward urban, higher-educated, and higher-income respondents, this bias does not compromise the validity of the study in relation to its research objectives. The sampling strategy was deliberately purposeful, targeting the consumer segment most frequently exposed to last-mile logistics options–such as real-time shipment tracking, flexible delivery or pickup solutions–and possessing more extensive e-commerce transaction experience. As a result, these respondents are better positioned to form informed and meaningful evaluations regarding the quality and actual necessity of such services. From a methodological standpoint, the sample demonstrates not statistical but functional representativeness with respect to the target population relevant to the phenomenon under investigation. This approach is consistent with established practices in technology adoption and service evaluation research, where the primary objective is theory testing and construct validation rather than population-level estimation. In this context, the deliberate focus on active users enhances the explanatory power and internal validity of the analysis, a position further supported by empirical evidence.
According to Eurostat’s [69] 2024/2025 e-commerce statistics on individuals, the prevalence of online purchasing is consistently higher among urban populations compared to suburban and rural areas (urban: 78%, suburban: 76%, rural: 75%). International logistics research and recent inter-university studies conducted in the United States and Europe further confirm the existence of demographic differences related to digital affinity: higher-income households, younger urban residents, and groups characterized by intensive technology use are significantly more likely to engage in e-commerce and last-mile logistics services [70,71]. These findings substantiate the heightened relevance of the selected target group for the analysis of convenience-oriented services.
Consumer behavior within the Budapest metropolitan area closely aligns with broader European urban trends. Over the past decade, the proportion of online buyers has increased in parallel with, and converging toward, the EU average, and does not deviate substantially from international patterns. Demographic profile characteristics (such as age, educational attainment, employment status, and type of residential area) also correspond closely to European distributions [69]. We therefore consider the urban overrepresentation of the sample to be appropriate and analytically justified, as urban logistics challenges and the associated expectations for convenience manifest in a similar manner across major European cities. These challenges include high delivery density, traffic congestion, access restrictions, and continuous expectations of immediacy. Consequently, focusing the analysis on an urban environment is not only justified but also methodologically advantageous, and the sample is suitable for drawing meaningful conclusions.
Finally, it is emphasized that the objective of this study is not statistical generalization to the entire population, but rather the identification, categorization, and prioritization of service attributes according to their differentiated effects on customer satisfaction. This analytical orientation consists of prior Kano-based and service quality studies that employed comparable sample sizes and non-probability sampling strategies to derive practical, managerially relevant insights [5,72]. A promising direction for future research involves extending the sample internationally and conducting comparative analyses to test the robustness of the identified categorizations across different countries and urban typologies.

4. Results

In our Kano-based extended model, our objective was to obtain a reliable understanding of the relationships among quality attributes and their classification into Kano categories. We emphasize that, in line with our initial assumptions, category assignments are treated as temporally dynamic states—that is, our aim is to capture a snapshot of the current situation—and that the discrete category classifications are interpreted as a continuous preference field within which each category forms a fuzzy set with overlapping interpretive regions. Accordingly, our intention was to replace the modified discrete evaluation table (see Table 4) with a two-dimensional continuous graphical surface.
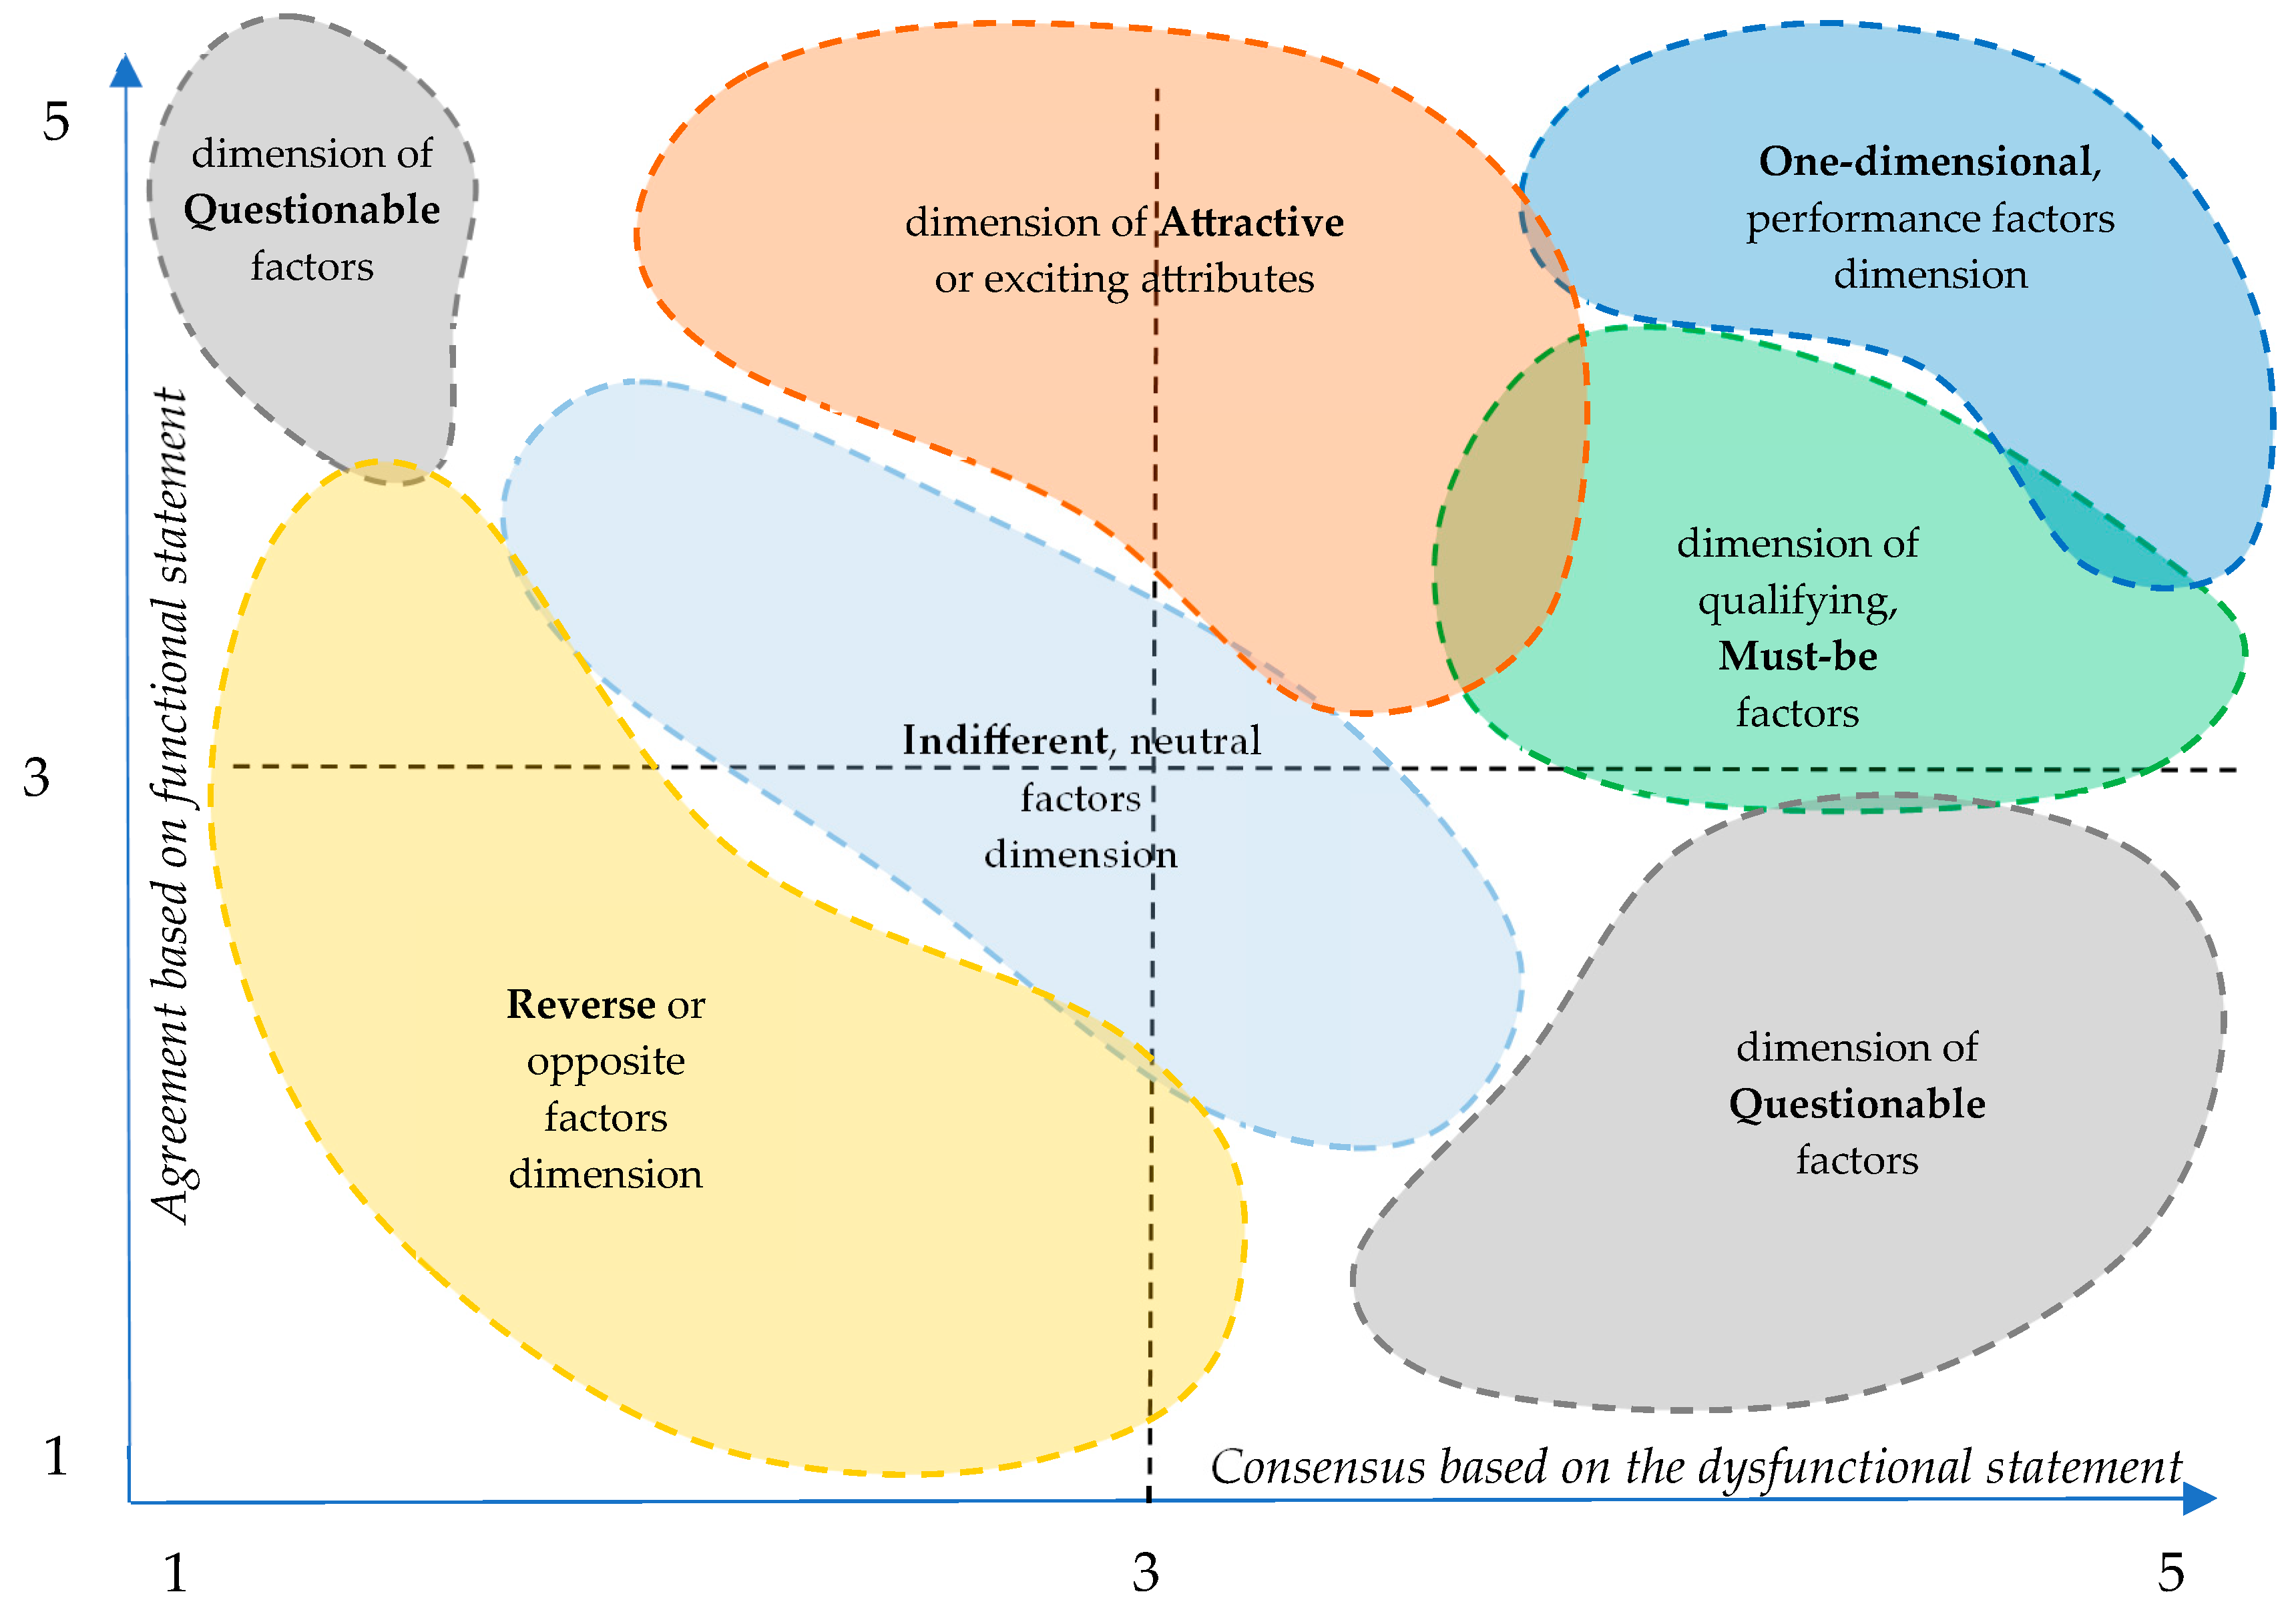
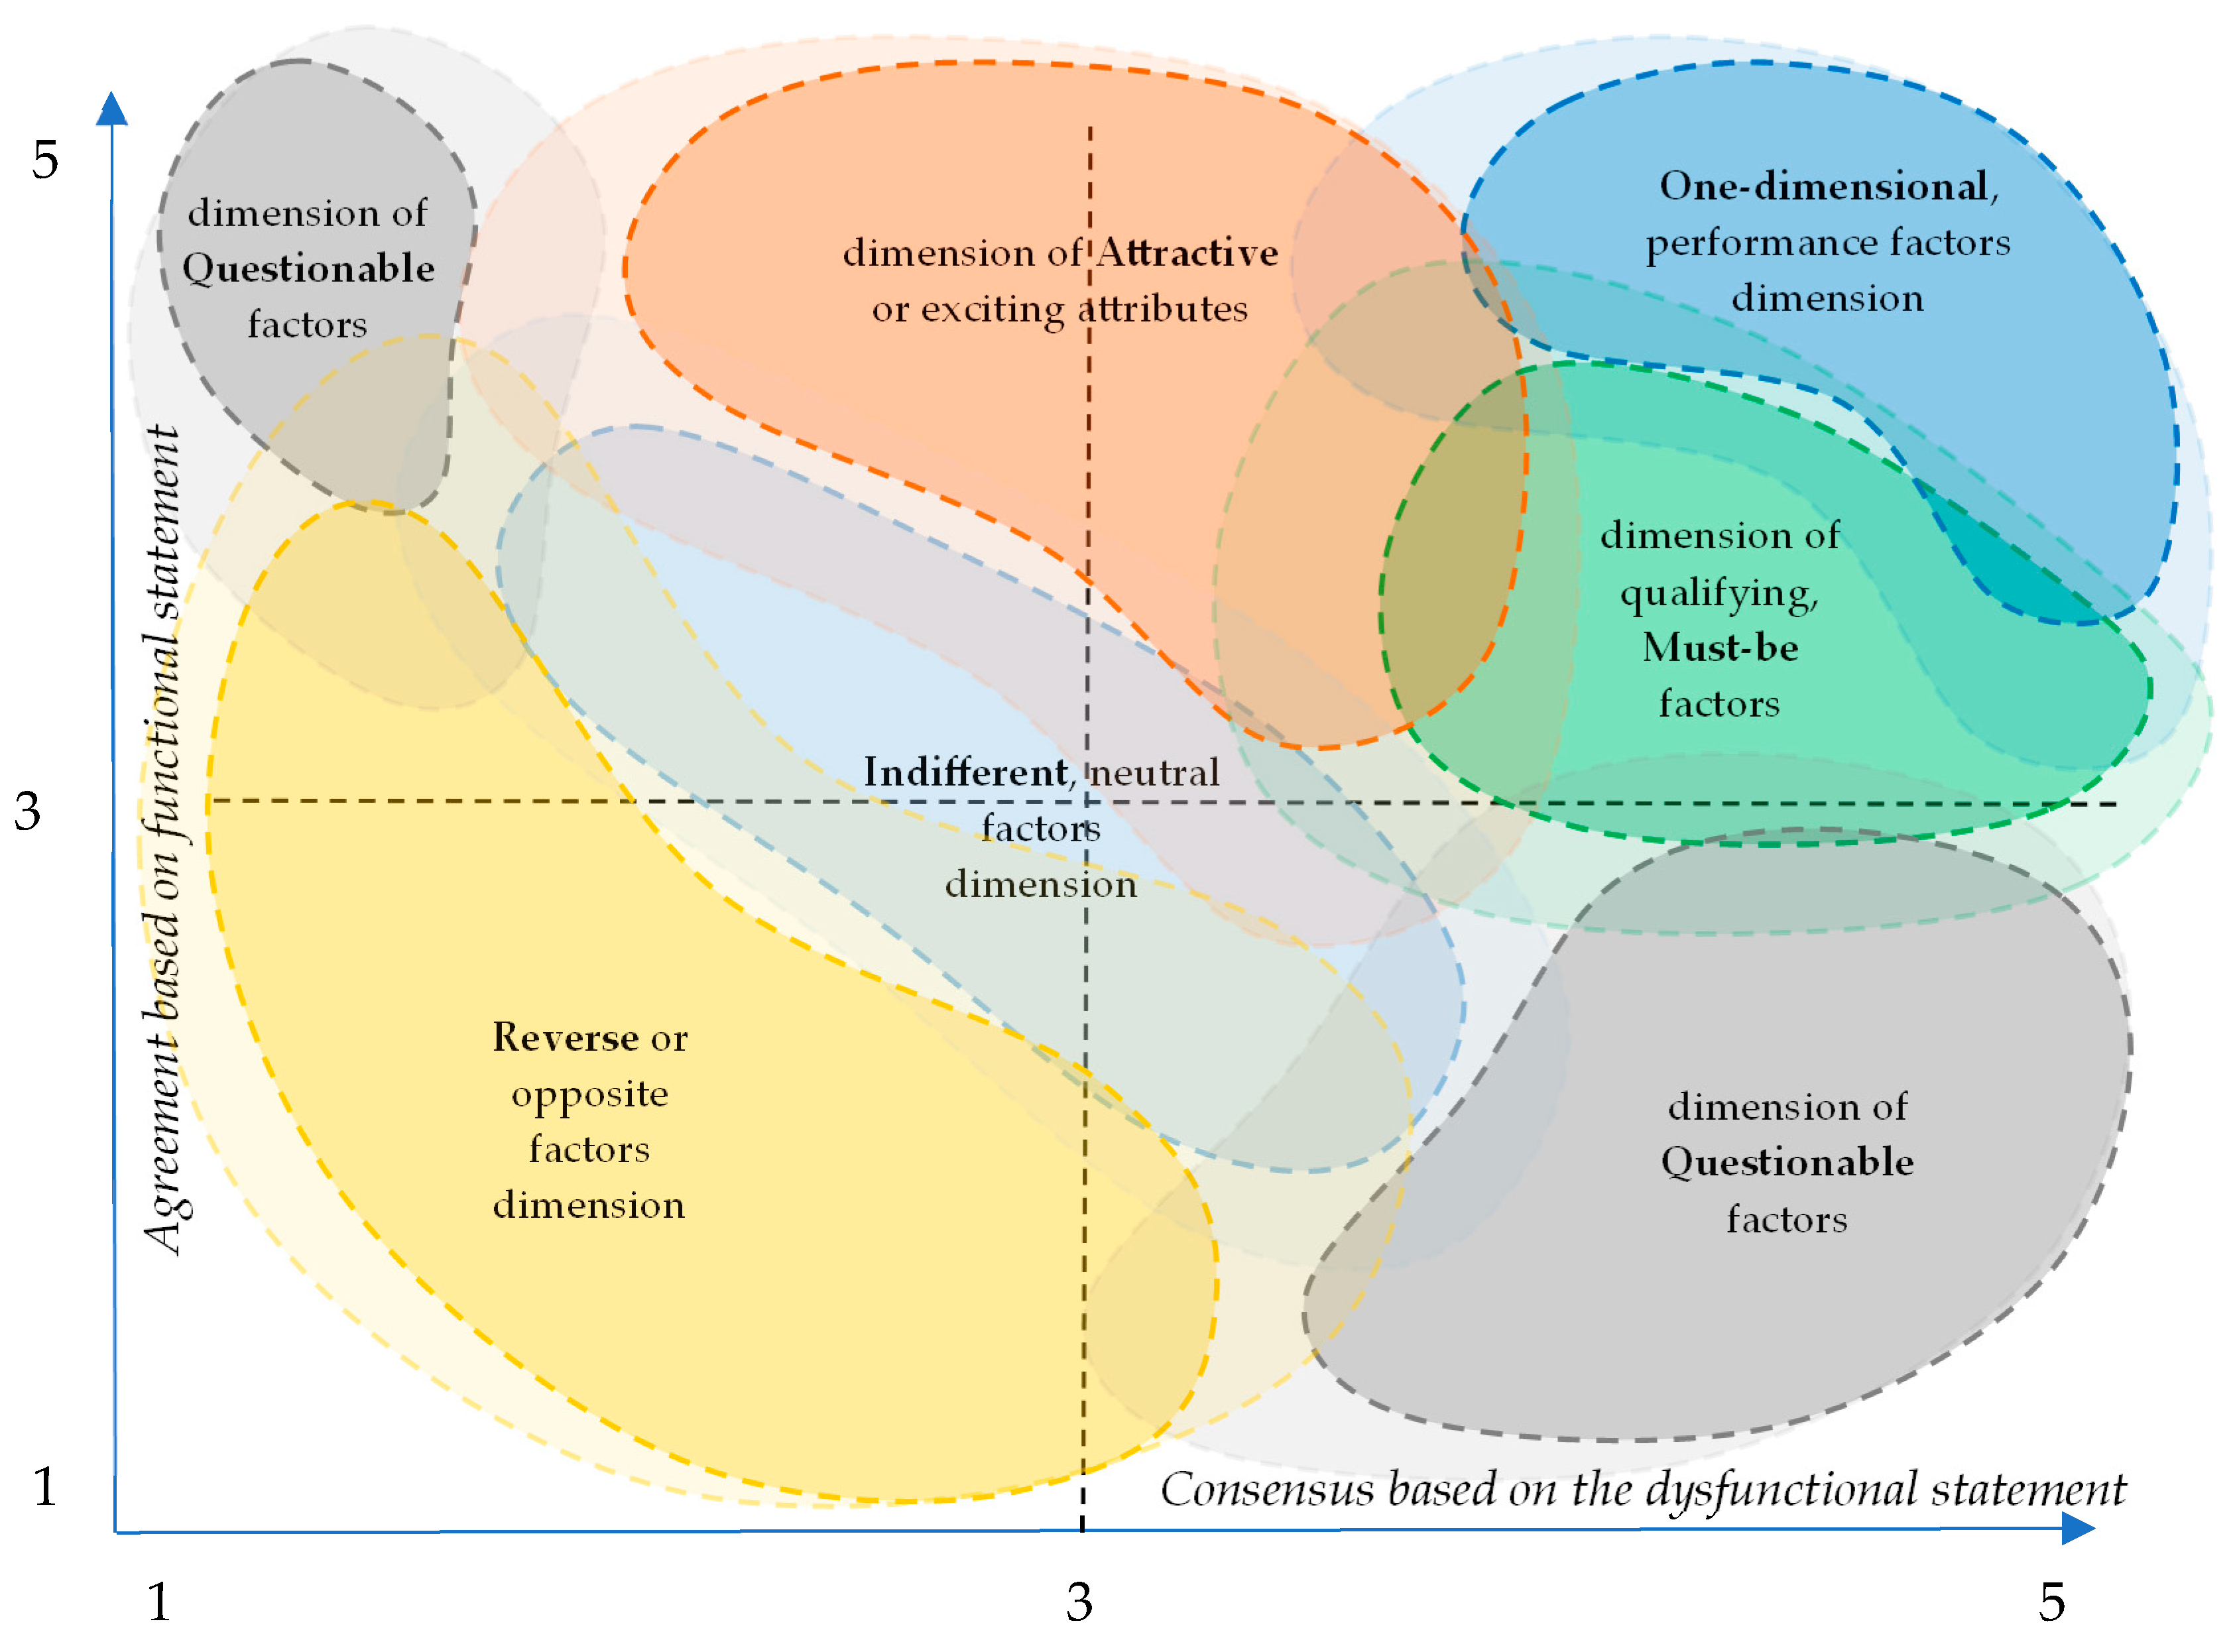
The initial two-dimensional evaluation matrix used for the analysis did not adequately reveal the structure of the attribute sets; therefore, the relationships were represented in the graph shown in Figure 2, with the additional clarification that the dashed lines indicating set boundaries do not represent sharp separations. Instead, the sets overlap with decreasing probability as a function of distance (see Figure 2 in comparison with Figure 3). Here the term “overlap” is used in an interpretative sense to describe attributes positioned near the boundaries of Kano categories in the coordinate space rather than indicating a formal fuzzy-set membership.
Our results were derived based on the degree of agreement with the functional and dysfunctional statements, determined by the extent to which each response deviates from the central (neutral or indifferent) value, both to the left and to the right. By definition, the functional agreement range is plotted along the y-axis, whereas the dysfunctional agreement range appears along the x-axis. For the purpose of representation, we defined a scale ranging from 1 to 5. It is important to note that this arbitrary scale differs from the numerical value range of the Likert scale—although both span from 1 to 5.
Agreement with the positive functional statements (that is, the supportive responses—I would be satisfied or I would be very satisfied, and only these) shifts the position of the given feature upward in the graphical representation, corresponding to the respondents’ partially weighted evaluations. In contrast, for the dysfunctional statements, the negative responses (i.e., expressions of non-agreement: I would be dissatisfied or I would be very dissatisfied) shift the position of the examined function to the right.
Since we did not alter the phrasing of the statements themselves and merely negated the availability of the function (for example: “How would you feel if … were not available?”), the dysfunctional statements exhibit an inverted relationship along the “agreement dimension” relative to the functional statements. According to the logic of our specific representation, this means that the rejection side of the dysfunctional responses determines the shift of the attribute along the x-axis (that is, its deviation from the neutral point), whereas the agreement side of the functional responses determines the shift along the y-axis. Within this logic, it must also be taken into account that the response means must be transposed into the defined 1–5 range, which is ensured by our partial weighting procedure.
The degree of agreement with the functional and dysfunctional statements—that is, the (x,) coordinates along the two axes—can be calculated using Equations (1) and (2). These formulas are determined by the partially weighted averages of the respondents’ percentage distributions. The partially weighted averages define the relative distance from the neutral midpoint. In the first formula, the values 3, 4, and 5 represent the respective projection weights.
degree   of   functional   agreement = ( very   satisfied   % · 5 + satisfied   % · 4 + neutral   % · 3 ) 100
d e g r e e   o f   a g r e e m e n t   b a s e d   o n   t h e   d y s f u n c t i o n a l   s t a t e m e n t r e v e r s e d = ( n e u t r a l   % · 3 + d i s s a t i s f i e d   % · 4 + v e r y   d i s s a t i s f i e d   % · 5 ) 100
An important feature of the formulas above is that the midpoint appears in both calculations, and increasing weight coefficients are applied as the values move further away from this midpoint, reflecting the ordinal structure of the Likert scale in which responses further from the neutral midpoint represent stronger preference intensity. The specified formulas therefore transform the observed response frequencies into a comparable coordinate range between 1 and 5.
Using this method, a two-dimensional function–agreement matrix consisting of four quadrants can be created in a simple and efficient manner. The factors corresponding to One-dimensional performance attributes are located in the upper-right corner of the upper-right quadrant. Immediately adjacent to them—yet still within the same quadrant—are the attractive and exciting factors, which extend slightly into the upper-left quadrant but remain close to the neutral zone. The lower-right portion of the upper-right quadrant contains the Must-be or qualifying baseline factors (minimum requirements).
In the upper-left quadrant, in a narrow area near its upper-left corner, lie the uncertain (Questionable) attributes. Along the diagonal of the matrix—between the upper-left and lower-right quadrants—are the neutral (Indifferent) attributes. Beneath this diagonal, the lower-left quadrant contains the Reverse factors, whereas the lower-right corner of the lower-right quadrant represents a broader “Questionable zone” (see Figure 2).
As the figure illustrates, despite the more customary discrete categorization in the literature, these dimensions behave in practice as fuzzy sets—that is, they exhibit mutual dependence, particularly when approaching the boundaries of a given set or zone (see Figure 3). In this context, the interpretation of overlapping category boundaries refers to the spatial proximity of attribute coordinates in the Kano evaluation space rather than to a formal fuzzy-set analytical framework.
Figure 2 presents the theoretical function–agreement matrix derived from the modified evaluation table, while Figure 3 extends this representation by introducing fuzzy boundaries between the categories. The purpose of this step is to demonstrate that Kano categories should not be interpreted as strictly discrete regions, but rather as overlapping satisfaction domains in which service attributes may occupy transitional positions.
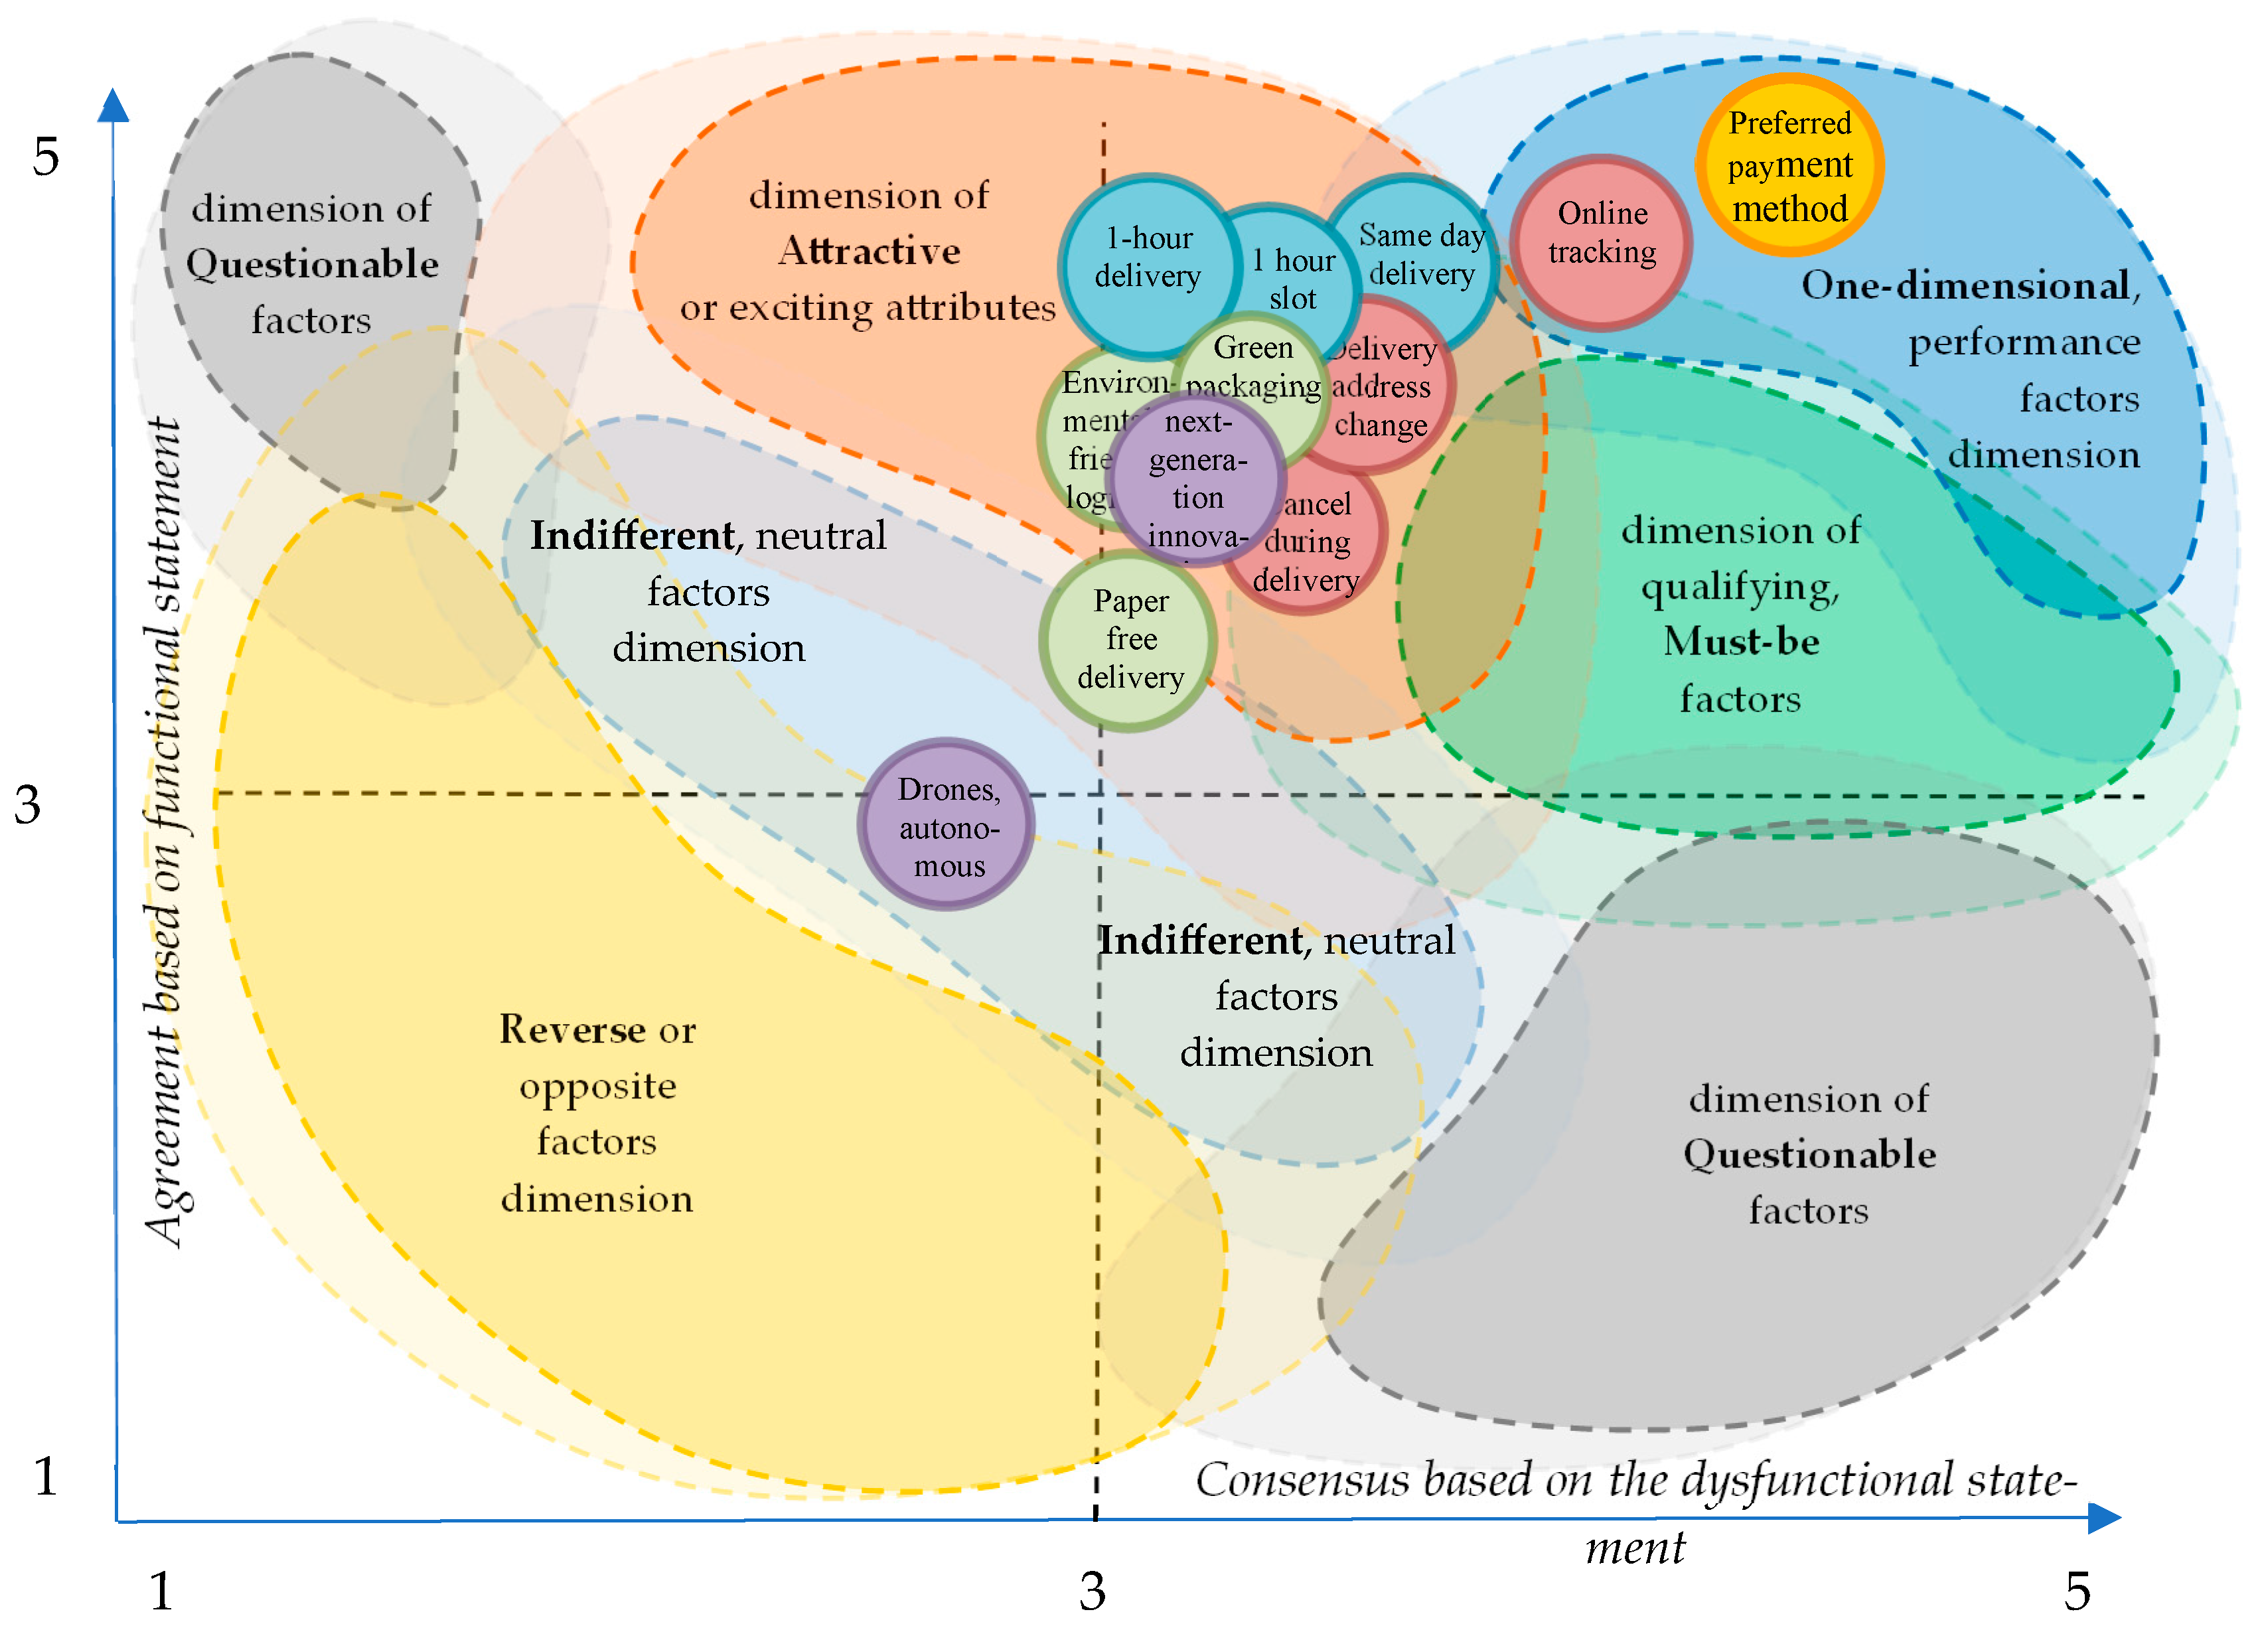
This fuzzy interpretation is particularly relevant in the context of last-mile convenience logistics services, where consumer expectations change rapidly over time and attributes may dynamically shift between categories due to evolving market conditions. The fuzzy surface helps to visualize these transitional zones and supports the interpretation of attributes located near category boundaries. Accordingly, the utility of the fuzzy representation (Figure 3) lies in illustrating that Kano categories should not be interpreted as strictly discrete regions, but as overlapping satisfaction domains. This enables the identification and interpretation of transitional positions of service attributes located near category boundaries, which would remain hidden in a purely crisp classification framework. Figure 4 subsequently presents the empirical results by positioning the examined service attributes within this two-dimensional agreement space.
In our analysis, we mapped all 214 responses and all 24 statements—that is, each pair of functional and dysfunctional statements together with their associated product or service features—and positioned them within the plotted graph, namely the functional—dysfunctional agreement matrix, using the agreement-level computation described above (see Figure 4).
In the above methodology, the responses of participants and involved experts were represented by comparing their partially weighted agreement percentages—that is, all responses above the neutral value—with the theoretical maximum of the scale (100%). The farther a given item is positioned to the right and upward in the diagram, the stronger the agreement with the opposite of the dysfunctional statement and the stronger the reinforcement of the functional statement (this indicates the attribute’s classification). The location of each item in the figure therefore shows the category to which the given product or service feature—i.e., performance attribute—belongs.
Each category is represented by a circle, and we further differentiated them into groups based on their color, as follows:
  • Blue: time-based embedded services (time dimension);
  • Green: eco-friendly and sustainability-related services;
  • Purple: future-oriented solutions;
  • Brown: services related to flexibility;
  • Yellow: pricing- and payment-related flexibility.
As the next step of our analysis, the measured responses were classified into categories based on their combined degree of agreement, as summarized in Table 6. The term “close to” refers to the proximity of attribute coordinates to the boundaries between Kano categories in the two-dimensional evaluation space, without implying a formal fuzzy-set classification. The data primarily reflect the expectations of digitally active urban consumers.

5. Discussion

In the following part, the expressions ‘close to’ or ‘shifting toward’ reflect the coordinate-based interpretation of the two-dimensional Kano evaluation space: some attributes lie in transitional zones near category boundaries and may therefore appear close to adjacent categories rather than belonging strictly to a single category.
The results provide a nuanced picture of how digitally active urban e-commerce consumers evaluate convenience-oriented last-mile logistics services and how these evaluations translate into customer satisfaction in addition to the fact that sustainability-oriented convenience services can be interpreted within broader sustainability-related theoretical frameworks. In line with Kano theory, most of the examined service attributes were classified primarily as Attractive factors, indicating an asymmetric satisfaction effect. In terms of the underlying satisfaction structure, the presence of these services generates a substantial increase in customer satisfaction, whereas their absence does not necessarily lead to dissatisfaction. The findings offer empirical insight into how last-mile convenience services influence customer satisfaction and how these attributes are positioned within the modified Kano framework (within the two-dimensional continuous agreement matrix interpreting the fuzzy boundaries used for classification). The results also support the interpretation that several logistics service attributes occupy overlapping (transitional) positions between Kano categories, rather than fitting into strictly discrete classifications.
This dynamic and overlapping interpretation is consistent not only with Kano theory but also with previous empirical studies, which are further reinforced by the results of the present research. For example, Nilsson-Witell and Fundin [61] demonstrated that service attributes may evolve across different stages of customer experience, where initially attractive features may gradually become expected service elements (i.e., become internalized). Similarly, Löfgren et al. [73] showed that quality attributes may follow multiple development trajectories rather than a single linear path. These studies support the interpretation proposed in the present research that attributes located near category boundaries should be interpreted as transitional characteristics rather than fixed categories. In comparison with earlier studies, it is also important to note that our investigation focused primarily on last-mile value-added convenience service attributes rather than the quality of basic logistics delivery operations, which would likely enrich the Must-be category that is underrepresented in the present research. Examples of such basic attributes include damage-free delivery, the actual arrival of the parcel, and successful handover.
From the perspective of convenience-oriented logistics service quality, the results are also consistent with earlier Kano-based logistics research. Sohn et al. [25] found that several logistics service quality attributes behave as Must-be quality elements, suggesting that the relationship between service performance and customer satisfaction is fundamentally asymmetric and non-linear. The results of the present study partly confirm this pattern. Although none of the convenience services were identified exclusively as Must-be attributes, the graphical representation shows that online tracking and flexibility options (such as changing the delivery address or canceling the order) appear in the Attractive category but are positioned very close to the Must-be region. In the fuzzy interpretation, they partly overlap with that category, indicating transitional characteristics, although their internalization is not yet complete. This duality suggests that these attributes may gradually become basic expectations in urban environments, and that the competitive advantage derived from them may diminish over time, while their absence may increasingly generate dissatisfaction. This development is also consistent with the digitalization trends of e-commerce, where transparency and control are rapidly becoming prerequisites of acceptable service, thereby reducing their differentiating character.
The results also highlight the increasing role of sustainability-related delivery convenience attributes, reflected in the generally positive evaluations of respondents and their placement within the Attractive category, albeit at varying distances from the Must-be category. Although within the refined Kano framework sustainability-related delivery attributes are currently positioned primarily within the Attractive category, their proximity to the Must-be category indicates a transitional (transient) character. This finding is consistent with the study of Klein and Popp [2], which shows that consumer acceptance of sustainable last-mile delivery methods depends on the combined effects of convenience, perceived sustainability, and perceived costs. Their location within this transitional zone suggests that sustainability-related attributes may evolve toward Must-be attributes over time. In this sense, sustainability attributes can generate additional consumer value without yet functioning as universal basic expectations. At present, these attributes generate additional customer value, but they do not yet function as universal baseline expectations in urban last-mile logistics systems. The least attractive service type was measured to be packaging reduction and paperless delivery, which showed a stronger Indifferent character.
In Kano terms, most eco-friendly and sustainability-oriented services appear as “order-winning” attributes, offering strategic differentiation opportunities for companies and the potential to generate unexpected satisfaction. From a policy perspective, this is particularly relevant, as it suggests that regulatory incentives and urban logistics measures—such as zoning restrictions, the introduction of low-emission zones, the development and support of urban consolidation centers (UCCs) and automated or even physically mobile micro-hubs, the expansion of platform-based shared parcel locker infrastructure, as well as financial incentives for green/electric and robotized delivery solutions—may also be relevant, as it suggests that regulatory incentives and urban logistics policies may accelerate the transition of sustainability-related attributes toward One-dimensional (performance) or even Must-be status, thereby aligning consumer satisfaction with broader environmental objectives.
The results of sustainability-oriented delivery attributes (e.g., green packaging, environmentally friendly logistics, paper-free delivery, next-generation future-oriented innovative services and solutions, drone or autonomous vehicle delivery), which are positioned along the Indifferent–Attractive axis, where the Attractive side may exhibit a transitional character and in some cases approach the Must-be category, also provide connections to broader sustainability-related theoretical perspectives. In line with the attitude–behavior gap in sustainable consumption theory suggests that consumers may express support for sustainability but do not necessarily act accordingly, which is also reflected in the attributes classified as Indifferent in our study [74]. From a behavioral transition perspective, decision-making behavior is not solely an individual choice but is also shaped by infrastructure, social norms, and systemic conditions, which helps explain the observed Attractive–Must-be transitional characteristics [75]. According to Green Service Adoption theory, the adoption of sustainable solutions is often lower than expected, which partly explains the gap or the sustainability paradox observed in our study [76].
These findings highlight important sustainability-related implications for last-mile logistics systems. The results suggest that sustainability-oriented delivery solutions are distributed along a spectrum ranging from Indifferent to Attractive, often exhibiting transitional characteristics, and in some cases approaching the Must-be category (e.g., green packaging), although they have not yet been fully established as expected determinants of customer satisfaction (Must-be). Overall, these patterns reflect the gap between system-level sustainability objectives and the value perceived by individual consumers, highlighting the need for a stronger integration of sustainability considerations into service design without compromising perceived convenience. The inherent trade-offs between convenience and sustainability represent a key challenge for last-mile logistics systems and highlights the need for a stronger integration of sustainability considerations into service design and delivery system configuration. These findings contribute to a better understanding of how sustainability can be effectively integrated into last-mile logistics service design while maintaining consumer acceptance.
It is also worth noting that preferred payment methods were clearly identified as One-dimensional performance factors. This means that improvements in this area increase customer satisfaction directly and proportionally, making it a particularly important attribute for users. Naturally, the relationship also works in the opposite direction: service limitations or restrictions motivated by cost considerations may proportionally increase dissatisfaction. Based on our results, payment flexibility can be considered a critical operational priority from a managerial perspective, offering significant opportunities for fine-tuning price–value ratios and service scalability. From a policy perspective, the finding highlights the importance of interoperable and inclusive digital payment infrastructures in supporting efficient urban logistics ecosystems. It is also important that tracking and same-day delivery are located close to this category region while also showing connections to the Must-be zone, indicating that consumers perceive them as transitional Attractive/One-dimensional attributes that may increasingly become expected standards.
Time-based delivery solutions—such as same-day delivery, narrow delivery windows, and one-hour delivery—were consistently identified as Attractive attributes, with the exception of same-day delivery. These services generate progressively increasing satisfaction, meaning that the shorter the delivery time, the higher the satisfaction level, a dynamic that is also visible in the graphical representation. Consistent with Attractive quality characteristics, the absence or lower level of these services does not automatically lead to dissatisfaction, suggesting that consumers still perceive them as value-adding rather than mandatory services. At the same time, it is notable that same-day delivery, particularly in densely populated urban markets, increasingly behaves as an expected service standard (although significant differences may exist depending on the product category).
In contrast, future-oriented delivery technologies, such as drones and autonomous vehicles, were typically perceived as Indifferent attributes, and only occasionally as Attractive ones; in some responses, characteristics associated with the Reverse category also appeared. This indicates limited consumer readiness and potential skepticism, even when the technological maturity of these solutions is relatively high. Technological advancement alone does not automatically guarantee higher customer satisfaction. The results also suggest the presence of environmentally conscious niche consumer segments. For example, certain consumers may find the use of electric drones or packaging-free delivery particularly attractive, while others may perceive these innovations as unsettling. These findings further reinforce the flexibility of the Kano principle, where perceived usefulness, trust, and contextual relevance determine the satisfaction effect of a service attribute. The results also support Parasuraman [77], who argued that technological innovations may increase service value but not all consumers are ready to adopt them, and Yoo et al. [78], who found that consumers remain cautious about drone delivery, as high technological sophistication does not automatically lead to high acceptance. In the absence of clearly perceived convenience gains, such attributes may remain neutral or even trigger resistance, especially when they introduce uncertainty or perceived trade-offs.
The study did not identify any questionable attributes, which may indicate both the reliability of the survey and the fact that service providers tend to explore existing customer needs. The questionnaire also did not include options likely to provoke highly polarized or contradictory responses. Overall, the results show that last-mile service attributes differ significantly in their satisfaction effects and developmental trajectories, even though the analysis reveals strong clustering among convenience services. The findings suggest that last-mile logistics services are characterized by rapidly evolving customer expectations and overlapping satisfaction domains, rather than rigid service quality categories. The refined Kano framework proposed in this study helps capture these transitional dynamics and provides a more nuanced understanding of how emerging logistics service attributes influence customer satisfaction and also highlight the importance of aligning sustainability objectives with consumer value perception in order to ensure successful adoption.

6. Conclusions

The study examined how convenience services in last-mile logistics influence customer satisfaction, using a newly developed model grounded in the principles and quality categories of the Kano framework. The results indicate that contemporary consumer expectations extend well beyond basic requirements: speed, flexibility, and sustainability all play prominent roles. This underscores the need for delivery services to be designed in a customer-centric manner and to align with the capabilities offered by last-mile convenience features—particularly in dense urban environments.
The factors partially classified as Must-be—such as order modification, real-time communication, and online tracking—currently function as Attractive attributes, yet are rapidly evolving into baseline market expectations. For practice, this implies that their absence will increasingly induce dissatisfaction, while their presence will provide diminishing competitive advantage. Decision-makers must therefore ensure that such services remain widely accessible, helping to prevent digital exclusion and supporting equitable access to the benefits of e-commerce.
Performance factors, most notably secure payment solutions, highlight the dual role of business practices and regulatory oversight. Secure digital transactions strengthen consumer trust, while flexible payment options enhance satisfaction in a directly proportional, One-dimensional manner—meaning that improvements in these services consistently yield higher satisfaction. Managers should prioritize the solutions customers prefer, while regulators must support the development of payment infrastructures that ensure both security and inclusivity.
The Attractive factors—such as same-day or ultra-fast delivery and sustainability-oriented service options—clearly emerged as differentiating, order-winning attributes. These services not only enhance the customer experience but also contribute to broader sustainability objectives, including the reduction in emissions and urban congestion. Here, business and policy priorities converge: companies gain competitive advantage by adopting green logistics practices, while cities and policymakers can promote these developments by supporting electric vehicle fleets, parcel locker systems, and low-emission delivery zones.
Although respondents are currently Indifferent toward drones, autonomous vehicles, and robotic delivery solutions, these technologies possess substantial future potential. Controlled, regulated pilot deployments may help prepare the market, and as consumer familiarity grows, these innovations may gradually shift into the Attractive category.
Overall, last-mile logistics requires a strategic service mix that incorporates the basic expectations (qualifying requirements) manifested as Must-be factors, as well as the innovative Attractive attributes that serve as differentiating features, alongside the One-dimensional performance factors.
The fuzzy boundaries observed in the analysis highlight the dynamic evolution of consumer expectations in e-commerce logistics. Attributes located near category borders should not be interpreted as rigid classifications, but rather as transitional expectation states that may shift over time. From a managerial perspective, this implies the need for continuous monitoring, segmentation-based implementation, and phased investment strategies.
For managers, the central challenge lies in maintaining trust, ensuring positive customer experience, and investing in sustainability-oriented attractive services. Policymakers, in turn, must develop regulatory environments that encourage innovation while supporting green urban logistics. Linking the Kano model with sustainability and policy planning provides practical guidance for designing last-mile systems that are not only competitive, but also more resilient and supportive of greener urban environments.

6.1. Implications for Supporting Sustainable Service Design in Urban E-Commerce Environments

The results of the study, together with the application of the refined Kano model, yield several practical implications for the design of sustainable last-mile logistics services in urban e-commerce environments. The findings provide a structured basis for prioritizing service attributes by aligning customer expectations with sustainability objectives.
First, attributes identified as One-dimensional performance factors—most notably preferred payment methods and online tracking—should be treated as core digital infrastructure investments. Improvements in these services lead to proportional increases in customer satisfaction, whereas their absence or inadequate performance results in clear dissatisfaction. A derived benefit of reliable digital processes is improved operational efficiency, as they reduce failed deliveries, customer service inquiries, and unnecessary re-delivery attempts, thereby contributing to enhanced resource efficiency.
Second, several convenience-related services—such as delivery flexibility (e.g., address modification or order cancellation during delivery) and time-based service options—occupy a transitional position between the Attractive and Must-be categories. This suggests that these attributes are gradually becoming baseline expectations in urban environments and, in some cases, already function as such. For service providers, this implies that the competitive advantage associated with these features is diminishing over time, while their absence increasingly generates dissatisfaction. From a strategic perspective, scalable and resource-efficient implementation of these services is therefore essential to prevent their normalization from resulting in disproportionate environmental or operational burdens.
Third, sustainability-oriented services—including environmentally friendly logistics solutions and green packaging—were predominantly classified as Attractive attributes, although some were perceived as Indifferent (e.g., box-free delivery). Their presence significantly enhances customer satisfaction but is not yet regarded as mandatory. This finding indicates an important opportunity: investments in green delivery solutions can simultaneously generate customer value and contribute to environmental objectives, particularly in densely populated urban areas. Policymakers can support this transition through targeted incentives—such as subsidies for low-emission vehicles, urban consolidation centers, or parcel locker systems—thereby reducing entry barriers for service providers. Within the Kano framework, the “Indifferent” category indicates that the presence or absence of a given attribute does not significantly influence perceived customer satisfaction. In the case of sustainability-related delivery solutions, this result—such as packaging-free or box-free delivery options, the use of drones, or the application of autonomous delivery vehicles—can be interpreted in several ways. (1) Many sustainability-oriented solutions primarily generate system-level or broader societal benefits (for example, reductions in harmful emissions or the mitigation of urban congestion), while their direct service value for individual consumers remains limited. As a result, users may not necessarily perceive these attributes as sources of immediate satisfaction. (2) The classification may also reflect the current stage of consumer awareness and expectation formation, as sustainability-oriented delivery solutions are still evolving in many logistics systems. (3) Finally, some sustainability-related attributes may be positioned in an early stage of the Kano life cycle, meaning that increasing environmental awareness trends and growing regulatory pressure may gradually shift them toward other satisfaction categories in the future.
Finally, future-oriented technologies—such as drone-based or autonomous delivery—currently exhibit ambivalent perceptions and were largely classified as Indifferent, particularly in the case of drones. This suggests that, at the current level of market maturity, large-scale deployment of these solutions is unlikely to produce immediate gains in customer satisfaction and is perceived more as an innovation novelty than a source of competitive advantage. Instead, regulated pilot projects and gradual market introduction appear more appropriate, allowing consumer expectations to adapt over time and enabling these innovations to potentially shift toward the Attractive category in the future.
Overall, the Kano-based prioritization framework demonstrates that sustainable last-mile service design should not aim to indiscriminately maximize convenience features, but rather to align service development with the evolving structure of customer expectations. By distinguishing between baseline requirements, performance drivers, and sustainability-oriented differentiators, managers and policymakers can allocate resources more effectively and support the development of urban e-commerce logistics systems that are competitive, resilient, and environmentally responsible.
With regard to shifts in sustainability and other attributes, we do not assume a privileged direction. Although the frequently cited A→O→M transition logic is well known in the literature, we have previously argued that movements between categories are not necessarily linear and do not follow a predetermined trajectory. Changes may occur rapidly and even in unexpected directions. Factors influencing the repositioning of attributes may include, among others:
  • Structural market changes;
  • Regulatory intervention or political pressure;
  • The strengthening of environmental awareness;
  • Generational value shifts;
  • Technological diffusion and the development of digital platforms.
These drivers do not push attributes in a single dominant direction; rather, they may result in dynamic and context-dependent repositioning. A sustainability-related attribute, for example, may shift from Attractive to Indifferent, or even toward Reverse, within a relatively short period if societal perception or economic conditions change significantly.
Accordingly, the study does not assume a normative direction or developmental pathway. Instead, it interprets movements between Kano categories as part of a dynamic, non-linear, and context-sensitive system. The role of regulation in this framework is not to accelerate movement toward a particular category, but to shape market and societal conditions that may recalibrate consumer expectations and thereby modify the relative positioning of attributes.

6.2. Limitations and Potential Directions for Further Development

The findings should be interpreted in light of the research context and sampling characteristics. Although the sample size is moderate, the primary objective was not statistical generalization to the broader population but rather the categorization and prioritization of service attributes based on their impact on customer satisfaction. The sample used in this research is methodologically justified and valid despite its systematic bias, as it intentionally focuses on the consumer segment that most consistently and frequently uses such services both globally and in Hungary. Therefore, the overrepresentation of urban, higher-educated, and higher-income respondents does not constitute a substantive limitation. The perspectives of this digitally active social group are particularly relevant for evaluating e-commerce and convenience-oriented last-mile logistics services, especially in environments characterized by high urban complexity and metropolitan features.
Although the data were collected in Hungary, the Budapest metropolitan area exhibits delivery density, congestion patterns, zoning constraints, and sustainability-related expectations comparable to those of major Western European cities. Consequently, the results provide context-specific yet internationally interpretable insights into urban last-mile logistics.
Future research could extend the analysis to rural logistics environments, where structural conditions differ substantially, and to non-European regions with distinct socio-cultural contexts. Comparative studies across demographic groups would further refine the understanding of heterogeneous customer expectations. Additionally, longitudinal designs would be particularly valuable to examine potential shifts in attribute classifications over time, given the dynamic nature of Kano categories and evolving consumer expectations.
Several future research directions deserve particular emphasis:
Although the present study focuses on consumers in major urban areas, future investigations could fruitfully undertake a comparative analysis of rural logistics environments, which face fundamentally different challenges—such as sparser delivery networks or more limited digital access. Likewise, expanding the analysis to non-European contexts with markedly different social and cultural backgrounds, such as various regions of Asia, could yield valuable insights. Exploring these differences in a comparative framework would be especially meaningful in light of regional diversity, cultural embeddedness, and variations in consumer practices.
Further research could also extend the scope of convenience services to encompass emerging service dimensions—for example, carbon-neutral delivery or micromobility-based models. Another promising direction involves a deeper comparative assessment of consumer preferences across different demographic and income groups. Future research should also consider longitudinal tracking designs in order to empirically examine potential shifts in attribute classifications over time, particularly given the dynamic nature of consumer expectations and the evolving life-cycle of Kano categories.
Overall, the study’s limitations primarily contextualize rather than weaken the findings. The results offer a focused and practically relevant perspective on the expectations of urban, digitally active consumers and contribute to the development of sustainable and customer-oriented last-mile logistics models.

Author Contributions

Conceptualization, B.G., V.P. and K.M.; methodology, B.G.; formal analysis, V.P.; investigation, B.G. and V.P.; resources, V.P.; data curation, V.P.; writing—original draft preparation, B.G., V.P. and K.M.; writing—review and editing, B.G. and K.M.; visualization, B.G.; supervision, B.G. All authors have read and agreed to the published version of the manuscript.

Funding

This research received no external funding.

Institutional Review Board Statement

Ethical review and approval were not required for this study in accordance with national legislation and institutional requirements in Hungary. The research was conducted as an anonymous, voluntary, non-interventional online questionnaire survey using Google Forms. No personal identifiers or sensitive personal data were collected. Demographic questions were included solely for analytical purposes and did not enable the identification of individual respondents. According to the General Data Protection Regulation (EU) 2016/679, Recital 26, fully anonymized data do not constitute personal data; therefore, data protection and human research ethics approval requirements do not apply. In line with institutional research practice at the Hungarian University of Agriculture and Life Sciences (MATE), ethics committee approval is not required for anonymous survey-based research that does not involve medical intervention, vulnerable groups, or sensitive topics.

Informed Consent Statement

Informed consent was obtained from all subjects involved in the study.

Data Availability Statement

The data presented in this study are not publicly available due to privacy and ethical restrictions related to the protection of individual respondents. Anonymized data may be made available from the corresponding author upon reasonable request.

Conflicts of Interest

The authors declare no conflicts of interest.

References

  1. Markovic, D. E-Commerce Trends: Trends in E-Commerce Logistics: More Than Just Shipping. Council Post, 18 September 2023. Available online: https://www.forbes.com/councils/forbesbusinesscouncil/2023/09/18/trends-in-e-commerce-logistics-more-than-just-shipping/ (accessed on 9 March 2025).
  2. Klein, P.; Popp, B. Last-Mile Delivery Methods in E-Commerce: Does Perceived Sustainability Matter for Consumer Acceptance and Usage? Sustainability 2022, 14, 16437. [Google Scholar] [CrossRef] [Scilit]
  3. Kilibarda, M.; Andrejić, M.; Popović, V. Research in logistics service quality: A systematic literature review. Transport 2020, 35, 224–235. [Google Scholar] [CrossRef] [Scilit]
  4. Mikulić, J.; Prebežac, D. A critical review of techniques for classifying quality attributes in the Kano model. Manag. Serv. Qual. Int. J. 2011, 21, 46–66. [Google Scholar] [CrossRef] [Scilit]
  5. Chen, C.-C.; Chuang, M.-C. Integrating the Kano model into a robust design approach to enhance customer satisfaction with product design. Int. J. Prod. Econ. 2008, 114, 667–681. [Google Scholar] [CrossRef] [Scilit]
  6. Tontini, G. Integrating the Kano Model and QFD for Designing New Products. Total Qual. Manag. Bus. Excell. 2007, 18, 599–612. [Google Scholar] [CrossRef] [Scilit]
  7. Berger, C.; Blauth, R.E.; Boger, D.; Bolster, C.J.; Burchill, G.; DuMouchel, W.; Pouliot, F.; Richter, R.; Rubinoff, A.; Shen, D.; et al. Kano’s methods for understanding customer-defined quality. Cent. Qual. Manag. J. 1993, 2, 3–35. [Google Scholar]
  8. McKinsey & Company. The Last-Mile Challenge: Efficient and Sustainable Last-Mile Logistics: Lessons from Japan. 2020. Available online: https://www.mckinsey.com/industries/logistics/our-insights/efficient-and-sustainable-last-mile-logistics-lessons-from-japan (accessed on 20 November 2025).
  9. Gevaers, R.; Van de Voorde, E.; Vanelslander, T. Characteristics and Typology of Last-mile Logistics from an Innovation Perspective in an Urban Context. In City Distribution and Urban Freight Transport: Multiple Perspectives; Macharis, C., Melo, S., Eds.; Edward Elgar Publishing: Cheltenham, UK, 2011; pp. 13–22. [Google Scholar] [CrossRef] [Scilit]
  10. Dias, E.G.; Oliveira, L.K.; Isler, C.A. Assessing the effects of delivery attributes on e-shopping consumer behaviour. Sustainability 2022, 14, 13. [Google Scholar] [CrossRef] [Scilit]
  11. Póka, V.; Lányi, M. Az utolsó száz méter kihívásai az ekereskedelem logisztikában. (en. The challenges of the last hundred meters in e-commerce logistics). Acta Period. 2022, 26, 29–44. [Google Scholar] [CrossRef] [Scilit]
  12. Olsson, J.; Hellström, D.; Vakulenko, J. Customer experience dimensions in last-mile delivery: An empirical study on unattended home delivery. Int. J. Phys. Distrib. Logist. Manag. 2022, 53, 184–205. [Google Scholar] [CrossRef] [Scilit]
  13. Karli, H.; Tanyas, M. Innovative Delivery Methods in the Last-Mile: Unveiling Consumer Preference. Future Transp. 2024, 4, 152–173. [Google Scholar] [CrossRef] [Scilit]
  14. Esper, T.L.; Jensen, T.D.; Turnipseed, F.L.; Burton, S. The last mile: An examination of effects of online retail delivery strategies on consumers. J. Bus. Logist. 2003, 24, 177–203. [Google Scholar] [CrossRef] [Scilit]
  15. Yang, H.; Fang, M.; Yao, J.; Su, M. Green cooperation in last-mile logistics and consumer loyalty: An empirical analysis of a theoretical framework. J. Retail. Consum. Serv. 2023, 73, 103308. [Google Scholar] [CrossRef] [Scilit]
  16. White, K.; Habib, R.; Hardisty, D.J. How to SHIFT Consumer Behaviors to Be More Sustainable: A Literature Review and Guiding Framework. J. Mark. 2019, 83, 22–49. [Google Scholar] [CrossRef] [Scilit]
  17. Edwards, J.B.; McKinnon, A.C.; Cullinane, S.L.; Halldórsson, Á.; Kovács, G.Y. Comparative analysis of the carbon footprints of conventional and online retailing: A “last mile” perspective. Int. J. Phys. Distrib. Logist. Manag. 2010, 40, 103–123. [Google Scholar] [CrossRef] [Scilit]
  18. European Commission. Communication from the Commission to the European Parliament, the Council, the European Economic and Social Committee and the Committee of the Regions; Decarbonise Corporate Fleets, 5.3.2025 COM(2025) 96 Final; European Commission: Brussels, Belgium, 2025; Available online: https://transport.ec.europa.eu/document/download/1498648c-63fc-4715-975d-ccbc64703da5_en?filename=Communication+-+Decarbonising+corporate+fleets.pdf (accessed on 3 November 2025).
  19. Jagoda, A.; Kołakowski, T.; Marcinkowski, J.; Cheba, K.; Hajdas, M. E-customer preferences on sustainable last mile deliveries in the e-commerce market: A cross-generational perspective. Equilib. Q. J. Econ. Econ. Policy 2023, 18, 853–882. [Google Scholar] [CrossRef] [Scilit]
  20. De Souza, R.; Goh, M.; Lau, H.C.; Ng, W.S.; Tan, P.S. Collaborative Urban Logistics—Synchronizing the Last Mile a Singapore Research Perspective. Procedia-Soc. Behav. Sci. 2014, 125, 422–431. [Google Scholar] [CrossRef] [Scilit]
  21. Koh, L.Y.; Yuen, K.F. Consumer adoption of autonomous delivery robots in cities: Implications on urban planning and design policies. Cities 2023, 133, 104125. [Google Scholar] [CrossRef] [Scilit]
  22. Adeoye, Y.; Onotole, E.F.; Ogunyankinnu, T.; Aipoh, G.; Osunkanmibi, A.A.; Egbemhenghe, J. Artificial Intelligence in Logistics and Distribution: The function of AI in dynamic route planning for transportation, including self-driving trucks and drone delivery systems. World J. Adv. Res. Rev. 2025, 25, 155–167. [Google Scholar] [CrossRef] [Scilit]
  23. Dablanc, L. Logistics Sprawl and Urban Freight Planning Issues in a Major Gateway City. In Sustainable Urban Logistics: Concepts, Methods and Information Systems; Gonzalez-Feliu, J., Semet, F., Routhier, J.L., Eds.; EcoProduction; Springer: Berlin/Heidelberg, Germany, 2014; pp. 49–69. [Google Scholar] [CrossRef] [Scilit]
  24. Gatta, V.; Marcucci, E.; Nigro, M.; Serafini, S. Sustainable Urban Freight Transport Adopting Public Transport-Based Cowdshipping for B2C Deliveries. Eur. Transp. Res. Rev. 2019, 11, 13. [Google Scholar] [CrossRef] [Scilit]
  25. Sohn, J.; Woo, S.H.; Kim, T.W. Assessment of logistics service quality using the Kano model in a logistics-triadic relationship. Int. J. Logist. Manag. 2017, 28, 680–698. [Google Scholar] [CrossRef] [Scilit]
  26. Asian, S.; Pool, J.K.; Nazarpour, A.; Tabaeeian, R.A. On the importance of service performance and customer satisfaction in third-party logistics selection, An application of Kano model. Benchmarking Int. J. 2018, 26, 1550–1564. [Google Scholar] [CrossRef] [Scilit]
  27. Ingaldi, M.; Ulewicz, R. How to Make E-Commerce More Successful by Use of Kano’s Model to Assess Customer Satisfaction in Terms of Sustainable Development. Sustainability 2019, 11, 4830. [Google Scholar] [CrossRef] [Scilit]
  28. Xu, Y.; Tong, X. Research on the Service Quality of JD Daojia’s Logistics Distribution Based on Kano Model. In Advances in Artificial Systems for Logistics Engineering III; Hu, Z., Zhang, Q., He, M., Eds.; Lecture Notes on Data Engineering and Communications Technologies; Springer: Cham, Switzerland, 2023; Volume 180, pp. 536–546. [Google Scholar] [CrossRef] [Scilit]
  29. Shan, H.; Fan, X.; Long, S.; Yang, X.; Yang, S. An Optimization Design Method of Express Delivery Service Based on Quantitative Kano Model and Fuzzy QFD Model. Discret. Dyn. Natire Soc. 2022, 2022, 5945908. [Google Scholar] [CrossRef] [Scilit]
  30. Liu, S.; Li, Y.; Huang, J.; Zhao, X. Understanding the Consumer Satisfaction of the “Last-Mile” Delivery of E-Business Services. In Proceedings of the Computer and Computing Technologies in Agriculture XI, CCTA 2017, Jilin, China, 12–15 August 2017; Li, D., Zhao, C., Eds.; IFIP Advances in Information and Communication Technology; Springer: Cham, Switzerland, 2019; Volume 546. [Google Scholar] [CrossRef] [Scilit]
  31. Diófási-Kovács, O.; Szilágyi, S. A Magyarországon működő CEP szolgáltatók széndioxid kibocsátásának, komparatív elemzése. In Terms of Greenhouse Gas Emissions Operating on the Hungarian CEP Market; Corvinus University Budapest, Institute of Business Economics: Budapest, Hungary, 2019; Available online: https://unipub.lib.uni-corvinus.hu/4157/1/Diofasi_Szilagyi_176.pdf (accessed on 12 November 2024).
  32. Harter, A.; Stich, L.; Spann, M. The Effect of Delivery Time on Repurchase Behavior in Quick Commerce. J. Serv. Res. 2025, 28, 211–227. [Google Scholar] [CrossRef] [Scilit]
  33. Situmorang, M.M.; Fadhilah, M.; Welsa, H.; Lukitaningsih, A. E-Service Quality, Delivery Timeliness, Customer Loyalty and Customer Satisfaction among J&T Service Users. In Mebidangro Metropolitan Area, Proceedings of the 1st International Conference on Social Environment Diversity (ICOSEND 2024), Semarang, Indonesia, 5–6 November 2024; Advances in Social Science, Education and Humanities Research; Atlantis Press part of Springer Nature: Dordrecht, The Netherlands, 2025; Volume 905, pp. 157–166. [Google Scholar] [CrossRef] [Scilit]
  34. Ivanova, U. Enhancing Last-Mile Delivery Efficiency: A Lean-Based Framework for Sustainable Logistics in the Helsinki Metropolitan Area. Bachelor’s Thesis, Haaga-Helia University of Applied Sciences, Helsinki, Finland, 2025. Available online: https://urn.fi/URN:NBN:fi:amk-202505069403 (accessed on 29 November 2025).
  35. Póka, V. A last-mile logisztika fő kihívásai és lehetséges jövőbeli irányai. (en. The main challenges and possible future directions of last-mile logistics). Acta Period. 2023, 28, 69–84. [Google Scholar] [CrossRef] [Scilit]
  36. Calabrò, G.; Le Pira, M.; Giuffrida, N.; Fazio, M.; Inturri, G.; Ignacollo, M. Modelling the Dinamics of Fragmented vs. Consolited Last-Mile E-commerce Deliveries via Agent-Based Model. Transp. Res. Procedia 2022, 62, 155–162. [Google Scholar] [CrossRef] [Scilit]
  37. Mount, C.; 3PLworldwide. The Future of Last-Mile Delivery: Innovative Strategies and Technologies to Keep an Eye On; 3PL Worldwide: Rancho Cucamonga, CA, USA, 2024; Available online: https://web.archive.org/web/20240810071255/https://www.3plworldwide.com/the-future-of-last-mile-delivery-innovative-strategies-and-technologies-to-keep-an-eye-on/ (accessed on 30 March 2025).
  38. Mangiaracina, R.; Perego, A.; Segghezi, A.; Tumino, A. Innovative Solutions to Increase Last-Mile Delivery Efficiency in B2C E-commerce: A Literature Review. Int. J. Phys. Distrib. Logist. Manag. 2019, 49, 901–920. [Google Scholar] [CrossRef] [Scilit]
  39. Lim, S.F.W.; Jin, X.; Srai, J.S. Consumer-driven e-commerce: A literature review, design framework, and research agenda on last-mile logistics models. Int. J. Phys. Distrib. Logist. Manag. 2018, 48, 308–332. [Google Scholar] [CrossRef] [Scilit]
  40. Siegfried, P.; Michel, A.; Tänzler, J.; Jiyuan, J. Analyzing Sustainability Issues in Urban Logistics in the Context of Growth of E-Commerce. Transp. Sci. 2022, 50, 363–761. [Google Scholar] [CrossRef] [Scilit] [PubMed]
  41. Caspersen, E.; Navrud, S. The sharing economy and consumer preferences for environmentally sustainable last mile deliveries. Transp. Res. Part D Transp. Environ. 2021, 95, 102863. [Google Scholar] [CrossRef] [Scilit]
  42. Villa, R.; Monzón, A. A Metro-Based System as Sustainable Alternative for Urban Logistics in the Era of E-Commerce. Sustainability 2021, 13, 4479. [Google Scholar] [CrossRef] [Scilit]
  43. Ballare, S.; Lin, J. Investigating the Use of Microhubs and Crowdshipping for Last Mile Delivery. Transp. Res. Procedia 2020, 46, 277–284. [Google Scholar] [CrossRef] [Scilit]
  44. Morganti, E.; Seidel, S.; Blanquart, C.; Dablanc, L.; Lenz, B. The Impact of E-commerce on Final Deliveries: Alternative Parcel Delivery Services in France and Germany. Transp. Res. Procedia 2014, 4, 178–190. [Google Scholar] [CrossRef] [Scilit]
  45. Vakulenko, Y.; Shams, P.; Hellström, D.; Hjort, K. Online retail experience and customer satisfaction: The mediating role of last mile delivery. Int. Rev. Retail. Distrib. Consum. Res. 2019, 29, 306–320. [Google Scholar] [CrossRef] [Scilit]
  46. Sahare, S.; Karande, K. Consumer Preferences in Last Mile Delivery Services. Psychol. Educ. J. 2020, 5699–5705. Available online: https://psychologyandeducation.net/pae/index.php/pae/article/view/2494/2174 (accessed on 12 November 2024).
  47. Choi, Y.; Gao, D. The role of intermediation in the governance of sustainable Chinese web marketing. Sustainability 2014, 6, 4102–4118. [Google Scholar] [CrossRef] [Scilit]
  48. Popescu, G.H. E-Commerce Effects on Social Sustainability. Econ. Manag. Financ. Mark. 2015, 10, 80–85. [Google Scholar]
  49. Tiwari, S.; Singh, P. E-Commerce: Prospect or Threat for Environment. Int. J. Environ. Sci. Dev. 2011, 2, 211–217. [Google Scholar] [CrossRef] [Scilit]
  50. Caspersen, E.; Navrud, S.; Bengtsson, J. Act locally? Are female online shoppers willing to pay to reduce the carbon footprint of last-mile deliveries? Int. J. Sustain. Transp. 2022, 16, 1144–1158. [Google Scholar] [CrossRef] [Scilit]
  51. Arnold, F.; Cardenas, I.; Sörensen, K.; Dewulf, W. Simulation of B2C e-commerce distribution in Antwerp using cargo bikes and delivery points. Eur. Transp. Res. Rev. 2018, 10, 2. [Google Scholar] [CrossRef] [Scilit]
  52. Aljohani, K. The Role of Last-Mile Delivery Quality and Satisfaction in Online Retail Experience: An Empirical Analysis. Sustainability 2024, 16, 4743. [Google Scholar] [CrossRef] [Scilit]
  53. Pourmohammadreza, N.; Jokar, M.R.A.; Van Woensel, T. Last-mile logistics with alternative delivery locations: A systematic literature review. Results Eng. 2023, 25, 104085. [Google Scholar] [CrossRef] [Scilit]
  54. Mangano, G.; Zenezini, G.; Cagliano, A.C. Value Proposition for Sustainable Last-Mile Delivery. A Retailer Perspective. Sustainability 2021, 13, 3774. [Google Scholar] [CrossRef] [Scilit]
  55. Belvedere, V.; Kotzab, H.; Martinelli, E.M. Environmental sustainability and information sharing related to delivery options in the B2B2C context of e-commerce: Evidence from a survey. J. Bus. Ind. Mark. 2024, 44, 877–895. [Google Scholar] [CrossRef] [Scilit]
  56. González-Romero, I.; Bastero-Sellán, J.; Prado-Prado, J.C. Assessing the impact of time windows on last-mile sustainability: A scoreboard-based approach and case study analysis. J. Ind. Eng. Manag. 2025, 18, 100–114. [Google Scholar] [CrossRef] [Scilit]
  57. Kokkinou, A.; Quak, H.; Mitas, O.; Mandemakers, A. Should I wait or should I go? Encouraging customers to make the more sustainable delivery choice. Res. Transp. Econ. 2025, 103, 101388. [Google Scholar] [CrossRef] [Scilit]
  58. Kano, N.; Seraku, K.; Takahashi, F.; Tsuji, S. Attractive quality and must-be quality. J. Jpn. Soc. Qual. Control 1984, 14, 39–48. [Google Scholar]
  59. Shahin, A.; Pourhamidi, M.; Antony, J.; Park, S.H. Typology of Kano Models: A Critical Review of Literature and Proposition of a Revised Model. Int. J. Qual. Reliab. Manag. 2013, 30, 341–358. [Google Scholar] [CrossRef] [Scilit]
  60. Rivière, P.; Monrozier, R.; Rogeaux, M.; Pages, J.; Saporta, G. Adaptive preference target: Contribution of Kano’s model of satisfaction for an optimized preference analysis using a sequential consumer test. Food Qual. Prefer. 2006, 17, 572–581. [Google Scholar] [CrossRef] [Scilit]
  61. Nilsson-Witell, L.; Fundin, A. Dynamics of service attributes: A test of Kano’s theory of attractive quality. Int. J. Serv. Ind. Manag. 2005, 16, 152–168. [Google Scholar] [CrossRef] [Scilit]
  62. Matzler, K.; Hinterhuber, H.H. How to make product development projects more successful by integrating Kano’s model of customer satisfaction into quality function deployment. Technovation 1998, 18, 25–38. [Google Scholar] [CrossRef] [Scilit]
  63. Yang, C.C. The Refined Kano’s Model and Its Application. Total Qual. Manag. Bus. Excell. 2005, 16, 1127–1137. [Google Scholar] [CrossRef] [Scilit]
  64. Cheng, F.M.; Wang, J.; Chen, C.; Cao, Z.J. Product design improvement method driven by online product reviews. Nat. Sci. Rep. 2025, 15, 10252. [Google Scholar] [CrossRef] [Scilit] [PubMed]
  65. Majava, J.; Nuottila, J.; Haapasalo, H.; Law, M.Y.K. Customer Needs in Market-Driven Product Development: Product Management and R&D Standpoints. Technol. Invest. 2014, 5, 16–25. [Google Scholar] [CrossRef]
  66. Clegg, B.; Wang, T.; Ji, P. Understanding customer needs through quantitative analysis of Kano’s model. Int. J. Qual. Reliab. Manag. 2010, 27, 173–184. [Google Scholar] [CrossRef] [Scilit]
  67. Sauerwein, E. Experiences with the reliability and validity of the Kano-method: Comparison to alternate forms of classification of product requirements. In Proceedings of the Transactions of the 11th Symposium on QFD, Novi, MI, USA, 12–18 June 1999; QFD Institute: Ann Arbor, MI, USA; Department of Management University of Innsbruck: Innsbruck, Austria, 1999; Available online: https://pdfcoffee.com/kano-model-reliability-and-validity-pdf-free.html (accessed on 30 March 2025).
  68. Lee, Y.C.; Huang, S.Y. A new fuzzy concept approach for Kano’s model. Expert Syst. Appl. 2009, 36, 4479–4484. [Google Scholar] [CrossRef] [Scilit]
  69. Eurostat. E-Commerce Statistics for Individuals: Statistics Explained, Data Extracted. 2025. Available online: https://ec.europa.eu/eurostat/statistics-explained/SEPDF/cache/46776.pdf (accessed on 7 February 2025).
  70. Mishra, S.; Golias, M.M.; Samani, A.R.; Kaisar, E.I.; Figliozzi, M.A. Modeling Household E-Commerce Delivery Rates and Assessing Households Last-Mile Delivery Preferences; Project ID: Y6R2-22; Freight Mobility Research Institute College of Engineering & Computer Science, Florida Atlantic University: Boca Raton, FL, USA, 2023; Available online: https://www.fau.edu/engineering/research/fmri/pdf/research-projects/y6r2-22-uofm-mishra.pdf?utm_source=chatgpt.com (accessed on 3 March 2025).
  71. Bădîrcea, R.M.; Manta, A.G.; Florea, N.M.; Popescu, J.; Manta, F.L.; Puiu, S. E-Commerce and the Factors Affecting Its Development in the Age of Digital Technology: Empirical Evidence at EU–27 Level. Sustainability 2022, 14, 101. [Google Scholar] [CrossRef] [Scilit]
  72. Tontini, G.; Søilen, K.S.; Silveira, A. How interactions of service attributes affect customer satisfaction? An analysis based on psychological foundations. Total Qual. Manag. Bus. Excell. 2013, 24, 1253–1271. [Google Scholar] [CrossRef] [Scilit]
  73. Löfgren, M.; Witell, L.; Gustafsson, A. Theory of attractive quality and life cycles of quality attributes. TQM J. 2011, 23, 235–246. [Google Scholar] [CrossRef] [Scilit]
  74. Fabio, R.A.; Croce, A.; Calabrese, C. Bridging the green attitude–behavior gap. J. Sustain. Res. 2025, 7, e250059. [Google Scholar] [CrossRef] [Scilit]
  75. Beatson, A.; Gottlieb, U.; Pleming, K. Green consumption practices for sustainability: An exploration through social practice theory. J. Soc. Mark. 2020, 10, 197–213. [Google Scholar] [CrossRef] [Scilit]
  76. Neves, C.; Oliveira, T.; Santini, F. Understanding the determinants of sustainable consumption behavior: Insights from a meta and weight analysis. J. Environ. Manag. 2025, 393, 126932. [Google Scholar] [CrossRef] [Scilit] [PubMed]
  77. Parasuraman, A. Technology Readiness Index (Tri): A Multiple-Item Scale to Measure Readiness to Embrace New Technologies. J. Serv. Res. 2000, 2, 307–320. [Google Scholar] [CrossRef] [Scilit]
  78. Yoo, W.; Yu, E.; Jung, J. Drone delivery: Factors affecting the public’s attitude and intention to adopt. Telemat. Inform. 2018, 35, 1687–1700. [Google Scholar] [CrossRef] [Scilit]
Figure 1. Kano-model. Source: Based on [58,59] cf.
Logistics 10 00086 g001
Figure 2. Function–agreement matrix for the provided features (authors’ own editing, 2026).
Logistics 10 00086 g002
Figure 3. Function–agreement matrix for the examined features with fuzzy ranges (authors’ own editing, 2026).
Logistics 10 00086 g003
Figure 4. Function–agreement matrix for Last mile convenience services (authors’ own editing, 2026).
Logistics 10 00086 g004
Table 1. Literature-based taxonomies of last-mile convenience services: 7 dimensions.
Category:Type:Interpretation:
1. Time-based embedded services (time dimension)
  • instant delivery, e.g., express/same-day/same-hour services;
  • time-window delivery;
  • precisely timed delivery/scheduled (time-specific delivery);
  • subscription-based/recurring service.
In the context of time-based services, expectations regarding delivery speed and accuracy are becoming increasingly demanding, making these factors key determinants of customer satisfaction [32,33,34]
2. Pickup methods, (according to type of contact)
  • personal handover (in-hand), with/or without contact;
  • uncontrolled drop-off delivery (leave-at-door) doorstep delivery/curbside pickup;
  • controlled drop-off (leave-at), with an authorized person/or not authorized/e.g., neighbor;
  • signature-required (approved) delivery/no-signature delivery.
The place and mode of delivery constitute one of the most important convenience factors for customers, as they influence both flexibility and delivery costs [11,35].
3. Pickup methods, (according to place of handover)
  • door-to-door delivery;
  • organized pickup-point delivery, e.g., pickup points/Pick Pack points/postal pickup points, convenience stores, pharmacies;
  • own-brand retail pickup point (company-operated store pickup);
  • contracted partner pickup point, e.g., CDP (Click-and-Collect) delivery/automated drop-box terminals/vendor lockers/automated convenience stores;
  • alternative delivery solutions to dynamic locations, e.g., car trunk delivery, drone station.
One of the major challenges in last-mile logistics is the search for an optimal balance between cost and convenience in the relationship between highly diversified end-point oriented deliveries and city logistics systems toward consolidated pickup locations. At the same time, these pickup and collection points allow customers to retrieve their parcels according to their own schedules, while also enabling service providers to optimize delivery routes. Examples include CDP Click-and-Collect services [36], automated parcel locker systems [37], trunk delivery [38,39].
4. Value-added convenience services during the handover process
  • door-to-door delivery;
  • in-home/upstairs/in-apartment/delivery to the point of use, “shelf placement,” heavy-item placement;
  • unpacking/setup/assembly/expert inspection/professional consultation, feedback confirmation services;
  • ”confidential handover”/choice of delivery agent (familiar or trusted courier);
  • special delivery options: cold-chain delivery/white-glove service (contactless)/special packaging/palletizing, packaging-free delivery, discreet delivery;
  • trained and courteous couriers;
  • returns handling/collection of waste and packaging materials;
  • environmentally friendly/sustainability-oriented services.
The handover process offers numerous opportunities to expand convenience services that can enhance customer satisfaction and differentiate the service provider from its competitors. These services can help elevate the brand and create memorable unboxing experiences for customers [40].
5. Eco-friendly and sustainability-related services
  • technology-oriented solutions:
  • green products;
  • green/environmentally -friendly packaging materials;
  • green delivery vehicles;
  • electric vehicles (“zero-emission” vehicles)/battery-swap electric vehicles;
  • future-oriented solutions, e.g., drone delivery/autonomous robots/drone drop-off/autonomous micro-hubs;
  • infrastructural solutions:
  • rail-based, track-based modes;
  • dynamic and/or shared urban distribution centers, e.g., containerized mobile consolidation units/cross-docking hubs/urban distribution centers;
  • collaborative delivery models:
  • community-based services/crowdshipping;
  • shared delivery points (units)/information-sharing-based platform services
Environmentally conscious customers tend to positively prefer environmentally -friendly packaging [41], as well as parcel-tracking and handling conditions that reflect lower environmental impact [24]. They also show a favorable attitude toward other green solutions such as rail-based transport modes [42], electric vehicles, shared delivery networks, crowdshipping [43], and urban distribution centers, all of which help reduce emissions while simultaneously improving efficiency.
6. Flexibility services
  • redirection/modification/dynamic address/dynamic time-slot/dynamic cancellation;
  • monitoring/real-time tracking/information services/pre-notification;
  • live communication channels/direct contact options;
  • online presence/augmented-reality courier glasses.
Flexibility services enable customers to modify the delivery process or its parameters at various stages, thereby increasing satisfaction and reducing the number of failed deliveries. A strong digital presence further supports accurate and error-free operations [44].
7. Payment and pricing flexibility
  • pre-payment options/secure transactions/online tipping/charitable donations/commission options;
  • cash-on-delivery (COD)/card payment/e-wallet payment/coupon redemption/guaranteed refunds/buy-back options;
  • delivery-dependent dynamic pricing (time-window, urgency)
Payment options—particularly the choice between pre-payment and cash-on-delivery—represent a highly sensitive aspect of the service, as they can either deter or attract a significant share of customers. Dynamic pricing and the ability to choose among various payment and pricing options play a crucial role in fostering customer loyalty [45].
Source: Authors’ compilation, 2026.
Table 2. Kano evaluation table [59].
Dysfunctional Form of the Question
Functional form of the questionCustomer NeedsI like this feature omittedI need this feature omittedI am neutral
about this feature
I can live with
omitting this
feature
I dislike omitting this
feature
I like this feature includedQAAAO
I need this feature includedRIIIM
I am neutral about this featureRIIIM
I can live with including this featureRIIIM
I dislike including this featureRRRRQ
Table 3. How the Kano evaluation table works (authors’ own editing based on [59]).
Answering a Functional QuestionAnswering a Dysfunctional QuestionCategorySign
Must-be: I need this feature includedReverse: I dislike omitting this featureMust-be as minimum
“hygiene” requirements (Must-be)
M
Attractive: I would be happy about it.Reverse: I dislike omitting this featurePerformance factors as
(One-dimensional)
O
Attractive: I would be happy about it.Indifferent: I am neutral about this feature & Must-be & One-dimensionalAttractive factors
(Attractive)
A
Indifferent: I am neutral about this featureIndifferent: I am neutral about this feature; & Must-be & One-dimensionalIndifferent factors
(Indifferent)
I
Reverse: I dislike including this featureOne-dimensional: I need this feature omitted & Attractive & Must-be & Indifferent Reverse factors (Reverse)R
Reverse: I dislike including this featureReverse: I dislike omitting this featureQuestionable factors
(Questionable)
Q
Attractive: I would be happy about it.Attractive: I would be happy about it.Questionable factors
(Questionable)
Q
Source: authors’ own editing, 2026.
Table 4. Modified Kano evaluation table adjusted to a satisfaction-based Likert scale.
Dysfunctional Form of the Question
Functional form of the questionCustomer needsI would be very
satisfied
I would be
satisfied
I would be neutralI would be dissatisfiedI would be very dissatisfied
I would be very satisfiedQAAOO
I would be satisfiedQIAMO
I would be neutralRRIMM
I would be dissatisfiedRRRIQ
I would be very dissatisfiedRRRQQ
Source: authors’ own editing, 2026.
Table 5. The distribution of respondents (Source: authors’ own editing, Survey of Convenience Services in Last-Mile Logistics 2026).
Gender of Respondents
Men8941.6%
Women12357.5%
Other20.9%
Age of respondents
Less than 1820.9%
Between 18 and 29 4119.2%
Between 30 and 39 7836.4%
Between 40 and 49 3415.9%
Between 50 and 59 4018.7%
Over 60 198.9%
How often do you order online?
Several times a week115.1%
Weekly3114.5%
A few times a month7434.6%
Monthly5827.1%
Rarely4018.7%
What type of settlement do you live in?
Village157.0%
Municipality209.3%
City6429.9%
City with County Rights73.3%
County seat4822.4%
Capital6028.0%
Distribution of respondents by country?
Hungarian214100%
Other00%
What is your highest educational qualification?
Primary school education31.4%
Vocational school104.7%
Secondary school6630.8%
Degree13563.1%
What is the average monthly income of your household?
Less than 300,000 Ft (less than 909$; 1 USD ≈ 330 HUF)157.0%
Between 300,001 Ft and 400,000 Ft (909 $–1212 $)167.5%
Between 400,001 Ft and 500,000 Ft (1212 $–1515 $)3315.4%
Between 500,001 Ft and 600,000 Ft (1515 $–1818 $)2913.6%
Between 600,001 Ft and 700,000 Ft (1818 $–2121 $)219.8%
Between 700,001 Ft and 800,000 Ft (2121 $–2424 $)2712.6%
Over 800,000 Ft (>2424 $)7334.1%
Table 6. Individual statements in the KANO categories.
QuestionCategory
1. What would you say if the service provider delivering your order used environmentally friendly logistics transport solutions (green vehicles, fuel, electromobility, green transshipment terminal)?Attractive or exciting factor.
2. What would you say if same-day delivery was available at your chosen webshop or online retailer?An Attractive or exciting factor that is starting to slip into the One-dimensional performance factor category, but is also close to the qualifying Must-be category.
3. How about you could choose a one-hour time slot and place your order within that time slot?Attractive or exciting factor.
4. What would you say if you could see if you could track your order online?It is a One-dimensional performance factor, but it is also close to the qualifying Must-be requirement.
5. What would you say if your preferred payment method was available? (prepayment, cash, apple pay, revolut), at the delivery point?A clear One-dimensional performance factor.
6. How would you like it if the packaging you receive your order in was green and environmentally friendly (packaging material and method)?Attractive or exciting factor.
7. What would you say if you could change the address during delivery or request your order to be delivered to a parcel machine?An Attractive or exciting factor that is close to the qualifying Must-be category.
8. What would you say if you could cancel your order during delivery?An Attractive or exciting factor that is close to the qualifying Must-be category.
9. What would you say if the delivery was done by drone or autonomous car?Indifferent, neutral, which is close to the reverse or opposite factor range.
10. How would you like it if delivery was made within an hour of placing the order?A strong Attractive or attractive factor.
11. What would you say if a bag-free or box-free service was available for the webshop of your choice?Indifferent, neutral, which is close to the attractive range.
Attractive, or exciting factor, which is close to the indifferent range.
12. What would you say if you could choose next-generation innovative convenience solutions during delivery, such as: community solutions, confidential delivery, cooling guarantee, home packaging?An Attractive or exciting factor that is close to the Indifferent range.
Disclaimer/Publisher’s Note: The statements, opinions and data contained in all publications are solely those of the individual author(s) and contributor(s) and not of MDPI and/or the editor(s). MDPI and/or the editor(s) disclaim responsibility for any injury to people or property resulting from any ideas, methods, instructions or products referred to in the content.