Perceived Risk of Fish Consumption in a Low Fish Consumption Country


Abstract
:1. Introduction
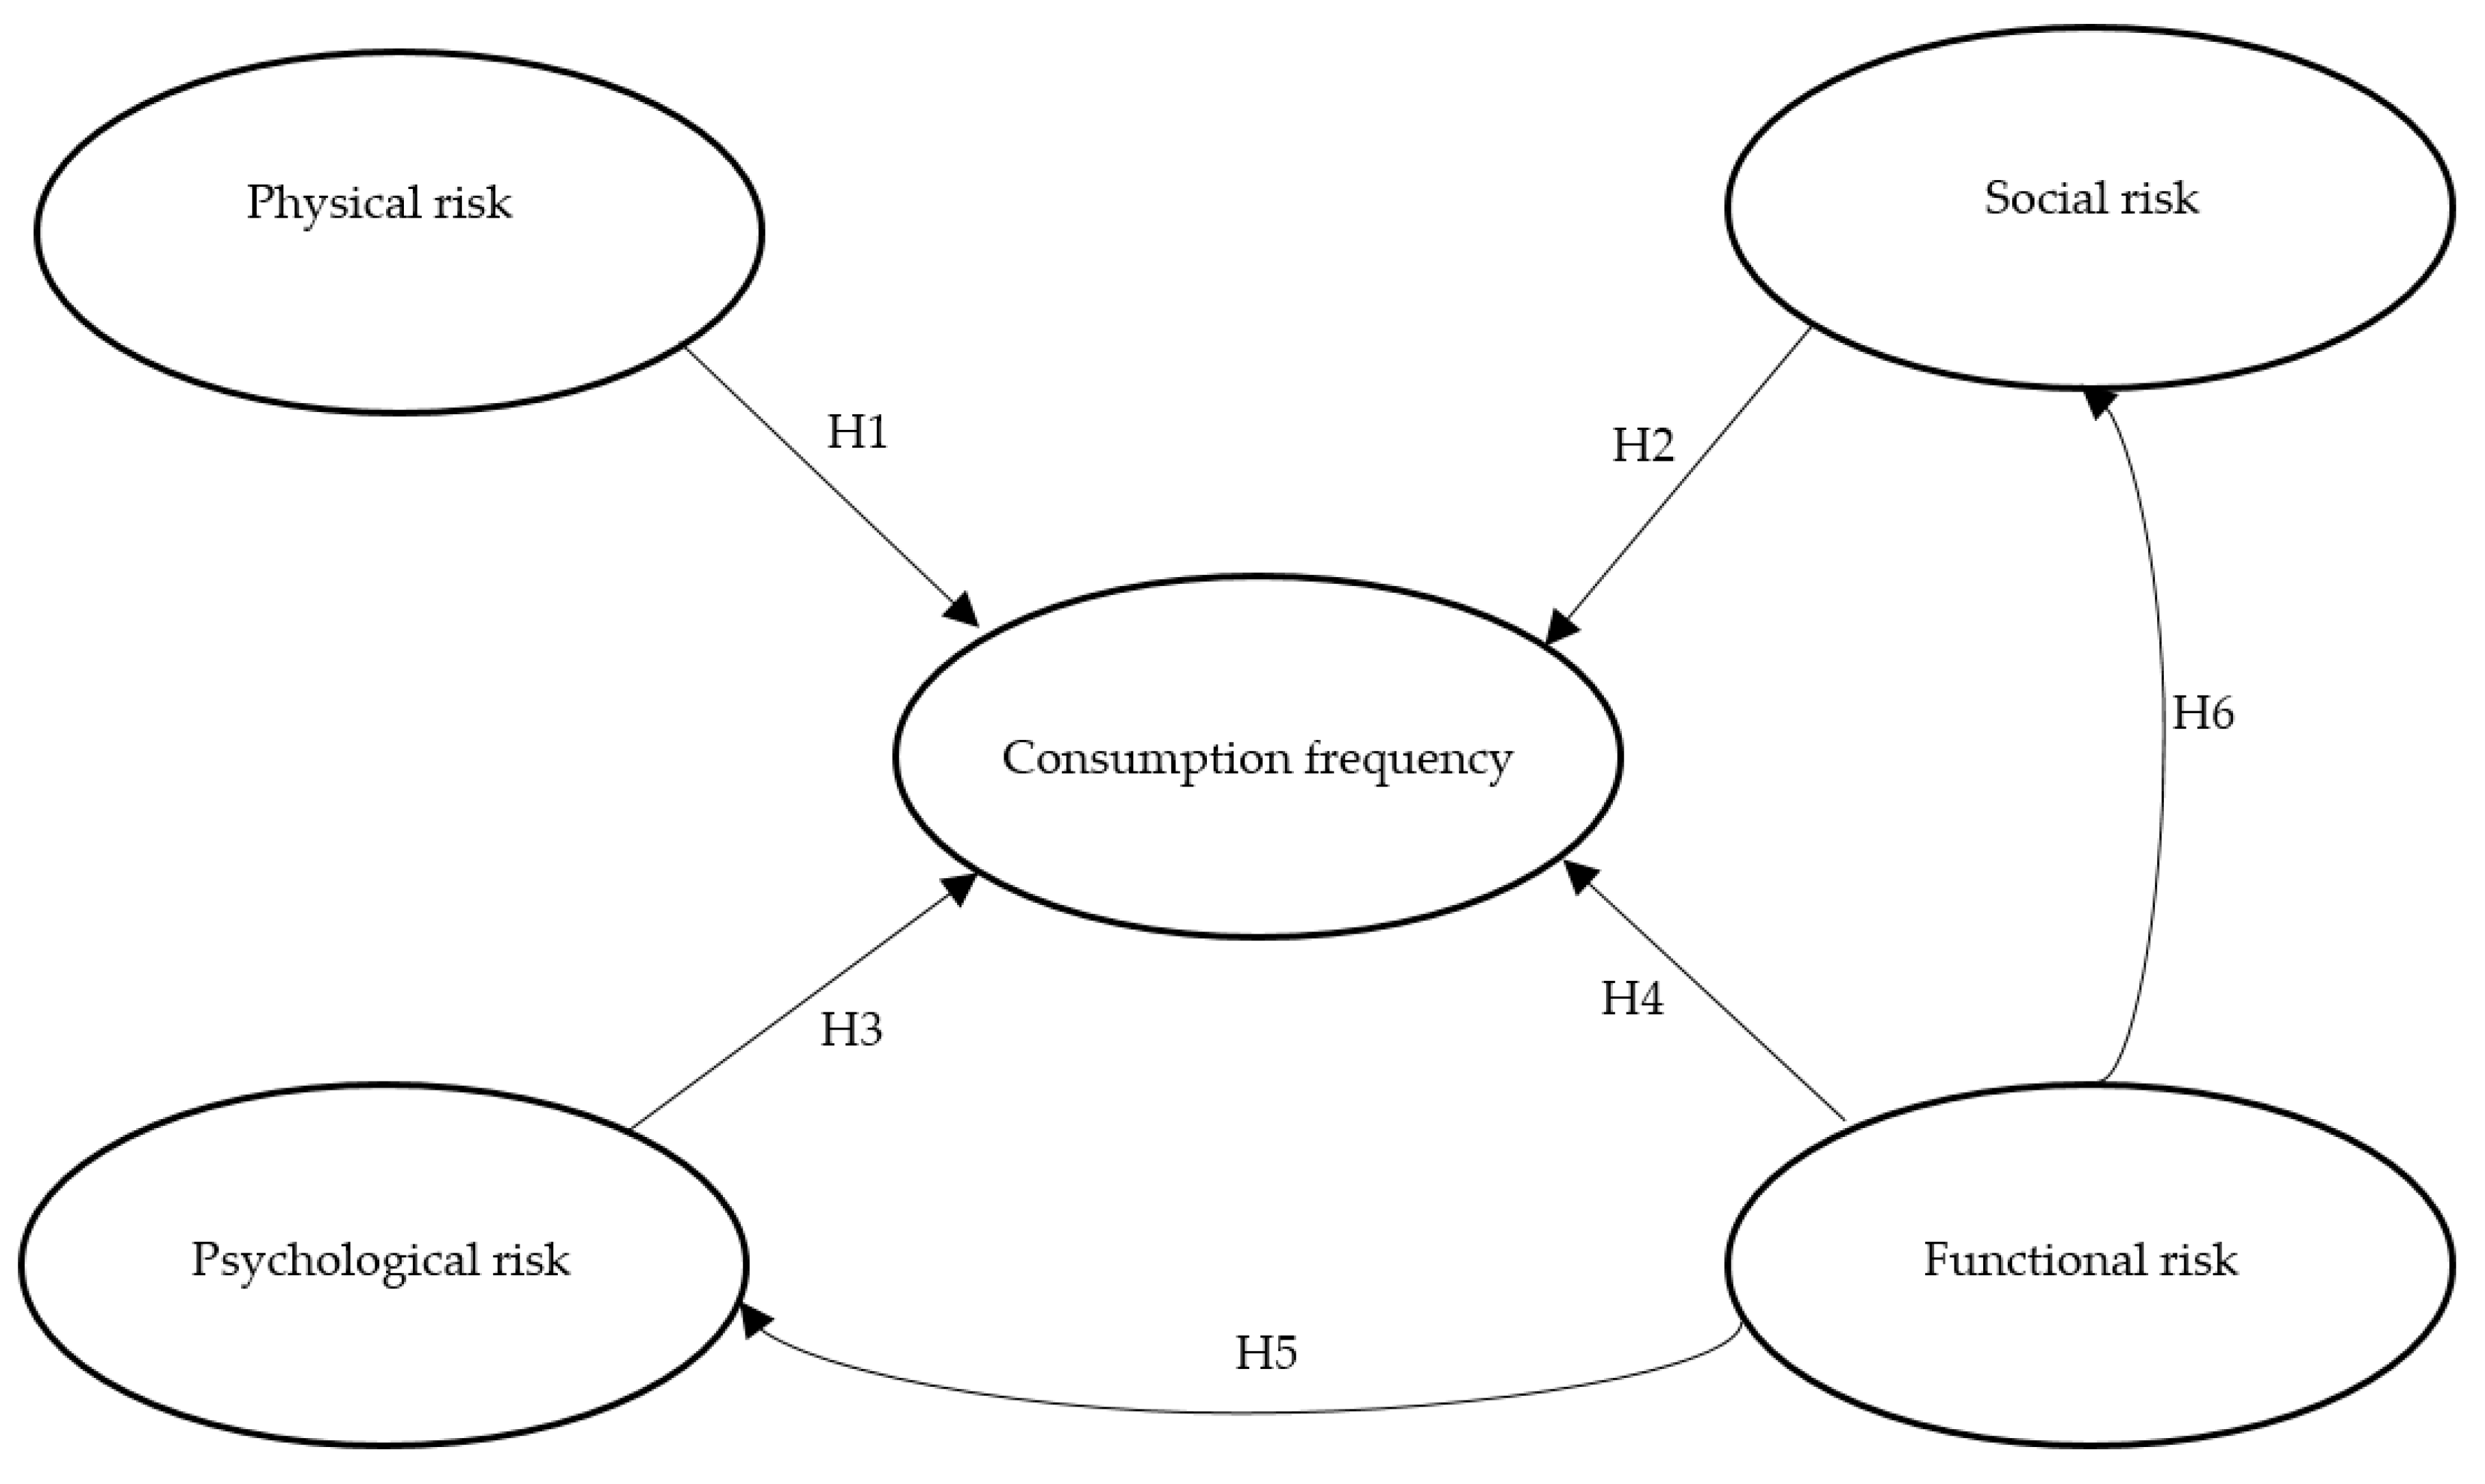
1.1. Conceptual Model
1.1.1. Physical Risks
1.1.2. Social Risks
1.1.3. Psychological Risks
1.1.4. Functional Risks
1.1.5. Interaction Effects
2. Materials and Methods
3. Results
3.1. Frequency of Fish Consumption
3.2. Measurement of Model
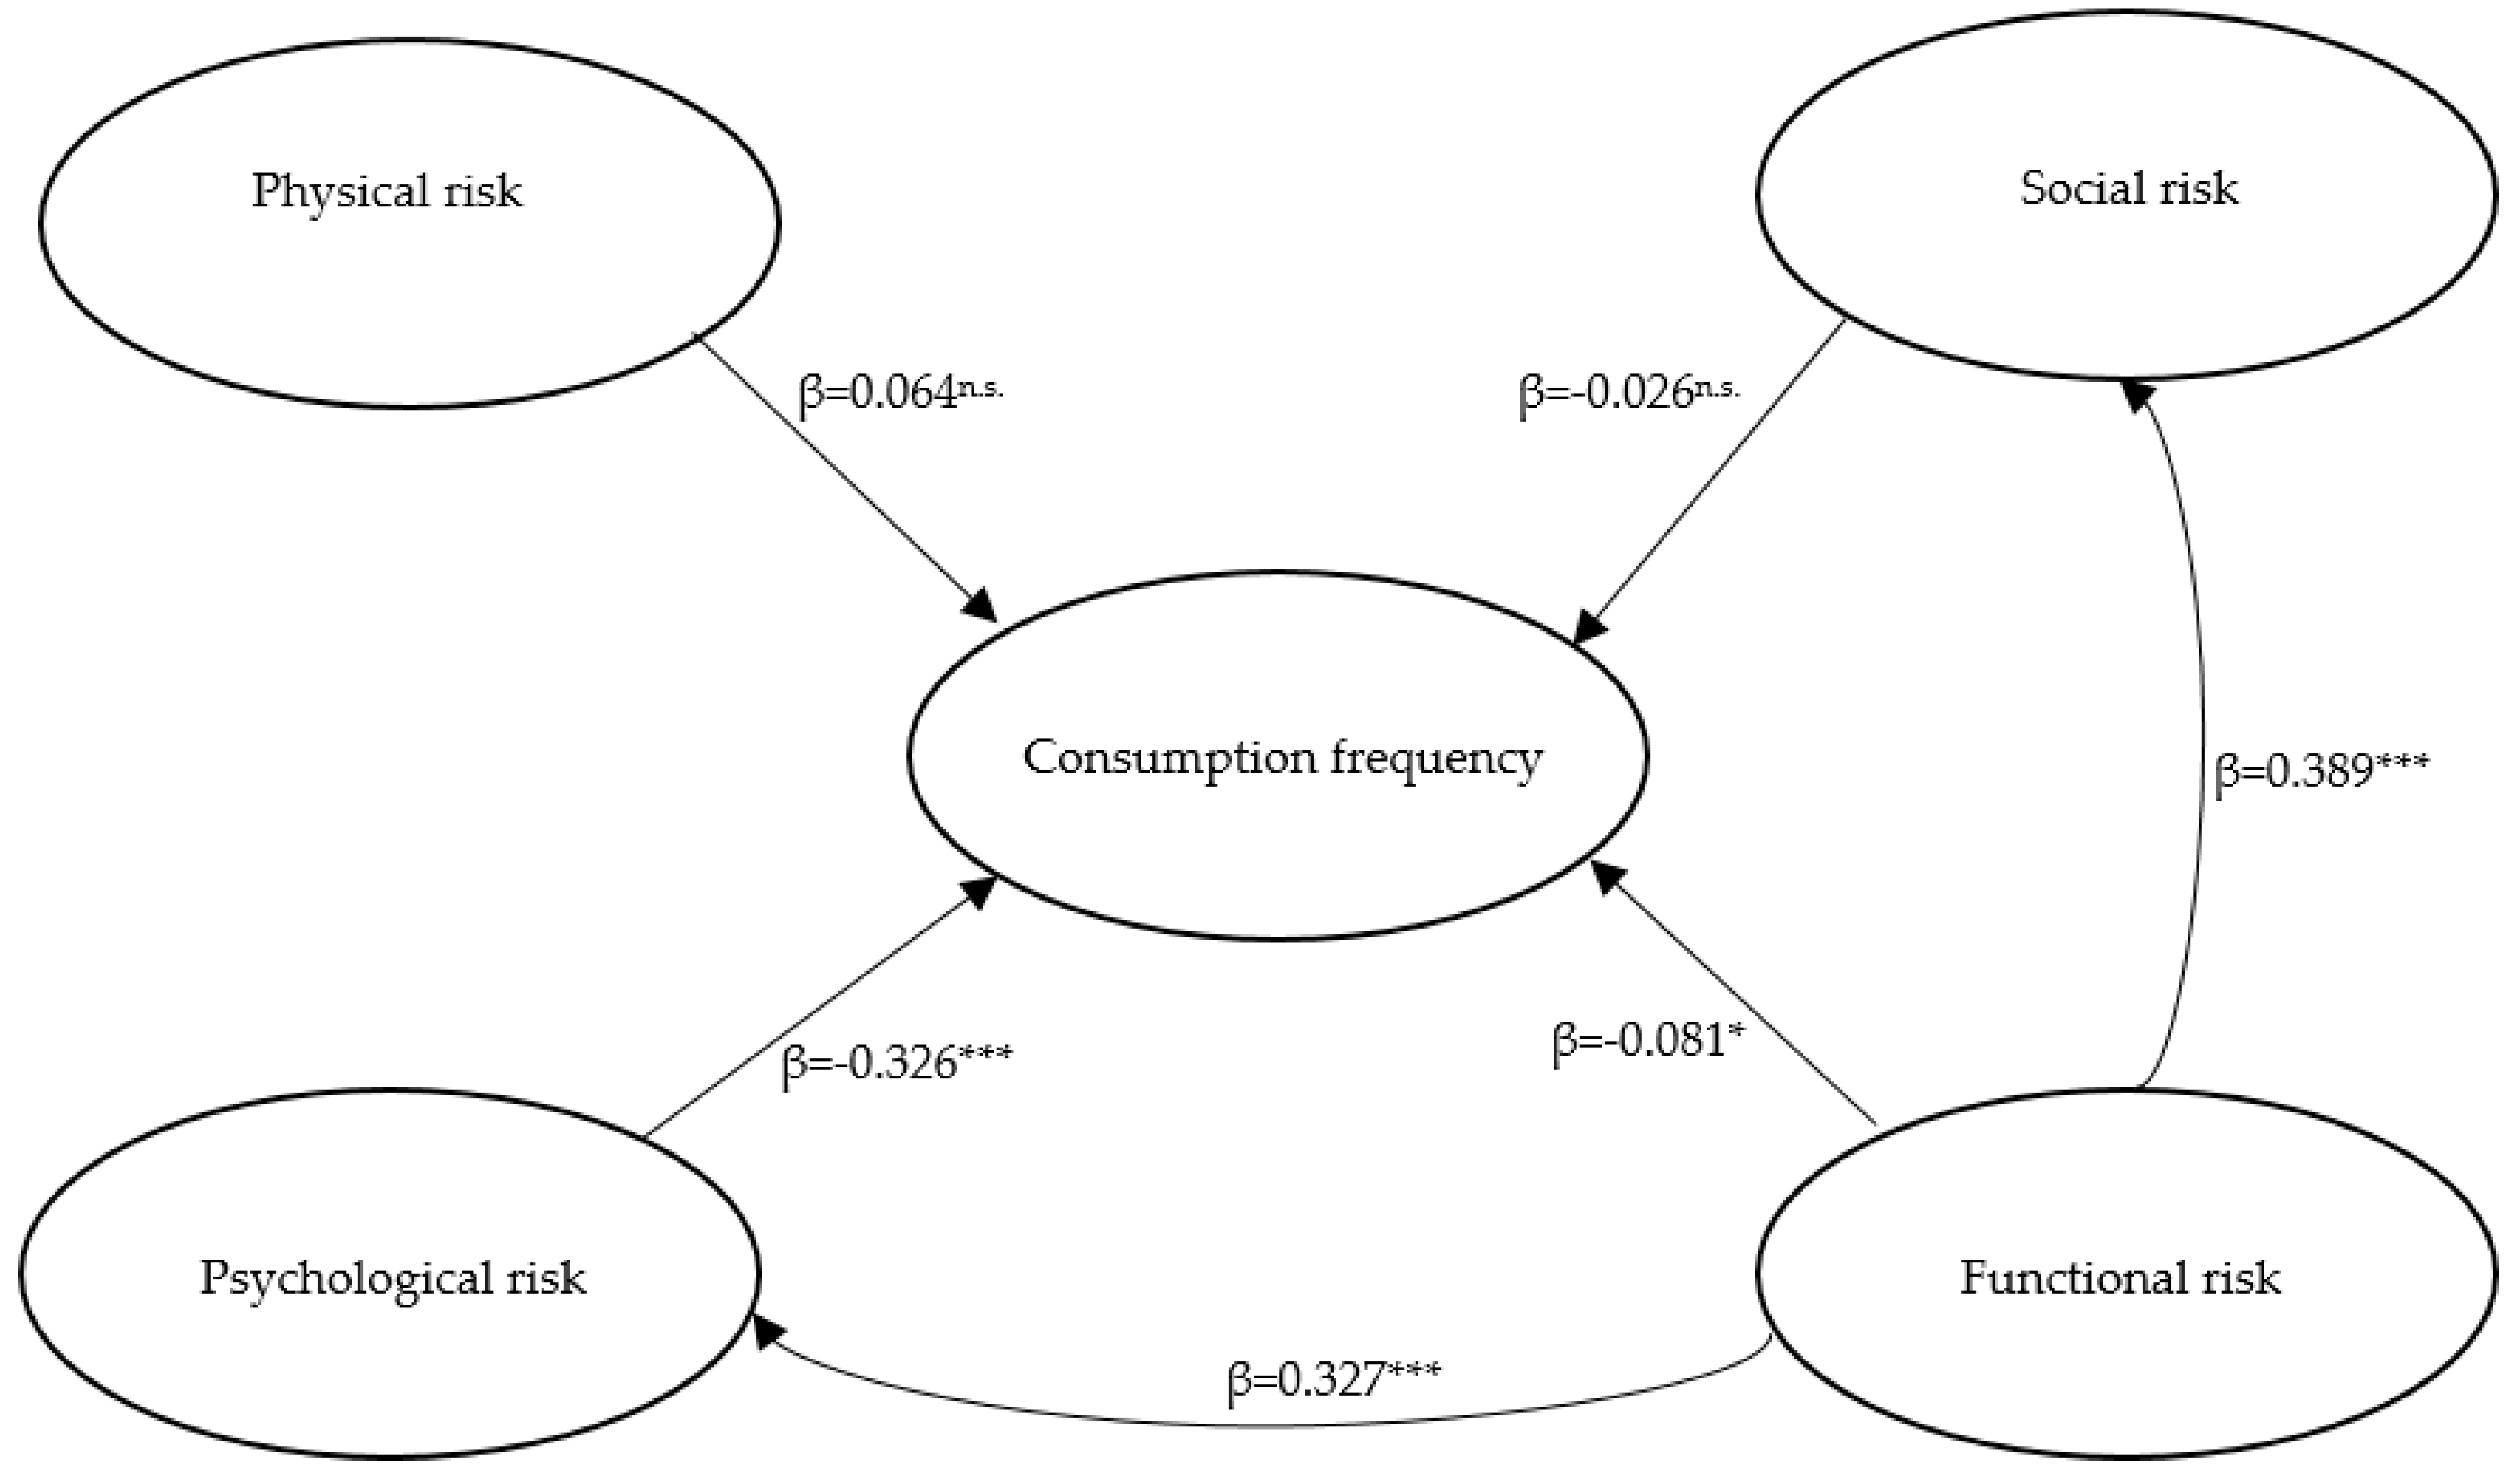
3.3. Structural Model Assessment
4. Discussion
5. Limitations and Further Research
Author Contributions
Funding
Acknowledgments
Conflicts of Interest
References
- Olsen, S.O. Antecedents of seafood consumption behavior: An overview. J. Aquat. Food Prod. Technol. 2004, 13, 79–91. [Google Scholar] [CrossRef]
- Carlucci, D.; Nocella, G.; De Devitiis, B.; Viscecchia, R.; Bimbo, F.; Nardone, G. Consumer purchasing behaviour towards fish and seafood products. Patterns and insights from a sample of international studies. Appetite 2015, 84, 212–227. [Google Scholar] [CrossRef] [PubMed]
- Supartini, A.; Oishi, T.; Yagi, N. Changes in fish consumption desire and its Factors: A Comparison between the United Kingdom and Singapore. Foods 2018, 7, 97. [Google Scholar] [CrossRef] [PubMed] [Green Version]
- Skuland, S.E. Healthy eating and barriers related to social class. The case of vegetable and fish consumption in Norway. Appetite 2015, 92, 217–226. [Google Scholar] [CrossRef] [PubMed]
- Pinho, M.G.M.; Mackenbach, J.D.; Charreire, H.; Oppert, J.M.; Bárdos, H.; Glonti, K.; Rutter, H.; Compernolle, S.; De Bourdeaudhuij, I.; Beulens, J.W.J.; et al. Exploring the relationship between perceived barriers to healthy eating and dietary behaviours in European adults. Eur. Nutr. 2018, 57, 1761–1770. [Google Scholar] [CrossRef] [Green Version]
- Badr, L.M.; Salwa, O.; Ahmed, Y. Perceived barriers to consumption of freshwater fish in Morocco. Br. Food J. 2015, 117, 274–285. [Google Scholar] [CrossRef]
- Hosseini, S.M.; Adeli, A.; Vahedi, M. Evaluating factors and barriers affecting on per capita fish consumption in Sari. J. Fish. 2016, 69, 341–350. [Google Scholar]
- Christenson, J.K.; O’Kane, G.M.; Farmery, A.K.; McManus, A. The barriers and drivers of seafood consumption in Australia: A narrative literature review. Int. J. Consum. Stud. 2017, 41, 299–311. [Google Scholar] [CrossRef] [Green Version]
- Maciel, E.S.; Sonati, J.G.; Lima, L.K.F.; Savay-da-Silva, L.K.; Galvão, J.A.; Oetterer, M. Similarities and distinctions of fish consumption in Brazil and Portugal measured through electronic survey. Int. Food Res. J. 2016, 23, 395–402. [Google Scholar]
- Higuchi, A.; Davalos, J.; Hernani-Merino, M. Theory of planned behavior applied to fish consumption in modern Metropolitan Lima. Food Sci. Technol. 2017, 37, 202–208. [Google Scholar] [CrossRef] [Green Version]
- EUMOFA. The EU Fish Market, 2019 Edition. Available online: https://www.eumofa.eu/documents/20178/314856/EN_The+EU+fish+market_2019.pdf/ (accessed on 6 April 2020).
- Zheng, J.S.; Hu, X.J.; Zhao, Y.M.; Yang, J.; Li, D. Intake of fish and marine n-3 polyunsaturated fatty acids and risk of breast cancer: Meta-analysis of data from 21 independent prospective cohort studies. BMJ 2013, 346, f3706. [Google Scholar] [CrossRef] [PubMed] [Green Version]
- Rondanelli, M.; Rigon, C.; Perna, S.; Gasparri, C.; Iannello, G.; Akber, R.; Naso, M.; Freije, A.M. Novel Insights on Intake of Fish and Prevention of Sarcopenia: All Reasons for an Adequate Consumption. Nutrients 2020, 12, 307. [Google Scholar] [CrossRef] [PubMed] [Green Version]
- Supartini, A.; Oishi, T.; Yagi, N. Sex differences in the relationship between sleep behavior, fish consumption, and depressive symptoms in the general population of South Korea. Int. J. Environ. Res. Public Health 2017, 14, 789. [Google Scholar] [CrossRef] [PubMed] [Green Version]
- Raji, C.A.; Erickson, K.I.; Lopez, O.L.; Kuller, L.H.; Gach, H.M.; Thompson, P.M.; Riverol, M.; Becker, J.T. Regular fish consumption and age-related brain gray matter loss. Am. J. Prev. Med. 2014, 47, 444–451. [Google Scholar] [CrossRef] [PubMed] [Green Version]
- Mozaffarian, D.; Bryson, C.L.; Lemaitre, R.N.; Burke, G.L.; Siscovick, D.S. Fish intake and risk of incident heart failure. J. Am. Coll. Cardiol. 2005, 45, 2015–2021. [Google Scholar] [CrossRef] [PubMed] [Green Version]
- Raatz, S.K.; Silverstein, J.T.; Jahns, L.; Picklo, M.J. Issues of fish consumption for cardiovascular disease risk reduction. Nutrients, 2013, 5, 1081–1097. [Google Scholar] [CrossRef] [PubMed]
- Owen, A.J.; Abramson, M.J.; Ikin, J.F.; McCaffrey, T.A.; Pomeroy, S.; Borg, B.M.; Gao, C.; Brown, D.; Ofori-Asenso, R. Recommended Intake of Key Food Groups and Cardiovascular Risk Factors in Australian Older, Rural-Dwelling Adults. Nutrients 2020, 12, 860. [Google Scholar] [CrossRef] [Green Version]
- Ghasemi Fard, S.; Wang, F.; Sinclair, A.J.; Elliott, G.; Turchini, G.M. How does high DHA fish oil affect health? A systematic review of evidence. Crit. Rev. Food Sci. Nutr. 2019, 59, 1684–1727. [Google Scholar] [CrossRef] [Green Version]
- EUROSTAT. Cardiovascular Diseases Statistics (November 2019). Available online: https://ec.europa.eu/eurostat/statistics-explained/index.php/Cardiovascular_diseases_statistics#Deaths_from_cardiovascular_diseases (accessed on 6 April 2020).
- EHN. European Cardiovascular Disease Statistics. 2017. Available online: www.ehnheart.org/cvd-statistics/cvd-statistics-2017.html (accessed on 6 April 2020).
- FAO Yearbook. Fishery and Aquaculture Statistics 2017; Food and Agriculture Organization of the United Nations: Rome, Italy, 2019; Available online: http://www.fao.org/3/ca5495t/CA5495T.pdf (accessed on 18 August 2020).
- Palotás, P.; Jónás, G.; Lehel, J.; Friedrich, L. Preservative Effect of Novel Combined Treatment with Electrolyzed Active Water and Lysozyme Enzyme to Increase the Storage Life of Vacuum-Packaged Carp. J. Food Qual. 2020, 2020, 4861471. [Google Scholar] [CrossRef] [Green Version]
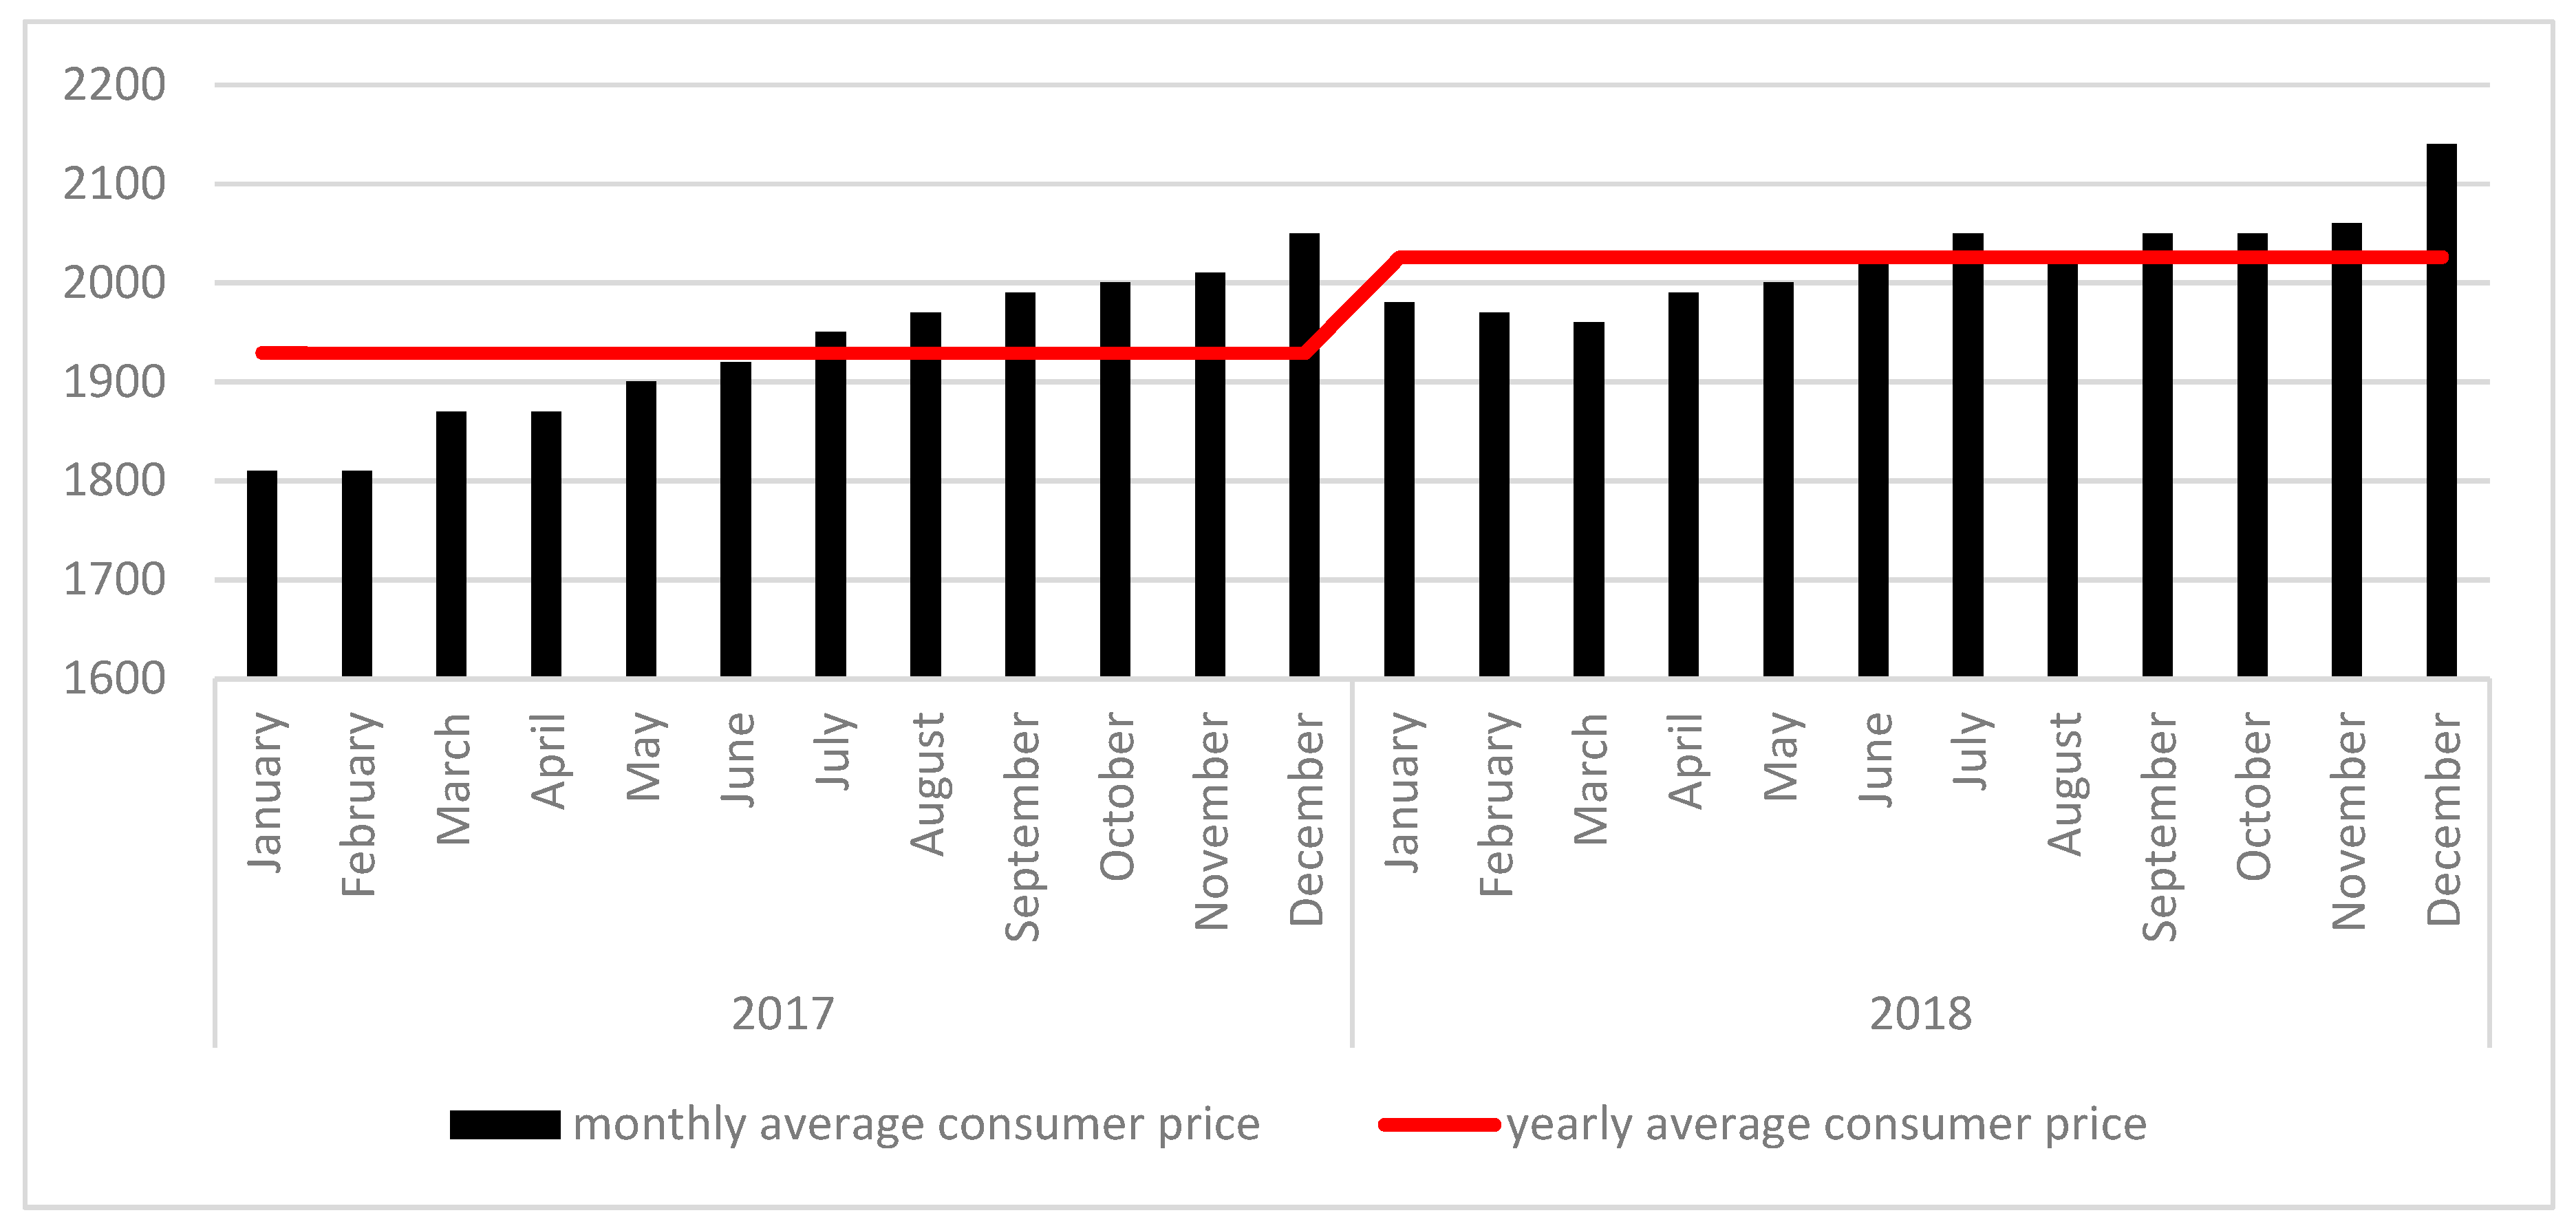
- HCSO. Egyes Termékek és Szolgáltatások Havi, Országos Fogyasztói Átlagára (Average Countrywide Monthly Prices of Products and Services). Hungarian Central Statistical Office 2017–2018. Available online: https://www.ksh.hu/docs/hun/xstadat/xstadat_evkozi/e_qsf005e.html (accessed on 18 April 2020).
- Birch, D.; Lawley, M. Buying seafood: Understanding barriers to purchase across consumption segments. Food Qual. Prefer. 2012, 26, 12–21. [Google Scholar] [CrossRef]
- Snoj, B.; Korda, A.P.; Mumel, D. The relationships among perceived quality, perceived risk and perceived product value. J. Prod. Brand Manag. 2004, 13, 156–167. [Google Scholar] [CrossRef]
- Helland, S.H.; Bere, E.; Bjørnarå, H.B.; Øverby, N.C. Food neophobia and its association with intake of fish and other selected foods in a Norwegian sample of toddlers: A cross-sectional study. Appetite 2017, 114, 110–117. [Google Scholar] [CrossRef] [PubMed]
- Laureati, M.; Cattaneo, C.; Bergamaschi, V.; Proserpio, C.; Pagliarini, E. School children preferences for fish formulations: The impact of child and parental food neophobia. J. Sens. Stud. 2016, 31, 408–415. [Google Scholar] [CrossRef]
- Smith, S.; Varble, S.; Secchi, S. Fish consumers: Environmental attitudes and purchasing behavior. J. Food Prod. Mark. 2017, 23, 267–282. [Google Scholar] [CrossRef]
- Siegrist, M.; Hartmann, C.; Keller, C. Antecedents of food neophobia and its association with eating behavior and food choices. Food Qual. Prefer. 2013, 30, 293–298. [Google Scholar] [CrossRef]
- Varble, S.; Secchi, S. Human consumption as an invasive species management strategy. A preliminary assessment of the marketing potential of invasive Asian carp in the US. Appetite 2013, 65, 58–67. [Google Scholar] [CrossRef]
- Jaeger, S.R.; Rasmussen, M.A.; Prescott, J. Relationships between food neophobia and food intake and preferences: Findings from a sample of New Zealand adults. Appetite 2017, 116, 410–422. [Google Scholar] [CrossRef]
- Ajzen, I. The theory of planned behavior. Organ. Behav. Hum. Decis. Process. 1991, 50, 179–211. [Google Scholar] [CrossRef]
- Fiandari, Y.R.; Surachman, S.; Rohman, F.; Hussein, A.S. Perceived value dimension in repetitive fish consumption in Indonesia by using an extended theory of planned behavior. Br. Food J. 2019, 121, 1220–1235. [Google Scholar] [CrossRef]
- Tomić, M.; Matulić, D.; Jelić, M. What determines fresh fish consumption in Croatia? Appetite 2016, 106, 13–22. [Google Scholar] [CrossRef] [Green Version]
- Siddique, M.A.M. Explaining the role of perceived risk, knowledge, price, and cost in dry fish consumption within the theory of planned behavior. J. Glob. Mark. 2012, 25, 181–201. [Google Scholar] [CrossRef]
- Thong, N.T.; Olsen, S.O. Attitude toward and consumption of fish in Vietnam. J. Food Prod. Mark. 2102, 18, 79–95. [Google Scholar] [CrossRef]
- Tuu, H.H.; Olsen, S.O.; Thao, D.T.; Anh, N.T.K. The role of norms in explaining attitudes, intention and consumption of a common food (fish) in Vietnam. Appetite 2008, 51, 546–551. [Google Scholar] [CrossRef] [PubMed]
- Verbeke, W.; Vackier, I. Individual determinants of fish consumption: Application of the theory of planned behaviour. Appetite 2005, 44, 67–82. [Google Scholar] [CrossRef]
- Contini, C.; Boncinelli, F.; Gerini, F.; Scozzafava, G.; Casini, L. Investigating the role of personal and context-related factors in convenience foods consumption. Appetite 2018, 126, 26–35. [Google Scholar] [CrossRef] [PubMed]
- Thorsdottir, F.; Sveinsdottir, K.; Jonsson, F.H.; Einarsdottir, G.; Thorsdottir, I.; Martinsdottir, E. A model of fish consumption among young consumers. J. Consum. Mark. 2012, 29, 4–12. [Google Scholar] [CrossRef]
- Mitterer-Daltoé, M.L.; Carrillo, E.; Queiroz, M.I.; Fiszman, S.; Varela, P. Structural equation modelling and word association as tools for a better understanding of low fish consumption. Food Res. Int. 2013, 52, 56–63. [Google Scholar] [CrossRef]
- Rortveit, A.W.; Olsen, S.O. Combining the role of convenience and consideration set size in explaining fish consumption in Norway. Appetite 2009, 52, 313–317. [Google Scholar] [CrossRef]
- Olsen, S.O.; Scholderer, J.; Brunsø, K.; Verbeke, W. Exploring the relationship between convenience and fish consumption: A cross-cultural study. Appetite 2007, 49, 84–91. [Google Scholar] [CrossRef]
- Olsen, S.O. Understanding the relationship between age and seafood consumption: The mediating role of attitude, health involvement and convenience. Food Qual. Prefer. 2003, 14, 199–209. [Google Scholar] [CrossRef]
- Pieniak, Z.; Verbeke, W.; Scholderer, J.; Brunsø, K.; Olsen, S.O. Impact of consumers’ health beliefs, health involvement and risk perception on fish consumption. Br. Food J. 2008, 110, 898–915. [Google Scholar] [CrossRef]
- Schaefer, A.M.; Zoffer, M.; Yrastorza, L.; Pearlman, D.M.; Bossart, G.D.; Stoessel, R.; Reif, J.S. Mercury Exposure, Fish Consumption, and Perceived Risk among Pregnant Women in Coastal Florida. Int. J. Environ. Res. Public Health 2019, 16, 4903. [Google Scholar] [CrossRef] [PubMed] [Green Version]
- Bauer, R.A. Consumer behaviour as risk taking. In Dynamic Marketing for a Changing World, Proceedings of the 43rd Conference of the American Marketing Association, Chicago, IL, USA, June 1960; Hancock, R.S., Ed.; American Marketing Association: Chicago, IL, USA, 1960; pp. 389–398. [Google Scholar]
- Mitchell, V.W. Consumer perceived risk: Conceptualisations and models. Eur. J. Mark. 1999, 33, 163–195. [Google Scholar] [CrossRef]
- Jacoby, J.; Kaplan, L.B. The Components of Perceived Risk. In SV—Proceedings of the Third Annual Conference of the Association for Consumer Research, Chicago, IL, USA, 3–5 November 1972; Venkatesan, M., Ed.; Association for Consumer Research; pp. 382–393. Available online: https://www.acrwebsite.org/volumes/12016/volumes/sv02/SV-02 (accessed on 18 August 2020).
- Murphy, P.E.; Enis, B.M. Classifying products strategically. J. Mark. 1986, 50, 24–42. [Google Scholar] [CrossRef]
- Neale, E.P.; Nolan-Clark, D.; Probst, Y.C.; Batterham, M.J.; Tapsell, L.C. Comparing attitudes to fish consumption between clinical trial participants and non-trial individuals. Nutr. Diet. 2012, 69, 124–129. [Google Scholar] [CrossRef] [Green Version]
- Babcsányi, I.; Tamás, M.; Szatmári, J.; Hambek-Oláh, B.; Farsang, A. Assessing the impacts of the main river and anthropogenic use on the degree of metal contamination of oxbow lake sediments (Tisza River Valley, Hungary). J. Soils Sediments 2020, 20, 1662–1675. [Google Scholar] [CrossRef] [Green Version]
- Li, J.; Miao, X.; Hao, Y.; Xie, Z.; Zou, S.; Zhou, C. Health Risk Assessment of Metals (Cu, Pb, Zn, Cr, Cd, As, Hg, Se) in Angling Fish with Different Lengths Collected from Liuzhou, China. Int. J. Environ. Res. Public Health 2020, 17, 2192. [Google Scholar] [CrossRef] [Green Version]
- Hacon, S.S.; Dórea, J.G.; Fonseca, M.D.F.; Oliveira, B.A.; Mourão, D.S.; Gonçalves, R.A.; Mariani, C.F.; Bastos, W.R. The influence of changes in lifestyle and mercury exposure in riverine populations of the Madeira River (Amazon Basin) near a hydroelectric project. Int. J. Environ. Res. Public Health 2014, 11, 2437–2455. [Google Scholar] [CrossRef]
- Pico, Y.; Belenguer, V.; Corcellas, C.; Díaz-Cruz, M.S.; Eljarrat, E.; Farré, M.; Gago-Ferrero, P.; Huerta, B.; Navarro-Ortega, A.; Petrovic, M.; et al. Contaminants of emerging concern in freshwater fish from four Spanish Rivers. Sci. Total Environ. 2019, 659, 1186–1198. [Google Scholar] [CrossRef]
- Krabbenhoft, C.A.; Manente, S.; Kashian, D.R. Evaluation of an Educational Campaign to Improve the Conscious Consumption of Recreationally Caught Fish. Sustainability 2019, 11, 700. [Google Scholar] [CrossRef] [Green Version]
- Anual, Z.F.; Maher, W.; Krikowa, F.; Hakim, L.; Ahmad, N.I.; Foster, S. Mercury and risk assessment from consumption of crustaceans, cephalopods and fish from West Peninsular Malaysia. Microchem. J. 2018, 140, 214–221. [Google Scholar] [CrossRef]
- Myrland, Ø.; Trondsen, T.; Johnston, R.S.; Lund, E. Determinants of seafood consumption in Norway: Lifestyle, revealed preferences, and barriers to consumption. Food Qual. Prefer. 2000, 11, 169–188. [Google Scholar] [CrossRef]
- Olsen, S.O. Consumer involvement in seafood as family meals in Norway: An application of the expectancy-value approach. Appetite 2001, 36, 173–186. [Google Scholar] [CrossRef]
- Zhou, L.; Jin, S.; Zhang, B.; Zeng, Q.; Wang, D. Determinants of fish consumption by household type in China. Br. Food J. 2015, 117, 1273–1288. [Google Scholar] [CrossRef]
- Altintzoglou, T.; Hansen, K.B.; Valsdottir, T.; Odland, J.Ø.; Martinsdóttir, E.; Brunsø, K.; Luten, J. Translating barriers into potential improvements: The case of new healthy seafood product development. J. Consum. Mark. 2010, 27, 224–235. [Google Scholar] [CrossRef]
- Birch, D.; Lawley, M. The role of habit, childhood consumption, familiarity, and attitudes across seafood consumption segments in Australia. J. Food Prod. Mark. 2014, 20, 98–113. [Google Scholar] [CrossRef]
- Pieniak, Z.; Verbeke, W.; Scholderer, J. Health-related beliefs and consumer knowledge as determinants of fish consumption. J. Hum. Nutr. Diet. 2010, 23, 480–488. [Google Scholar] [CrossRef]
- Thong, N.T.; Solgaard, H.S. Consumer’s food motives and seafood consumption. Food Qual. Prefer. 2017, 56, 181–188. [Google Scholar] [CrossRef]
- Brunsø, K.; Verbeke, W.; Olsen, S.O.; Jeppesen, L.F. Motives, barriers and quality evaluation in fish consumption situations. Br. Food J. 2009, 111, 699–716. [Google Scholar] [CrossRef]
- Fischer, A.R.; Frewer, L.J. Consumer familiarity with foods and the perception of risks and benefits. Food Qual. Prefer. 2009, 20, 576–585. [Google Scholar] [CrossRef]
- Sveinsdóttir, K.; Martinsdóttir, E.; Green-Petersen, D.; Hyldig, G.; Schelvis, R.; Delahunty, C. Sensory characteristics of different cod products related to consumer preferences and attitudes. Food Qual. Prefer. 2009, 20, 120–132. [Google Scholar] [CrossRef]
- HCSO. Hungarian Microcensus Data 2016. 2020. Available online: https://www.ksh.hu/mikrocenzus2016/kotet_3_demografiai_adatok (accessed on 23 April 2020).
- Ringle, C.M.; Wende, S.; Becker, J.M. SmartPLS 3. Boenningstedt: SmartPLS GmbH. Available online: http://www.smartpls.com (accessed on 18 August 2020).
- Hair, J.F.; Ringle, C.M.; Sarstedt, M. PLS-SEM: Indeed a silver bullet. J. Mark. Theory Pract. 2011, 19, 139–152. [Google Scholar] [CrossRef]
- Hair, J.F.; Risher, J.J.; Sarstedt, M.; Ringle, C.M. When to use and how to report the results of PLS-SEM. Eur. Bus. Rev. 2019, 31, 2–24. [Google Scholar] [CrossRef]
- Cortina, J.M. What is coefficient alpha? An examination of theory and applications. J. Appl. Psychol. 1993, 78, 98. [Google Scholar] [CrossRef]
- Hair, J.F., Jr.; Hult, G.T.M.; Ringle, C.; Sarstedt, M. A Primer on Partial Least Squares Structural Equation Modeling (PLS-SEM); Sage Publications: New York, NY, USA, 2016. [Google Scholar]
- Bagozzi, R.P.; Yi, Y. On the evaluation of structural equation models. J. Acad. Mark. Sci. 1988, 16, 74–94. [Google Scholar] [CrossRef]
- Hu, L.T.; Bentler, P.M. Cutoff criteria for fit indexes in covariance structure analysis: Conventional criteria versus new alternatives. Struct. Equ. Model. A Multidiscip. J. 1999, 6, 1–55. [Google Scholar] [CrossRef]
- Fornell, C.; Larcker, D.F. Evaluating structural equation models with unobservable variables and measurement error. J. Mark. Res. 1981, 18, 39–50. [Google Scholar] [CrossRef]
- Henseler, J.; Ringle, C.M.; Sarstedt, M. A new criterion for assessing discriminant validity in variance-based structural equation modeling. J. Acad. Mark. Sci. 2015, 43, 115–135. [Google Scholar] [CrossRef] [Green Version]
- Diaz-Ruiz, R.; Costa-Font, M.; Gil, J.M. Moving ahead from food-related behaviours: An alternative approach to understand household food waste generation. J. Clean. Prod. 2018, 172, 1140–1151. [Google Scholar] [CrossRef] [Green Version]
- Stone, M. Cross-validatory choice and assessment of statistical predictions. J. R. Stat. Soc. Ser. B Methodol. 1974, 36, 111–133. [Google Scholar] [CrossRef]
- Geisser, S. A predictive approach to the random effect model. Biometrika 1974, 61, 101–107. [Google Scholar] [CrossRef]

| Variables | Composition of the Sample | Composition of the Population * | |
|---|---|---|---|
| Gender | Male | 46.8% | 46.9% |
| Female | 53.0% | 53.1% | |
| Missing | 0.2% | ||
| Age group | 18–25 | 11.6% | 11.5% |
| 26–35 | 17.8% | 15.3% | |
| 36–45 | 18.1% | 19.5% | |
| 46–55 | 16.4% | 15.8% | |
| 56 or older | 35.9% | 37.9% | |
| Missing | 0.2% | ||
| Education | Elementary | 6.6% | |
| Trade/vocational | 16.3% | ||
| Secondary | 32.1% | ||
| Tertiary | 42.6% | ||
| Missing | 2.3% | ||
| Region | Northern Hungary | 6.9% | 11.6% |
| Northern Great Plains | 12.8% | 14.9% | |
| Southern Great Plains | 14.7% | 12.8% | |
| Central Hungary | 32.2% | 30.7% | |
| Central Transdanubia | 10.0% | 10.8% | |
| Western Transdanubia | 10.7% | 10.0% | |
| Southern Transdanubia | 8.5% | 9.1% | |
| Missing | 4.2% | ||
| Perceived income status | Very tight | 2.5% | |
| Tight | 11.7% | ||
| Average | 58.4% | ||
| Good | 20.6% | ||
| Very good | 4.0% | ||
| Missing | 2.7% |
| Psychological risk |
| I like the taste of fish—reverse coded |
| I came to like fish already as a child–reverse coded |
| I have had good experiences in eating sea fish in the past – reverse coded |
| I have had good experiences in eating freshwater fish in the past–reverse coded |
| Physical risk |
| I am concerned that spoiled fish will be sold to me |
| I am concerned that fish may not have been handled in a hygienic way |
| I am concerned that fish contains a lot of contaminants from sea |
| I am concerned that fish contains a lot of contaminants from freshwaters |
| Functional risk |
| The person who cooks in our household does not know how to prepare freshwater fish |
| The person who cooks in our household does not know how to prepare saltwater fish |
| It is hard for the person who cooks in our household to bring him/herself to cook from fish that (s)he does not know |
| Social risk |
| Other adults in my household do not like fish |
| One or more children in my household do not like fish |
| Resistance by other members of my household makes it hard to serve fish as often as I want |
| Consumption Frequency | n | % | |
|---|---|---|---|
| Regular | (2–3 times per week to at least once a week) | 112 | 11% |
| Light | (About once per fortnight) | 107 | 10% |
| Very light | (Once per month) | 263 | 25% |
| Extremely light | (Less than once per month but at least once a year) | 440 | 42% |
| Never | (Never) | 120 | 12% |
| Construct and Indicators | Factor Loading |
|---|---|
| Psychological risk (CR = 0.823, AVE = 0.539, CA = 0.823) | |
| I like the taste of fish—reverse coded | 0.776 |
| I came to like fish already as a child—reverse coded | 0.634 |
| I have had good experiences in eating sea fish in the past—reverse coded | 0.733 |
| I have had good experiences in eating freshwater fish in the past—reverse coded | 0.783 |
| Physical risk (CR = 0.803, AVE = 0.505, CA = 0.801) | |
| I am concerned that spoiled fish will be sold to me | 0.667 |
| I am concerned that fish may not have been handled in a hygienic way | 0.730 |
| I am concerned that fish contains a lot of contaminants from sea | 0.670 |
| I am concerned that fish contains a lot of contaminants from freshwaters | 0.772 |
| Functional risk (CR = 0.767, AVE = 0.525, CA = 0.762) | |
| The person who cooks in our household does not know how to prepare freshwater fish | 0.782 |
| The person who cooks in our household does not know how to prepare saltwater fish | 0.729 |
| It is hard for the person who cooks in our household to bring him/herself to cook from fish that (s)he does not know | 0.657 |
| Social risk (CR = 0.789, AVE = 0.565, CA = 0.787) | |
| Other adults in my household do not like fish | 0.582 |
| One or more children in my household do not like fish | 0.697 |
| Resistance by other members of my household makes it hard to serve fish as often as I want | 0.933 |
| Functional Risk | Psychological Risk | Consumption Frequency | Physical Risk | Social Risk | |
|---|---|---|---|---|---|
| Functional risk | 0.724 | ||||
| Psychological risk | 0.327 | 0.734 | |||
| Consumption frequency | −0.179 | −0.353 | 1.000 | ||
| Physical risk | 0.284 | 0.127 | −0.005 | 0.711 | |
| Social risk | 0.389 | 0.349 | −0.157 | 0.214 | 0.751 |
| Functional Risk | Psychological Risk | Consumption Frequency | Physical Risk | Social Risk | |
|---|---|---|---|---|---|
| Functional risk | |||||
| Psychological risk | 0.330 | ||||
| Consumption frequency | 0.179 | 0.352 | |||
| Physical risk | 0.287 | 0.128 | 0.026 | ||
| Social risk | 0.390 | 0.345 | 0.152 | 0.215 |
| Direct Effect | Indirect Effect | Total Effect | Cohen’s f2 | T Statistics | p Values | Supported? | |
|---|---|---|---|---|---|---|---|
| Physical risk → Consumption frequency | β = 0.064 | 0.064 | 0.004 | 1.813 | p = 0.070 | no | |
| Social risk → Consumption frequency | β = −0.026 | −0.026 | 0.001 | 0.732 | p = 0.465 | no | |
| Psychological risk → Consumption frequency | β = −0.326 | −0.326 | 0.102 | 9.868 | p < 0.001 | yes | |
| Functional risk → Consumption frequency | β = −0.081 | β = −0.117 | −0.197 | 0.006 | 2.026 | p = 0.043 | yes |
| Functional risk → Psychological risk | β = 0.327 | 0.327 | 0.120 | 8.129 | p < 0.001 | yes | |
| Functional risk → Social risk | β = 0.389 | 0.389 | 0.179 | 10,014 | p < 0.001 | yes |
| Construct | R2 | Adjusted R2 | Q2 |
|---|---|---|---|
| Physical risk | |||
| Social risk | 0.152 | 0.151 | 0.064 |
| Psychological risk | 0.107 | 0.106 | 0.043 |
| Functional risk | |||
| Consumption frequency | 0.133 | 0.130 | 0.102 |
© 2020 by the authors. Licensee MDPI, Basel, Switzerland. This article is an open access article distributed under the terms and conditions of the Creative Commons Attribution (CC BY) license (http://creativecommons.org/licenses/by/4.0/).
Share and Cite
Temesi, Á.; Birch, D.; Plasek, B.; Eren, B.A.; Lakner, Z. Perceived Risk of Fish Consumption in a Low Fish Consumption Country. Foods 2020, 9, 1284. https://doi.org/10.3390/foods9091284
Temesi Á, Birch D, Plasek B, Eren BA, Lakner Z. Perceived Risk of Fish Consumption in a Low Fish Consumption Country. Foods. 2020; 9(9):1284. https://doi.org/10.3390/foods9091284
Chicago/Turabian StyleTemesi, Ágoston, Dawn Birch, Brigitta Plasek, Burak Atilla Eren, and Zoltán Lakner. 2020. "Perceived Risk of Fish Consumption in a Low Fish Consumption Country" Foods 9, no. 9: 1284. https://doi.org/10.3390/foods9091284
APA StyleTemesi, Á., Birch, D., Plasek, B., Eren, B. A., & Lakner, Z. (2020). Perceived Risk of Fish Consumption in a Low Fish Consumption Country. Foods, 9(9), 1284. https://doi.org/10.3390/foods9091284