The Effect of Algae or Insect Supplementation as Alternative Protein Sources on the Volatile Profile of Chicken Meat

 , , , and
Abstract
:1. Introduction
2. Materials and Methods
2.1. Birds and Diet
2.2. Trial 1 (75% to 50% Replacement)
2.3. Trial 2 (100% Replacement)
2.4. Sample Preparation and Volatile Compound Analysis
2.5. Gas Chromatography-Mass Spectrometry (GC-MS) Analyses
2.6. Data Analysis
3. Results
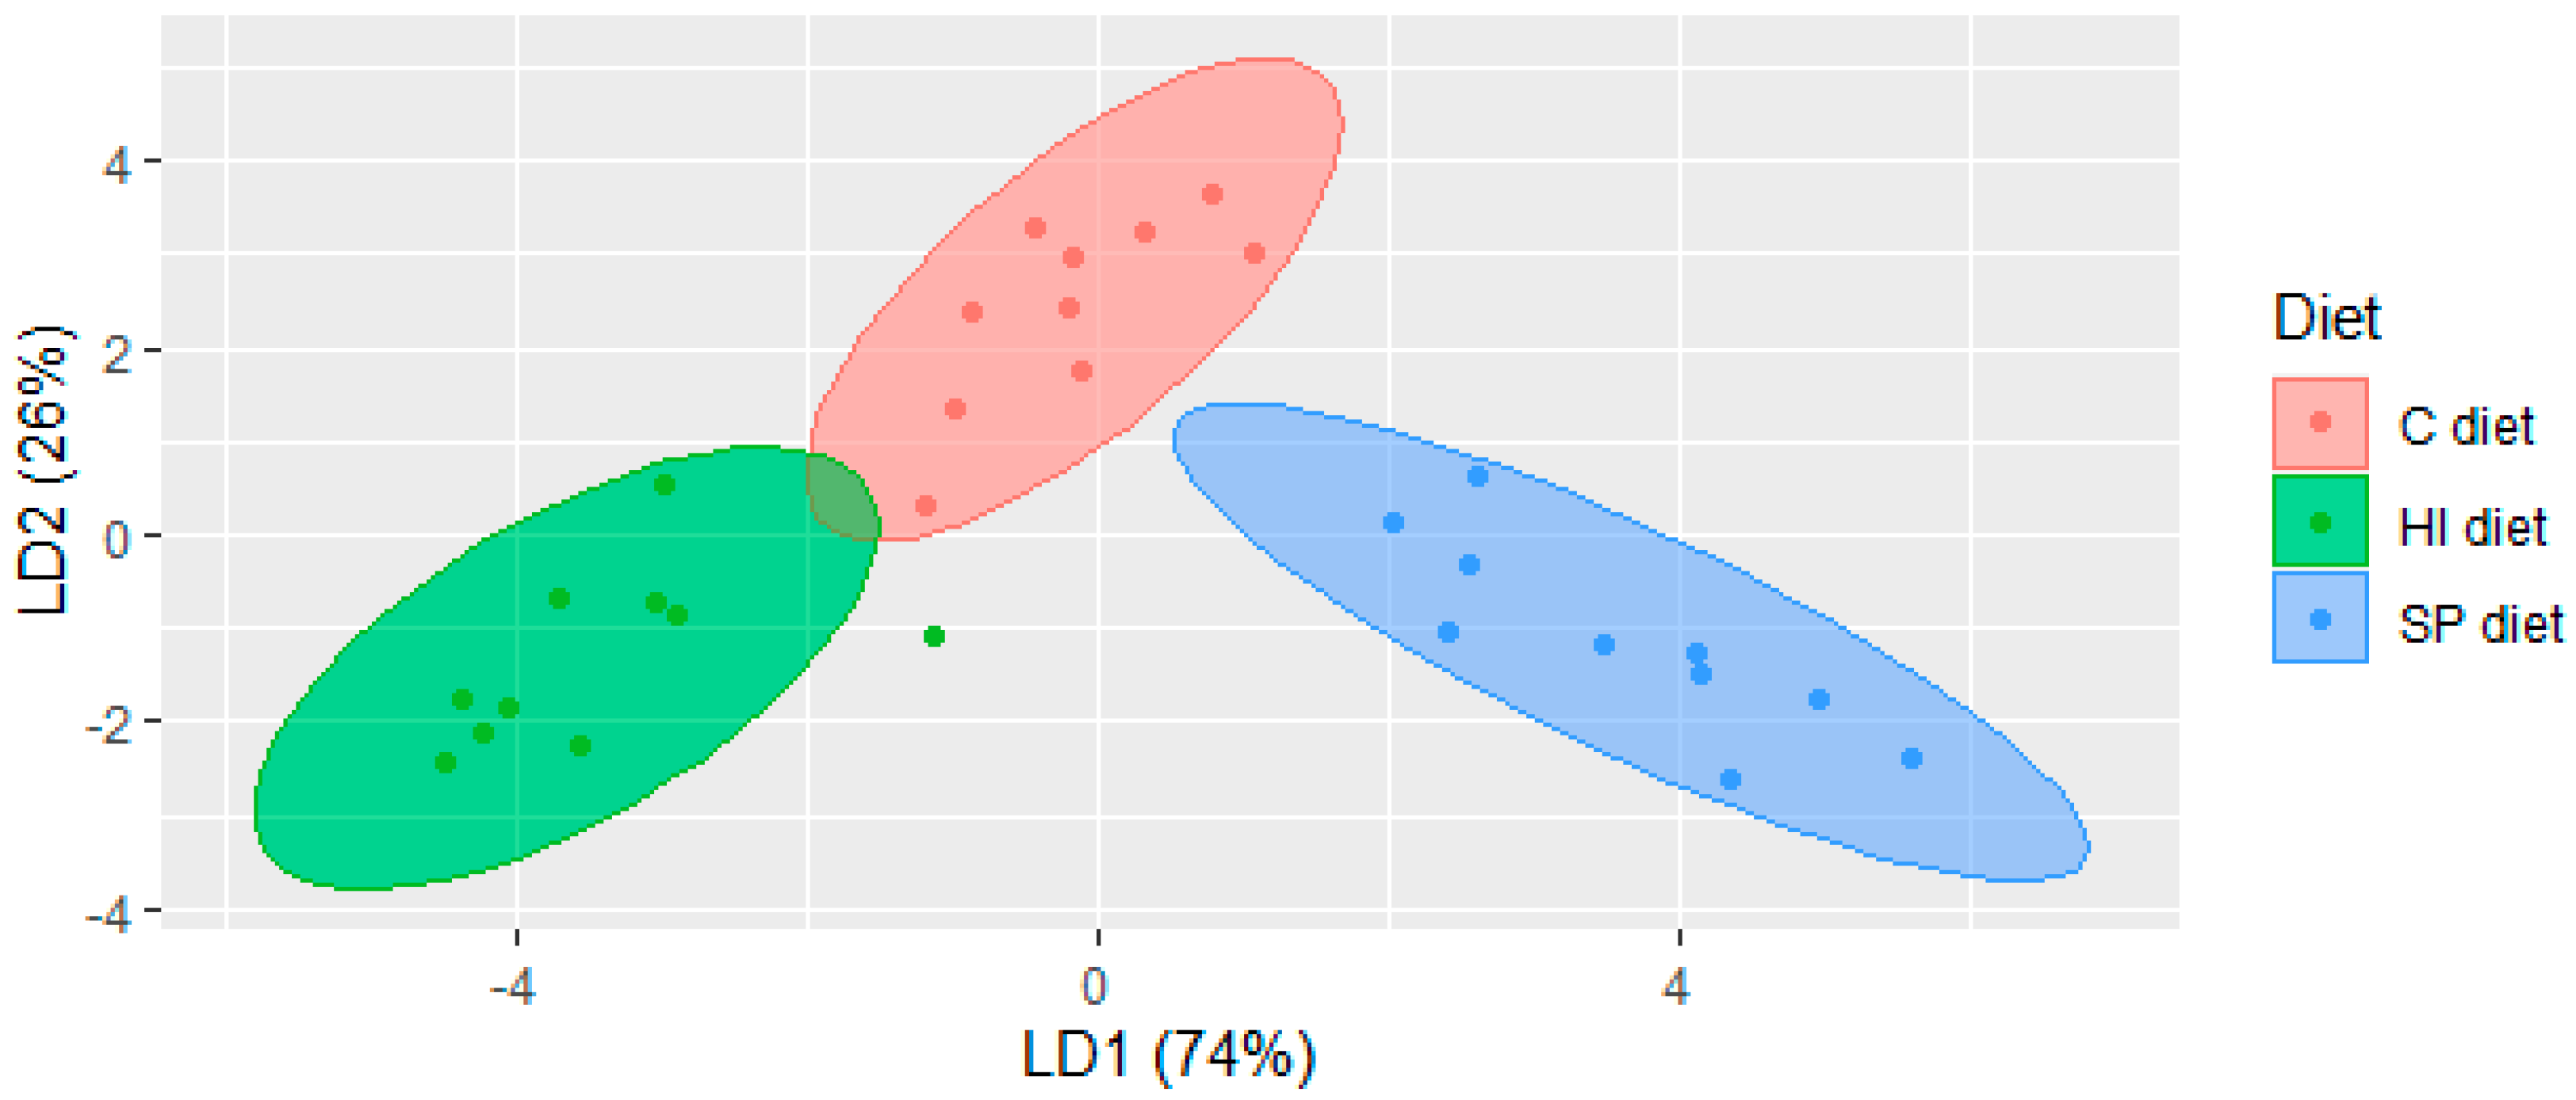
3.1. Volatile Compounds in Chicken Meat of Trial 1
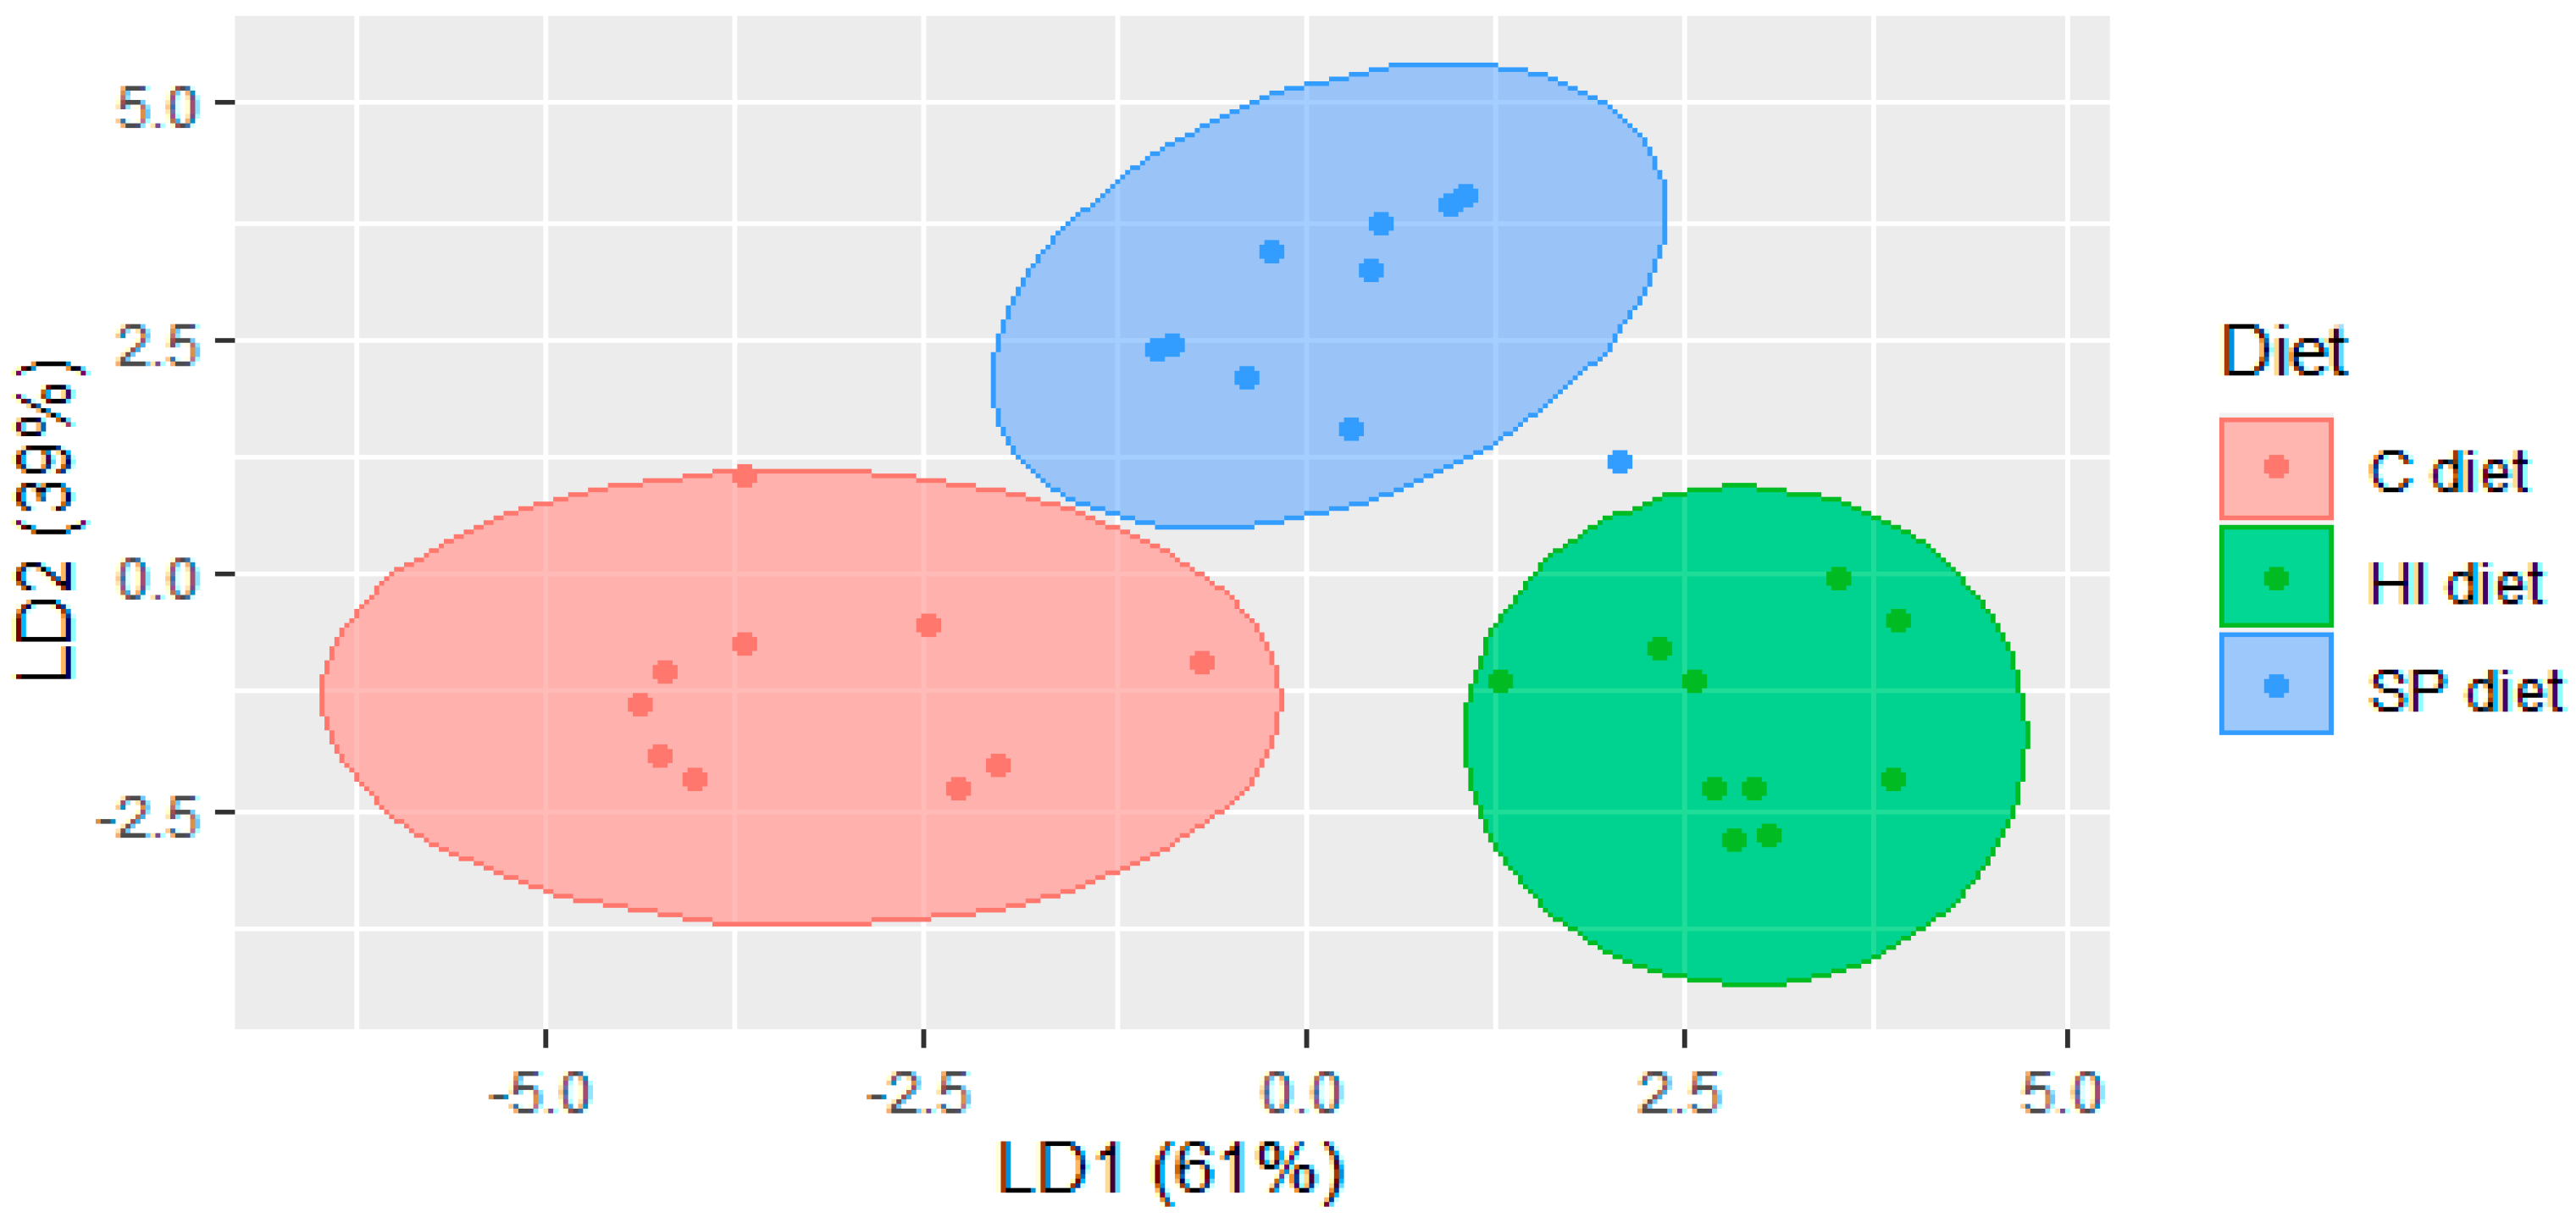
3.2. Volatile Compounds in Chicken Meat of Trial 2
4. Discussion
5. Conclusions
Supplementary Materials
Author Contributions
Funding
Acknowledgments
Conflicts of Interest
References
- Phillips, S.M.; Chevalier, S.; Leidy, H.J. Protein “requirements” beyond the RDA: Implications for optimizing health. Appl. Physiol. Nutr. Metab. 2016, 41, 565–572. [Google Scholar] [CrossRef] [PubMed] [Green Version]
- Kralik, G.; Kralik, Z.; Grčević, M.; Hanžek, D. Quality of Chicken Meat. Anim. Husb. Nutr. 2018, 63. [Google Scholar] [CrossRef] [Green Version]
- Mir, N.A.; Rafiq, A.; Kumar, F.; Singh, V.; Shukla, V. Determinants of broiler chicken meat quality and factors affecting them: A review. J. Food Sci. Technol. 2017, 54, 2997–3009. [Google Scholar] [CrossRef]
- Bou, R.; Guardiola, F.; Barroeta, A.; Codony, R. Effect of dietary fat sources and zinc and selenium supplements on the composition and consumer acceptability of chicken meat. Poult. Sci. 2005, 84, 1129–1140. [Google Scholar] [CrossRef] [PubMed]
- Kareem, K.Y.; Abdulla, N.R.; Foo, H.L.; Zamri, A.N.M.; Shazali, N.; Loh, T.C.; Alshelmani, M.I. Effect of feeding larvae meal in the diets on growth performance, nutrient digestibility and meat quality in broiler chicken. Indian J. Anim. Res. 2018, 88, 1180–1185. [Google Scholar]
- Gaylord, T.; Barrows, F.; Rawles, S. Apparent amino acid availability from feedstuffs in extruded diets for rainbow trout Oncorhynchus mykiss. Aquac. Nutr. 2010, 16, 400–406. [Google Scholar] [CrossRef]
- Hanson, M.N.; Persia, M.E. Effects of Dietary Soy Inclusion on Broiler Chick Performance and Metabolizable Energy. Iowa State Univ. Anim. Ind. Rep. 2014. [Google Scholar] [CrossRef]
- Veldkamp, T.; van Duinkerken, G.; van Huis, A.; Lakemond, C.M.M.; Bosch, G.; van Boekel, M.A.J.S. Insects as a Sustainable Feed Ingredient in Pig and Poultry Diets—A Feasibility Study; Wageningen UR Livestock Research: Lelystad, The Netherlands, 2012. [Google Scholar]
- OECD/FAO. OECD-FAO Agricultural Outlook 2020–2029; OECD: Paris, France, 2020. [Google Scholar] [CrossRef]
- Kristensen, L.; Støier, S.; Würtz, J.; Hinrichsen, L. Trends in meat science and technology: The future looks bright, but the journey will be long. Meat Sci. 2014, 98, 322–329. [Google Scholar] [CrossRef]
- Finley, J.W. Evolution and future needs of food chemistry in a changing world. J. Agric. Food Chem. 2020, in press. [Google Scholar] [CrossRef]
- Akhtar, Y.; Isman, M.B. Insects as an Alternative Protein Source. In Proteins in Food Processing, 2nd ed.; Yada, Y.R., Ed.; Woodhead Publishing: Cambridge, UK, 2017; pp. 263–288. [Google Scholar]
- Madeira, M.S.; Cardoso, C.; Lopes, P.A.; Coelho, D.; Afonso, C.; Bandarra, N.M.; Prates, J.A.M. Microalgae as feed ingredients for livestock production and meat quality: A review. Livest. Sci. 2017, 205, 111–121. [Google Scholar] [CrossRef]
- Barragan-Fonseca, K.B.; Dicke, M.; van Loon, J.J. Nutritional value of the black soldier fly (Hermetia illucens L.) and its suitability as animal feed—A review. J. Insects Food Feed. 2017, 3, 105–120. [Google Scholar] [CrossRef]
- Józefiak, D.; Józefiak, A.; Kierończyk, B.; Rawski, M.; Świątkiewicz, S.; Długosz, J.; Engberg, R.M. Insects—A Natural Nutrient Source for Poultry—A Review. Ann. Anim. Sci. 2016, 16, 297–313. [Google Scholar] [CrossRef] [Green Version]
- Müller, A.; Wolf, D.; Gutzeit, H.O. The black soldier fly, Hermetia illucens—A promising source for sustainable production of proteins, lipids and bioactive substances. Z. Naturforsch. C Biosci. 2017, 72, 351–363. [Google Scholar] [CrossRef] [PubMed]
- Gasco, L.; Biasato, I.; Dabbou, S.; Schiavone, A.; Gai, F. Animals fed insect-based diets: State-of-the-art on digestibility, performance and product quality. Animals 2019, 9, 170. [Google Scholar] [CrossRef] [Green Version]
- Schiavone, A.; Cullere, M.; De Marco, M.; Meneguz, M.; Biasato, I.; Bergagna, S.; Dezzutto, D.; Gai, F.; Dabbou, S.; Gasco, L. Partial or total replacement of soybean oil by black soldier fly larvae (Hermetia illucens L.) fat in broiler diets: Effect on growth performances, feed-choice, blood traits, carcass characteristics and meat quality. Ital. J. Anim. Sci. 2017, 16, 93–100. [Google Scholar] [CrossRef] [Green Version]
- Cullere, M.; Tasoniero, G.; Giaccone, V.; Acuti, G.; Marangon, A.; Dalle Zotte, A. Black soldier fly as dietary protein source for broiler quails: Meat proximate composition, fatty acid and amino acid profile, oxidative status and sensory traits. Animals 2018, 12, 640–647. [Google Scholar] [CrossRef]
- Altmann, B.; Wigger, R.; Ciulu, M.; Mörlein, D. The effect of insect or microalga alternative protein feeds on broiler meat quality. J. Sci. Food Agric. 2020. [Google Scholar] [CrossRef]
- Falquet, J.; Hurni, J.P. The Nutritional Aspects of Spirulina; Antenna Foundation: Geneva, Switzerland, 2017. [Google Scholar]
- Jung, F.; Krüger-Genge, A.; Waldeck, P.; Küpper, J.-H. Spirulina platensis, a super food? J. Cell. Biotechnol. 2019, 5, 43–54. [Google Scholar] [CrossRef]
- Khan, Z.; Bhadouria, P.; Bisen, P. Nutritional and therapeutic potential of Spirulina. Curr. Pharm. Biotechnol. 2005, 6, 373–379. [Google Scholar] [CrossRef] [Green Version]
- El-Bahr, S.; Shousha, S.; Shehab, A.; Khattab, W.; Ahmed-Farid, O.; Sabike, I.; El-Garhy, O.; Albokhadaim, I.; Albosadah, K. Effect of Dietary Microalgae on Growth Performance, Profiles of Amino and Fatty Acids, Antioxidant Status, and Meat Quality of Broiler Chickens. Animals 2020, 10, 761. [Google Scholar] [CrossRef]
- El-Hady, A.A.; El-Ghalid, O. Spirulina platensis Algae (SPA): A novel poultry feed additive Effect of SPA supplementation in broiler chicken diets on productive performance, lipid profile and calcium-phosphorus metabolism. In Proceedings of the VI Mediterranean Poultry Summit, Torino, Italy, 18–20 June 2018. [Google Scholar]
- Venkataraman, L.V.; Somasekaran, T.; Becker, E.W. Replacement Value of blue-green alga (spirulina platensis) for fishmeal and a vitamin-mineral premix for broiler chicks. Br. Poult. Sci. 1994, 35, 373–381. [Google Scholar] [CrossRef] [PubMed]
- Vasta, V.; Priolo, A. Ruminant fat volatiles as affected by diet. A review. Meat Sci. 2006, 73, 218–228. [Google Scholar] [CrossRef]
- Calkins, C.R.; Hodgen, J.M. A fresh look at meat flavor. Meat Sci. 2007, 77, 63–80. [Google Scholar] [CrossRef] [PubMed]
- Flores, M. The Eating Quality of Meat: III—Flavor. In Lawrie’s Meat Science, 8th ed.; Toldrá, F., Ed.; Woodhead Publishing Series in Food Science; Technology and Nutrition: Cambridge, UK, 2017; pp. 383–417. [Google Scholar] [CrossRef]
- Monahan, F.J.; Schmidt, O.; Moloney, A.P. Meat provenance: Authentication of geographical origin and dietary background of meat. Meat Sci. 2018, 144, 2–14. [Google Scholar] [CrossRef] [PubMed]
- Neumann, C.; Velten, S.; Liebert, F. The Graded Inclusion of Algae (Spirulina platensis) or Insect (Hermetia illucens) Meal as a Soybean Meal Substitute in Meat Type Chicken Diets Impacts on Growth, Nutrient Deposition and Dietary Protein Quality Depending on the Extent of Amino Acid Supplementation. Open J. Anim. Sci. 2018, 8, 163–183. [Google Scholar] [CrossRef] [Green Version]
- Wang, C.; Zhang, W.; Li, H.; Mao, J.; Guo, C.; Ding, R.; Wang, Y.; Fang, L.; Chen, Z.; Yang, G. Analysis of volatile compounds in pears by HS-SPME-GC×GC-TOFMS. Molecules 2019, 24, 1795. [Google Scholar] [CrossRef] [Green Version]
- R Core Team. R A Language and Environment for Statistical Computing; R Foundation for Statistical Computing: Vienna, Austria, 2019. [Google Scholar]
- Ottensmann, M.; Stoffel, M.A.; Nichols, H.J.; Hoffman, J.I. GCalignR: An R package for aligning gas-chromatography data for ecological and evolutionary studies. PLoS ONE 2018, 13. [Google Scholar] [CrossRef] [Green Version]
- Robinson, D. Fuzzyjoin: Join Tables Together on Inexact Matching. R Package Version 0.1.6. 2020. Available online: https://cran.r-project.org/web/packages/fuzzyjoin/index.html (accessed on 4 September 2020).
- Venables, W.N.; Ripley, B.D. Modern Applied Statistics with S, 4th ed.; Springer: New York, NY, USA, 2002. [Google Scholar]
- Revelle, W. Procedures for Psychological, Psychometric, and Personality Research; American Chemical Society: Washington, DC, USA, 2019. [Google Scholar]
- Cortinas Hernández, L.; Barroeta, A.C.; Villaverde Haro, C.; Galobarti Cots, J.; Guardiola Ibarz, F.; Baucells Sánchez, M.D. Influence of the Dietary Polyunsaturation Level on Chicken Meat Quality: Lipid Oxidation. Poult. Sci. 2005, 84, 48–55. [Google Scholar] [CrossRef]
- Cullere, M.; Woods, M.J.; van Emmenes, L.; Pieterse, E.; Hoffman, L.C.; Dalle Zotte, A. Hermetia illucens Larvae Reared on Different Substrates in Broiler Quail Diets: Effect on Physicochemical and Sensory Quality of the Quail Meat. Animals 2019, 9, 525. [Google Scholar] [CrossRef] [Green Version]
- Lopez-Ferrer, S.; Baucells, M.D.; Barroeta, A.; Grashorn, M. n-3 enrichment of chicken meat. 1. Use of very long-chain fatty acids in chicken diets and their influence on meat quality: Fish oil. Poult. Sci. 2001, 80, 741–752. [Google Scholar] [CrossRef]
- Jayasena, D.D.; Ahn, D.U.; Nam, K.C.; Jo, C. Flavour Chemistry of Chicken Meat: A Review. Asian-Australas J. Anim. Sci. 2013, 26, 732–742. [Google Scholar] [CrossRef] [PubMed]
- Elmore, J.S.; Cooper, S.L.; Enser, M.; Mottram, D.S.; Sinclair, L.A.; Wilkinson, R.G.; Wood, J.D. Dietary manipulation of fatty acid composition in lamb meat and its effect on the volatile aroma compounds of grilled lamb. Meat Sci. 2005, 69, 233–242. [Google Scholar] [CrossRef]
- Vandamme, J.; Nikiforov, A.; De Roose, M.; Leys, C.; De Cooman, L.; Van Durme, J. Controlled accelerated oxidation of oleic acid using a DBD plasma: Determination of volatile oxidation compounds. Food Res. Int. 2016, 79, 54–63. [Google Scholar] [CrossRef]
- Raes, K.; De Smet, S.; Demeyer, D. Effect of dietary fatty acids on incorporation of long chain polyunsaturated fatty acids and conjugated linoleic acid in lamb, beef and pork meat: A review. Anim. Feed. Sci. Technol. 2004, 113, 199–221. [Google Scholar] [CrossRef] [Green Version]
- Diraman, H.; Koru, E.; Dibeklioglu, H. Fatty acid profile of Spirulina platensis used as a food supplement. Isr. J. Aquacult. Bamidgeh 2009, 91, 134–142. [Google Scholar]
- Hudson, B.J.; Karis, I.G. The lipids of the alga Spirulina. J. Sci. Food Agric. 1974, 25, 759–763. [Google Scholar] [CrossRef] [PubMed]
- Azman, M.; Konar, V.; Seven, P. Effects of different dietary fat sources on growth performances and carcass fatty acid composition of broiler chickens. Rev. Med. Vet. 2004, 155, 278–286. [Google Scholar]
- Waldroup, P.; Waldroup, A. Fatty acid effect on carcass: The influence of various blends of dietary fats added to corn-soybean meal based diets on the fatty acid composition of broilers. Int. J. Poult. Sci. 2005, 4, 123–132. [Google Scholar] [CrossRef] [Green Version]
- Bonos, E.; Kasapidou, E.; Kargopoulos, A.; Karampampas, A.; Christaki, E.; Florou-Paneri, P.; Nikolakakis, I. Spirulina as a functional ingredient in broiler chicken diets. S. Afr. J. Anim. Sci. 2016, 46, 94. [Google Scholar] [CrossRef] [Green Version]
- Hadžić, D. Using of Black Soldier Fly (Hermetia Illucens) Larvae Meal in Fish Nutrition. In Answers for Forthcoming Challenges in Modern Agriculture; Brka, M.O.-M.E., Karić, L., Falan, V., Toroman, A., Eds.; Springer: Cham, Switzerland, 2020; pp. 132–140. [Google Scholar]
- Ewald, N. Fatty Acid Composition of Black Soldier Fly Larvae. Master’s Thesis, Swedish University of Agricultural Sciences, Uppsala, Sweden, 2019. [Google Scholar]
- Ushakova, N.; Brodskii, E.; Kovalenko, A.; Bastrakov, A.; Kozlova, A.; Pavlov, D. Characteristics of lipid fractions of larvae of the black soldier fly Hermetia illucens. Dokl. Biochem. Biophys. 2016, 468, 209–212. [Google Scholar] [CrossRef]
- Schiavone, A.; Dabbou, S.; Petracci, M.; Zampiga, M.; Sirri, F.; Biasato, I.; Gai, F.; Gasco, L. Black soldier fly defatted meal as a dietary protein source for broiler chickens: Effects on carcass traits, breast meat quality and safety. Animal 2019, 13, 2397–2405. [Google Scholar] [CrossRef] [PubMed]
- Cullere, M.; Schiavone, A.; Dabbou, S.; Gasco, L.; Dalle Zotte, A. Meat quality and sensory traits of finisher broiler chickens fed with black soldier fly (Hermetia Illucens L.) larvae fat as alternative fat source. Animals 2019, 9, 140. [Google Scholar] [CrossRef] [PubMed] [Green Version]
- Shahidi, F.; Pegg, R.B. Hexanal as an indicator of the flavor deterioration of meat and meat products. In Lipids in Food Flavours; Ho, C.T., Hartman, T.G., Eds.; ACS Publications: Denver, CO, USA, 1994; pp. 256–279. [Google Scholar]
- Barroeta, A. Nutritive value of poultry meat: Relationship between vitamin E and PUFA. World Poult. Sci. J. 2007, 63, 277–284. [Google Scholar] [CrossRef]
- Schneiderová, D.; Zelenka, J.; Mrkvicová, E. Poultry meat production as a functional food with a voluntary n-6 and n-3 polyunsaturated fatty acids ratio. Czech. J. Anim. Sci. 2007, 52, 203–213. [Google Scholar] [CrossRef] [Green Version]
- Whitfield, F.B.; Mottram, D.S. Volatiles from interactions of Maillard reactions and lipids. Crit. Rev. Food Sci. Nutr. 1992, 31, 1–58. [Google Scholar] [CrossRef]
- Belitz, H.D.; Grosch, W.; Schieberle, P. 5. Aroma Substances. In Food Chemistry; Springer: Berlin/Heidelberg, Germany, 2004; pp. 319–376. [Google Scholar]
- Vrabec, V.; Kulma, M.; Cocan, D. Insects as an Alternative Protein Source for Animal Feeding: A Short Review about Chemical Composition. Bul. Univ. Agric. Sci. Vet. Med. Cluj-Napoca Anim. Sci. Biotechnol. 2014, 72, 116–126. [Google Scholar] [CrossRef] [Green Version]
- Pestana, J.; Puerta, B.; Santos, H.; Madeira, M.; Alfaia, C.; Lopes, P.; Pinto, R.; Lemos, J.; Fontes, C.; Lordelo, M. Impact of dietary incorporation of Spirulina (Arthrospira platensis) and exogenous enzymes on broiler performance, carcass traits, and meat quality. Poult. Sci. 2020, 99, 2519–2532. [Google Scholar] [CrossRef]
- Schiavone, A.; De Marco, M.; Martínez, S.; Dabbou, S.; Renna, M.; Madrid, J.; Hernandez, F.; Rotolo, L.; Costa, P.; Gai, F. Nutritional value of a partially defatted and a highly defatted black soldier fly larvae (Hermetia illucens L.) meal for broiler chickens: Apparent nutrient digestibility, apparent metabolizable energy and apparent ileal amino acid digestibility. J. Anim. Sci. Biotech. 2017, 8, 51. [Google Scholar] [CrossRef]
- Gatrell, S.K.; Kim, J.; Derksen, T.J.; O’Neil, E.V.; Lei, X.G. Creating ω-3 fatty-acid-enriched chicken using defatted green microalgal biomass. J. Agric. Food Chem. 2015, 63, 9315–9322. [Google Scholar] [CrossRef]
- Laroche, M.; Perreault, V.; Marciniak, A.; Gravel, A.; Chamberland, J.; Doyen, A. Comparison of Conventional and Sustainable Lipid Extraction Methods for the Production of Oil and Protein Isolate from Edible Insect Meal. Foods 2019, 8, 572. [Google Scholar] [CrossRef] [Green Version]
- Moghadam, M.B.; Shehab, A.; Cherian, G. Methionine supplementation augments tissue n-3 fatty acid and tocopherol content in broiler birds fed flaxseed. Anim. Feed. Sci. Technol. 2017, 228, 149–158. [Google Scholar] [CrossRef]
- Zhang, M.; Chen, X.; Hayat, K.; Duhoranimana, E.; Zhang, X.; Xia, S.; Yu, J.; Xing, F. Characterization of odor-active compounds of chicken broth and improved flavor by thermal modulation in electrical stewpots. Food Res. Int. 2018, 109, 72–81. [Google Scholar] [CrossRef] [PubMed]
- Ayseli, M.T.; Filik, G.; Selli, S. Evaluation of volatile compounds in chicken breast meat using simultaneous distillation and extraction with odour activity value. J. Food Nutr. Res. 2014, 53, 137–142. [Google Scholar]
- Ba, H.V.; Hwang, I.; Jeong, D.; Touseef, A. Principle of Meat Aroma Flavors and Future Prospect. In Latest Research into Quality Control; Akyar, I., Ed.; InTech: Rijeka, Croatia, 2012; pp. 146–176. [Google Scholar]
- Qi, J.; Wang, H.; Zhou, G.; Xu, X.; Li, X.; Bai, Y.; Yu, X. Evaluation of the taste-active and volatile compounds in stewed meat from the Chinese yellow-feather chicken breed. Int. J. Food Prop. 2018, 20, S2579–S2595. [Google Scholar] [CrossRef]
- Gkarane, V.; Brunton, N.P.; Harrison, S.M.; Gravador, R.S.; Allen, P.; Claffey, N.A.; Diskin, M.G.; Fahey, A.G.; Farmer, L.J.; Moloney, A.P. Volatile Profile of Grilled Lamb as Affected by Castration and Age at Slaughter in Two Breeds. J. Food Sci. 2018, 83, 2466–2477. [Google Scholar] [CrossRef] [PubMed]
- Ho, C.-T.; Chen, Q. Lipids in food flavors. An overview. In Lipids in Food Flavors; Ho, C.-T., Hartman, T.G., Eds.; American Chemical Society: Washington, DC, USA, 1994; pp. 1–14. [Google Scholar]
- Mottram, D.S. Flavour formation in meat and meat products: A review. Food Chem. 1998, 62, 415–424. [Google Scholar] [CrossRef]

| C 1 | SP 1 | HI 1 | Statistical Analysis | p-Level | |
|---|---|---|---|---|---|
| Alcohols | |||||
| 2-methoxy-ethanol | 9.36 (13.17) | 9.50 (5.57) | 8.45 (3.60) | ||
| 1-Penten-3-ol | 4.48 (9.87) | 6.15 (5.33) | 7.86 (4.12) | ||
| 1-Pentanol | 2.13 a (3.17) | 2.54 a (1.95) | 0. 11 b (0.11) | KW; LDA | 0.026 |
| 1-Hexanol | 1.26 ab (1.57) | 1.40 a (0.59) | 0.71 b (0.23) | KW; LDA | 0.030 |
| 1-Heptanol | 0.87 a (0.92) | 0.73 a (0.31) | 0.32 b (0.08) | KW; LDA | 0.027 |
| 1-Octen-3-ol | 21.3 ab (21.6) | 31.4 a (10.1) | 13.2 b (1.77) | KW; LDA | 0.034 |
| 2-Ethyl-2-hexenol | 4.02 (4.13) | 2.17 (0.86) | 1.57 (0.85) | ||
| 4-Ethyl-cyclohexanol | 0.00 (0.53) | 0.00 (0.00) | 0.00 (0.00) | ||
| 2-Ethyl-1-hexanol | 4.70 (6.76) | 5.26 (3.16) | 4.41 (3.15) | ||
| 2-Ethyl-1-decanol | 1.11 (1.11) | 0.77 (0.40) | 0.51 (0.21) | ||
| 2-Octen-1-ol | 0.75 (0.77) | 0.88 (0.47) | 0.34 (0.24) | ||
| 1-Octanol | 4.02 (4.25) | 3.19 (0.88) | 2.91 (0.77) | ||
| Benzenemethanol, α, α-dimethyl | 0.61 (0.78) | 0.46 (0.34) | 0.56 (0.51) | ||
| (Z)-2-Nonen-1-ol | 1.14 (1.01) | 0.79 (0.38) | 0.54 (0.20) | ||
| 1-Nonanol | 0.21 (0.25) | 0.25 (0.07) | 0.26 (0.16) | ||
| Aldehydes | |||||
| Pentanal | 4.16 (7.53) | 7.08 (4.95) | 3.52 (3.52) | ||
| Hexanal | 148.1 ab (143.4) | 164.3 a (42.8) | 78.62 b (41.7) | KW; LDA | 0.043 |
| Heptanal | 3.48 (4.33) | 4.89 (1.46) | 2.94 (1.13) | ||
| Methional | nd | nd | nd | ||
| 2-Heptenal | 0.52 ab (1.12) | 0.75 a (0.45) | 0.13 b (0.13) | KW; LDA | 0.022 |
| Benzaldehyde | 0.49 (0.66) | 0.00 (0.00) | 1.0 (0.80) | ||
| Octanal | 7.91 (8.01) | 7.74 (3.00) | 5.98 (1.07) | ||
| 2-Octenal | 0.84 (1.09) | 1.01 (0.45) | 0.70 (0.37) | ||
| Nonanal | 23.8 (18.2) | 23.7 (10.1) | 17.5 (5.73) | ||
| (E)-2-Nonenal | 0.30 (0.32) | 0.38 (0.14) | 0.24 (0.05) | ||
| (Z)-4-Decenal | 0.00 a (0.00) | 0.00 a (0.00) | 0.00 b (0.00) | KW; LDA | 0.026 |
| Decanal | 0.96 (1.37) | 1.37 (0.74) | 0.89 (0.49) | ||
| 2-Decenal | 0.20 (0.22) | 0.29 (0.13) | 0.15 (0.05) | ||
| (E,E)-2,4-Decadienal | 0.00 b (0.18) | 0.17 a (0.11) | 0.06 ab (0.06) | KW; LDA | 0.028 |
| (E)-2-Undecenal | 0.10(0.12) | 0.12 (0.05) | 0.06 (0.02) | ||
| Dodecanal | 0.24 (0.24) | 0.30 (0.12) | 0.20 (0.06) | ||
| Tridecanal | 0.04 ab (0.05) | 0.07 a (0.04) | 0.01 b (0.01) | KW; LDA | 0.029 |
| Tetradecanal | 0.06 ab (0.06) | 0.08 a (0.03) | 0.03 b (0.03) | KW; LDA | 0.031 |
| Ketones | |||||
| 2-Heptanone | 0.79 (1.03) | 0.81 (0.34) | 0.83 (0.23) | ||
| Butyrolactone | nd | nd | nd | ||
| 2-Methyl-6-heptanone | 0.13 (0.55) | 0.03 (0.03) | 0.00 (0.00) | ||
| 2-Nonanone | 0.08 ab (0.12) | 0.00 b (0.00) | 0.38 a (0.32) | KW; LDA | 0.005 |
| Hydrocarbons | |||||
| Toluene | nd | nd | nd | ||
| 1,2,4-Trimethyl-cyclopentane | nd | nd | nd | ||
| Propyl-cyclohexane | 0.00 (2.16) | 0.00 (0.00) | 0.00 (0.00) | ||
| 4-Methyl-nonane | nd | nd | nd | ||
| 2,2,6-Trimethyl-octane | nd | nd | nd | ||
| 2,2,4,6-Pentamethyl-heptane | 40.4 (33.5) | 39.7 (16.0) | 27.2 (8.66) | ||
| Decane | 0.41 (0.42) | 0.29 (0.24) | 0.18 (0.14) | ||
| 2,2,4,4-Tetramethyl-octane | 3.16 (3.42) | 2.40 (1.05) | 2.23 (1.06) | ||
| 2,6,7-Trimethyl-decane | 0.67 (0.63) | 0.51 (0.35) | 0.34 (0.34) | ||
| 2-Methyl-decane | 0.00 (0.09) | 0.00 (0.00) | 0.00 (0.00) | ||
| 5-Undecene | nd | nd | nd | ||
| Undecane | 1.10 (1.18) | 1.09 (0.21) | 1.02 (0.42) | ||
| 2,8-Dimethyl-4-methylene-nonane | nd | nd | nd | ||
| Pentyl-cyclohexane | nd | nd | nd | ||
| 3-Methylene-undecane | 0.00 (0.07) | 0.00 (0.00) | 0.00 (0.00) | ||
| Dodecane | 1.16 (1.23) | 1.22 (0.45) | 0.95 (0.39) | ||
| 2,6,11-Trimethyl-dodecane | 0.17 (0.19) | 0.30 (0.10) | 0.23 (0.09) | ||
| Tridecane | 0.55 (0.62) | 0.79 (0.35) | 0.58 (0.20) | ||
| 2,3,5,8-Tetramethyl-decane | 0.19 (0.19) | 0.23 (0.08) | 0.20 (0.06) | ||
| Tetradecane | 0.52 (0.50) | 0.61 (0.22) | 0.48 (0.14) | ||
| Pentadecane | 0.36 b (0.66) | 0.57 ab (0.13) | 1.18 a (0.75) | KW; LDA | 0.013 |
| 2,6,10-Trimethyl-tetradecane | 0.07 (0.08) | 0.10 (0.03) | 0.08 (0.05) | ||
| Hexadecane | 0.21 (0.21) | 0.28 (0.06) | 0.20 (0.06) | ||
| Heptadecane | 0.03 b (0.03) | 0.28 a (0.10) | 0.00 b (0.00) | KW; LDA | 0.001 |
| Thiols | |||||
| 2-Ethyl-1-hexanethiol | nd | nd | nd | ||
| 2-Methyl-2-heptanethiol | nd | nd | nd | ||
| Esters | |||||
| Pentanoic acid,2,2,4-trimethyl-3-hydroxy-, isobutyl ester | 0.06 (0.09) | 0.08 (0.08) | 0.15 (0.09) | ||
| Carbamodithioic acid, diethyl-, methyl ester | 0.24 (0.27) | 0.35 (0.14) | 0.14 (0.14) | ||
| Dimethyl phtalate | 4.42 (4.74) | 5.73 (1.43) | 4.70 (0.92) | ||
| Pentanoic acid, 2,2,4-trimethyl-3-carboxyisopropy, isobutyl ester | 0.00 (0.01) | 0.00 (0.00) | 0.00 (0.00) | ||
| Lactone | |||||
| γ-nonalactone | 0.12 b (0.12) | 0.20 a (0.07) | 0.09 b (0.03) | KW; LDA | 0.046 |
| Acid | |||||
| Dodecanoic acid | 0.00 (0.01) | 0.00 (0.02) | 0.00 (0.00) | ||
| Nitrile | |||||
| 4-Cyano-cyclohexene | 0.00 (0.23) | 0.00 (0.00) | 0.16 (0.16) | ||
| Azide | |||||
| 2-Azido-2,4,4,6,6-pentamethyl-heptane | 0.15 (0.26) | 0.05 (0.05) | 0.15 (0.11) | ||
| Unknown | |||||
| Unknown (RT:17.96 min) | 0.00 b (0.00) | 0.00 b (0.00) | 0.00 a (0.00) | KW; LDA | 0.040 |
| Unknown (RT:23.76 min) | 0.01 (0.03) | 0.00 (0.00) | 0.09 (0.07) | LDA | |
| Unknown (RT:28.62 min) | 0.00 a (0.00) | 0.00 b (0.00) | 0.00 a (0.00) | KW; LDA | 0.012 |
| Unknown (RT:37.40 min) | 0.00 (0.02) | 0.00 (0.00) | 0.00 (0.00) | LDA |
| C 1 | SP 1 | HI 1 | Statistical Analysis | p-Level | |
|---|---|---|---|---|---|
| Alcohols | |||||
| 2-Methoxy-ethanol | 3.43 (2.11) | 1.62 (1.58) | 1.71 (1.10) | ||
| 1-Penten-3-ol | 3.98 (2.84) | 2.93 (1.30) | 2.58 (2.49) | ||
| 1-Pentanol | 8.88 a (5.76) | 9.89 a (3.72) | 2.02 b (1.08) | KW | 0.016 |
| 1-Hexanol | 4.20 a (2.59) | 4.69 a (2.72) | 1.53 b (0.38) | KW; LDA | 0.003 |
| 1-Heptanol | 1.44 (0.83) | 2.49 (0.86) | 1.52 (0.49) | ||
| 1-Octen-3-ol | 30.8 a (13.7) | 36.0 a (9.44) | 11.6 b (0.93) | KW; LDA | 0.001 |
| 2-Ethyl-2-hexenol | nd | nd | nd | ||
| 4-Ethyl-cyclohexanol | 4.39 ab (4.39) | 6.30 a (1.65) | 2.53 b (0.60) | KW | 0.009 |
| 2-Ethyl-1-hexanol | 12.2 (3.02) | 19.4 (4.95) | 20.3 (2.75) | ||
| 2-Ethyl-1-decanol | 3.38 (1.66) | 3.90 (1.99) | 4.78 (1.32) | ||
| 2-Octen-1-ol | 0.32 (0.32) | 1.34 (1.34) | 1.53 (0.73) | ||
| 1-Octanol | 4.05 ab (2.02) | 4.83 a (1.15) | 2.61 b (0.71) | KW | 0.045 |
| Benzenemethanol,α,α-dimethyl | 0.21 (0.21) | 0.81 (0.37) | 0.68 (0.20) | ||
| (Z)-2-Nonen-1-ol | 4.80 ab (1.53) | 6.52 a (1.95) | 4.17 b (1.06) | KW | 0.041 |
| 1-Nonanol | 0.05 (0.05) | 0.24 (0.24) | 0.24 (0.16) | ||
| Aldehydes | |||||
| Pentanal | 8.04 a (3.71) | 7.40 ab (2.21) | 2.85 b (1.23) | KW | 0.026 |
| Hexanal | 283.7 a (135.8) | 230.5 a (123.7) | 44.7 b (20.8) | KW; LDA | 0.001 |
| Heptanal | 5.64 a (2.44) | 9.90 a (3.12) | 2.30 b (0.51) | KW; LDA | 0.002 |
| Methional | 0.20 (0.20) | 0.08 (0.08) | 0.27 (0.15) | ||
| 2-Heptenal | 0.71 a (0.42) | 0.54 a (0.25) | 0.08 b (0.07) | KW; LDA | 0.001 |
| Benzaldehyde | 3.07 (1.31) | 2.71 (0.57) | 3.14 (0.84) | ||
| Octanal | 16.0 a (6.11) | 15.8 a (6.35) | 6.18 b (1.36) | KW; LDA | 0.004 |
| 2-Octenal | 1.23 b (0.68) | 3.02 ab (1.22) | 3.50 a (1.13) | KW | 0.045 |
| Nonanal | 24.8 a (8.06) | 31.6 a (8.50) | 11.8 b (2.52) | KW; LDA | 0.008 |
| (E)-2-Nonenal | 0.53 (0.26) | 0.54 (0.13) | 0.33 (0.05) | ||
| (Z)-4-Decenal | 0.00 (0.00) | 0.28 (0.10) | 0.23 (0.09) | ||
| Decanal | 0.87 a (0.25) | 0.96 a (0.37) | 0.09 b (0.09) | KW | 0.008 |
| (E)-2-Decenal | 0.06 ab (0.06) | 0.19 a (0.07) | 0.00 b (0.00) | KW; LDA | 0.003 |
| (E,E)-2,4-Decadienal | 0.06 (0.06) | 0.09 (0.04) | 0.03 (0.03) | ||
| (E)-2-Undecenal | 0.00 ab (0.00) | 0.07 b (0.07) | 0.00 a (0.00) | KW | 0.022 |
| Dodecanal | 0.05 (0.05) | 0.04 (0.04) | 0.00 (0.00) | ||
| Tridecanal | nd | nd | nd | ||
| Tetradecanal | nd | nd | nd | ||
| Ketones | |||||
| 2-Heptanone | 0.35 (0.31) | 0.28 (0.18) | 0.21 (0.08) | ||
| Butyrolactone | 0.42 (0.40) | 0.97 (0.72) | 0.24 (0.16) | ||
| 2-Methyl-6-heptanone | 0.00 (0.00) | 0.00 (0.00) | 0.00 (0.00) | ||
| 2-Nonanone | 0.00 (0.00) | 0.00 (0.00) | 0.00 (0.00) | ||
| Hydrocarbons | |||||
| Toluene | 0.17 a (0.17) | 0.03 ab (0.03) | 0.00 b (0.00) | KW | 0.048 |
| 1,2,4-Trimethyl-cyclopentane | 0.68 (0.68) | 0.32 (0.23) | 0.16 (0.16) | ||
| Propyl-cyclohexane | 0.35 (0.28) | 0.34 (0.07) | 0.27 (0.08) | ||
| 4-Methyl-nonane | 0.00 b (0.00) | 0.00 b (0.00) | 0.22 a (0.16) | KW; LDA | 0.002 |
| 2,2,6-trimethyl-octane | 0.00 a (0.00) | 0.00 ab (0.00) | 0.48 b (0.48) | KW; LDA | 0.004 |
| 2,2,4,6-Pentamethyl-heptane | 53.5 a (35.0) | 25.8 a (4.86) | 19.3 b (6.90) | KW | 0.011 |
| Decane | 4.24 a (2.96) | 2.43 a (1.59) | 1.50 b (0.44) | KW | 0.034 |
| 2,2,4,4-Tetramethyl-octane | 4.34 (1.86) | 1.24 (1.24) | 0.73 (0.73) | ||
| 2,6,7-Trimethyl-decane | 1.43 b (1.43) | 8.24 a (2.20) | 10.8 a (3.84) | KW; LDA | 0.000 |
| 2-Methyl-decane | 0.00 b (0.00) | 2.42 a (0.95) | 3.18 a (1.27) | KW; LDA | 0.000 |
| 5-Undecene | 0.29 (0.29) | 2.37 (1.33) | 2.50 (1.09) | ||
| Undecane | 1.57 a (1.46) | 0.12 b (0.08) | 0.09 b (0.04) | KW | 0.024 |
| 2,8-dimethyl-4-methylene-nonane | 0.00 b (0.00) | 0.07 ab (0.07) | 0.20 a (0.19) | KW | 0.029 |
| Pentyl-cyclohexane | 0.28 (0.24) | 0.39 (0.12) | 0.64 (0.21) | ||
| 3-Methylene-undecane | 0.25 (0.23) | 0.26 (0.14) | 0.39 (0.14) | ||
| Dodecane | 0.93 (0.79) | 0.15 (0.14) | 0.09 (0.09) | ||
| 2,6,11-trimethyl-dodecane | 0.05 (0.05) | 0.03 (0.03) | 0.00 (0.00) | ||
| Tridecane | 0.50 (0.29) | 0.28 (0.07) | 0.25 (0.11) | ||
| 2,3,5,8-tetramethyl-decane | 0.02 (0.02) | 0.00 (0.00) | 0.01 (0.01) | ||
| Tetradecane | 0.30 (0.09) | 0.32 (0.07) | 0.22 (0.05) | ||
| Pentadecane | 0.21 (0.08) | 0.24 (0.10) | 0.24 (0.09) | ||
| 2,6,10-trimethyl-tetradecane | 0.00 (0.00) | 0.00 (0.00) | 0.00 (0.00) | ||
| Hexadecane | 0.12 (0.07) | 0.14 (0.08) | 0.08 (0.03) | ||
| Heptadecane | 0.00 (0.00) | 0.05 (0.05) | 0.00 (0.00) | ||
| Thiols | |||||
| 2-Ethyl-1-hexanethiol | 0.58 b (0.58) | 5.86 a (1.33) | 8.94 a (3.24) | KW | 0.009 |
| 2-Methyl-2-heptanethiol | 4.48 b (1.00) | 7.29 ab (1.64) | 9.68 a (2.53) | KW | 0.009 |
| Esters | |||||
| Pentanoic acid,2,2,4-trimethyl-3-hydroxy-, isobutyl ester | 0.00 (0.00) | 0.00 (0.00) | 0.00 (0.00) | ||
| Carbamodithioic acid, diethyl-, methyl ester | nd | nd | nd | ||
| Dimethyl phtalate | 1.85 (0.53) | 1.93 (0.95) | 1.35 (0.41) | ||
| Pentanoic acid, 2,2,4-trimethyl-3-carboxyisopropyl, isobutyl ester | 0.04 (0.04) | 0.10 (0.06) | 0.07 (0.04) | ||
| Lactone | |||||
| γ-Nonalactone | nd | nd | nd | ||
| Acid | |||||
| Dodecanoic acid | 0.00 (0.00) | 0.00 (0.00) | 0.00 (0.00) | KW | 0.040 |
| Nitrile | |||||
| 4-Cyano-cyclohexene | 4.35 a (2.31) | 0.98 ab (0.98) | 0.31 b (0.31) | KW | 0.041 |
| Azide | |||||
| 2-Azido-2,4,4,6,6-pentamethyl-heptane | nd | nd | nd | ||
| Unknown | |||||
| Unknown (RT = 13.40 min) | 0.35 a (0.22) | 0.57 a (0.33) | 0.00 b (0.00) | KW; LDA | 0.006 |
| Unknown (RT = 15.26 min) | 1.78 b (1.06) | 8.07 a (2.91) | 10.2 a (4.58) | KW; LDA | 0.000 |
| Unknown (RT = 16.51 min) | 0.30 a (0.30) | 0.00 b (0.00) | 0.00 ab (0.00) | KW | 0.020 |
| Unknown (RT = 18.15 min) | 0.26 ab (0.26) | 0.30 a (0.16) | 0.00 b (0.00) | KW | 0.045 |
© 2020 by the authors. Licensee MDPI, Basel, Switzerland. This article is an open access article distributed under the terms and conditions of the Creative Commons Attribution (CC BY) license (http://creativecommons.org/licenses/by/4.0/).
Share and Cite
Gkarane, V.; Ciulu, M.; Altmann, B.A.; Schmitt, A.O.; Mörlein, D. The Effect of Algae or Insect Supplementation as Alternative Protein Sources on the Volatile Profile of Chicken Meat. Foods 2020, 9, 1235. https://doi.org/10.3390/foods9091235
Gkarane V, Ciulu M, Altmann BA, Schmitt AO, Mörlein D. The Effect of Algae or Insect Supplementation as Alternative Protein Sources on the Volatile Profile of Chicken Meat. Foods. 2020; 9(9):1235. https://doi.org/10.3390/foods9091235
Chicago/Turabian StyleGkarane, Vasiliki, Marco Ciulu, Brianne A. Altmann, Armin O. Schmitt, and Daniel Mörlein. 2020. "The Effect of Algae or Insect Supplementation as Alternative Protein Sources on the Volatile Profile of Chicken Meat" Foods 9, no. 9: 1235. https://doi.org/10.3390/foods9091235