Innovative Rough Beer Conditioning Process Free from Diatomaceous Earth and Polyvinylpolypyrrolidone


Abstract
: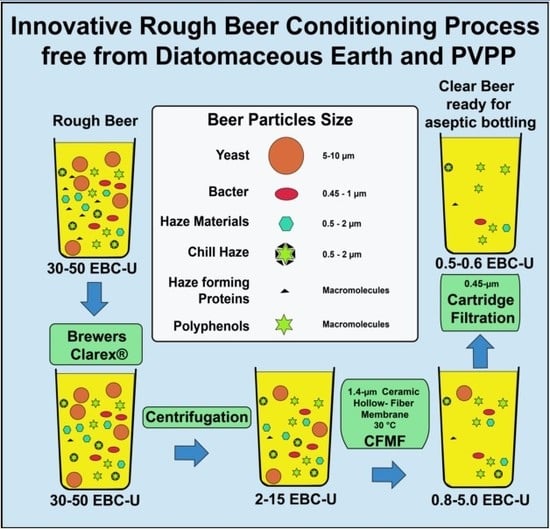
1. Introduction
2. Materials and Methods
2.1. Raw Materials
2.2. Equipment and Experimental Procedure
2.3. Analytical Methods
2.4. Sensory Analysis
2.5. Statistical Analysis of Data
3. Results and Discussion
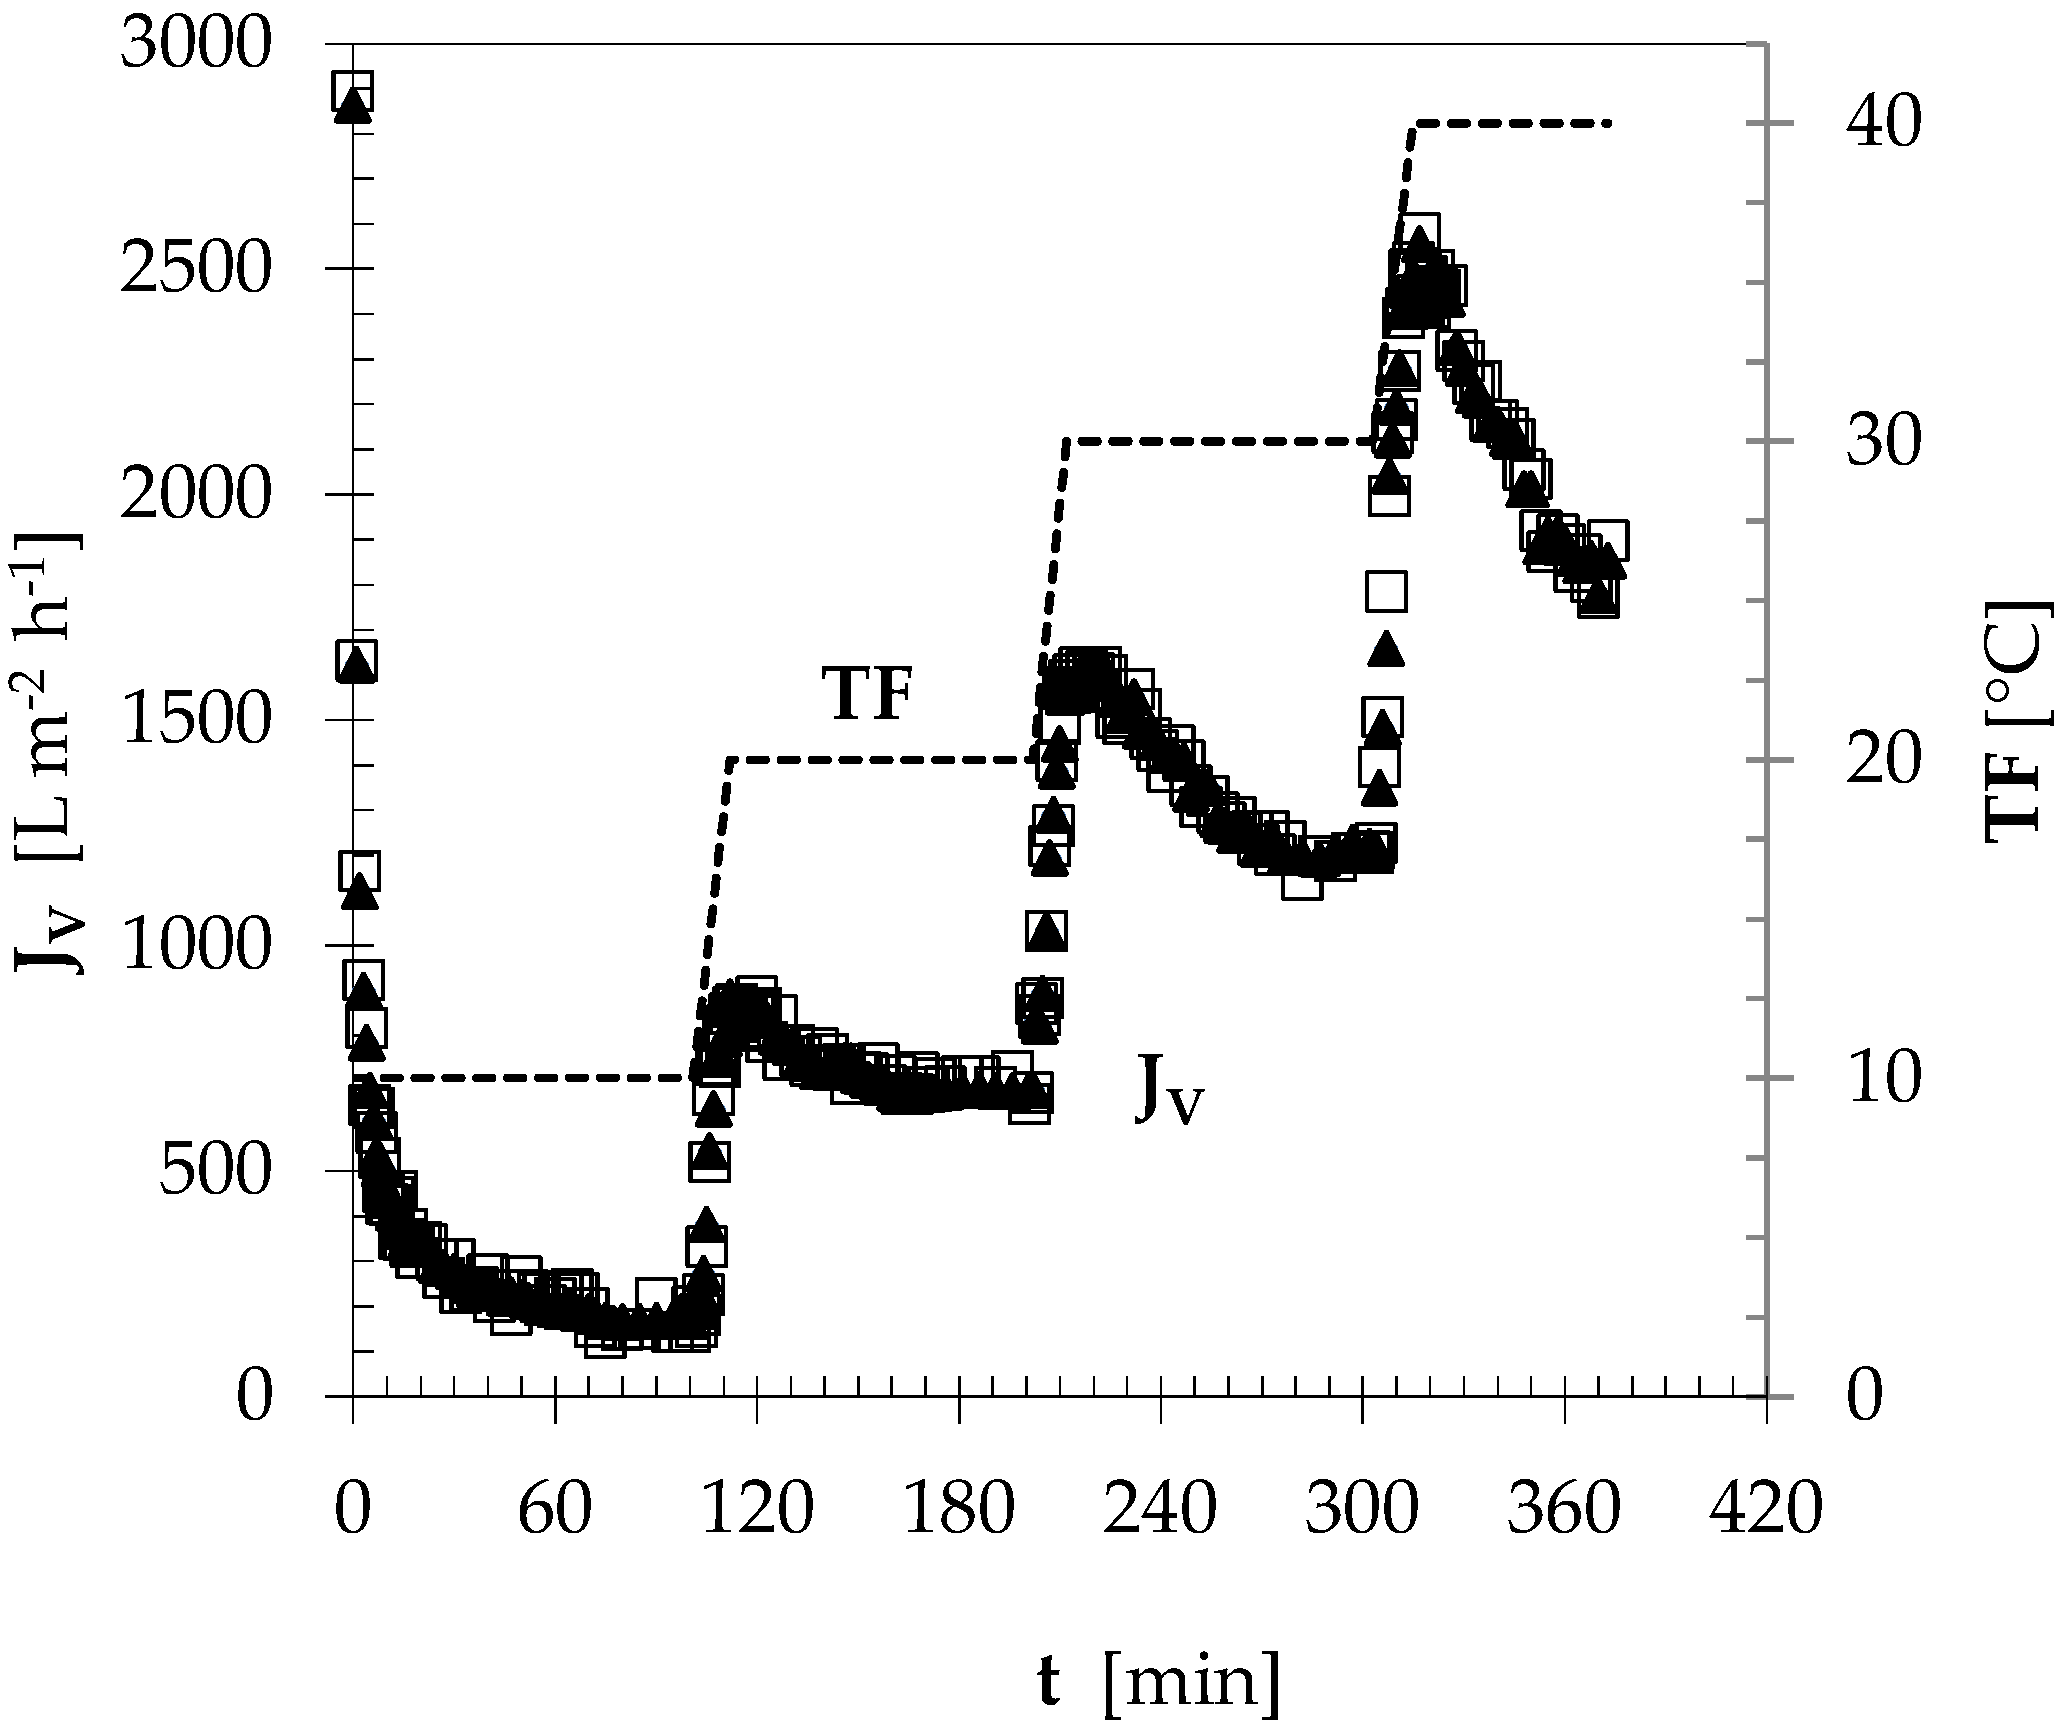
3.1. Permeation Flux vs. Filtration Temperature
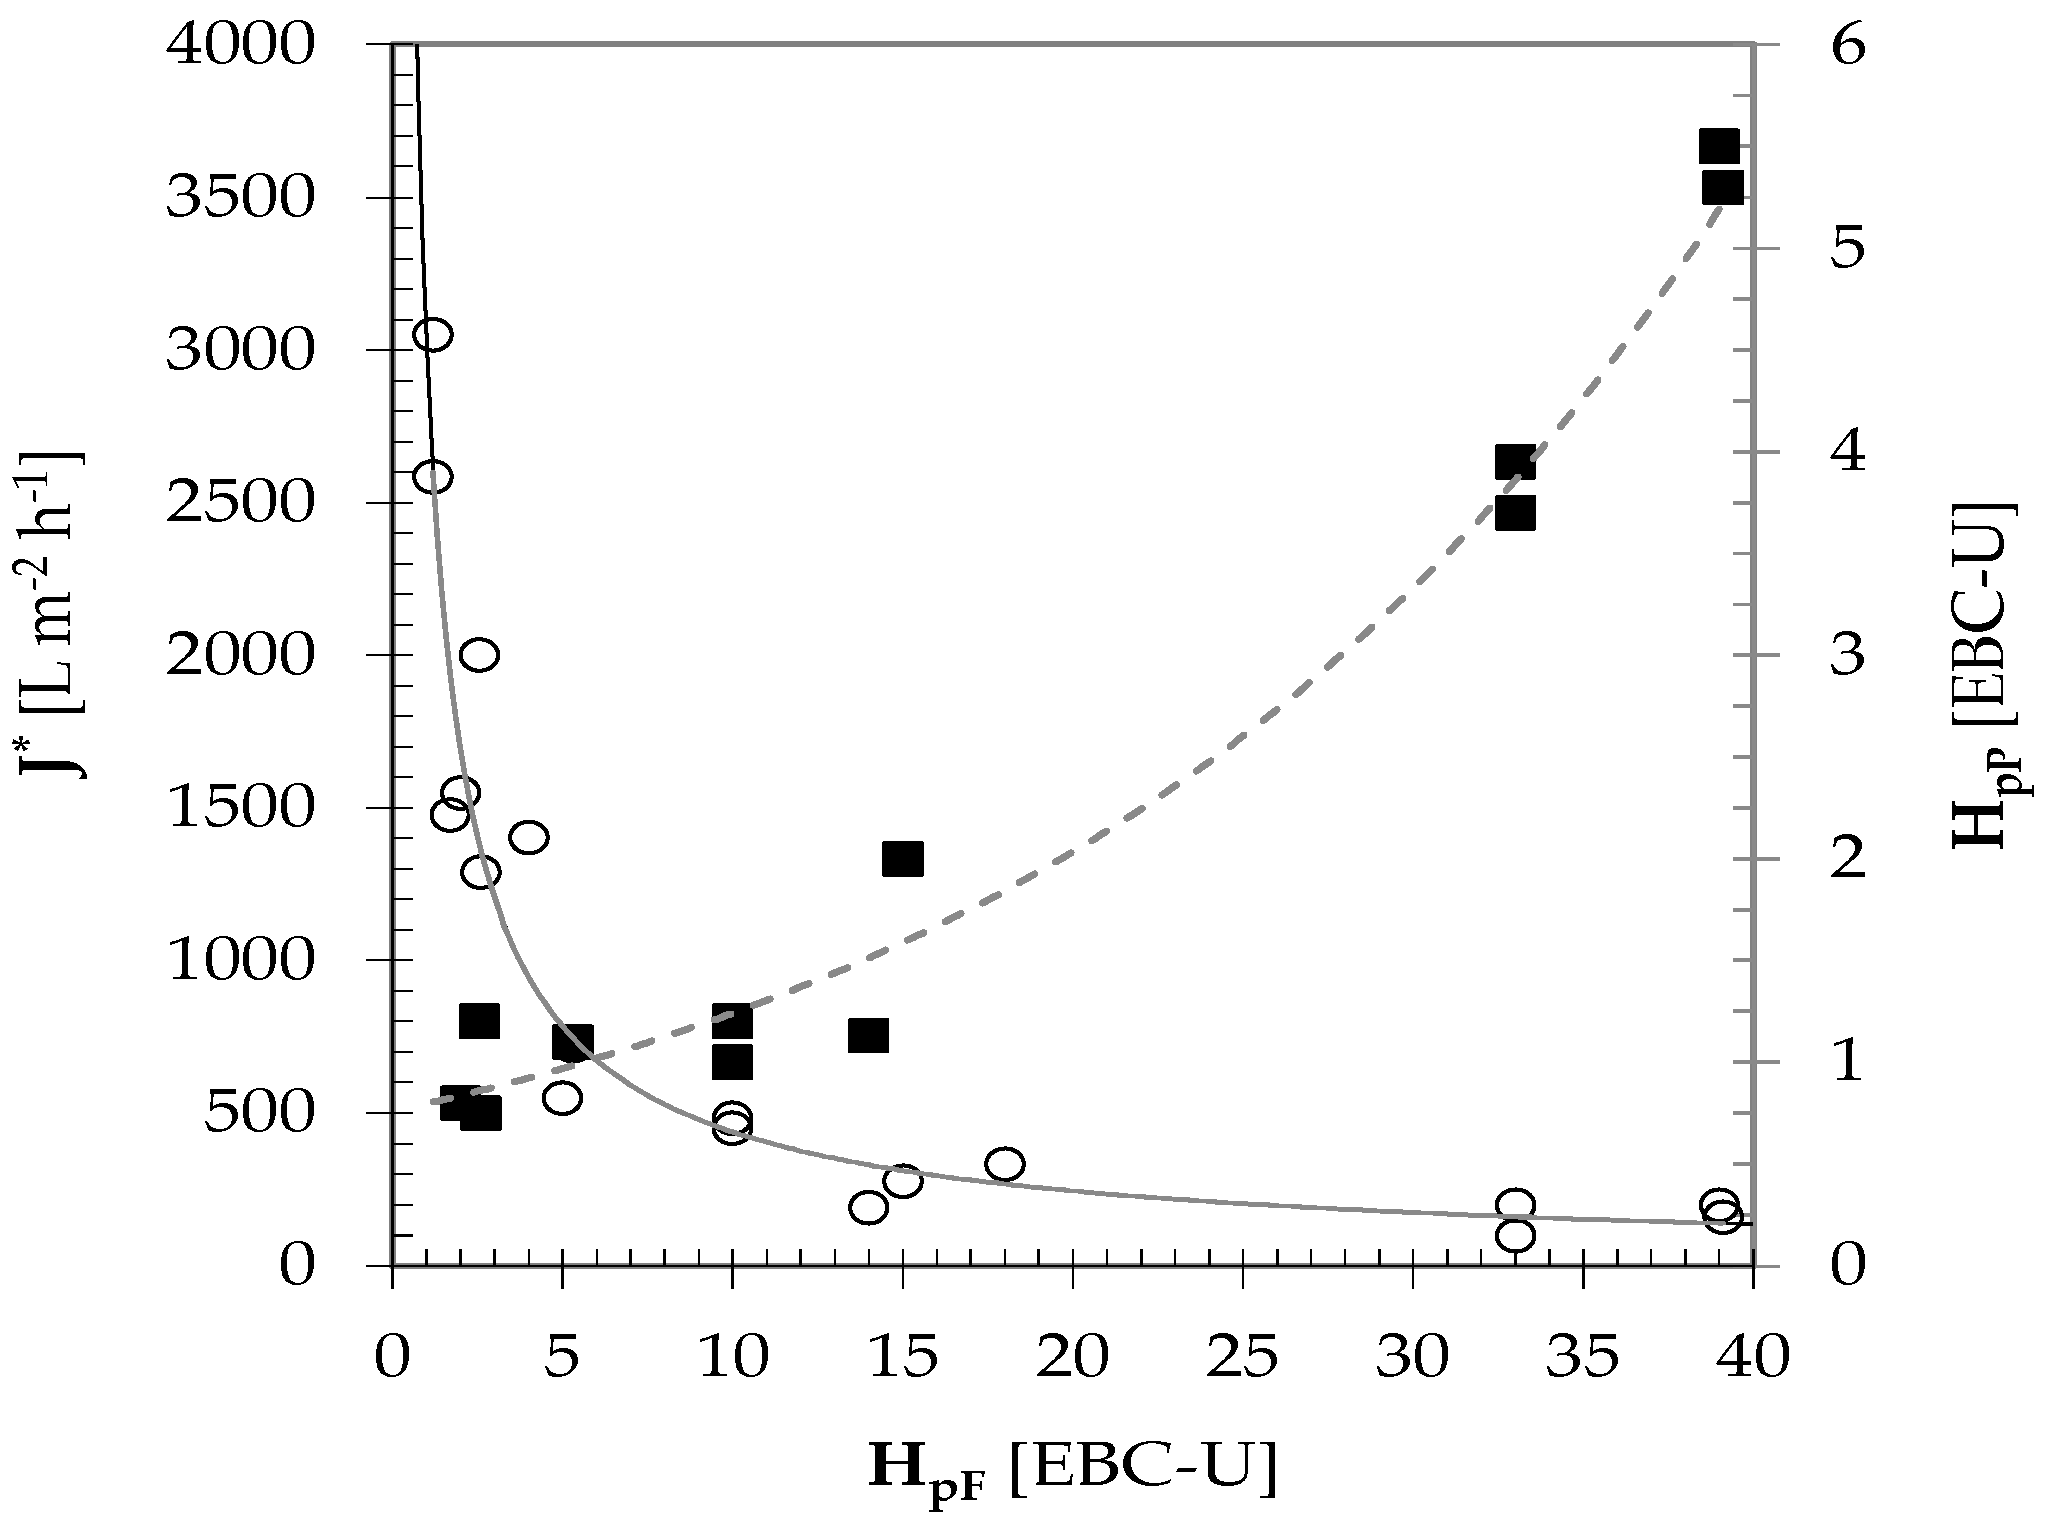
3.2. Permeation Flux vs. Feed Turbidity
3.3. Sensitivity of the Permeation Flux to Feed Turbidity and Crossflow Velocity
3.4. Validation Testing
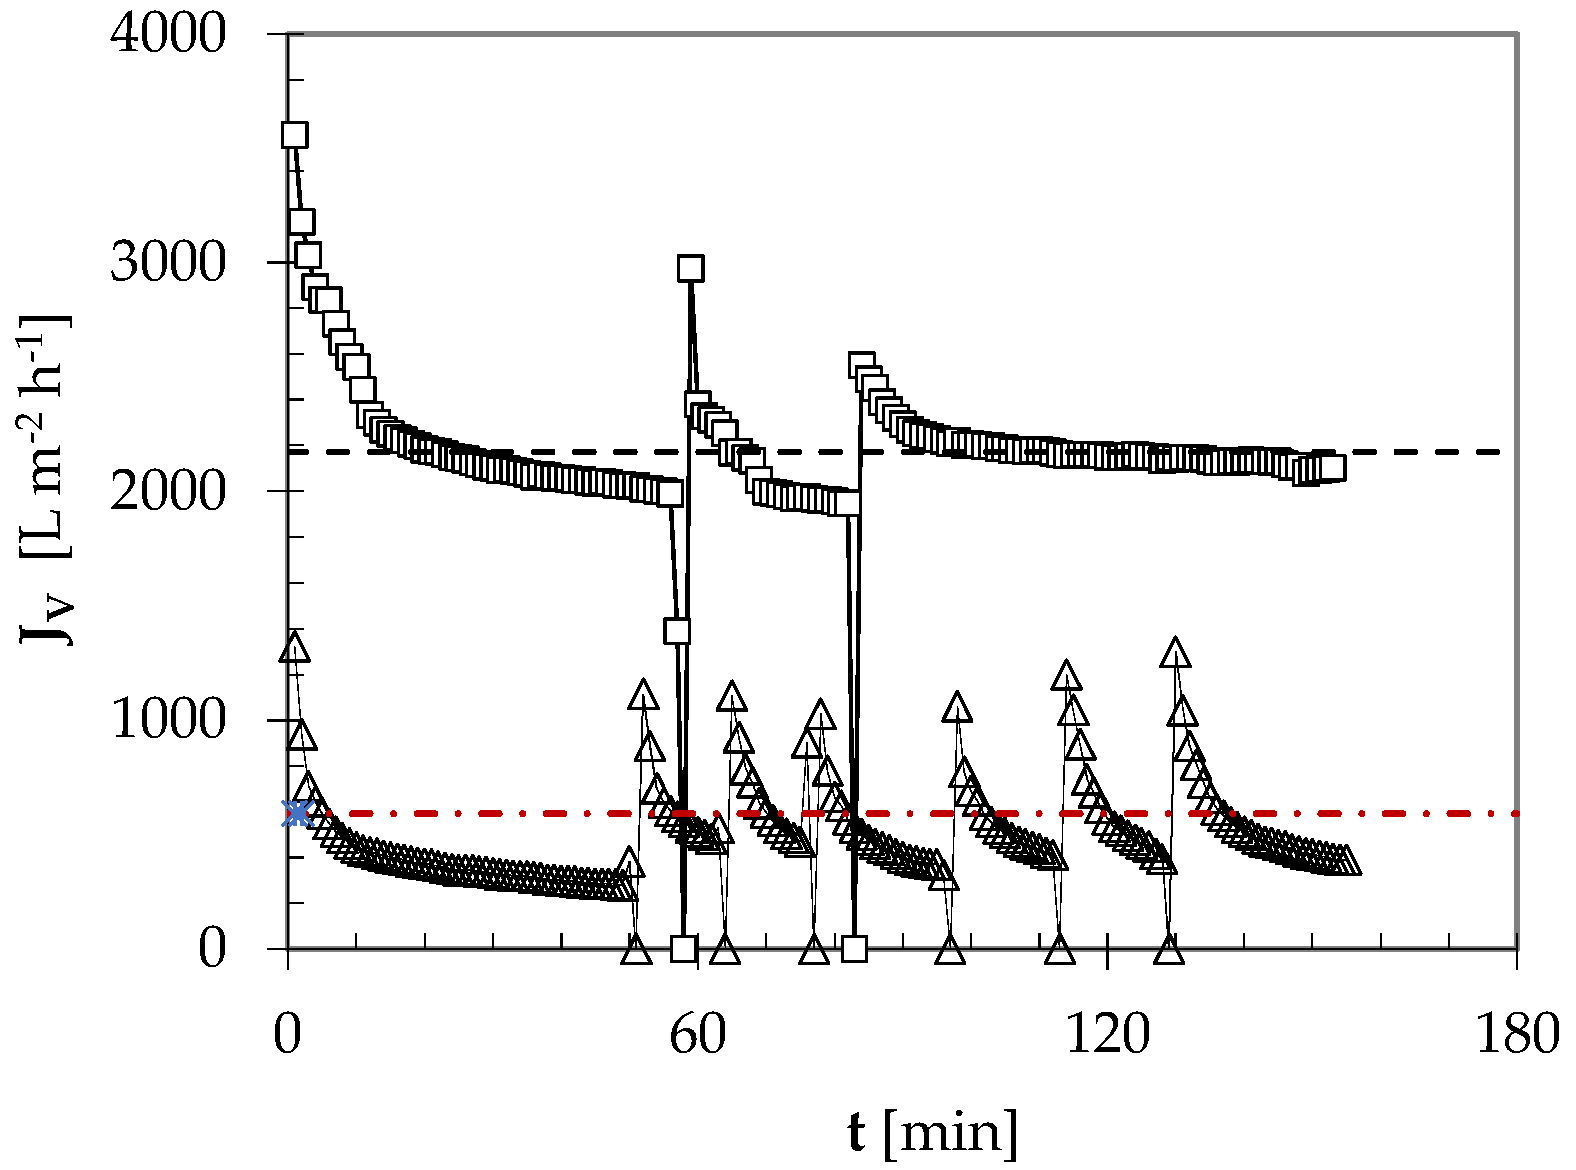
3.4.1. Permeation Flux under Periodic CO2 Backflushing
3.4.2. Chemico-Physical Characteristics and Colloidal Stability of Permeated Beer
3.4.3. Microbiological Characterization
3.4.4. Sensory Analysis
4. Conclusions
Author Contributions
Funding
Acknowledgments
Conflicts of Interest
References
- Bamforth, C.W. 125th Anniversary review: The non-biological instability of beer. J. Inst. Brew. 2011, 117, 488–497. [Google Scholar] [CrossRef]
- Gresser, A. (2010) Stability of Beer. In Handbook of Brewing: Processes, Technology, Markets, 1st ed.; Eßlinger, H.M., Ed.; Wiley-VCH: Weinheim, Germany, 2009; pp. 399–435. [Google Scholar]
- Fillaudeau, L.; Blanpain-Avet, P.; Daufin, G. Water, wastewater and waste management in brewing industries. J. Clean Prod. 2006, 14, 463–471. [Google Scholar] [CrossRef]
- Noordman, T.R.; Peet, C.; Iverson, W.; Broens, L.; van Hoof, S. Cross-flow filtration for clarification of lager beer: Economic reality. Master Brew. Assoc. Am. Tech. Q. 2001, 38, 207–210. [Google Scholar]
- Buttrick, P.; Choices, C. Beer processing and filtration. Brew. Distill. Int. 2010, 6, 10–16. [Google Scholar]
- Briggs, D.E.; Boulton, C.A.; Brookes, P.A.; Stevens, R. Brewing: Science and Practice; Woodhead Publishing Ltd.: Cambridge, UK, 2004. [Google Scholar]
- American Chemical Society (ACS). Widely Used Filtering Material Adds Arsenic to Beers. Science Daily. 7 April 2013. Available online: http://www.sciencedaily.com/releases/2013/04/130407183550.htm (accessed on 9 July 2020).
- Siebert, K.J. Haze Formation in Beverages. LWT 2006, 39, 987–994. [Google Scholar] [CrossRef]
- Leiper, K.A.; Miedl, A. Colloidal stability of beer. In Beer: A Quality Perspective, 1st ed.; Bamforth, C.W., Ed.; Academic Press: Burlington, Canada, 2009; pp. 111–161. [Google Scholar]
- Rehmanji, M.; Gopal, C.; Mola, A. Beer stabilization technology-clearly a matter of choice. Tech. Q. Master Brew. Assoc. 2005, 42, 332–338. [Google Scholar]
- Siebert, K.J.; Lynn, P.Y. Mechanisms of beer colloidal stabilization. J. Am. Soc. Brew. Chem. 1997, 55, 73–78. [Google Scholar] [CrossRef]
- Cimini, A.; Moresi, M. Novel cold sterilization and stabilization process applied to a pale lager. J. Food Eng. 2015, 145, 1–9. [Google Scholar] [CrossRef]
- Back, W. Farbatlas und Handbuch der Getränkebiologie. Teil 1. Kultivierung/Methoden, Brauerei, Winzerei; Verlag Hans Carl: Nürnberg, Germany, 1994. [Google Scholar]
- Buzrul, S. A suitable model of microbial survival curves for beer pasteurization. LWT 2007, 40, 1330–1336. [Google Scholar] [CrossRef]
- Tshang, E.W.T.; Ingledew, W.M. Studies on heat resistance of wild yeasts and bacteria in beer. J. Am. Soc. Brew. Chem. 1982, 40, 1–8. [Google Scholar]
- Hackensellner, T. Efficient Energy Use in the Brewhouse; The Huppman Group: Kitzingen, Germany, 2000. [Google Scholar]
- Galitsky, C.; Martin, N.; Worrell, E.; Lehman, B. Energy Efficiency Improvement and Cost Saving Opportunities for Breweries. An ENERGY STAR® Guide for Energy and Plant Managers; Energy Analysis Department, University of California: Berkeley, CA, USA, 2003. Available online: https://www.osti.gov/servlets/purl/819468 (accessed on 14 June 2020).
- Cheryan, M. Ultrafiltration and Microfiltration Handbook; Technomic Publ. Co.: Lancaster, PA, USA, 1998. [Google Scholar]
- Buttrick, P. Filtration—The facts. Brew. Distill. Int. 2007, 3, 12–19. [Google Scholar]
- Cimini, A.; Moresi, M. Beer clarification using ceramic tubular membranes. Food Bioprocess Technol. 2014, 7, 2694–2710. [Google Scholar] [CrossRef]
- Gan, Q.; Howell, J.A.; Field, R.W.; England, R.; Bird, M.R.; McKechinie, M.T. Synergetic cleaning procedure for a ceramic membrane fouled by beer microfiltration. J. Membr. Sci. 1999, 155, 277–289. [Google Scholar] [CrossRef]
- Sadosky, P.; Schwarz, P.B.; Horsley, R.D. Effect of Arabinoxylans, β-glucans, and dextrins on the viscosity and membrane filterability of a beer model solution. J. Am. Soc. Brew. Chem. 2002, 60, 153–162. [Google Scholar] [CrossRef]
- Jin, Y.-L.; Speers, A.; Paulson, A.T.; Stewart, R.J. Effects of β-Glucans and environmental factors on the viscosities of wort and beer. J. Inst. Brew. 2004, 110, 104–116. [Google Scholar] [CrossRef]
- Cimini, A.; Moresi, M. Towards a Kieselguhr- and PVPP-Free clarification and stabilization process of rough beer at room-temperature conditions. J. Food Sci. 2018, 83, 129–137. [Google Scholar] [CrossRef]
- Anon. Physical Characteristics of Water (at the Atmospheric Pressure); Therm Excel. 2013. Available online: https://www.thermexcel.com/english/tables/eau_atm.htm (accessed on 15 June 2020).
- Eßlinger, H.M. Handbook of Brewing: Processes, Technology, Markets, 1st ed.; Wiley-VCH: Weinheim, Germany, 2009; pp. 165–205, 207–224. [Google Scholar]
- Cimini, A.; Moresi, M. Assessment of the optimal operating conditions for pale lager clarification using novel ceramic hollow-fiber membranes. J. Food Eng. 2016, 173, 132–142. [Google Scholar] [CrossRef]
- Cimini, A.; Moresi, M. Beer clarification by novel ceramic hollow-fiber membranes: Effect of pore size on product quality. J. Food Sci. 2016, 81, E2521–E2528. [Google Scholar] [CrossRef]
- Hyflux Membrane Manufacturing. InoCep®: Ceramic Hollow Fibre Membrane; Hyflux Ltd.: Singapore, 2015; p. 4. Available online: https://company.aquatechtrade.com/Image/Download?docid=31184&dl=MIJNRAI_TOP_LIBRARY<c=MIJNRAI_LOGIN_PRIVATEFILE (accessed on 18 August 2020).
- Moretti, E. Development of Guidelines for Microbiological Control in Microbrewery. Ph.D. Thesis, Food Sciences University of Bologna, Bologna, Italy, 2013. Available online: http://amsdottorato.unibo.it/5872/1/moretti_elio_tesi.pdf (accessed on 9 July 2020).
- European Brewery Convention (EBC). Analytica EBC; Fachverlag Hans Carl: Nürnberg, Germany, 2010. [Google Scholar]
- Cimini, A.; Pallottino, F.; Menesatti, P.; Moresi, M. A low-cost image analysis system to upgrade the rudin beer foam head retention meter. Food Bioprocess Technol. 2016, 9, 1587–1597. [Google Scholar] [CrossRef]
- International Organization for Standardization (ISO). Microbiology of Food and Animal Feeding Stuffs-Horizontal Method for the Enumeration of Mesophilic Lactic Acid Bacteria—Colony-Count Technique at 30 Degrees, C. ISO Standard No. 15214: 1998 (R2015). Available online: https://www.iso.org/standard/26853.html (accessed on 15 June 2020).
- European Brewery Convention (EBC). Haemocytometry. EBC Method no. 3.1.1.1. In Analytica-Microbiologica-EBC; Fachverlag Hans Carl: Nürnberg, Germany, 2005. [Google Scholar]
- Gan, Q.; Field, R.W.; Bird, M.R.; England, R.; Howell, J.A.; McKechnie, M.T.; O’Shaughnessy, C.L. Beer clarification by cross-flow microfiltration: Fouling mechanisms and flux enhancement. Trans. Icheme 1997, 75, 3–8. [Google Scholar] [CrossRef]
- Stopka, J.; Schlosser, Š.; Dömény, Z.; Šmogrovičov, D. Flux decline in microfiltration of beer and related solutions of model foulants through ceramic membranes. Pol. J. Environ. Stud. 2000, 9, 65–69. [Google Scholar]
- Gan, Q.; Howell, J.A.; Field, R.W.; England, R.; Bird, M.R.; O’Shaughnessy, C.L.; MeKechinie, M.T. Beer Clarification by Microfiltration: Product Quality Control and Fractionation of Particles and Macromolecules. J. Membr. Sci. 2001, 194, 185–196. [Google Scholar] [CrossRef]
- Kazemi, M.A.; Soltanieh, M.; Yazdanshenas, M.; Fillaudeau, L. Influence of Crossflow Microfiltration on Ceramic Membrane Fouling and Beer Quality. Desalin. Water Treat. 2013, 51, 4302–4312. [Google Scholar] [CrossRef]
- EBC Technology and Engineering Forum. Beer Pasteurisation: Manual of Good Practice; Getränke-Fachverlag Hans Carl: Nürnberg, Germany, 1995. [Google Scholar]
- Rachon, G.; Rice, C.J.; Pawlowsky, K.; Raleigh, C.P. Challenging the assumptions around the pasteurisation requirements of beer spoilage bacteria. J. Inst. Brew. 2018, 124, 443–449. [Google Scholar] [CrossRef] [Green Version]
- Del Vecchio, H.W.; Dayharsh, C.A.; Baselt, F.C. Thermal death time studies on beer spoilage organisms. Proc. Am. Soc. Brew. Chem. 1951, 50, 45–50. [Google Scholar] [CrossRef]
- Cao, L.; Zhou, G.; Guo, P.; Li, Y. Influence of pasteurizing intensity on beer flavor stability. J. Inst. Brew. 2011, 117, 587–592. [Google Scholar] [CrossRef]


| TF [°C] | JVa [L m−2 h−1] | J* [L m−2 h−1] |
|---|---|---|
| 10 | 297 ± 2 | 163 ± 21 |
| 20 | 709 ± 5 | 687 ± 19 |
| 30 | 1331 ± 1 | 1204 ± 22 |
| 40 | 2090 ± 6 | 1855 ± 46 |
| HpF [EBC-U] | vS [m s−1] | F [L h−1] | P 1 [L h−1] | JVa [L m−2 h−1] | R/P [L L−1] |
|---|---|---|---|---|---|
| 1.5 | 2.5 | 2545 | 110 a | 2750 | 22.1 |
| 1.5 | 1.0 | 1018 | 114 a | 2850 | 7.9 |
| 1.5 | 0.5 | 509 | 105 a | 2625 | 3.8 |
| 33 | 2.5 | 2545 | 14 b | 350 | 180.8 |
| 33 | 1.0 | 1018 | 4 c | 100 | 253.5 |
| 33 | 0.5 | 509 | 2 d | 50 | 260.5 |
| Beer Sample | ρB [kg L−1] | ηB [mPa s] | RE [° P] | C [EBC-U] | Hp [EBC-U] | TP [mg L−1] | yE [% v/v] | t½ [s] | ΔHCPH [EBC-U] | ΔHSP [EBC-U] | ΔHE [EBC-U] |
|---|---|---|---|---|---|---|---|---|---|---|---|
| MFB | 1.004 ± 0.000 a | 1.408 ± 0.008 a | 1.53 ± 0.01 a | 6.9 ± 0.1 a | 0.57 ± 0.08 a | 143 ± 5 a | 4.62 ± 0.04 a | 89 ± 2 a | 0.8 ± 0.3 a | 4.7 ± 0.3 a | 4.0 ± 0.3 a |
| STD | 1.004 ± 0.000 a | 1.415 ± 0.012 a | 1.56 ± 0.03 a | 7.3 ± 0.1 b | 0.50 ± 0.06 b | 99 ±3 b | 4.66 ± 0.06 a | 96 ± 2 b | 1.3 ± 0.2 b | 4.1 ± 0.2 b | 3.0 ± 0.6 b |
| Target Microorganism | L. brevis | S. carlsbergensis | ||||||
|---|---|---|---|---|---|---|---|---|
| Test no. | 1 | 2 | 1 | 2 | ||||
| Sample | NB 1 | LRV | NB 1 | LRV | NY 1 | LRV | NY 1 | LRV |
| R | 1.05 × 10³ | 0.0 | 1.10 × 10³ | 0.00 | 1.70 × 10⁶ | 0.00 | 1.70 × 10⁶ | 0.00 |
| P | 1.60 × 10⁻¹ | 3.82 | 1.10 × 10⁻¹ | 4.00 | 1.09 × 10² | 4.19 | 5.60 × 101 | 4.48 |
| CF | 4.20 × 10⁻² | 4.40 | 1.00 × 10⁻² | 5.04 | 4.25 × 10⁻² | 7.60 | 3.60 × 10⁻² | 7.67 |
| Booth no. | Key | DSI | Panelist’s Comments |
|---|---|---|---|
| 1 | 212 | 1 | 1: more caramel, oxidized flavored, and less crispy |
| 2 | 212 | 1 | 2: less clean and astringent, but heavier in body |
| 3 | 112 | ||
| 4 | 221 | 1 | 1: bitter and more carbonated |
| 5 | 211 | 2 | 2: oxidized flavor |
| 6 | 112 | ||
| 7 | 212 | ||
| 8 | 221 | ||
| 9 | 122 | ||
| 10 | 211 | 2 | 2: phenolic flavor |
| 11 | 121 | 2 | 2: less bitter and more ester flavored |
| 12 | 122 | 1 | 2: less ester flavored, grainy, and acetaldehyde off-flavors |
| 13 | 221 | ||
| 14 | 121 | ||
| 15 | 122 | 1 | 1: more carbonated |
| 16 | 211 | ||
| 17 | 112 | 2 | 2: wine taste in the after taste |
| 18 | 121 | 2 | 2: oxidized flavor and less carbonated |
© 2020 by the authors. Licensee MDPI, Basel, Switzerland. This article is an open access article distributed under the terms and conditions of the Creative Commons Attribution (CC BY) license (http://creativecommons.org/licenses/by/4.0/).
Share and Cite
Cimini, A.; Moresi, M. Innovative Rough Beer Conditioning Process Free from Diatomaceous Earth and Polyvinylpolypyrrolidone. Foods 2020, 9, 1228. https://doi.org/10.3390/foods9091228
Cimini A, Moresi M. Innovative Rough Beer Conditioning Process Free from Diatomaceous Earth and Polyvinylpolypyrrolidone. Foods. 2020; 9(9):1228. https://doi.org/10.3390/foods9091228
Chicago/Turabian StyleCimini, Alessio, and Mauro Moresi. 2020. "Innovative Rough Beer Conditioning Process Free from Diatomaceous Earth and Polyvinylpolypyrrolidone" Foods 9, no. 9: 1228. https://doi.org/10.3390/foods9091228
APA StyleCimini, A., & Moresi, M. (2020). Innovative Rough Beer Conditioning Process Free from Diatomaceous Earth and Polyvinylpolypyrrolidone. Foods, 9(9), 1228. https://doi.org/10.3390/foods9091228