Molecular Dispersion of Starch as a Crucial Parameter during Size-Exclusion Chromatography


Abstract
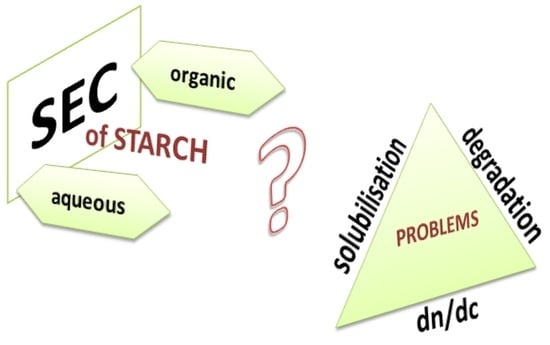
1. Introduction
2. Materials and Methods
2.1. Starch Samples and Chemicals
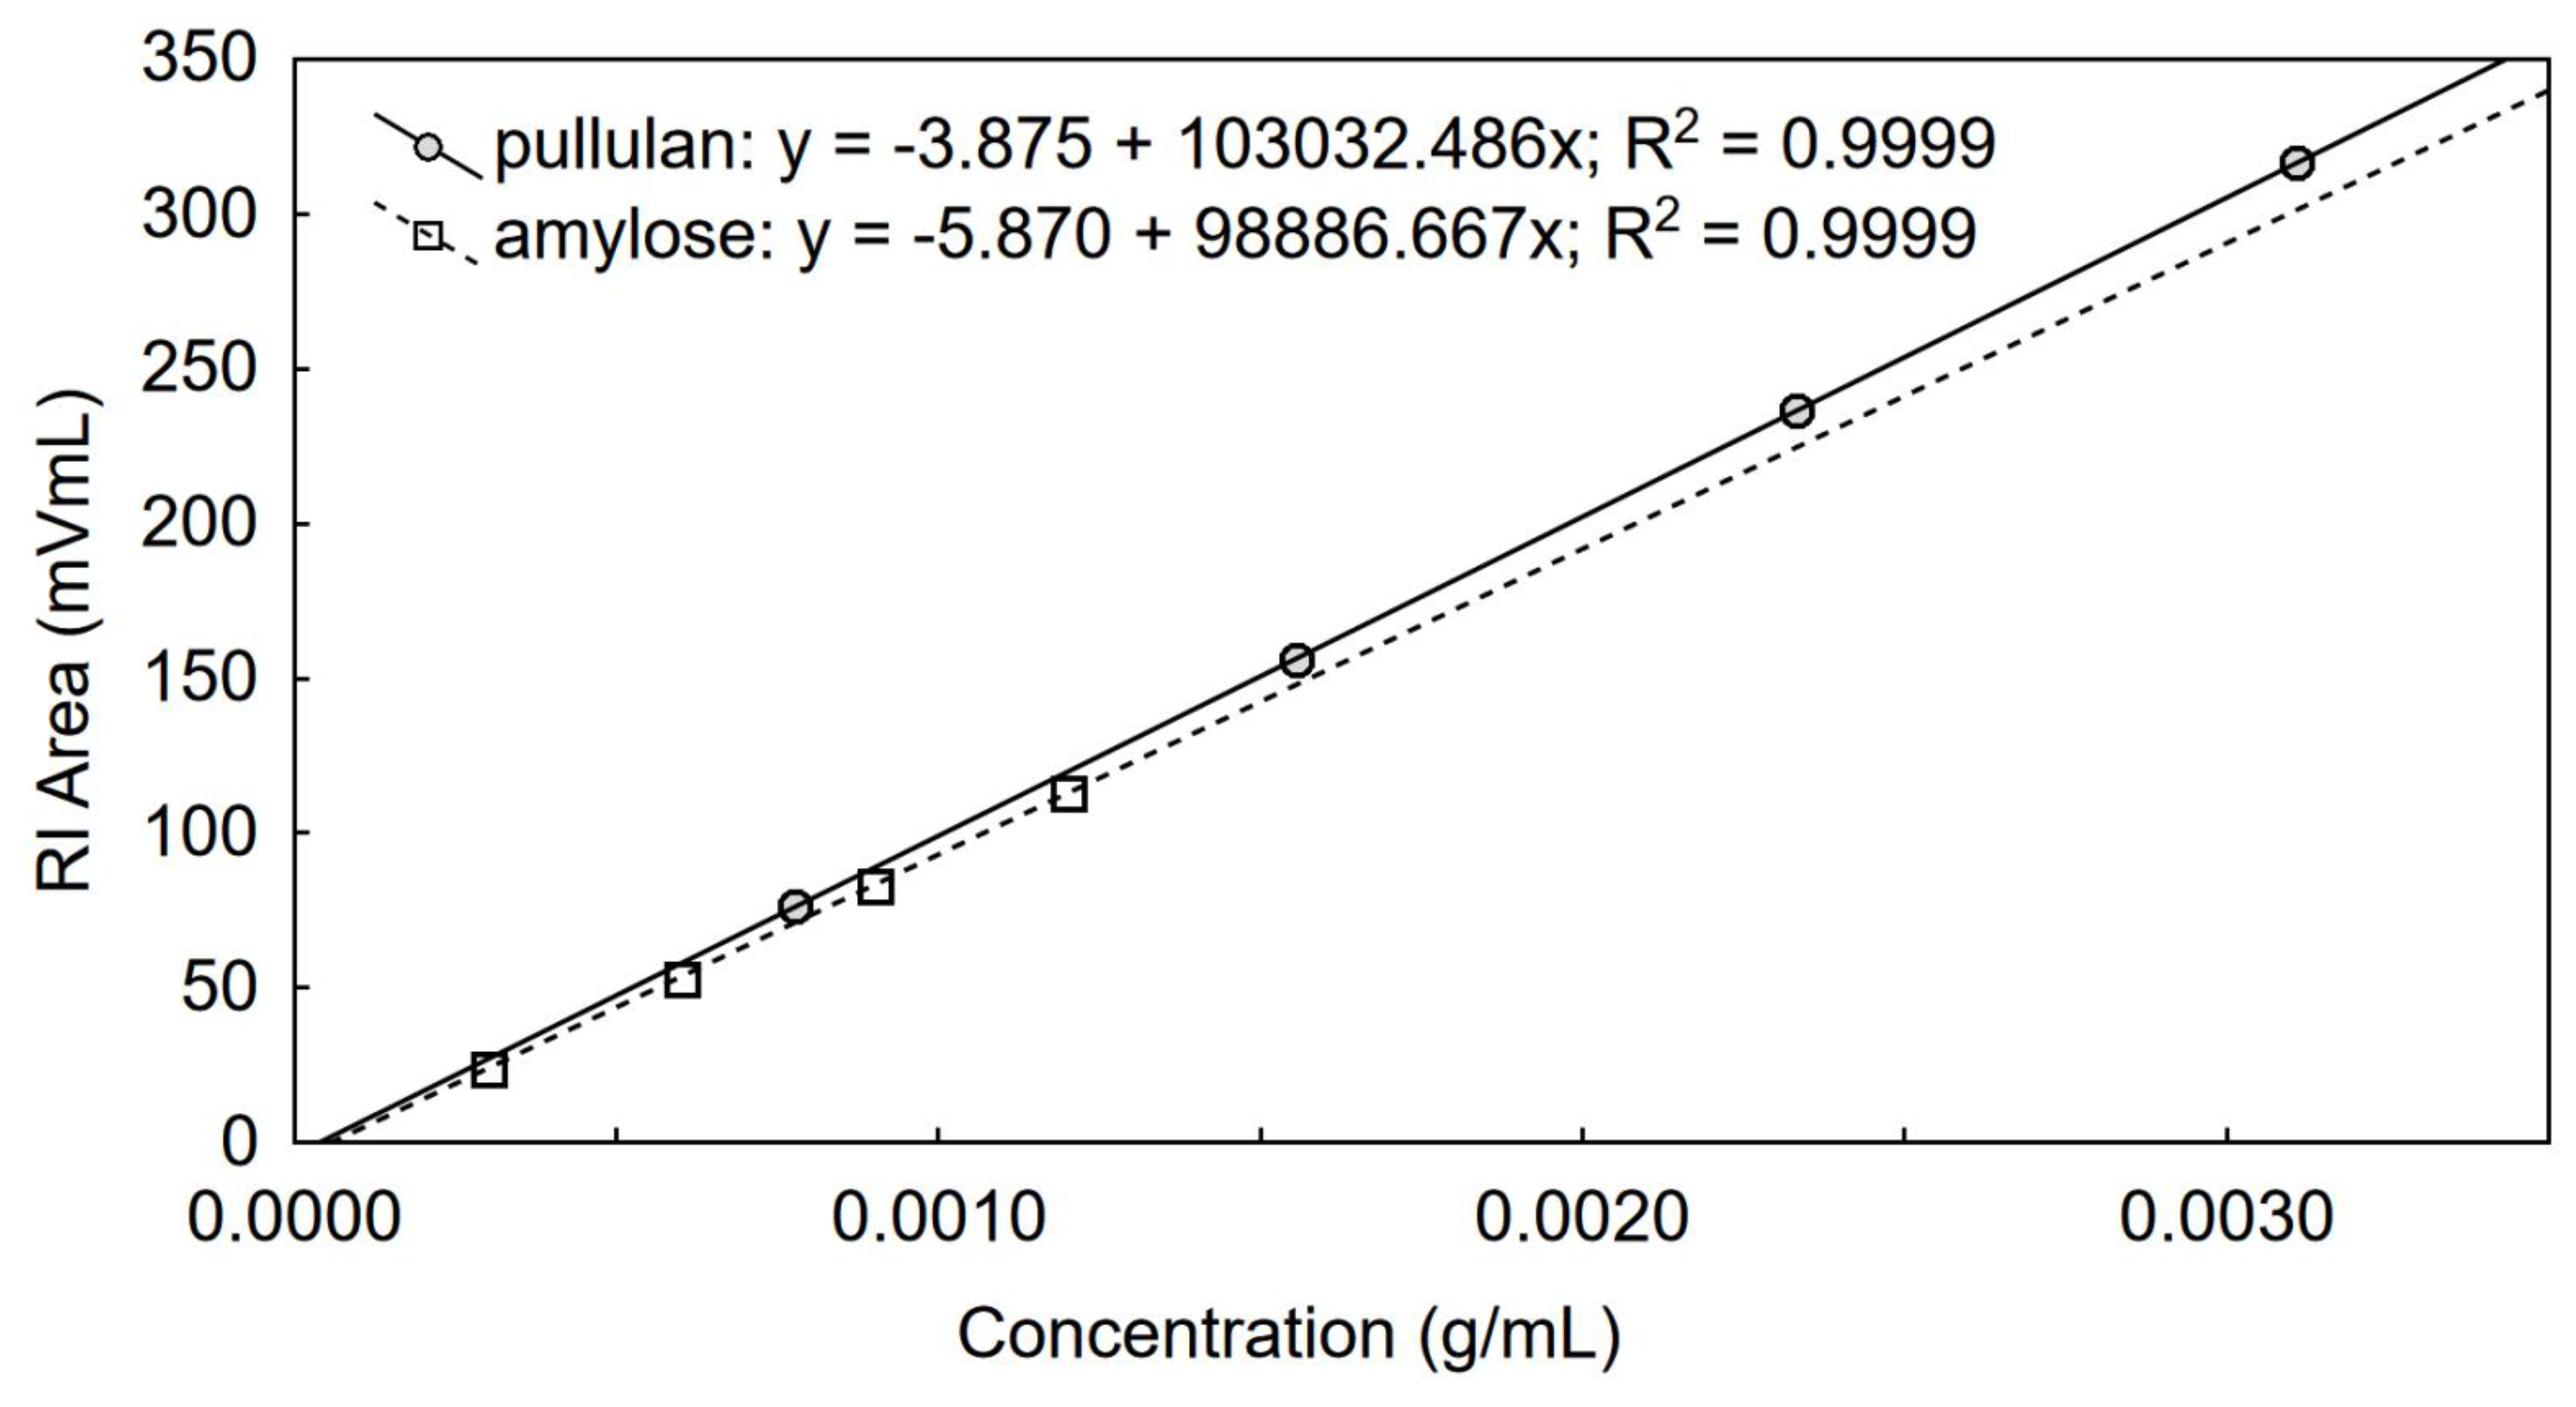
2.2. Determination of Dn/Dc in a New Eluent
2.3. Alkaline Pasting and Dispersion of Starch
2.4. Molecular Characterization Using SEC with Triple Detection
2.5. Calculations, Statistical Analysis
3. Results and Discussion
3.1. Determination of Dn/Dc Using a Calibrated RI Detector
3.2. SEC of Samples Dispersed in NaOH/Urea
3.3. SEC of Samples Dispersed in NaOH or KOH
3.4. Molecular Mass, Size, and Recovery of Starch Samples
4. Discussion
5. Conclusions
Author Contributions
Funding
Conflicts of Interest
References
- Gilet, A.; Quettier, C.; Wiatz, V.; Bricout, H.; Ferreira, M.; Rousseau, C.; Monflier, E.; Tilloy, S. Unconventional media and technologies for starch etherification and esterification. Green Chem. 2018, 20, 1152–1168. [Google Scholar] [CrossRef]
- Ren, F.; Wang, J.; Xie, F.; Zan, K.; Wang, S.; Wang, S. Applications of ionic liquids in starch chemistry: A review. Green Chem. 2020, 22, 2162–2183. [Google Scholar] [CrossRef]
- Przetaczek-Rożnowska, I. Physicochemical properties of starches isolated from pumpkin compared with potato and corn starches. Int. J. Biol. Macromol. 2017, 101, 536–542. [Google Scholar] [CrossRef] [PubMed]
- Tabasum, S.; Younas, M.; Zaeem, M.A.; Majeed, I.; Majeed, M.; Noreen, A.; Iqbal, M.N.; Zia, K.M. A review on blending of corn starch with natural and synthetic polymers, and inorganic nanoparticles with mathematical modeling. Int. J. Biol. Macromol. 2019, 122, 969–996. [Google Scholar] [CrossRef] [PubMed]
- Mendes, J.F.; Paschoalin, R.; Carmona, V.B.; Sena Neto, A.R.; Marques, A.C.P.; Marconcini, J.M.; Mattoso, L.H.C.; Medeiros, E.S.; Oliveira, J.E. Biodegradable polymer blends based on corn starch and thermoplastic chitosan processed by extrusion. Carbohydr. Polym. 2016, 137, 452–458. [Google Scholar] [CrossRef] [PubMed]
- Dupuis, J.H.; Liu, Q. Potato starch: A review of physicochemical, functional and nutritional properties. Am. J. Potato Res. 2019, 96, 127–138. [Google Scholar] [CrossRef]
- Copeland, L.; Blazek, J.; Salman, H.; Tang, M.C. Form and functionality of starch. Food Hydrocoll. 2009, 23, 1527–1534. [Google Scholar] [CrossRef]
- Šárka, E.; Dvořáček, V. Waxy starch as a perspective raw material (A review). Food Hydrocoll. 2017, 69, 402–409. [Google Scholar] [CrossRef]
- Yu, W.; Li, H.; Zou, W.; Tao, K.; Zhu, J.; Gilbert, R.G. Using starch molecular fine structure to understand biosynthesis-structure-property relations. Trends Food Sci. Technol. 2019, 86, 530–536. [Google Scholar] [CrossRef]
- Li, H.; Gidley, M.J.; Dhital, S. High-amylose starches to bridge the “fiber gap”: Development, structure, and nutritional functionality. Compr. Rev. Food Sci. Food Saf. 2019, 18, 362–379. [Google Scholar] [CrossRef]
- Tester, R.F.; Karkalas, J.; Qi, X. Starch—Composition, fine structure and architecture. J. Cereal Sci. 2004, 39, 151–165. [Google Scholar] [CrossRef]
- Pfister, B.; Zeeman, S.C.; Rugen, M.D.; Field, R.A.; Ebenhöh, O.; Raguin, A. Theoretical and experimental approaches to understand the biosynthesis of starch granules in a physiological context. Photosynth. Res. 2020, 145, 55–70. [Google Scholar] [CrossRef]
- Sun, Y.; Wang, M.; Ma, S.; Wang, H. Physicochemical characterization of rice, potato, and pea starches, each with different crystalline pattern, when incorporated with Konjac glucomannan. Food Hydrocoll. 2020, 101, 105499. [Google Scholar] [CrossRef]
- Hebelstrup, K.H.; Nielsen, M.M.; Carciofi, M.; Andrzejczak, O.; Shaik, S.S.; Blennow, A.; Palcic, M.M. Waxy and non-waxy barley cultivars exhibit differences in the targeting and catalytic activity of GBSS1a. J. Exp. Bot. 2017, 68, 931–941. [Google Scholar] [CrossRef] [PubMed]
- Nazarian-Firouzabadi, F.; Visser, R.G.F. Potato starch synthases: Functions and relationships. Biochem. Biophys. Rep. 2017, 10, 7–16. [Google Scholar] [CrossRef]
- Blazek, J.; Copeland, L. Pasting and swelling properties of wheat flour and starch in relation to amylose content. Carbohydr. Polym. 2008, 71, 380–387. [Google Scholar] [CrossRef]
- Schirmer, M.; Höchstötter, A.; Jekle, M.; Arendt, E.; Becker, T. Physicochemical and morphological characterization of different starches with variable amylose/amylopectin ratio. Food Hydrocoll. 2013, 32, 52–63. [Google Scholar] [CrossRef]
- Jane, J.; Atichokudomchai, N.; Park, J.-H.; Suh, D.-S. Effects of amylopectin structure on the organization and properties of starch granules. In Advances in Biopolymers Molecules, Clusters; Fishman, M.L., Qi, P.X., Wicker, L., Eds.; American Chemical Society, Networks and Interactions: Washington, DC, USA, 2006; pp. 146–164. ISBN 9780841239593. [Google Scholar]
- Yoo, S.-H.; Jane, J. Molecular weights and gyration radii of amylopectins determined by high-performance size-exclusion chromatography equipped with multi-angle laser-light scattering and refractive index detectors. Carbohydr. Polym. 2002, 49, 307–314. [Google Scholar] [CrossRef]
- Vamadevan, V.; Bertoft, E. Observations on the impact of amylopectin and amylose structure on the swelling of starch granules. Food Hydrocoll. 2020, 103, 105663. [Google Scholar] [CrossRef]
- Amagliani, L.; O’Regan, J.; Kelly, A.L.; O’Mahony, J.A. Chemistry, structure, functionality and applications of rice starch. J. Cereal Sci. 2016, 70, 291–300. [Google Scholar] [CrossRef]
- Zhang, X.; Shen, Y.; Zhang, N.; Bao, J.; Wu, D.; Shu, X. The effects of internal endosperm lipids on starch properties: Evidence from rice mutant starches. J. Cereal Sci. 2019, 89, 102804. [Google Scholar] [CrossRef]
- Blennow, A.; Bay-Smidt, A.M.; Wischmann, B.; Olsen, C.E.; Møller, B.L. The degree of starch phosphorylation is related to the chain length distribution of the neutral and the phosphorylated chains of amylopectin. Carbohydr. Res. 1998, 307, 45–54. [Google Scholar] [CrossRef]
- Lems, S.; van der Kooi, H.J.; de Swaan Arons, J. The sustainability of resource utilization. Green Chem. 2002, 4, 308–313. [Google Scholar] [CrossRef]
- Fanta, G.F.; Christianson, D.D. Starch—Hydrocolloid composites prepared by steam jet cooking. Food Hydrocoll. 1996, 10, 173–178. [Google Scholar] [CrossRef]
- Debet, M.R.; Gidley, M.J. Why do gelatinized starch granules not dissolve completely? Roles for amylose, protein, and lipid in granule “ghost” integrity. J. Agric. Food Chem. 2007, 55, 4752–4760. [Google Scholar] [CrossRef] [PubMed]
- Zdanowicz, M.; Spychaj, T.; Mąka, H. Imidazole-based deep eutectic solvents for starch dissolution and plasticization. Carbohydr. Polym. 2016, 140, 416–423. [Google Scholar] [CrossRef]
- Brust, H.; Orzechowski, S.; Fettke, J. Starch and glycogen analyses: Methods and techniques. Biomolecules 2020, 10, 1020. [Google Scholar] [CrossRef]
- Lin, M.; Shang, X.; Liu, P.; Xie, F.; Chen, X.; Sun, Y.; Wan, J. Zinc chloride aqueous solution as a solvent for starch. Carbohydr. Polym. 2016, 136, 266–273. [Google Scholar] [CrossRef]
- Koganti, N.; Mitchell, J.R.; Ibbett, R.N.; Foster, T.J. Solvent effects on starch dissolution and gelatinization. Biomacromolecules 2011, 12, 2888–2893. [Google Scholar] [CrossRef]
- Hu, J.; Cheng, F.; Lin, Y.; Zhao, K.; Zhu, P. Dissolution of starch in urea/NaOH aqueous solutions. J. Appl. Polym. Sci. 2016, 133. [Google Scholar] [CrossRef]
- Chen, H.; Chen, L.; Dang, X.; Shan, Z.; Dai, R.; Wang, Y. The structure and properties of granular cold-water-soluble starch by a NaOH/urea aqueous solution. Int. J. Biol. Macromol. 2019, 141, 732–737. [Google Scholar] [CrossRef]
- Gilbert, R.G.; Gldley, M.J.; Hill, S.; Kilz, P.; Rolland-Sabaté, A.; Stevenson, D.G.; Cave, R.A. Characterizing the size and molecular weight distribution of starch: Why it is important and why it is hard. Cereal Foods World 2010, 55, 139–143. [Google Scholar] [CrossRef]
- Han, J.-A.; Lim, S.-T. Structural changes of corn starches by heating and stirring in DMSO measured by SEC-MALLS-RI system. Carbohydr. Polym. 2004, 55, 265–272. [Google Scholar] [CrossRef]
- Gidley, M.J.; Hanashiro, I.; Hani, N.M.; Hill, S.E.; Huber, A.; Jane, J.-L.; Liu, Q.; Morris, G.A.; Rolland-Sabaté, A.; Striegel, A.M.; et al. Reliable measurements of the size distributions of starch molecules in solution: Current dilemmas and recommendations. Carbohydr. Polym. 2010, 79, 255–261. [Google Scholar] [CrossRef]
- Striegel, A.M. Size-exclusion chromatography. Liq. Chromatogr. 2017, 245–273. [Google Scholar] [CrossRef]
- Yokoyama, W.; Renner-Nantz, J.J.; Shoemaker, C.F. Starch molecular mass and size by size-exclusion chromatography in DMSO-LiBr coupled with multiple angle laser light scattering. Cereal Chem. 1998, 75, 530–535. [Google Scholar] [CrossRef]
- Szwengiel, A.; Lewandowicz, G.; Nowak, J. Advantages and disadvantages of the use of aqueous and organic GPC columns for the separation of starch macromolecules. In Proceedings of the 12th International Conference on Polysaccharides-Glycoscience 2016, Prague, Czech, 19–21 October 2016; pp. 71–76. [Google Scholar]
- Peres, G.L.; Leite, D.C.; Silveira, N.P. da Ultrasound effect on molecular weight reduction of amylopectin. Starch Stärke 2015, 67, 407–414. [Google Scholar] [CrossRef]
- Zhang, P.; Zhang, L.; Cheng, S. Effects of urea and sodium hydroxide on the molecular weight and conformation of α-(1→3)-d-glucan from Lentinusedodes in aqueous solution. Carbohydr. Res. 2000, 327, 431–438. [Google Scholar] [CrossRef]
- Hebeish, A.; El-Thalouth, I.A.; Kashouti, M. El Gelatinization of rice starch in aqueous urea solutions. Starch Stärke 1981, 33, 84–90. [Google Scholar] [CrossRef]
- Wang, J.; Cheng, F.; Zhu, P. Structure and properties of urea-plasticized starch films with different urea contents. Carbohydr. Polym. 2014, 101, 1109–1115. [Google Scholar] [CrossRef]
- Ragheb, A.A.; Abdel-Thalouth, I.; Tawfik, S. Gelatinization of starch in aqueous alkaline solutions. Starch Stärke 1995, 47, 338–345. [Google Scholar] [CrossRef]
- Behrens, M.A.; Holdaway, J.A.; Nosrati, P.; Olsson, U. On the dissolution state of cellulose in aqueous tetrabutylammonium hydroxide solutions. RSC Adv. 2016, 6, 30199–30204. [Google Scholar] [CrossRef]
- Dou, H.; Zhou, B.; Jang, H.-D.; Lee, S. Study on antidiabetic activity of wheat and barley starch using asymmetrical flow field-flow fractionation coupled with multiangle light scattering. J. Chromatogr. A 2014, 1340, 115–120. [Google Scholar] [CrossRef]
- Ulbrich, M.; Schwurack, B.; Flöter, E. Alkaline dissolution of native potato starch—Impact of the preparation conditions on the solution properties determined by means of SEC-MALS. Starch Stärke 2017, 69, 1600256. [Google Scholar] [CrossRef]
- Naguleswaran, S.; Vasanthan, T.; Hoover, R.; Chen, L.; Bressler, D. Molecular characterisation of waxy corn and barley starches in different solvent systems as revealed by MALLS. Food Chem. 2014, 152, 297–299. [Google Scholar] [CrossRef]
- Huang, S.; Han, L.; Ma, H.; Lei, L.; Zhang, R.; Shen, H.; Yang, L.; Li, C.; Zhang, S.; Li, Y. Determination of refractive index increment of synthetic polybutadienes and microstructural control of grafting density and liquid crystalline properties. Polym. Chem. 2020, 11, 2559–2567. [Google Scholar] [CrossRef]
- Striegel, A.M. Specific refractive index increment (∂n/∂c) of polymers at 660 nm and 690 nm. Chromatographia 2017, 80, 989–996. [Google Scholar] [CrossRef]
- Striegel, A.M. Viscometric detection in size-exclusion chromatography: Principles and select applications. Chromatographia 2016, 1–16. [Google Scholar] [CrossRef]
- Rudin, A.; Choi, P. Chapter 3—Practical aspects of molecular weight measurements. In The Elements of Polymer Science & Engineering, 3rd ed.; Rudin, A., Choi, P., Eds.; Academic Press: Boston, MA, USA, 2013; pp. 89–148. ISBN 978-0-12-382178-2. [Google Scholar]
- Kim, C.; Deratani, A.; Bonfils, F. Determination of the refractive index increment of natural and synthetic poly( cis -1,4-isoprene) solutions and its effect on structural parameters. J. Liq. Chromatogr. Relat. Technol. 2009, 33, 37–45. [Google Scholar] [CrossRef]
- Szwengiel, A.; Lewandowicz, G.; Górecki, A.R.; Błaszczak, W. The effect of high hydrostatic pressure treatment on the molecular structure of starches with different amylose content. Food Chem. 2018, 240, 51–58. [Google Scholar] [CrossRef]
- Cave, R.A.; Seabrook, S.A.; Gidley, M.J.; Gilbert, R.G. Characterization of starch by size-exclusion chromatography: The limitations imposed by shear scission. Biomacromolecules 2009, 10, 2245–2253. [Google Scholar] [CrossRef] [PubMed]
- Ptaszek, A.; Ptaszek, P.; Dziubiński, M.; Grzesik, N.M.; Liszka-Skoczylas, M. The effect of structural properties on rheological behaviour of starches in binary dimethyl sulfoxide-water solutions. PLoS ONE 2017, 12, e0171109. [Google Scholar] [CrossRef] [PubMed]
- Kitamura, S.; Yoneda, S.; Kuge, T. Study on the retrogradation of starch. I. Particle size and its distribution of amylose retrograded from aqueous solutions. Carbohydr. Polym. 1984, 4, 127–136. [Google Scholar] [CrossRef]
- Cheetham, N.W.H.; Tao, L. Amylose conformational transitions in binary DMSO/water mixtures. Carbohydr. Polym. 1998, 35, 287–295. [Google Scholar] [CrossRef]
- Ma, Z.; Zhao, S.; Cheng, K.; Zhang, X.; Xu, X.; Zhang, L. Molecular weight and chain conformation of amylopectin from rice starch. J. Appl. Polym. Sci. 2007, 104, 3124–3128. [Google Scholar] [CrossRef]
- Bello-Pérez, L.A.; Roger, P.; Baud, B.; Colonna, P. Macromolecular features of starches determined by aqueous high-performance size exclusion chromatography. J. Cereal Sci. 1998, 27, 267–278. [Google Scholar] [CrossRef]
- Fang, F.; Luo, X.; Fei, X.; Mathews, M.A.A.; Lim, J.; Hamaker, B.R.; Campanella, O.H. Stored gelatinized waxy potato starch forms a strong retrograded gel at low ph with the formation of intermolecular double helices. J. Agric. Food Chem. 2020, 68, 4036–4041. [Google Scholar] [CrossRef]
- Kalb, A.J.; Sterling, C. Role of hydrogen ion concentration in retrogradation of starch sols. J. Appl. Polym. Sci. 1962, 6, 571–574. [Google Scholar] [CrossRef]
- Kuge, T.; Kobayashi, K.; Tanahashi, H.; Igushi, T.; Kitamura, S. Gel permeation chromatography of polysaccharides: Universal calibration curve. Agric. Biol. Chem. 1984, 48, 2375–2376. [Google Scholar] [CrossRef]
- You, S.; Lim, S.-T. Molecular characterization of corn starch using an aqueous HPSEC-MALLS-RI System under various dissolution and analytical conditions. Cereal Chem. 2000, 77, 303–308. [Google Scholar] [CrossRef]


| Standard | Mn1 (Da) | Mw1 (Da) | Mw Expected 2 (Da) | Mw Error 2 (%) | IV 3 (dL/g) | Rη4 (nm) | Rg5 (nm) | Recovery (%) |
|---|---|---|---|---|---|---|---|---|
| P5 | 5.79 × 10³ (1.8) | 6.15 × 10³ (1.1) | 6.00 × 10³ | 2.5 | 0.07 (0.4) | 2 (1.0) | n/c | 99.4 (0.3) |
| P10 | 9.86 × 10³ (0.92) | 1.03 × 10⁴ (0.46) | 1.00 × 10⁴ | 3.3 | 0.10 (12.2) | 3 (5.5) | n/c | 101.3 (0.1) |
| P20 | 2.14 × 10⁴ (0.95) | 2.17 × 10⁴ (1.11) | 2.17 × 10⁴ | 0.2 | 0.15 (0.9) | 4 (2.5) | n/c | 99.9 (1.1) |
| P50 | 4.67 × 10⁴ (1.64) | 4.94 × 10⁴ (1.34) | 4.88 × 10⁴ | 1.2 | 0.27 (0.0) | 6 (0.7) | n/c | 101.0 (0.8) |
| P200 | 1.95 × 10⁵ (2.54) | 2.19 × 10⁵ (1.23) | 2.10 × 10⁵ | 4.4 | 0.58 (4.6) | 13 (1.1) | n/c | 103.2 (1.2) |
| P400 | 3.44 × 10⁵ (0.94) | 3.68 × 10⁵ (1.08) | 3.66 × 10⁵ | 0.6 | 1.01 (10.1) | 18 (5.1) | 27 (5.2) | 99.7 (1.2) |
| P800 | 7.18 × 10⁵ (2.73) | 8.08 × 10⁵ (1.23) | 8.05 × 10⁵ | 0.3 | 1.66 (5.8) | 28 (2.3) | 40 (6.4) | 100.0 (1.9) |
| P1300 | 1.18 × 10⁶ (3.91) | 1.35 × 10⁶ (2.25) | 1.33 × 10⁶ | 1.6 | 2.47 (2.8) | 37 (3.6) | 54 (4.4) | 97.8 (1.3) |
| P2500 | 1.78 × 10⁶ (10.35) | 2.46 × 10⁶ (2.33) | 2.56 × 10⁶ | 3.8 | 3.45 (10.8) | 47 (3.9) | 73 (4.6) | 97.6 (0.3) |
| Starch Origin | Dispersion | Mn1 (Da) | Mw1 (Da) | Mw/Mn1 | Rg1 (nm) | Recovery 1 (%) |
|---|---|---|---|---|---|---|
| corn | urea/NaOH | 7.85 × 10⁶ a (3.6) | 2.13 × 10⁷ b (7.4) | 2.7 b (3.8) | 122 b (11.3) | 39.0 b (8.9) |
| waxy corn | urea/NaOH | 4.11 × 10⁷ c (5.9) | 5.27 × 10⁷ e (2.1) | 1.3 a (8.0) | 124 b (2.1) | 28.3 a (8.9) |
| potato | urea/NaOH | 7.30 × 10⁷ d (2.2) | 9.16 × 10⁷ f (2.3) | 1.3 a (0.1) | 185 c (1.2) | 42.2 b (5.8) |
| waxy potato | urea/NaOH | 2.54 × 10⁸ e (3.0) | 2.94 × 10⁸ g (0.5) | 1.2 a (2.6) | 252 d (7.5) | 21.2 a (8.0) |
| potato amylose | urea/NaOH | 3.91 × 10⁵ a (3.2) | 1.37 × 10⁶ a (1.9) | 3.5 c (1.3) | 62 a (12.3) | 99.8 d (1.5) |
| corn | 0.5 M NaOH | 2.57 × 10⁷ b (6.2) | 3.09 × 10⁷ c,d (5.1) | 1.2 a (1.1) | 113 b (10.2) | 38.9 b (2.1) |
| corn | 1.0 M NaOH | 2.93 × 10⁷ b,c (4.8) | 3.45 × 10⁷ d (4.6) | 1.2 a (0.2) | 120 b (4.7) | 45.2 b (4.0) |
| corn | 2.0 M KOH | 2.37 × 10⁷ b (2.8) | 2.89 × 10⁷ c (1.2) | 1.2 a (1.7) | 110 b (6.6) | 57.5 c (3.7) |
© 2020 by the authors. Licensee MDPI, Basel, Switzerland. This article is an open access article distributed under the terms and conditions of the Creative Commons Attribution (CC BY) license (http://creativecommons.org/licenses/by/4.0/).
Share and Cite
Szwengiel, A.; Kubiak, P. Molecular Dispersion of Starch as a Crucial Parameter during Size-Exclusion Chromatography. Foods 2020, 9, 1204. https://doi.org/10.3390/foods9091204
Szwengiel A, Kubiak P. Molecular Dispersion of Starch as a Crucial Parameter during Size-Exclusion Chromatography. Foods. 2020; 9(9):1204. https://doi.org/10.3390/foods9091204
Chicago/Turabian StyleSzwengiel, Artur, and Piotr Kubiak. 2020. "Molecular Dispersion of Starch as a Crucial Parameter during Size-Exclusion Chromatography" Foods 9, no. 9: 1204. https://doi.org/10.3390/foods9091204
APA StyleSzwengiel, A., & Kubiak, P. (2020). Molecular Dispersion of Starch as a Crucial Parameter during Size-Exclusion Chromatography. Foods, 9(9), 1204. https://doi.org/10.3390/foods9091204