Development of Dynamic Model for Real-Time Monitoring of Ripening Changes of Kimchi during Distribution


Abstract
1. Introduction
2. Materials and methods
2.1. Sample Preparation
2.2. Quality Characteristics for Kimchi Ripening Index
2.2.1. PH and Acidity
2.2.2. Hunter Color
2.2.3. Texture
2.2.4. Microbiological Analysis
2.2.5. Sensory Analysis
2.2.6. Statistical Analysis
2.3. Model Development
2.3.1. Primary Model
2.3.2. Secondary Model
2.3.3. Dynamic Model Using Mean Kinetic Temperature (MKT) in Fluctuating-Temperature Environments
2.3.4. Comparison between Observations and Predictions
3. Results
3.1. Changes in Quality Characteristics during Storage of Kimchi
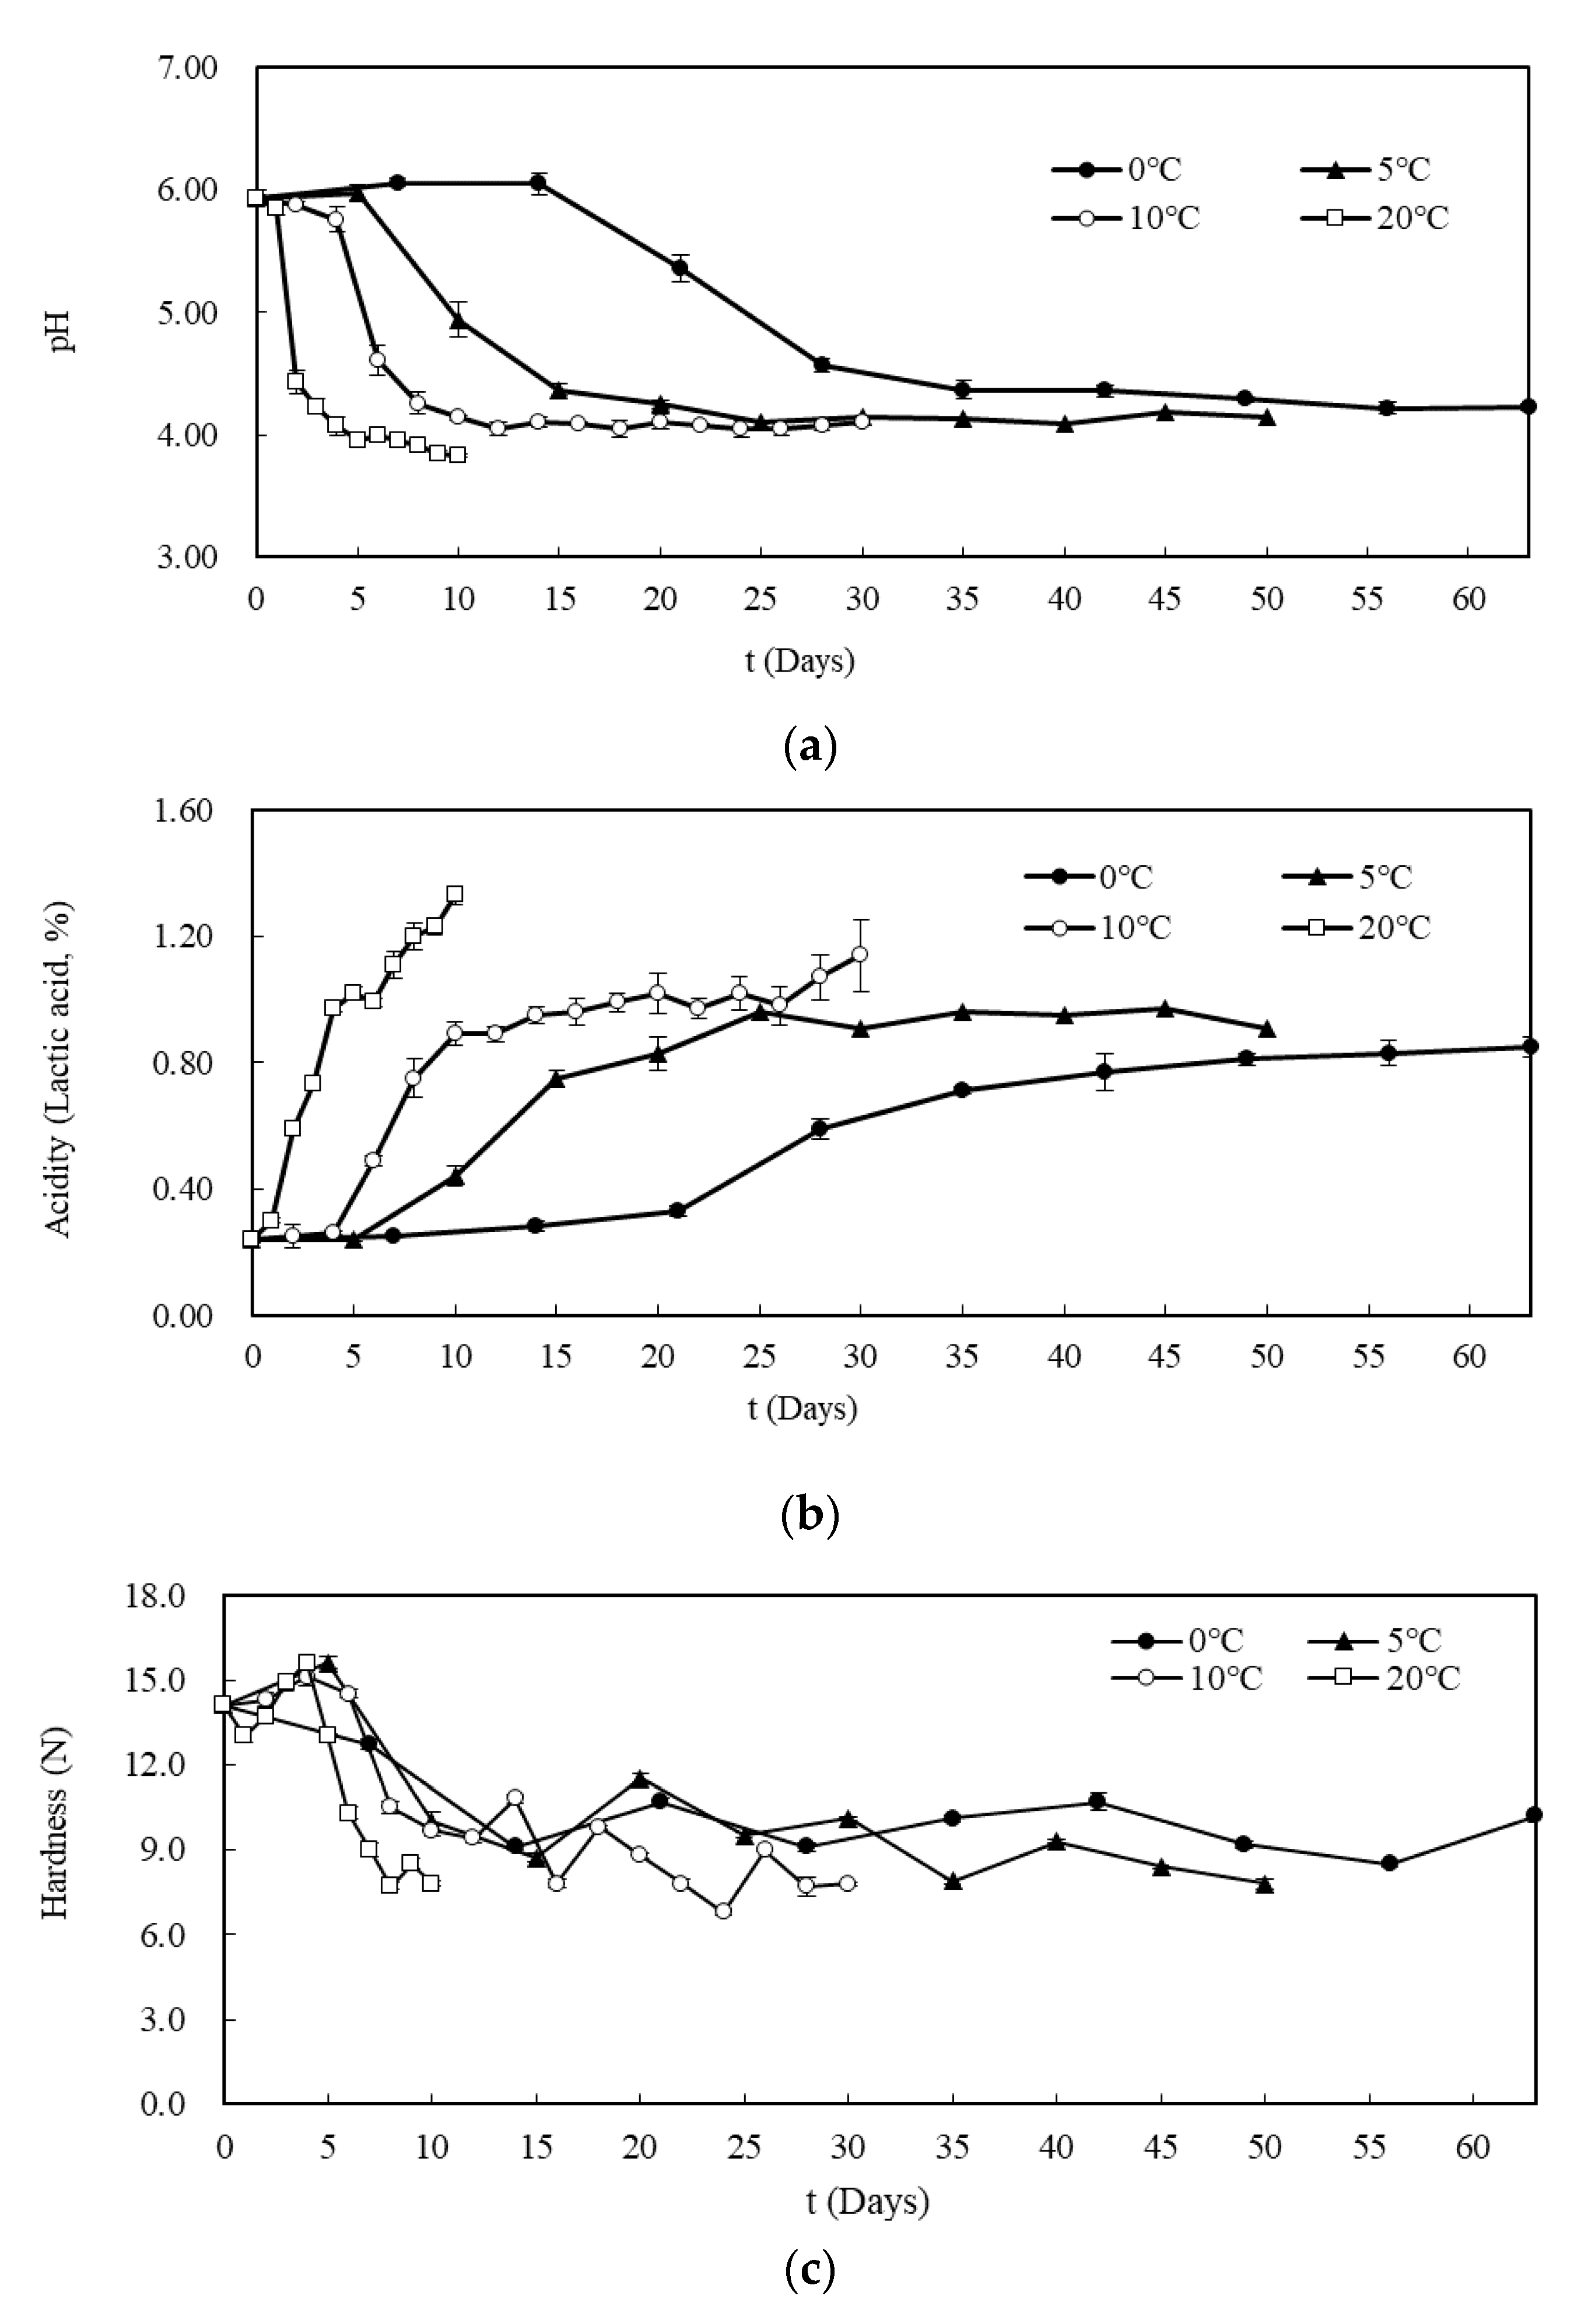
3.1.1. PH and Acidity
3.1.2. Texture
3.1.3. Hunter Color
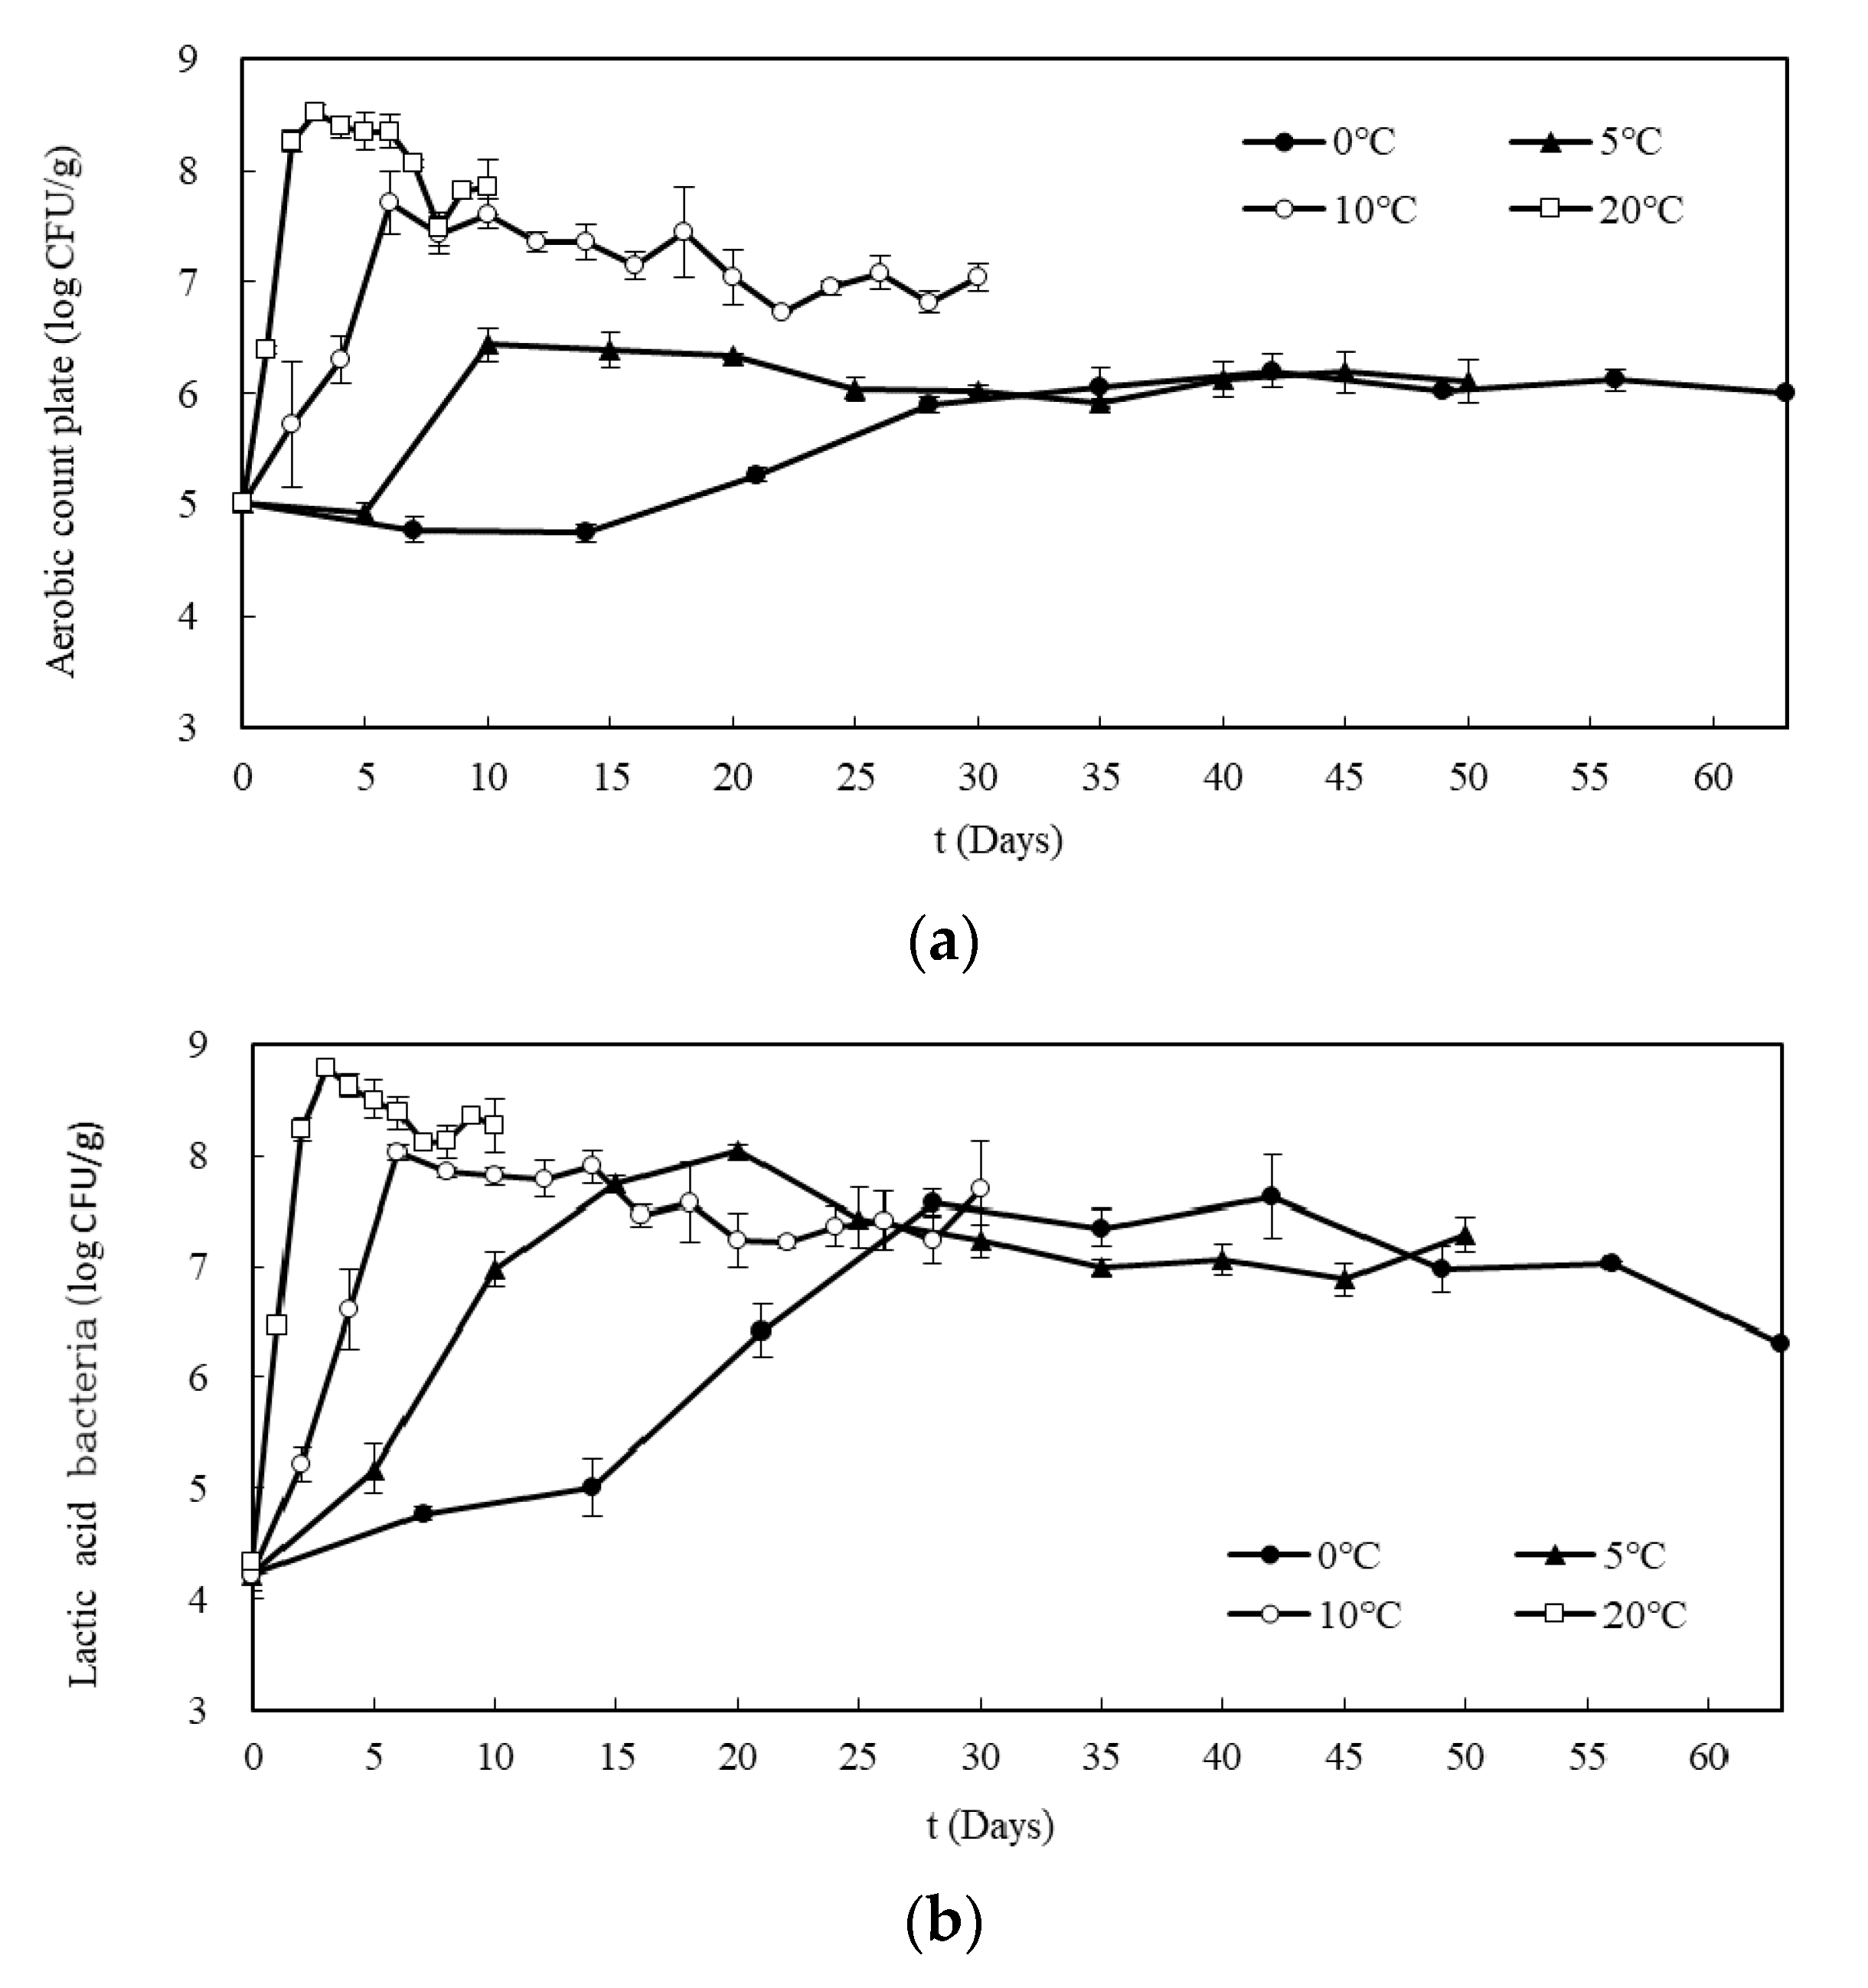
3.1.4. Microbiological Analysis
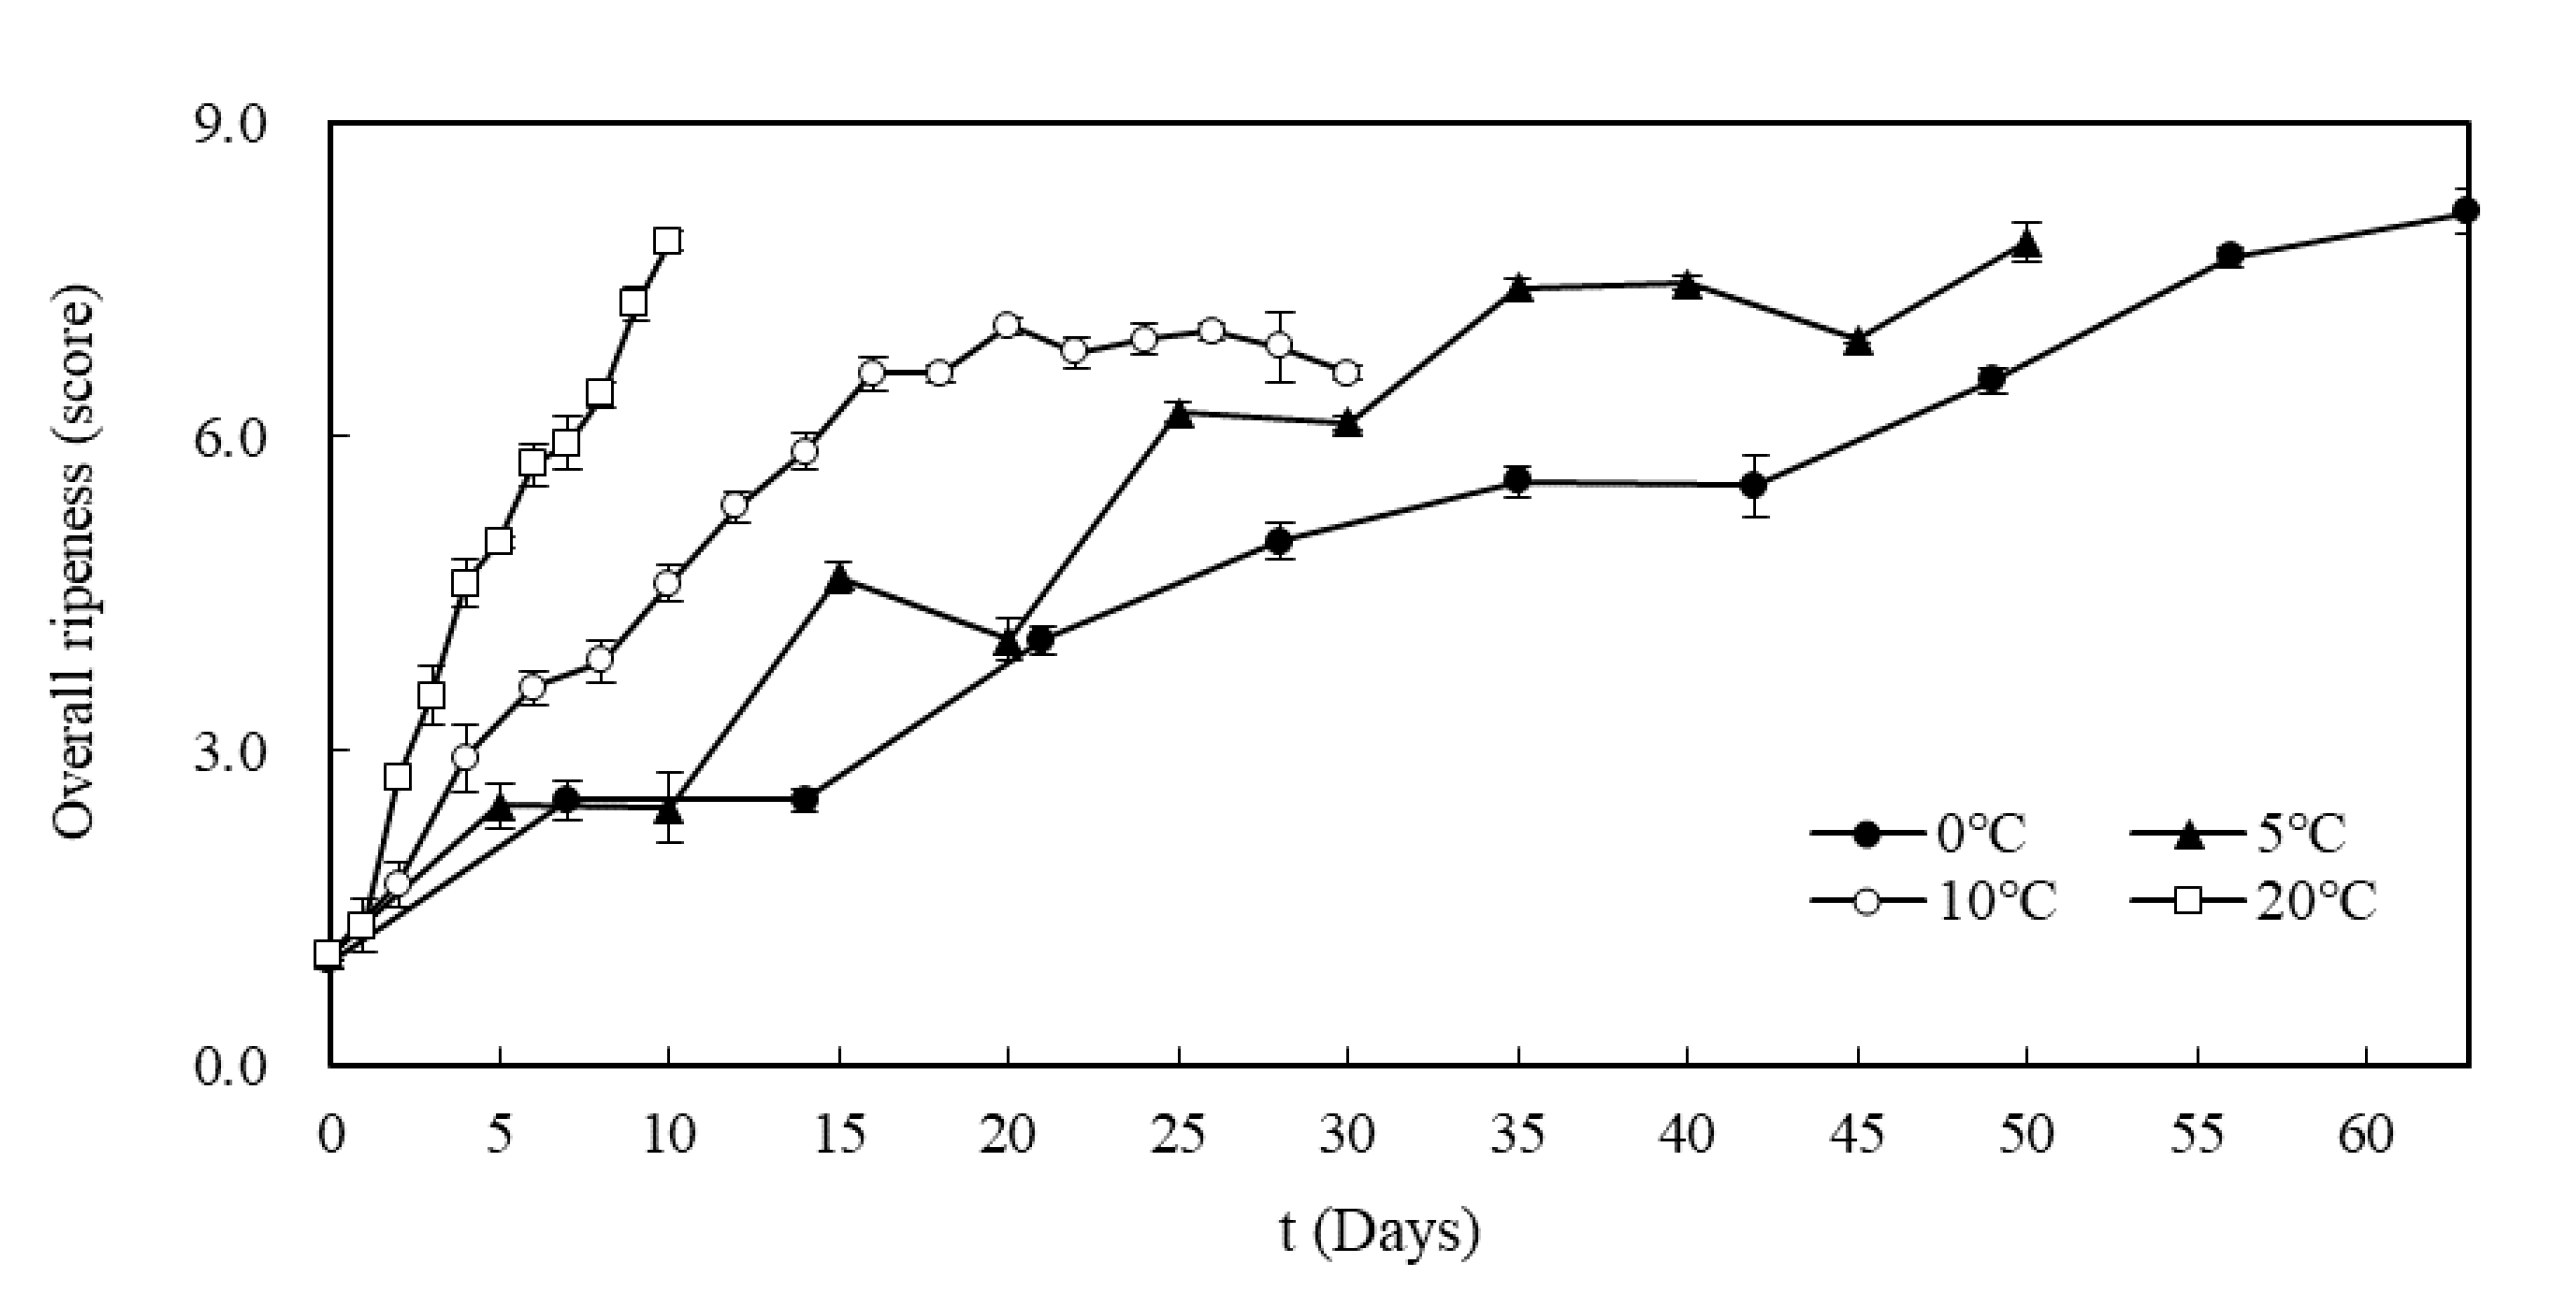
3.1.5. Sensory Evaluation
3.2. Selection of Ripening Index of Kimchi
3.3. Model Development
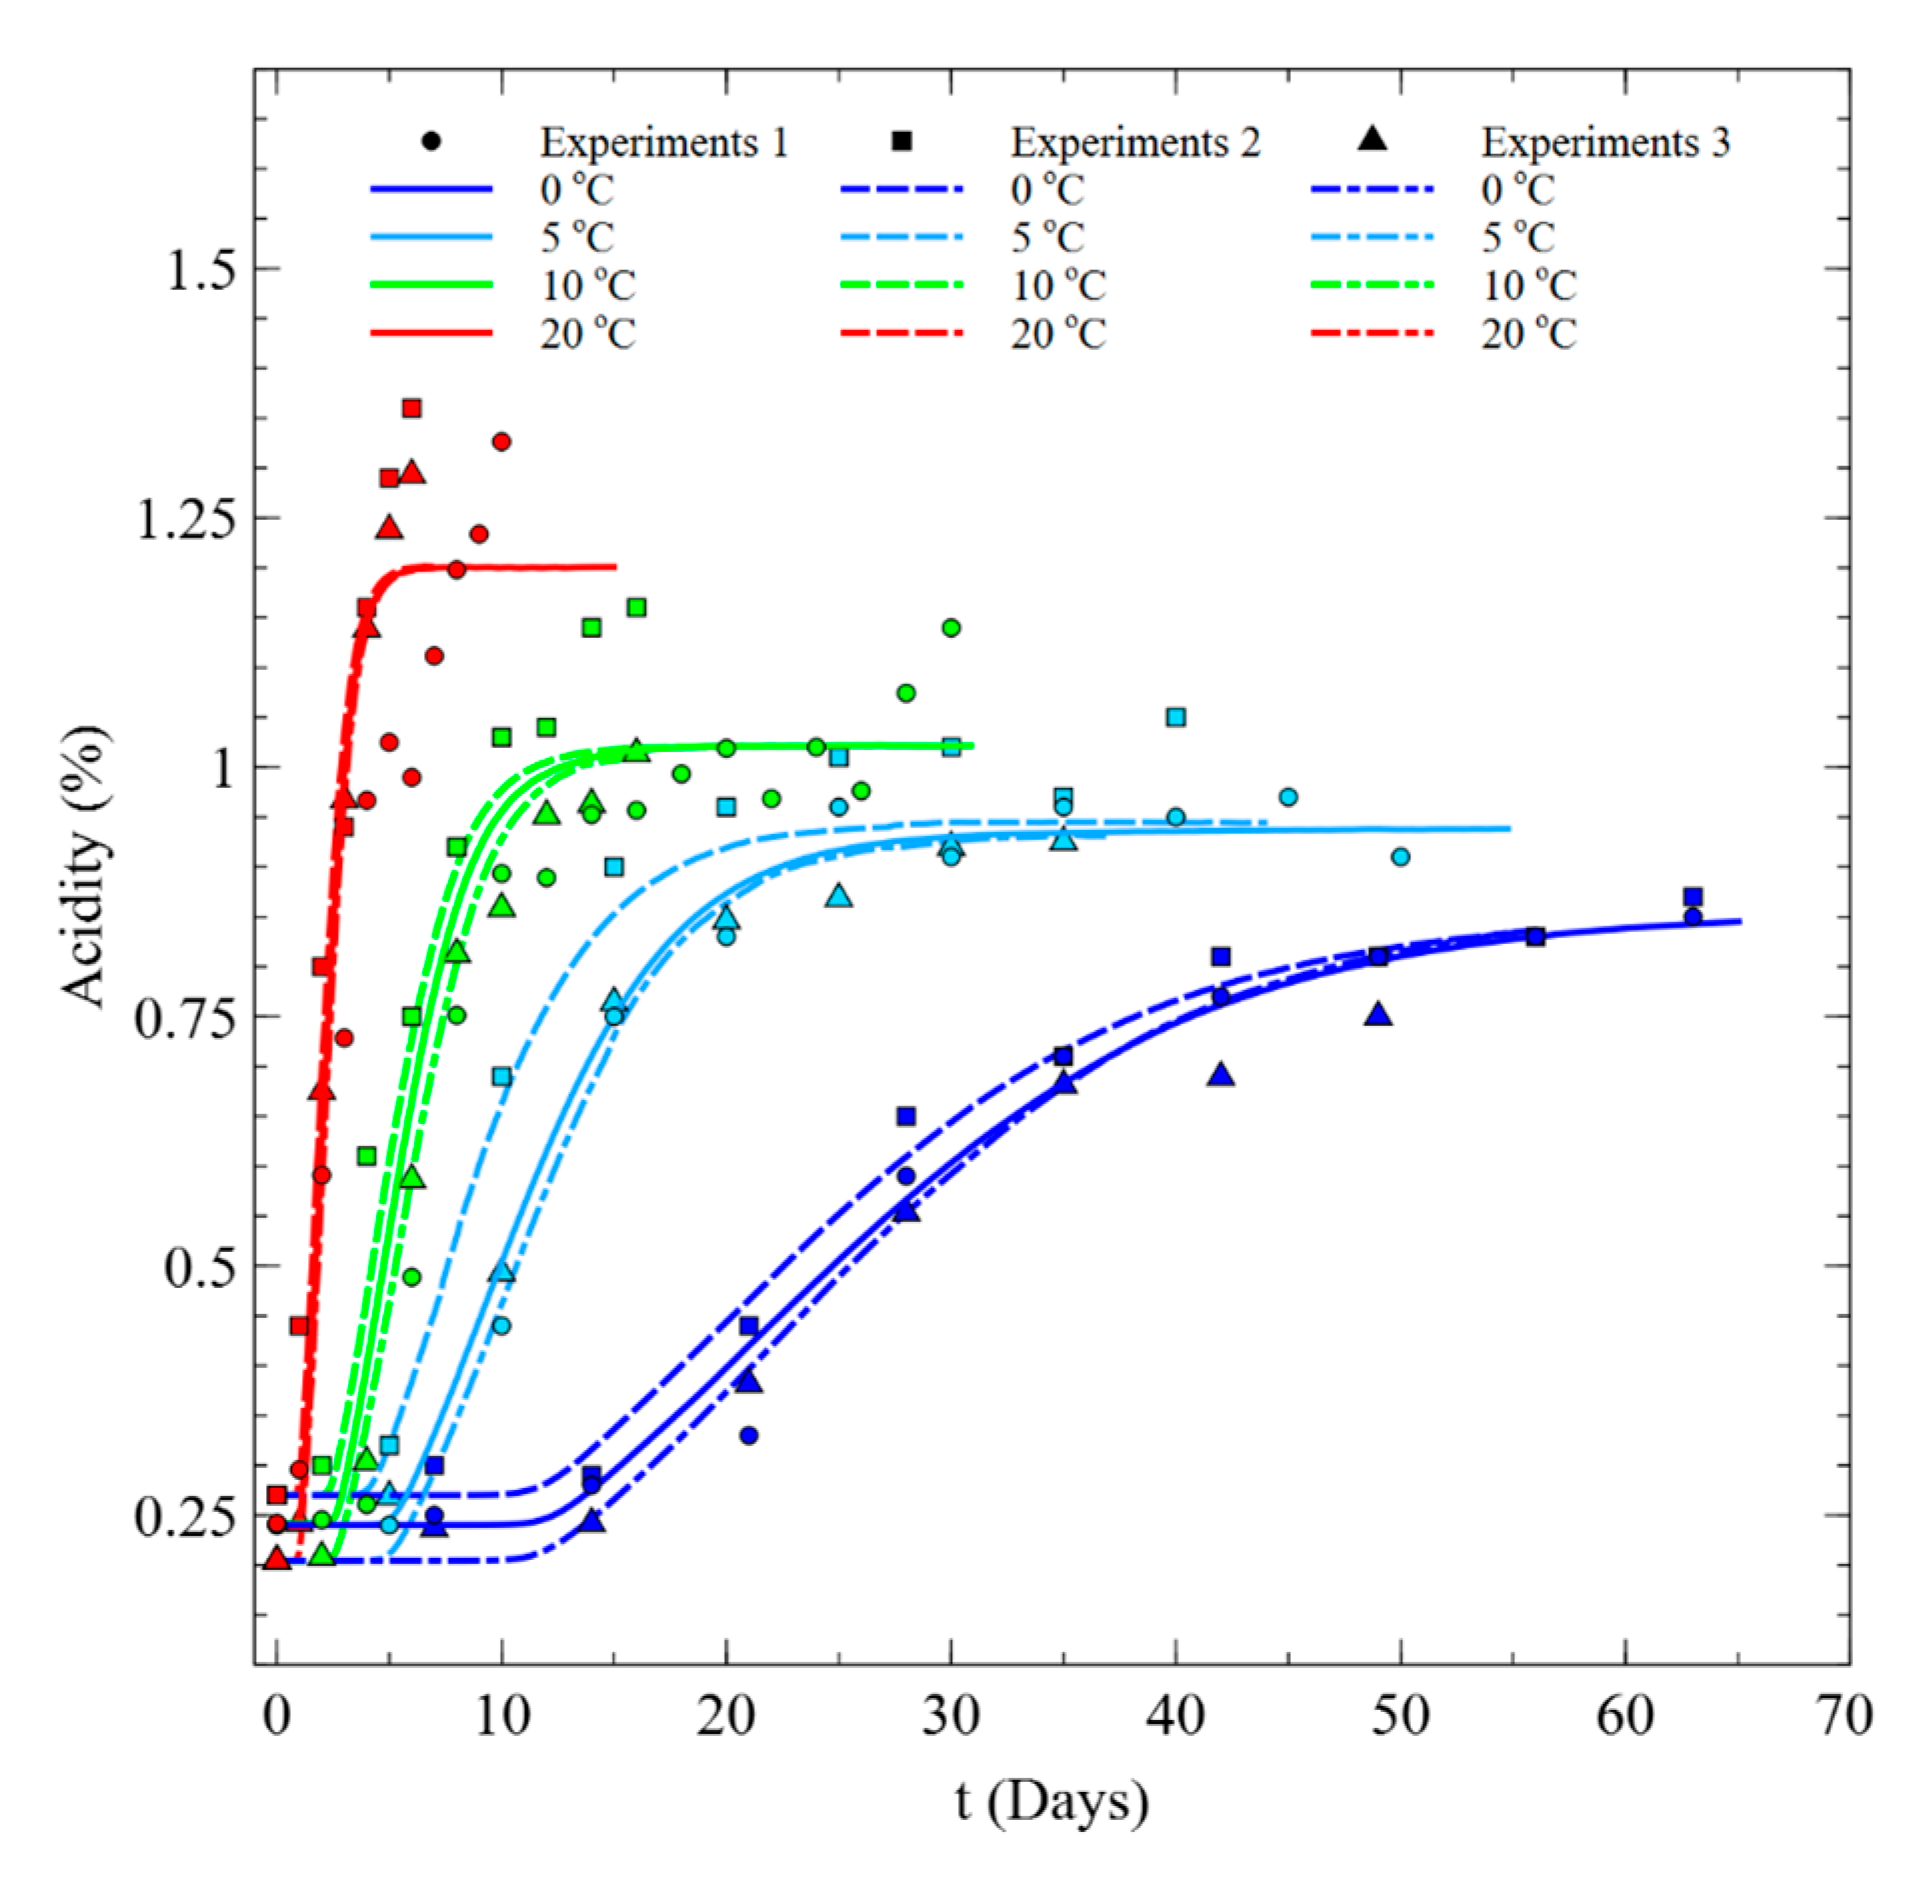
3.3.1. Kinetic Model
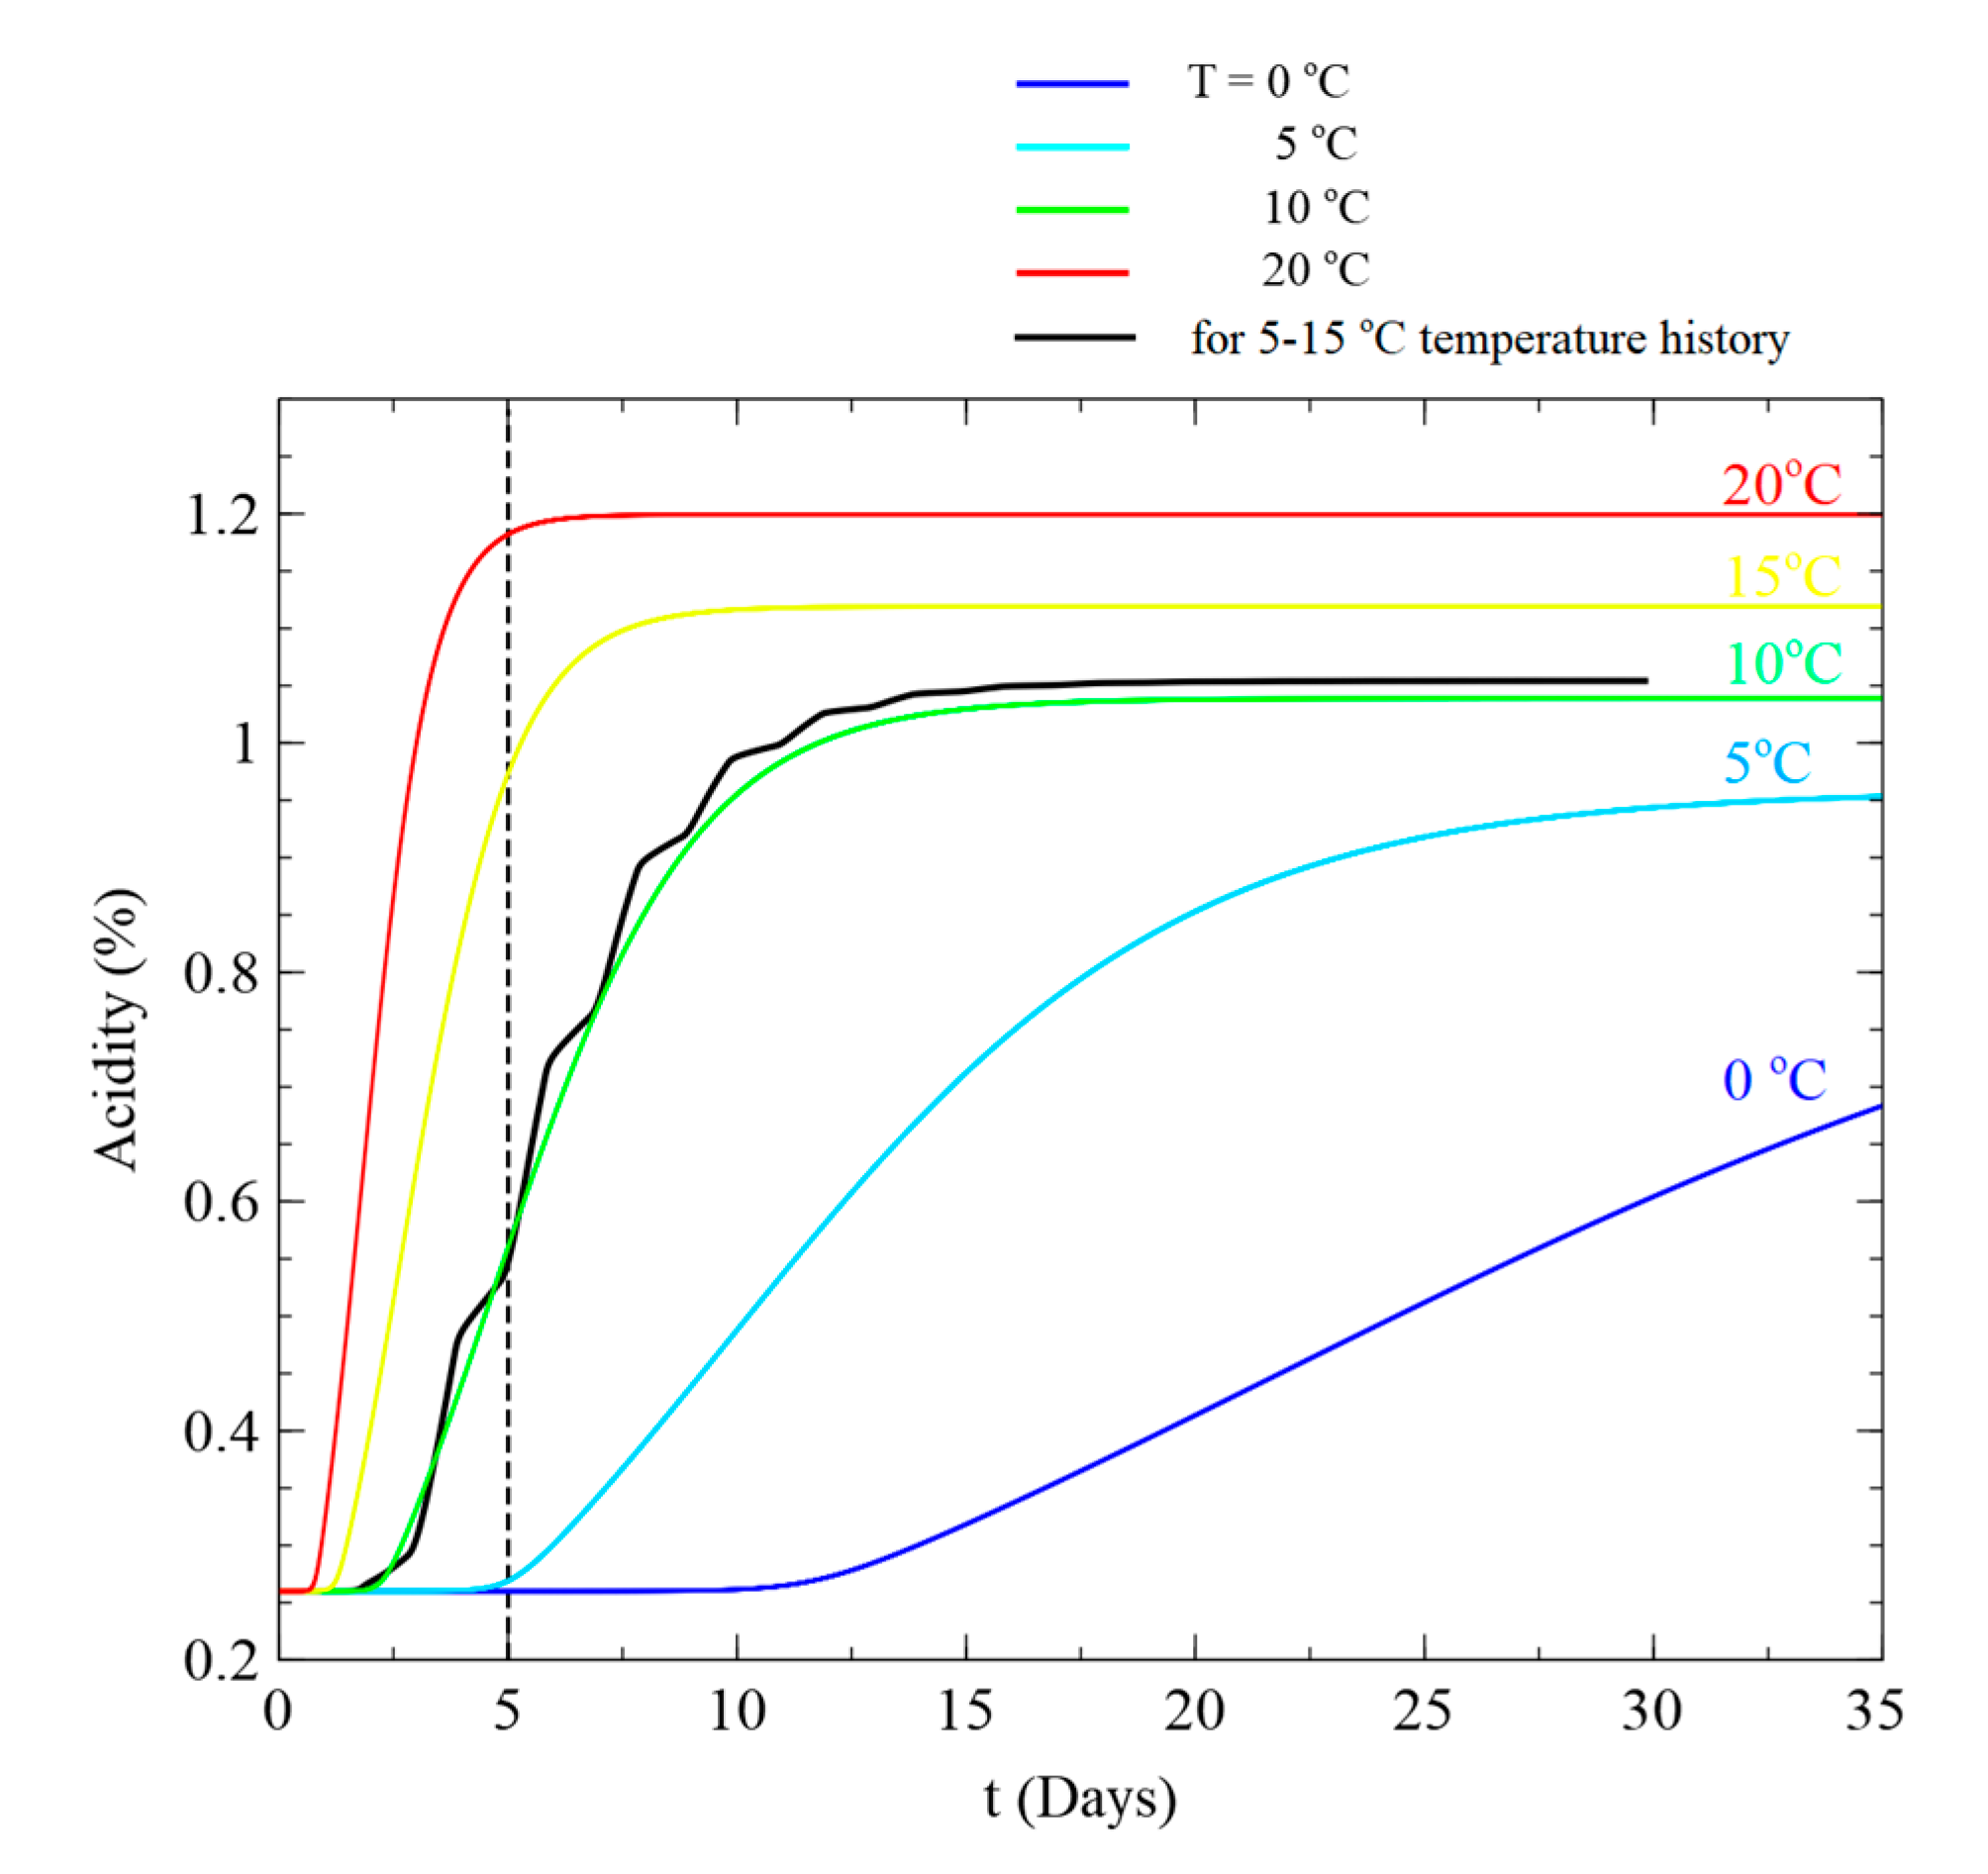
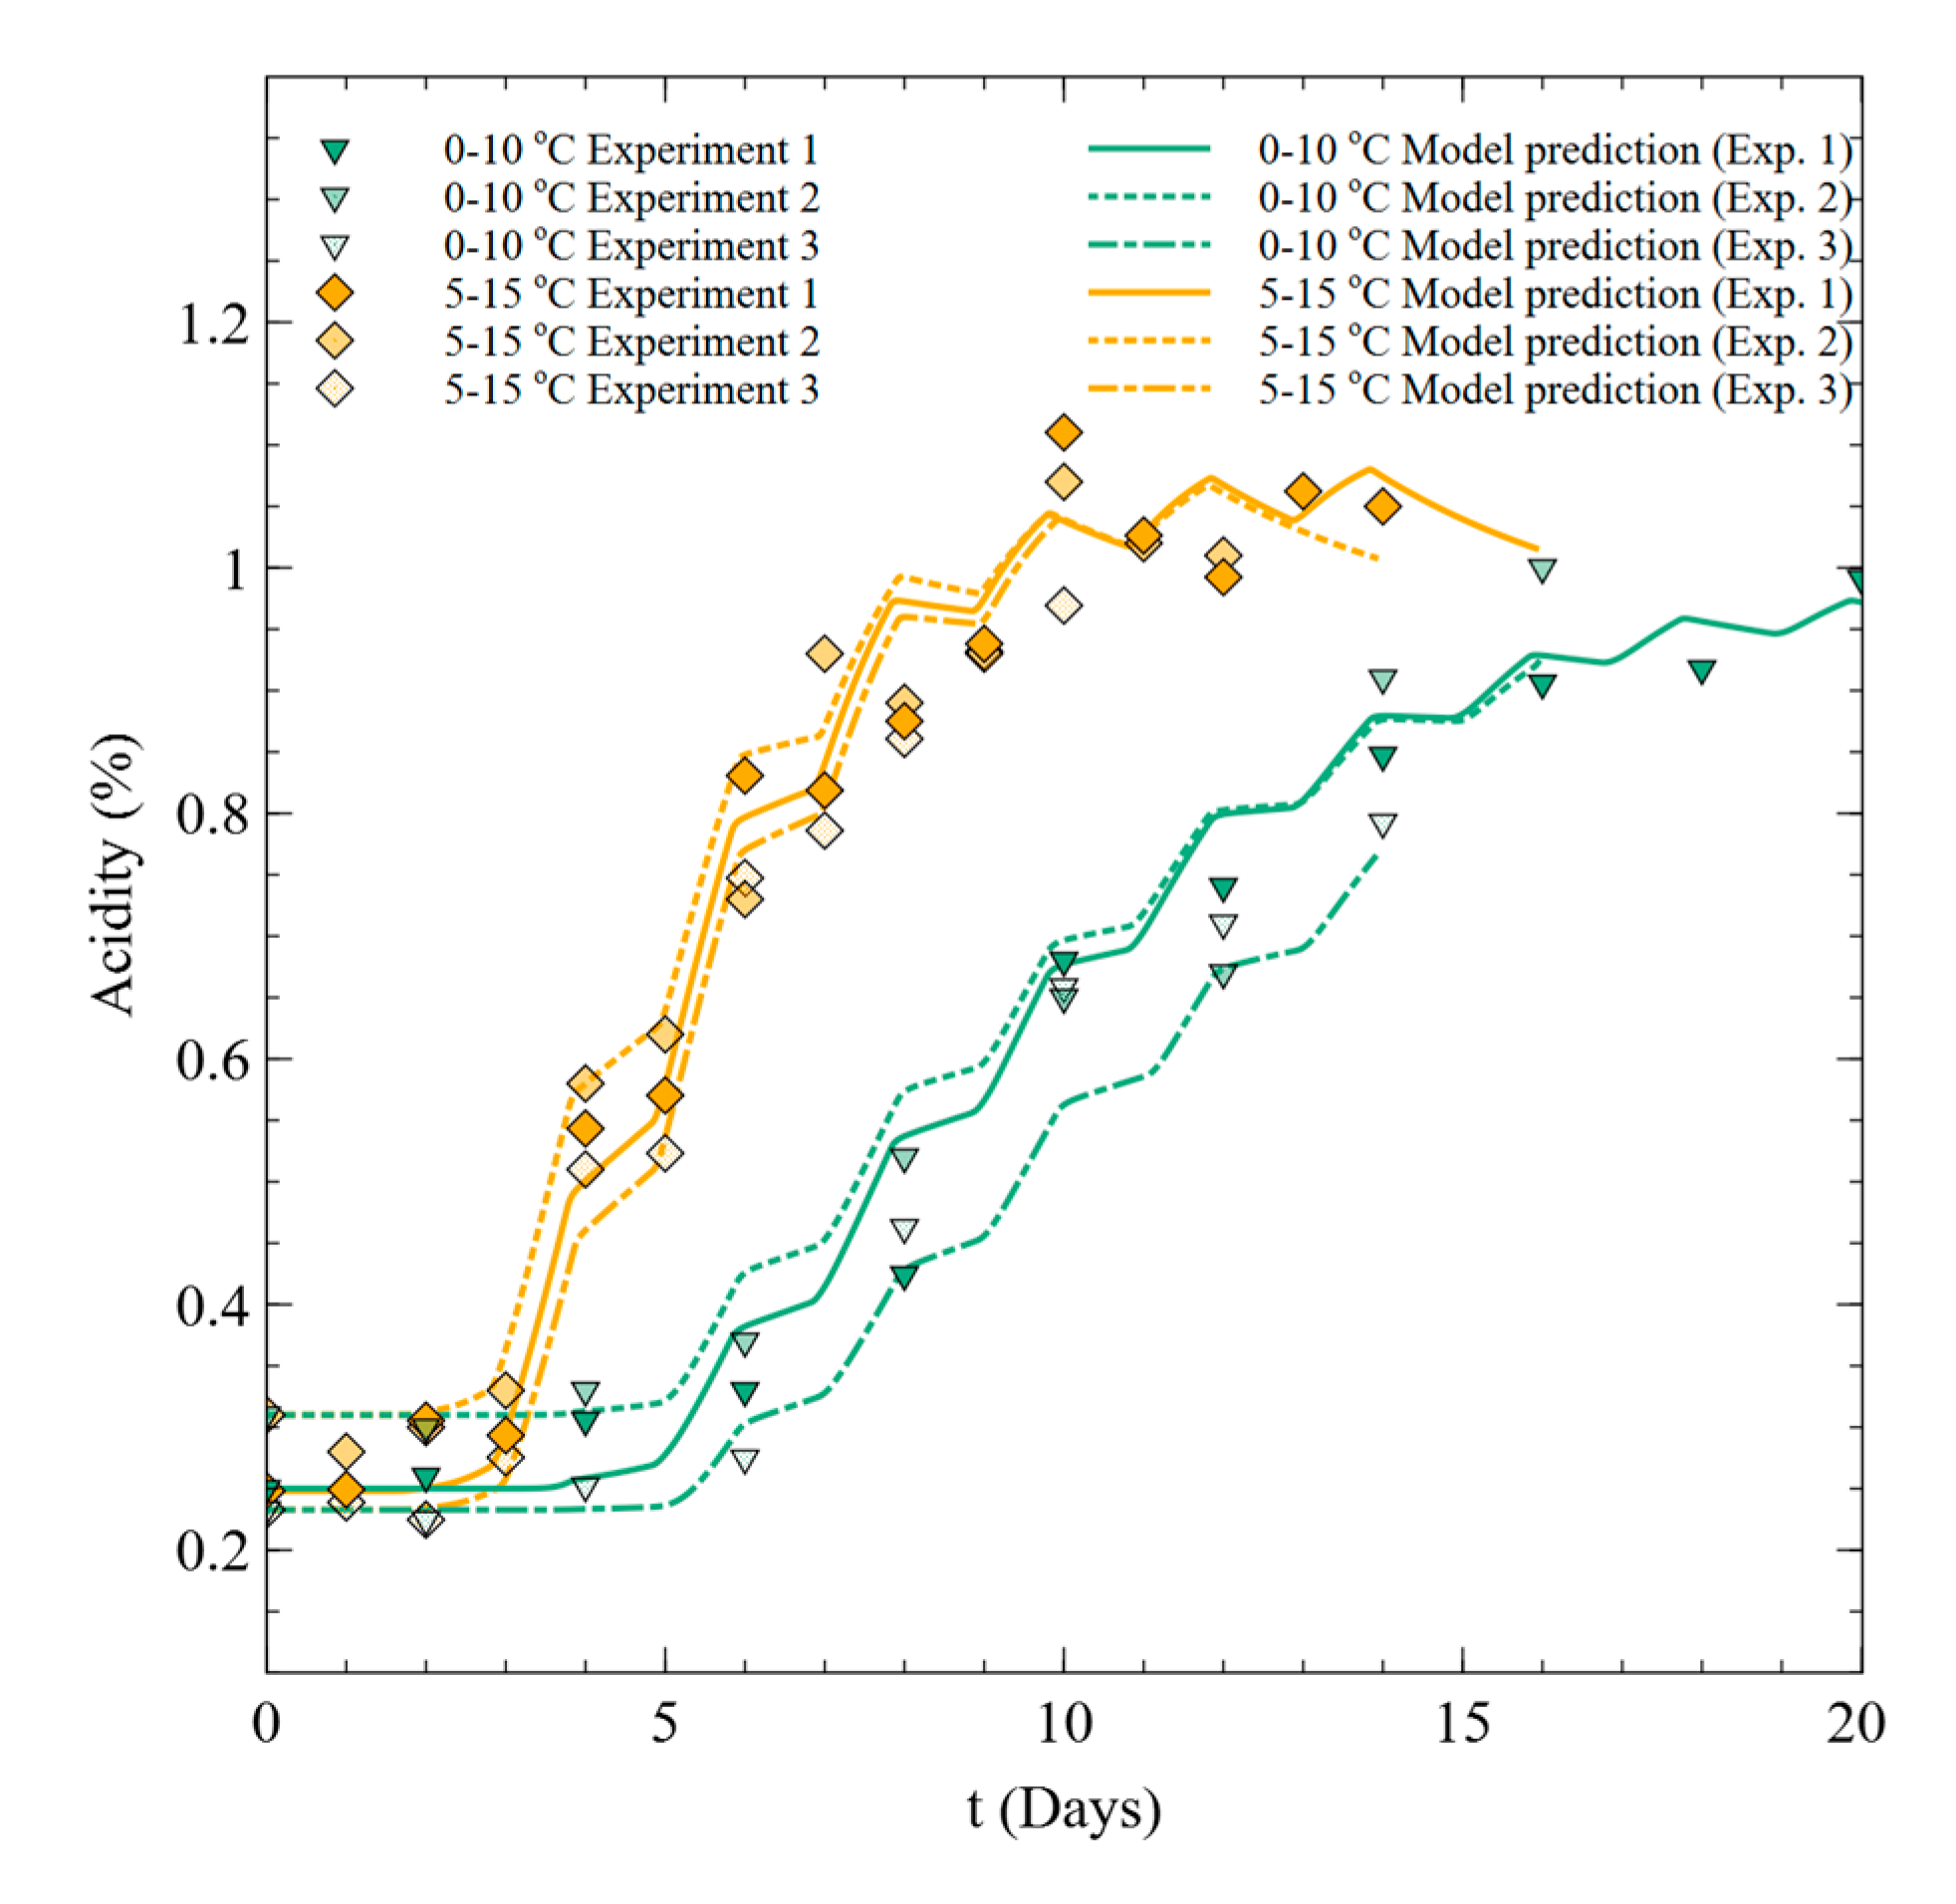
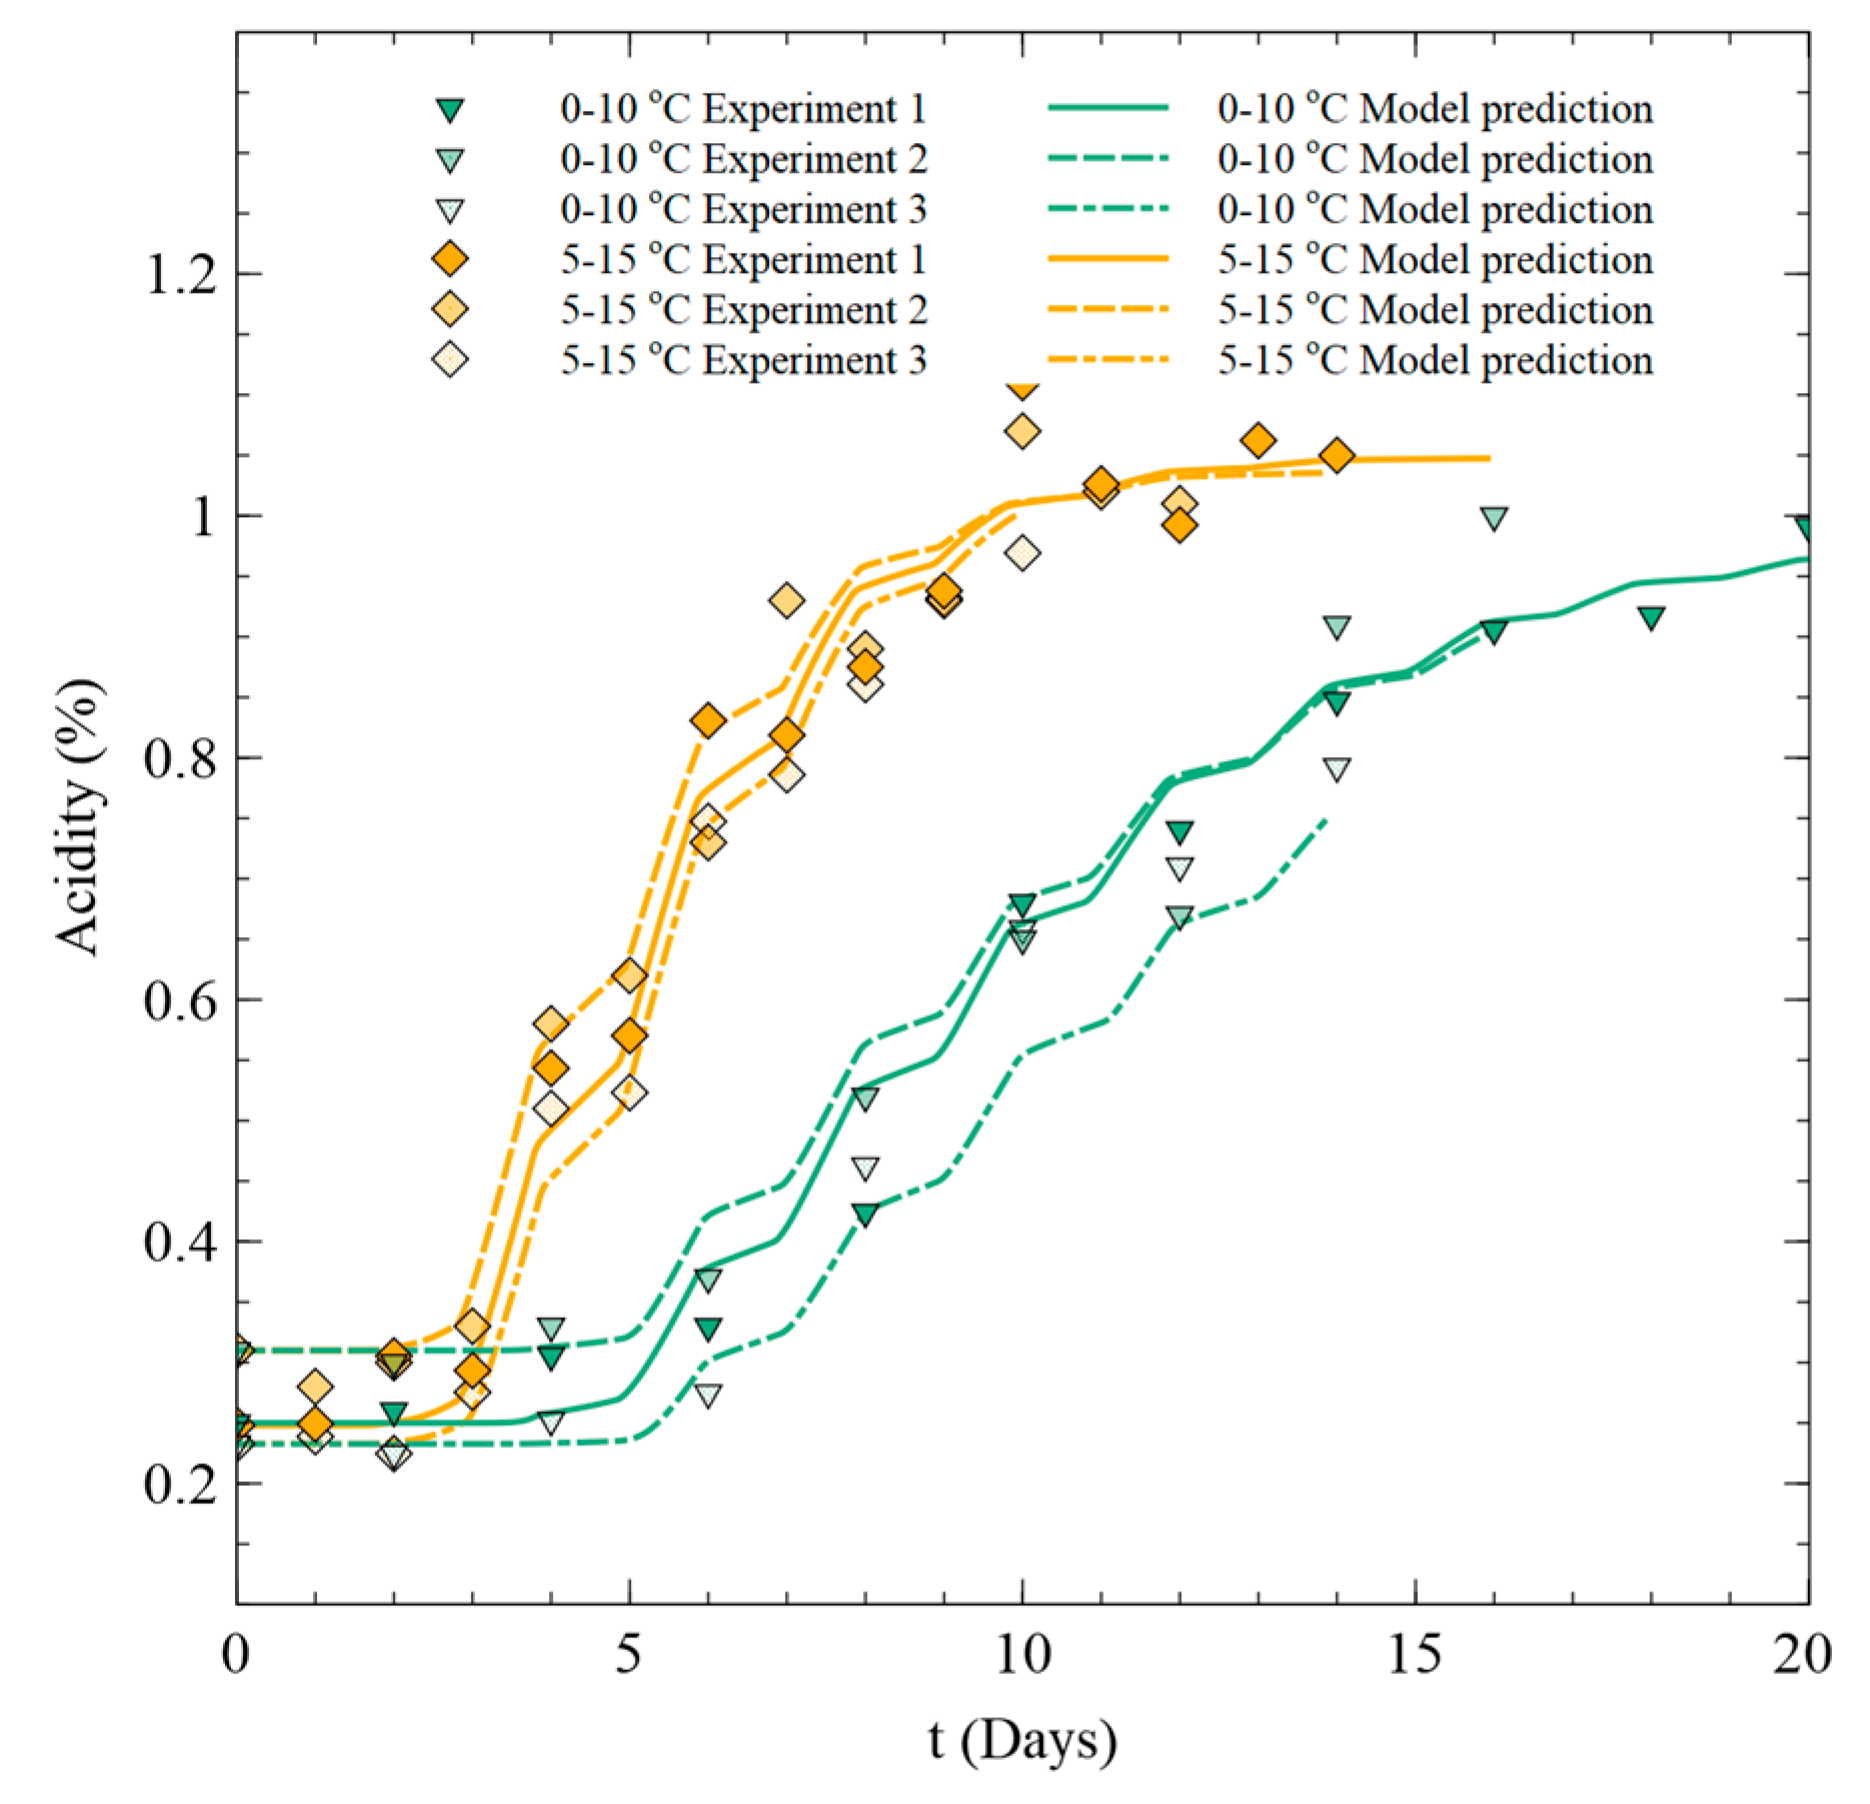
3.3.2. Dynamic Model and Validation
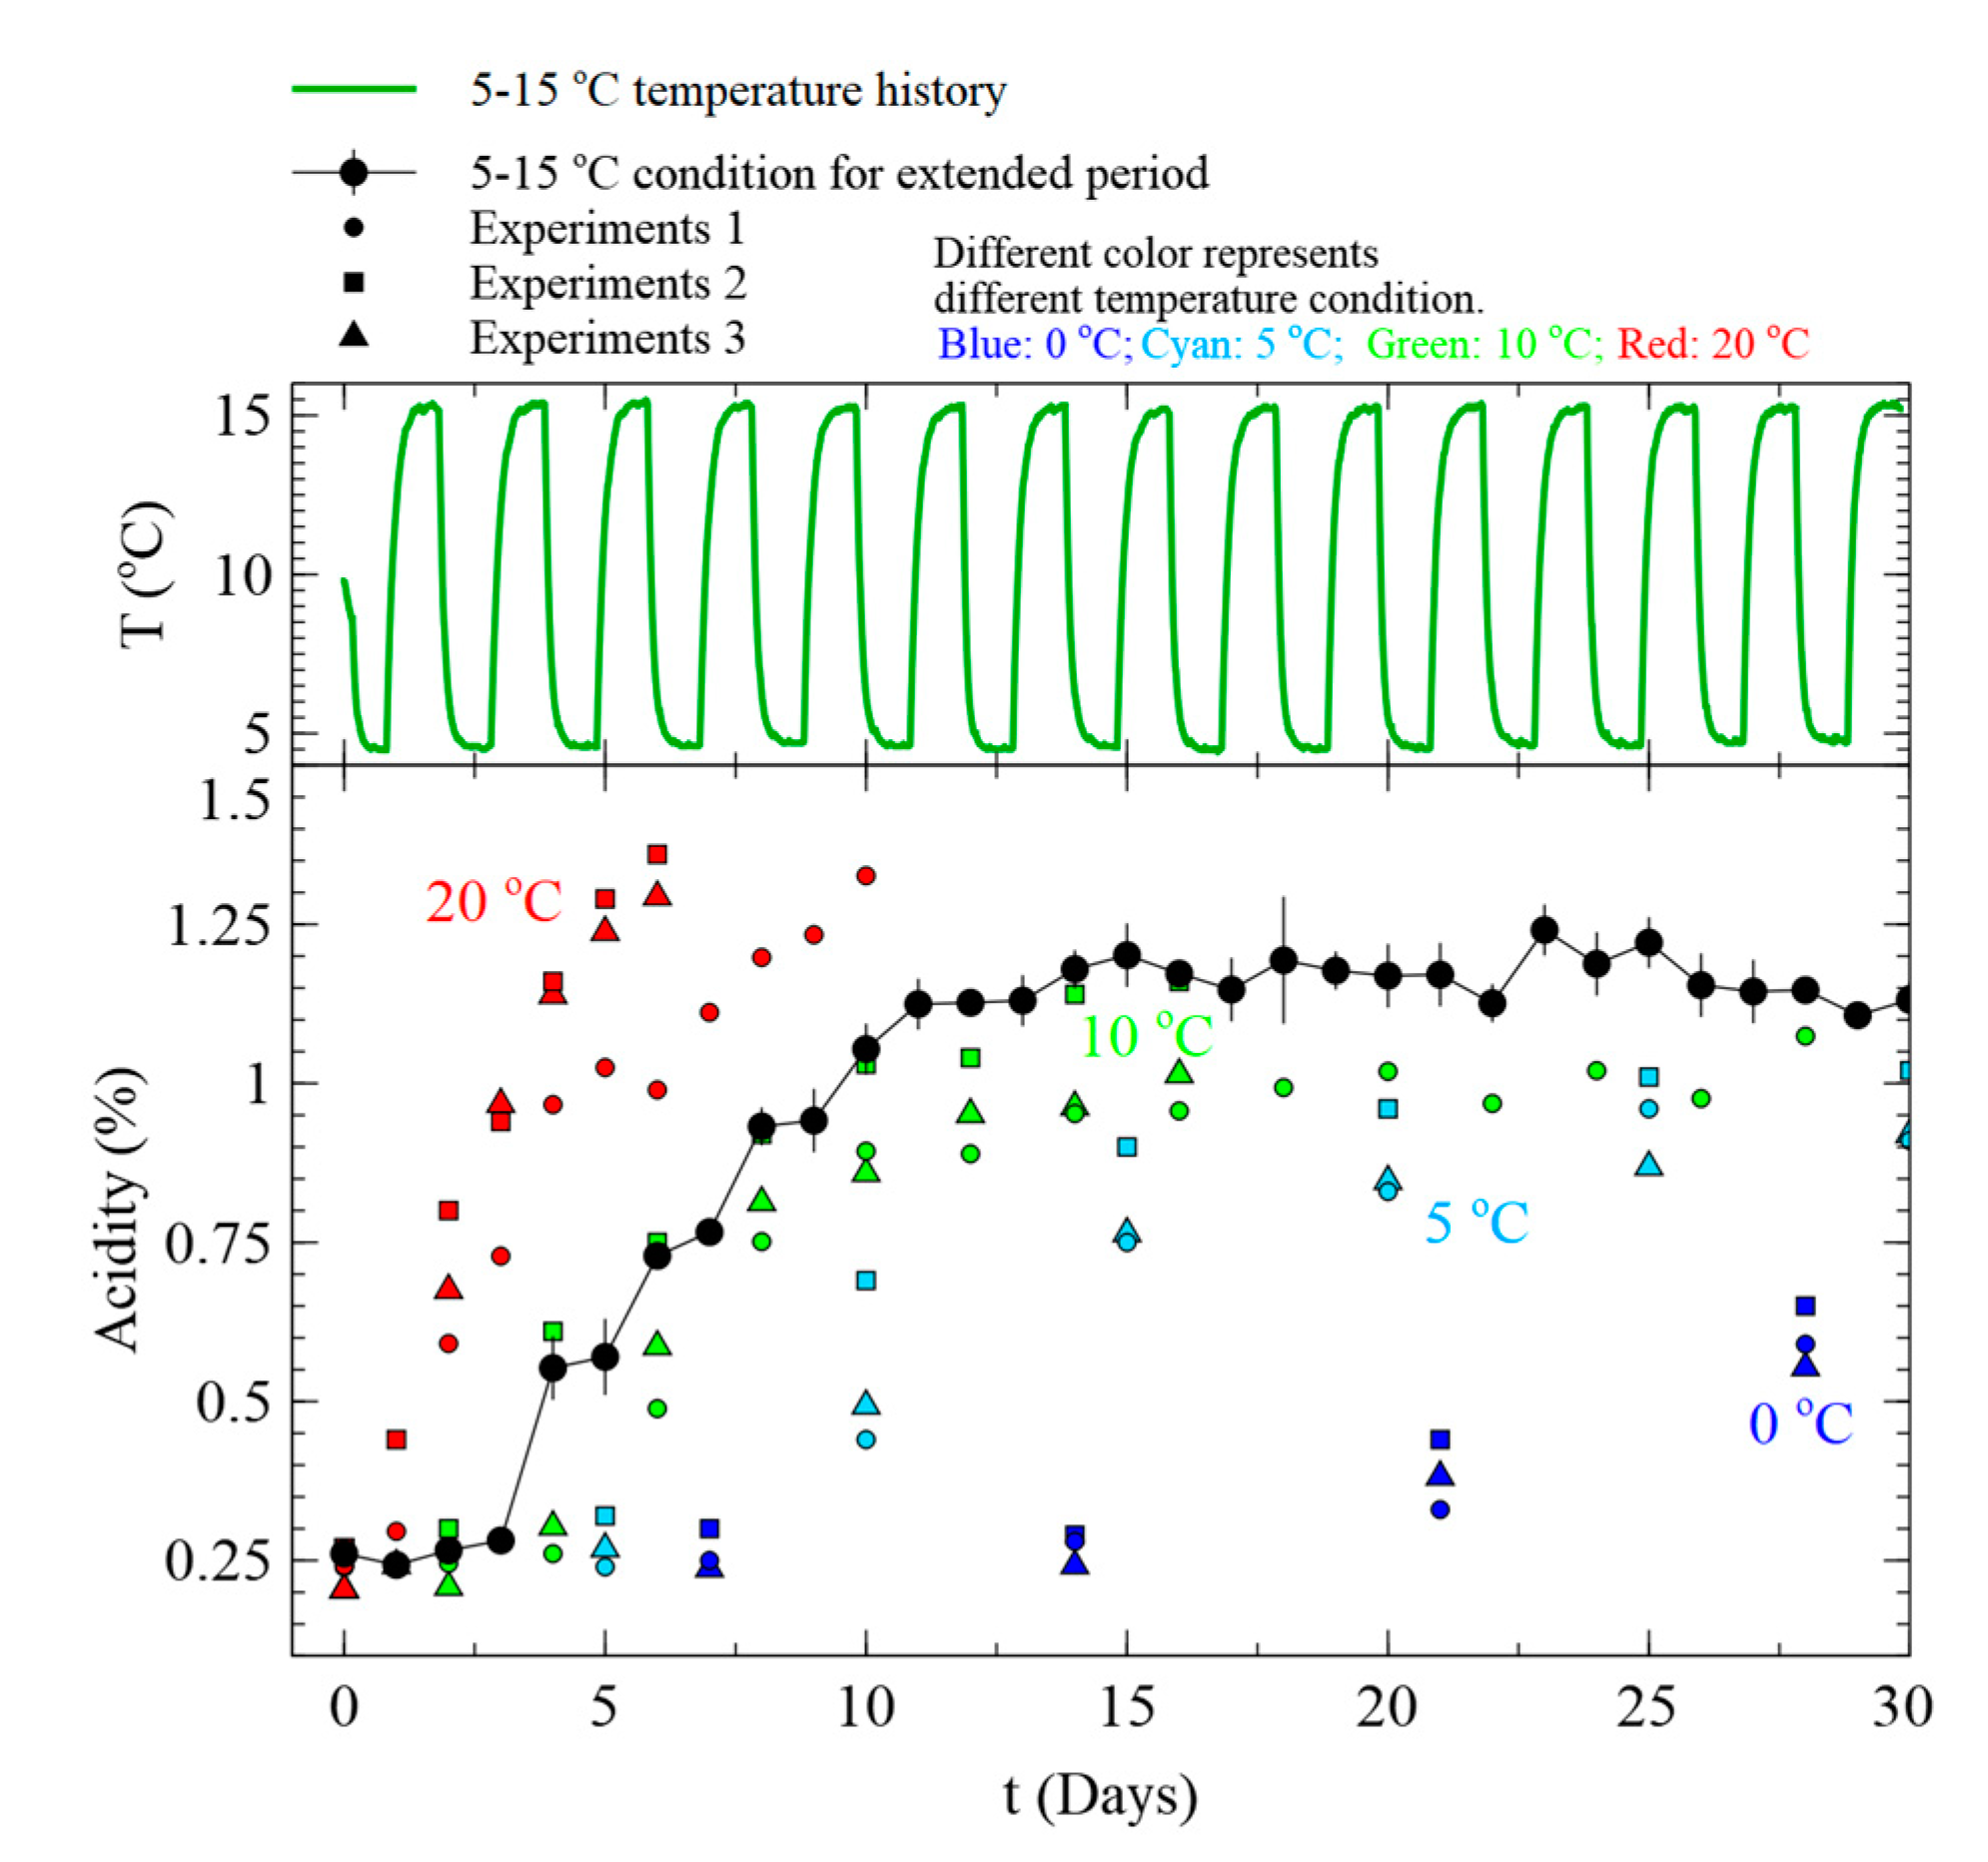
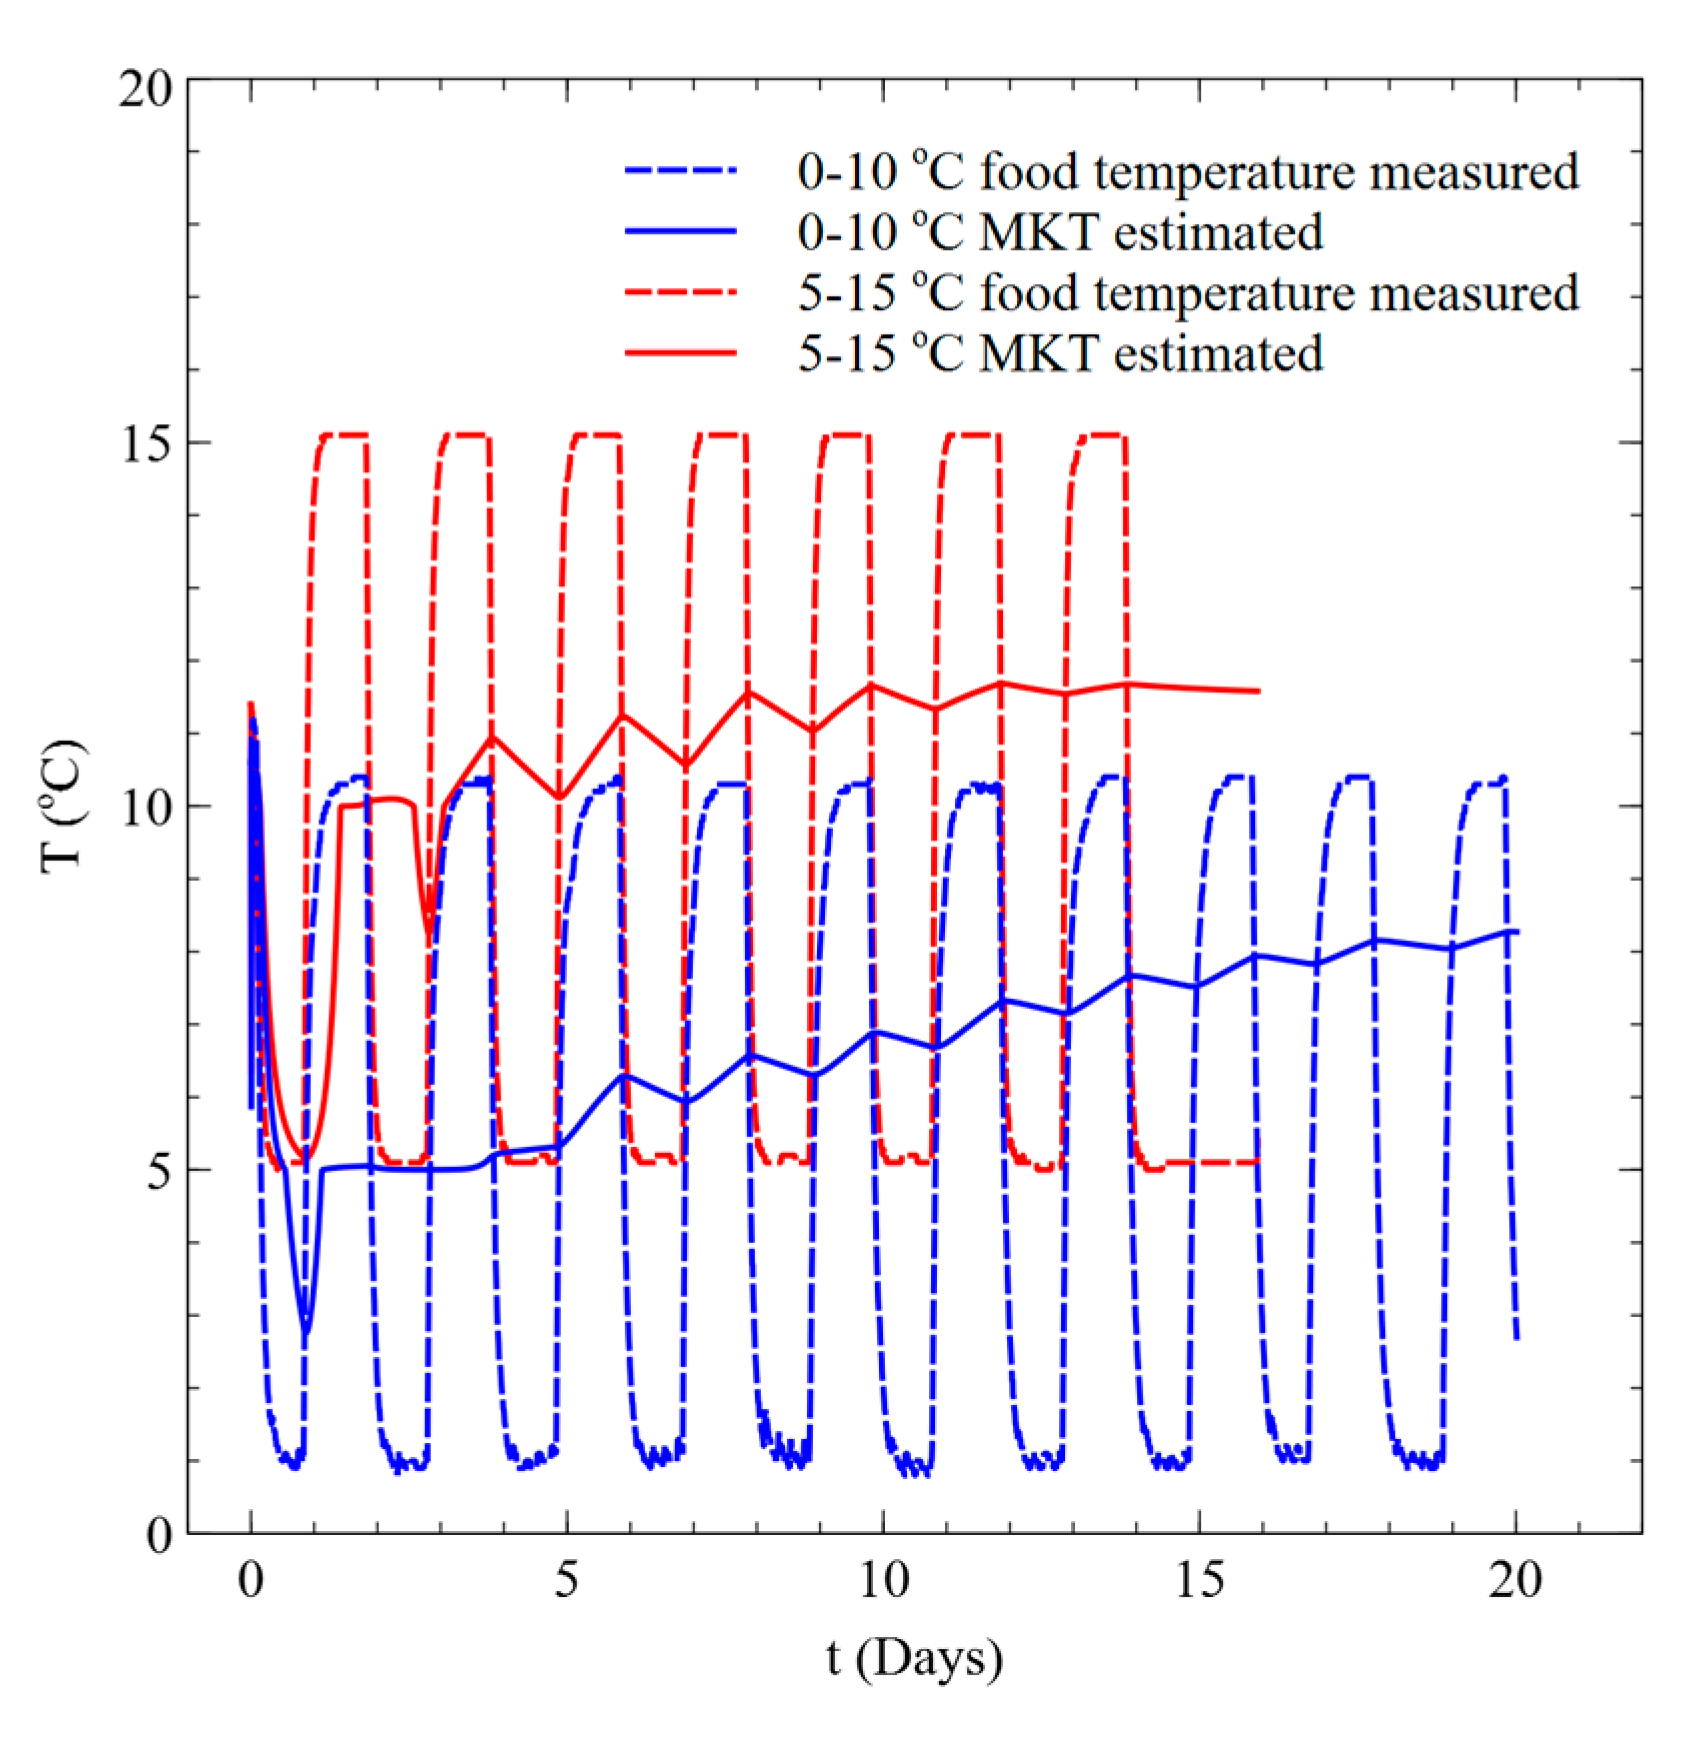
3.3.3. Dynamic Model Using MKT
4. Conclusions
Author Contributions
Funding
Acknowledgments
Conflicts of Interest
References
- Kim, H.Y.; Park, K.Y. Clinical trials of kimchi intakes on the regulation of metabolic parameters and colon health in healthy Korean young adults. J. Funct. Foods 2018, 47, 325–333. [Google Scholar] [CrossRef]
- Hongu, N.; Kim, A.S.; Suzuki, A.; Wilson, H.; Tsui, K.C.; Park, S. Korean kimchi: Promoting healthy meals through cultural tradition. J. Ethn. Foods 2017, 4, 172–180. [Google Scholar] [CrossRef]
- Choi, E.A.; Chang, H.C. Cholesterol-lowering effects of a putative probiotic strain Lactobacillus plantarum EM isolated from kimchi. LWT-Food Sci. Technol. 2015, 62, 210–217. [Google Scholar] [CrossRef]
- Ministry of Agriculture. Kimchi Export Status; Ministry of Agriculture: Georgetown, Guyana, 2019. [Google Scholar]
- Jung, E.S.; Kim, K.H.; Song, K.Y.; Yoon, S.S.; Shin, W.C. Changes in Acidity and Distributions of the Vancomycin-Resistant Lactic Acid Bacteria in the Kimchi Fermented at Different Temperature. Korean J. Microbiol. Biotechnol. 2004, 32, 249–255. [Google Scholar]
- Kim, S.J.; Lee, J.Y.; Yoon, S.R.; Lee, H.W.; Ha, J.H. Regression analysis for predicting the fermentation state of packaged Kimchi using a colorimetric indicator. J. Food Eng. 2019, 240, 65–72. [Google Scholar] [CrossRef]
- González, S.C.; Possas, A.; Carrasco, E.; Valero, A.; Bolívar, A.; Posada-Izquierdo, G.D.; García-Gimeno, R.M.; Zurera, G.; Pérez-Rodríguez, F. ‘MicroHibro’: A software tool for predictive microbiology and microbial risk assessment in foods. Int. J. Food Microbiol. 2019, 290, 226–236. [Google Scholar] [CrossRef]
- McMeekin, T.; Olley, J.; Ratkowsky, D.; Corkrey, R.; Ross, T. Predictive microbiology theory and application: Is it all about rates? Food Control 2013, 29, 290–299. [Google Scholar] [CrossRef]
- Membré, J.M.; Lambert, R.J.W. Application of predictive modelling techniques in industry: From food design up to risk assessment. Int. J. Food Microbiol. 2008, 128, 10–15. [Google Scholar] [CrossRef]
- Fakruddin, M.D.; Mazumder, R.M.; Mannan, K.S. Bin Predictive microbiology: Modeling microbial responses in food. Ceylon J. Sci 2011, 40, 121–131. [Google Scholar]
- Jagannath, A.; Tsuchido, T. Predictive Microbiology: A Review. Biocontrol Sci. 2003, 8, 1–7. [Google Scholar] [CrossRef][Green Version]
- Juneja, V.K.; Golden, C.E.; Mishra, A.; Harrison, M.A.; Mohr, T.; Silverman, M. Predictive model for growth of Bacillus cereus during cooling of cooked rice. Int. J. Food Microbiol. 2019, 290, 49–58. [Google Scholar] [CrossRef] [PubMed]
- Lee, S.Y.; Kwon, K.H.; Chai, C.; Oh, S.W. Growth behavior comparison of Listeria monocytogenes between Type strains and beef isolates in raw beef. Food Sci. Biotechnol. 2018, 27, 599–605. [Google Scholar] [CrossRef] [PubMed]
- Zhi, N.-N.; Zong, K.; Thakur, K.; Qu, J.; Shi, J.-J.; Yang, J.-L.; Yao, J.; Wei, Z.-J. Development of a dynamic prediction model for shelf-life evaluation of yogurt by using physicochemical, microbiological and sensory parameters. CyTA-J. Food 2018, 16, 42–49. [Google Scholar] [CrossRef]
- Li, L.; Cepeda, J.; Subbiah, J.; Froning, G.; Juneja, V.K.; Thippareddi, H. Dynamic predictive model for growth of Salmonella spp. in scrambled egg mix. Food Microbiol. 2017, 64, 39–46. [Google Scholar] [CrossRef]
- Chai, C.; Lee, S.Y.; Oh, S.W. Shelf-life charts of beef according to level of bacterial contamination and storage temperature. LWT-Food Sci. Technol. 2017, 81, 50–57. [Google Scholar] [CrossRef]
- Cárdenas, F.C.; Giannuzzi, L.; Zaritzky, N.E. Mathematical modelling of microbial growth in ground beef from Argentina. Effect of lactic acid addition, temperature and packaging film. Meat Sci. 2008, 79, 509–520. [Google Scholar] [CrossRef]
- Jaisan, C.; Lee, D.S. A mathematical model to predict ripening degree of kimchi, a Korean fermented vegetable for meeting consumer preference and controlling shelf life on real time basis. Food Packag. Shelf Life 2017, 12, 23–27. [Google Scholar] [CrossRef]
- Ardia, D.; Mullen, K.M.; Peterson, B.G.; Ulrich, J. DEoptim: Differential Evolution in R. version 2.2-5. Available online: https://cran.r-project.org/web/packages/DEoptim/index.html (accessed on 22 July 2020).
- Elzhov, T.V.; Mullen, K.M.; Spiess, A.-N.; Bolker, B. R Interface to the Levenberg-Marquardt Nonlinear Least-Squares Algorithm Found in MINPACK. Available online: https://pdfs.semanticscholar.org/ee9e/759b6a4e7c6c416498fbc8170ff0f9427105.pdf (accessed on 22 July 2020).
- R Core Team. R: A Language and Environment for Statistical Computing. Available online: https://www.eea.europa.eu/data-and-maps/indicators/oxygen-consuming-substances-in-rivers/r-development-core-team-2006 (accessed on 22 July 2020).
- Corradini, M.G.; Amézquita, A.; Normand, M.D.; Peleg, M. Modeling and predicting non-isothermal microbial growth using general purpose software. Int. J. Food Microbiol. 2006, 106, 223–228. [Google Scholar] [CrossRef]
- Kim, J.; Santos, C.A.; Kim, B.-S.; Kim, J.; Koo, J. Estimation of real-time remaining shelf life using mean kinetic temperature. LWT-Food Sci. Technol. 2020. Accepted. [Google Scholar] [CrossRef]
- Ross, T. Indices for performance evaluation of predictive models in food microbiology. J. Appl. Bacteriol. 1996, 81, 501–508. [Google Scholar] [CrossRef]
- Noh, J.-S.; Seo, H.-J.; Oh, J.-H.; Lee, M.-J.; Kim, M.-H.; Cheigh, H.-S.; Song, Y.-O. Development of auto-aging system built in Kimchi refrigerator for optimal fermentation and storage of Korean cabbage Kimchi. Korean J. Food Sci. Technol. 2007, 39, 432–437. [Google Scholar]
- Moon, S.-W.; Park, S.-H.; Kang, B.-S.; Lee, M.-K. Fermentation Characteristics of Low-Salt Kimchi with Starters on Fermentation Temperature and Salt Concentration. Korean J. Food Nutr. 2014, 27, 785–795. [Google Scholar] [CrossRef]
- Kim, N.; Park, K.R.; Park, I.S.; Cho, Y.J.; Bae, Y.M. Application of a taste evaluation system to the monitoring of Kimchi fermentation. Biosens. Bioelectron. 2005, 20, 2283–2291. [Google Scholar] [CrossRef] [PubMed]
- Choi, S.Y.; Lee, M.K.; Choi, K.S.; Koo, Y.J.; Park, W.S. Changes of Fermentation Characteristics and Sensory Evaluation of Kimchi on Different Storage Temperature. Korean J. Food Sci. Technol. 1998, 30, 644–649. [Google Scholar]
- Kim, Y.K.; Lee, G.C. Contents of pectic substance and minerals and textural properties of leek added kimchi during fermentation. Korean J Soc Food Sci 1999, 15, 258–263. [Google Scholar]
- Nam, D.-G.; Kim, S.; Choi, Y.; Jin, Y.-X.; Yang, M.-R.; Han, H.-K.; Choi, A.-J. Change of Quality Characteristics of Commercial and Prepared Kimchi Depending on Fermentation. Korean J. Food Cook. Sci. 2017, 33, 162–173. [Google Scholar] [CrossRef]
- Chang, M.-J.M.-H. Fermentation Property of Chinese Cabbage Kimchi by Fermentation Temperature and Salt Concentration. Appl. Biol. Chem. 2000, 43, 7–11. [Google Scholar]
- Moon, S.H.; Kim, E.J.; Kim, E.J.; Chang, H.C. Development of fermentation · storage mode for kimchi refrigerator to maintain the best quality of kimchi during storage. Korean J. Food Sci. Technol. 2018, 50, 44–54. [Google Scholar] [CrossRef]
- Kim, B.-S.B.-S.; Lee, M.; Kim, J.-Y.; Jung, J.-Y.J.-Y.; Koo, J. Development of a freshness-assessment model for a real-time online monitoring system of packaged commercial milk in distribution. LWT-Food Sci. Technol. 2016, 68. [Google Scholar] [CrossRef]


| Temperature (°C) | Fermentation Period (Day) | Sensory Evaluation | ||||
|---|---|---|---|---|---|---|
| Appearance (Softness) | Sour Smell | Sour Taste | Crunchiness | Overall Ripeness | ||
| 0 | 0 | 1.00f | 1.06e | 1.20e | 8.86a | 1.00f |
| 7 | 2.53e | 2.46de | 2.60d | 7.46b | 2.53e | |
| 14 | 3.06e | 2.66d | 2.53d | 6.86bc | 2.53e | |
| 21 | 4.33d | 3.53d | 3.40d | 6.00cd | 4.06d | |
| 28 | 5.00d | 4.60bc | 4.80c | 5.73de | 5.00cd | |
| 35 | 6.00c | 4.21c | 6.21b | 5.21def | 5.57bc | |
| 42 | 6.46bc | 5.00bc | 6.40b | 5.06defg | 5.53bc | |
| 49 | 7.06ab | 4.66bc | 6.73b | 4.26fg | 6.53b | |
| 56 | 7.85a | 6.00ab | 7.92a | 4.78efg | 7.71a | |
| 63 | 8.06a | 6.78a | 8.14a | 4.00g | 8.14a | |
| 5 | 0 | 1.00f | 1.06d | 1.20f | 8.86a | 1.06e |
| 5 | 2.80e | 2.26d | 2.46e | 7.73b | 2.46d | |
| 10 | 2.66e | 2.06d | 2.53e | 7.46b | 2.46d | |
| 15 | 6.13c | 4.26bc | 6.33c | 6.13c | 4.66c | |
| 20 | 4.73d | 4.06c | 4.86d | 6.40c | 4.06c | |
| 25 | 6.73bc | 5.40abc | 6.80bc | 5.00d | 6.20b | |
| 30 | 7.40ab | 5.13abc | 7.40ab | 5.00d | 6.13b | |
| 35 | 7.92a | 5.85ab | 8.14a | 4.00de | 7.42ab | |
| 40 | 8.06a | 6.53a | 7.86a | 4.13de | 7.46ab | |
| 45 | 7.46ab | 5.66abc | 7.66ab | 4.53de | 6.93bc | |
| 50 | 8.20a | 6.60a | 8.20a | 3.73e | 7.86a | |
| 10 | 0 | 1.00f | 1.06f | 1.20g | 8.86a | 1.06g |
| 2 | 1.53f | 1.46ef | 2.00g | 8.06ab | 1.73g | |
| 4 | 3.26e | 2.73de | 3.13f | 7.33bc | 2.93f | |
| 6 | 5.00d | 2.93de | 4.80e | 6.46cd | 3.60f | |
| 8 | 5.13d | 3.06cd | 5.20e | 6.40cd | 3.86ef | |
| 10 | 5.66cd | 4.00bcd | 5.66de | 6.03de | 4.60de | |
| 12 | 6.60bc | 4.53abc | 6.53cd | 5.53def | 5.33cd | |
| 14 | 6.73abc | 5.06ab | 7.00bc | 5.33efg | 5.86bc | |
| 16 | 7.13ab | 5.20ab | 7.66ab | 4.73fg | 6.60ab | |
| 18 | 6.73abc | 5.00ab | 6.66bc | 5.06efg | 6.60ab | |
| 20 | 7.40ab | 5.26ab | 7.46abc | 4.80fg | 7.06a | |
| 22 | 7.66ab | 5.26ab | 7.40abc | 4.40g | 6.80ab | |
| 24 | 7.86a | 5.80a | 8.20a | 4.80fg | 6.93a | |
| 26 | 7.20ab | 5.86a | 7.46abc | 4.66fg | 7.00a | |
| 28 | 7.26ab | 5.00ab | 7.60abc | 4.80fg | 6.86ab | |
| 30 | 7.20ab | 5.13ab | 7.53abc | 5.20efg | 6.60ab | |
| 20 | 0 | 1.00e | 1.06d | 1.13f | 8.86a | 1.06g |
| 1 | 1.33e | 1.06d | 1.20f | 8.80a | 1.33g | |
| 2 | 3.53d | 2.60cd | 4.26e | 7.73a | 2.73f | |
| 3 | 5.00c | 3.26bc | 5.26de | 6.53b | 3.53ef | |
| 4 | 5.86bc | 4.60ab | 6.00cd | 6.26b | 4.60de | |
| 5 | 6.66ab | 4.86ab | 7.20ab | 5.93b | 5.00d | |
| 6 | 6.53ab | 4.66ab | 6.86bc | 5.33bc | 5.73cd | |
| 7 | 7.06ab | 4.66ab | 7.46ab | 5.93b | 5.93cd | |
| 8 | 7.20ab | 5.26a | 7.60ab | 5.33bc | 6.40bc | |
| 9 | 7.73a | 5.73a | 7.93ab | 4.46c | 7.26ab | |
| 10 | 7.93a | 5.86a | 8.40a | 4.53c | 7.86a | |
| Quality Index | Storage Temperature (°C) | Correlation Coefficient (r) | Statistical Significance † |
|---|---|---|---|
| pH | 0 | −0.920 | ** |
| 5 | −0.887 | ** | |
| 10 | −0.884 | ** | |
| 20 | −0.862 | ** | |
| Total acidity (% lactic acid) | 0 | 0.915 | ** |
| 5 | 0.932 | ** | |
| 10 | 0.947 | ** | |
| 20 | 0.989 | ** | |
| Texture (hardness) | 0 | 0.308 | NS |
| 5 | 0.150 | NS | |
| 10 | 0.147 | NS | |
| 20 | 0.105 | NS | |
| Hunter L value | 0 | −0.111 | NS |
| 5 | −0.045 | NS | |
| 10 | 0.026 | NS | |
| 20 | 0.128 | NS | |
| Hunter a value | 0 | 0.807 | ** |
| 5 | 0.532 | ** | |
| 10 | 0.536 | ** | |
| 20 | 0.603 | ** | |
| Hunter b value | 0 | 0.559 | NS |
| 5 | −0.096 | NS | |
| 10 | −0.066 | NS | |
| 20 | −0.013 | NS | |
| Aerobic count plate (Log CFU/g) | 0 | 0.892 | ** |
| 5 | 0.505 | NS | |
| 10 | 0.595 | * | |
| 20 | 0.572 | NS | |
| Lactic acid bacteria (Log CFU/g) | 0 | 0.860 | ** |
| 5 | 0.628 | * | |
| 10 | 0.674 | ** | |
| 20 | 0.665 | * |
| Model Parameters | Fitted Value | Confidence Interval | |
|---|---|---|---|
| 2.5% | 97.5% | ||
| 7.09 | 6.00 | 8.38 | |
| 1.52 | 9.86 | 2.34 | |
| 2.33 | 1.90 | 2.87 | |
| 3.70 | 1.70 | 8.08 | |
| 1.60 | 1.28 | 2.02 | |
| 8.78 | 8.33 | 9.27 | |
| Experiment | Temperature Condition (°C) | Af† | Bf‡ |
|---|---|---|---|
| 1 | 0 | 1.04 | 1.01 |
| 5 | 1.04 | 1.00 | |
| 10 | 1.05 | 1.01 | |
| 20 | 1.04 | 1.01 | |
| 2 | 0 | 1.05 | 0.95 |
| 5 | 1.06 | 0.97 | |
| 10 | 1.10 | 1.07 | |
| 20 | 1.09 | 0.92 | |
| 3 | 0 | 1.04 | 1.03 |
| 5 | 1.12 | 1.06 | |
| 10 | 1.13 | 0.91 | |
| 20 | 1.06 | 0.95 |
| Experiment | Temperature Condition (°C) | Af† | Bf‡ |
|---|---|---|---|
| 1 | 0–10 | 1.07 | 1.03 |
| 5–15 | 1.08 | 1.06 | |
| 2 | 0–10 | 1.07 | 0.97 |
| 5–15 | 1.05 | 0.99 | |
| 3 | 0–10 | 1.06 | 1.04 |
| 5–15 | 1.05 | 1.01 |
| Experiment | Temperature Condition (°C) | Af† | Bf‡ |
|---|---|---|---|
| 1 | 0–10 | 1.07 | 1.02 |
| 5–15 | 1.07 | 1.04 | |
| 2 | 0–10 | 1.08 | 0.96 |
| 5–15 | 1.05 | 0.98 | |
| 3 | 0–10 | 1.05 | 1.03 |
| 5–15 | 1.04 | 1.00 |
© 2020 by the authors. Licensee MDPI, Basel, Switzerland. This article is an open access article distributed under the terms and conditions of the Creative Commons Attribution (CC BY) license (http://creativecommons.org/licenses/by/4.0/).
Share and Cite
Kim, J.-Y.; Kim, B.-S.; Kim, J.-H.; Oh, S.-I.; Koo, J. Development of Dynamic Model for Real-Time Monitoring of Ripening Changes of Kimchi during Distribution. Foods 2020, 9, 1075. https://doi.org/10.3390/foods9081075
Kim J-Y, Kim B-S, Kim J-H, Oh S-I, Koo J. Development of Dynamic Model for Real-Time Monitoring of Ripening Changes of Kimchi during Distribution. Foods. 2020; 9(8):1075. https://doi.org/10.3390/foods9081075
Chicago/Turabian StyleKim, Ji-Young, Byeong-Sam Kim, Jong-Hoon Kim, Seung-Il Oh, and Junemo Koo. 2020. "Development of Dynamic Model for Real-Time Monitoring of Ripening Changes of Kimchi during Distribution" Foods 9, no. 8: 1075. https://doi.org/10.3390/foods9081075
APA StyleKim, J.-Y., Kim, B.-S., Kim, J.-H., Oh, S.-I., & Koo, J. (2020). Development of Dynamic Model for Real-Time Monitoring of Ripening Changes of Kimchi during Distribution. Foods, 9(8), 1075. https://doi.org/10.3390/foods9081075