Castanea spp. Agrobiodiversity Conservation: Genotype Influence on Chemical and Sensorial Traits of Cultivars Grown on the Same Clonal Rootstock


 ,
,  ,
, 
 and
and
Abstract
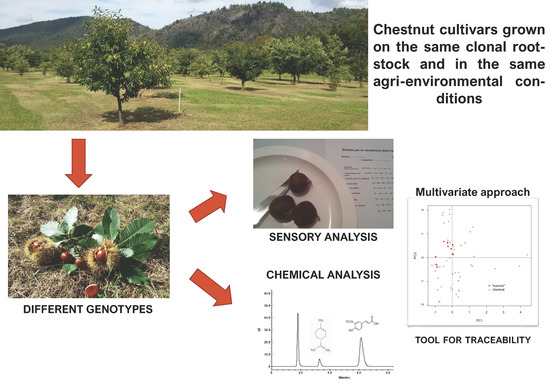
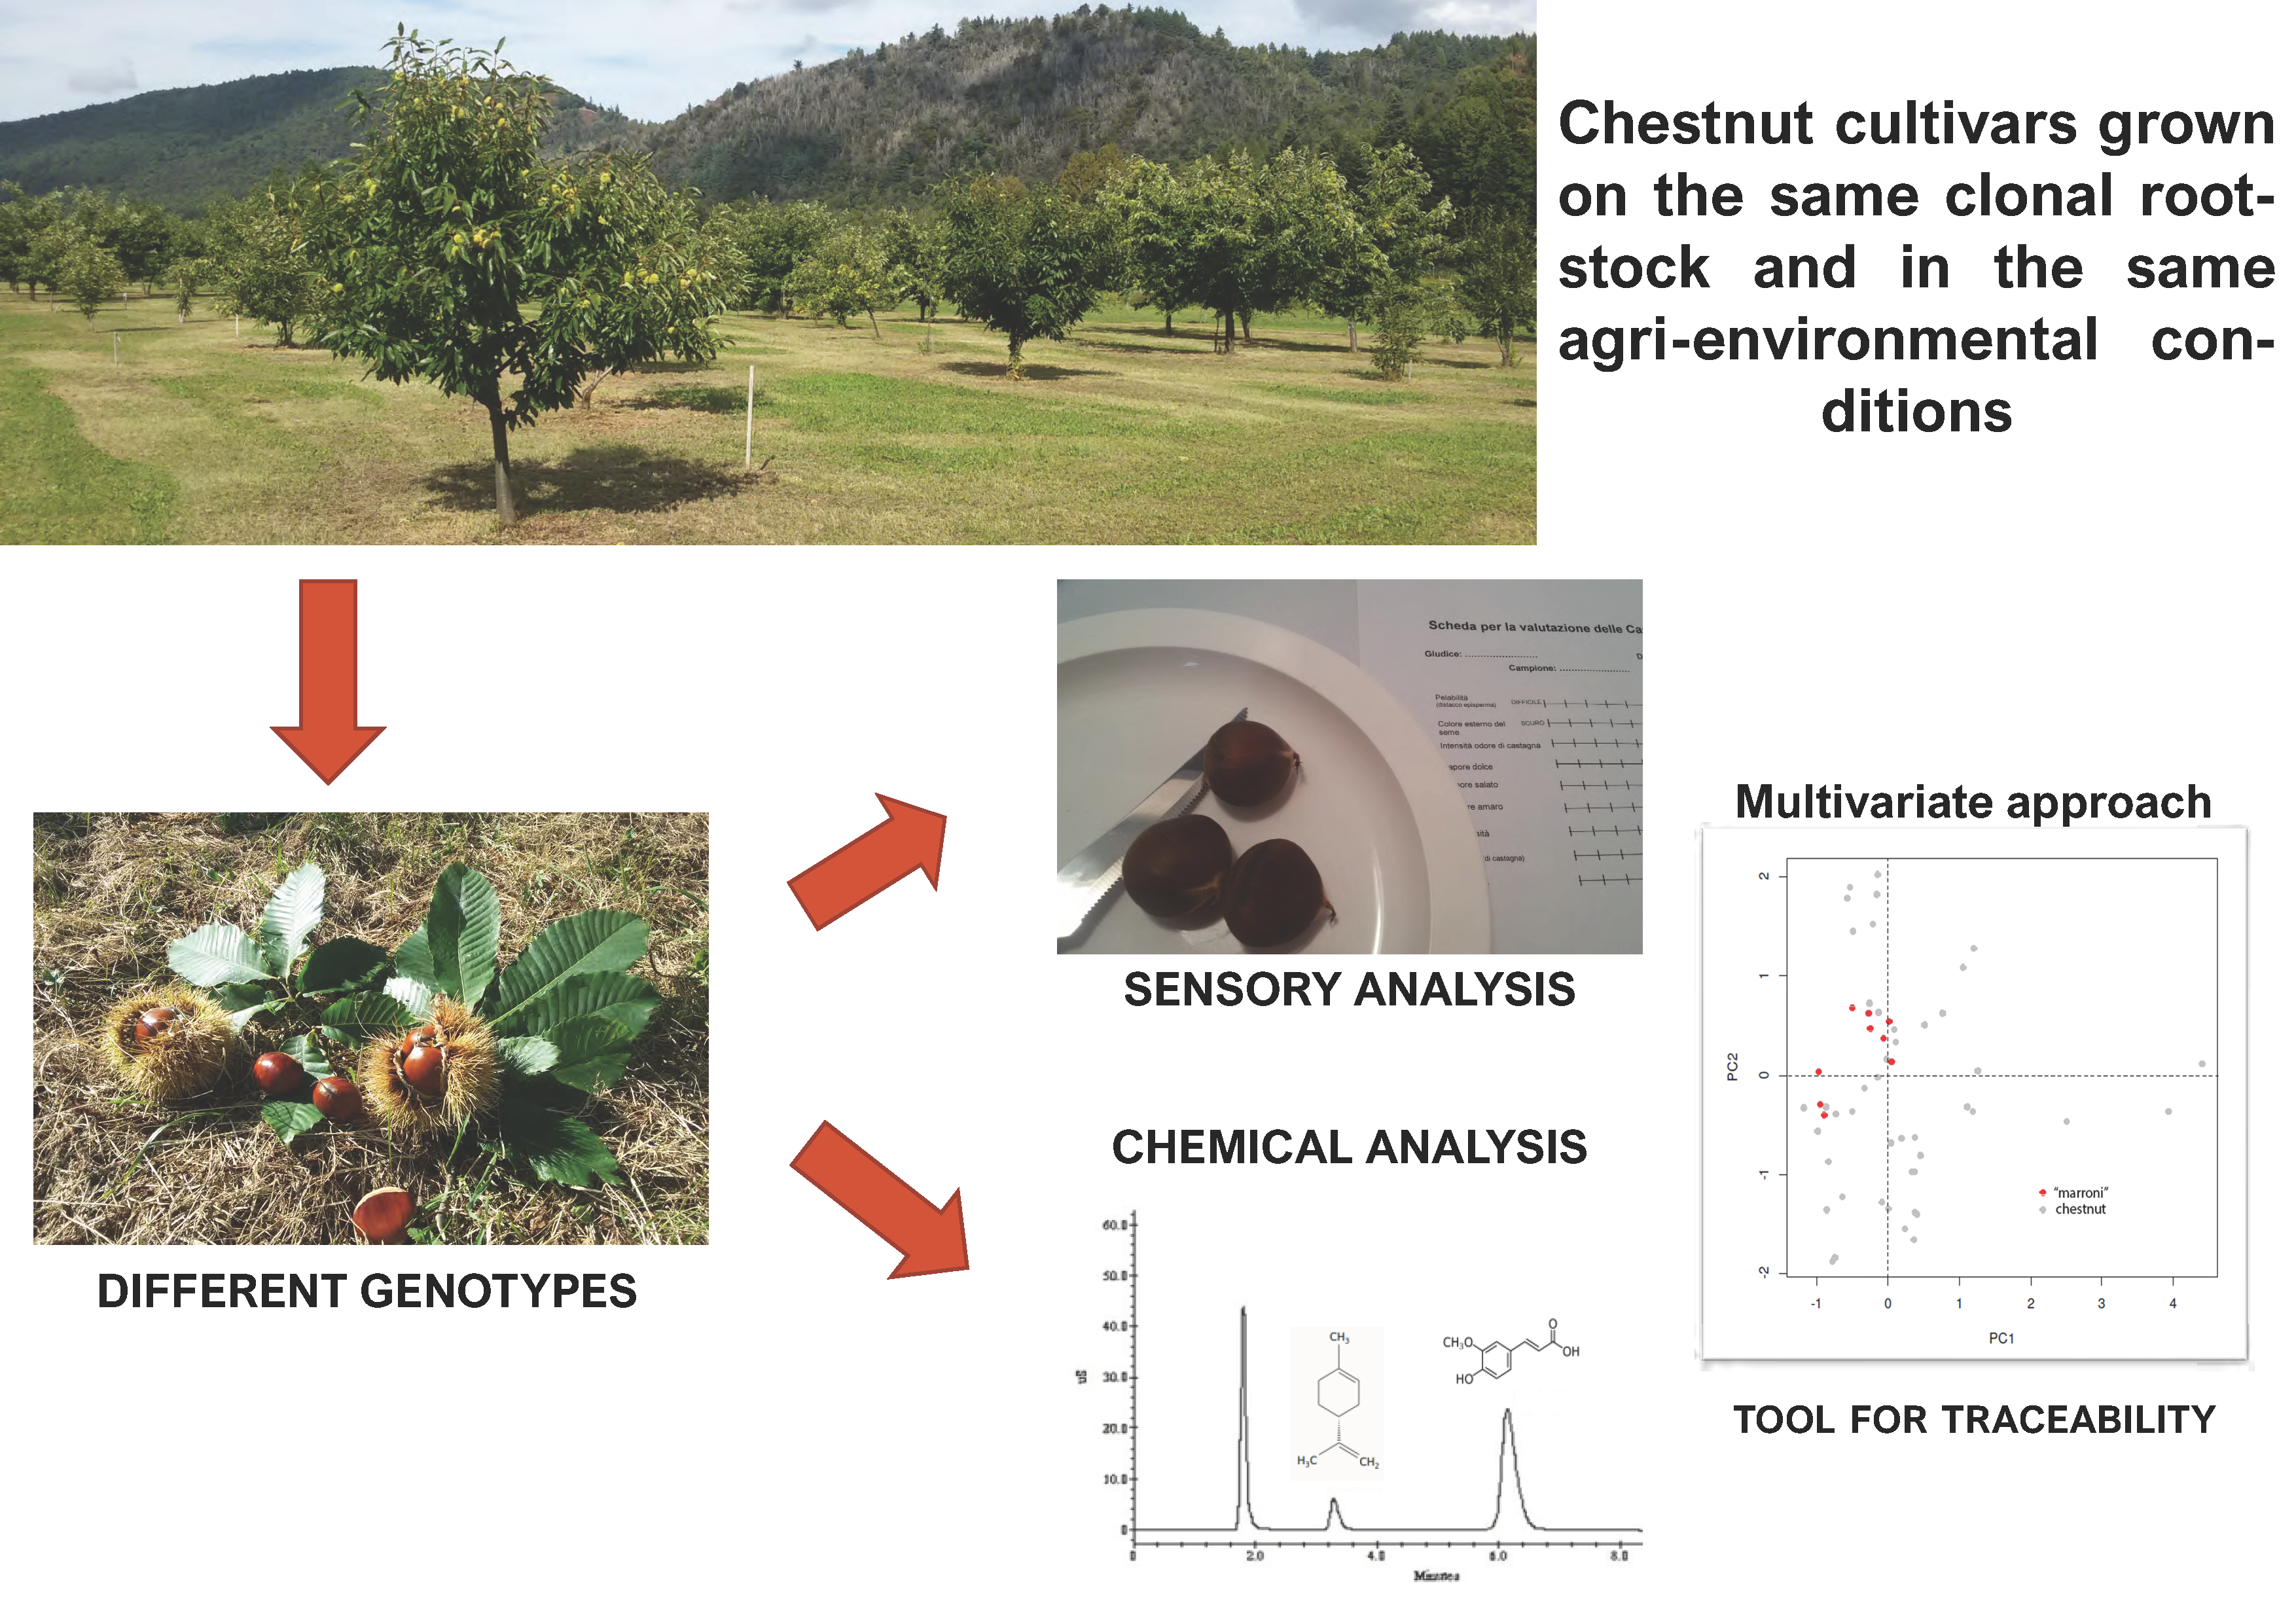
1. Introduction
2. Materials and Methods
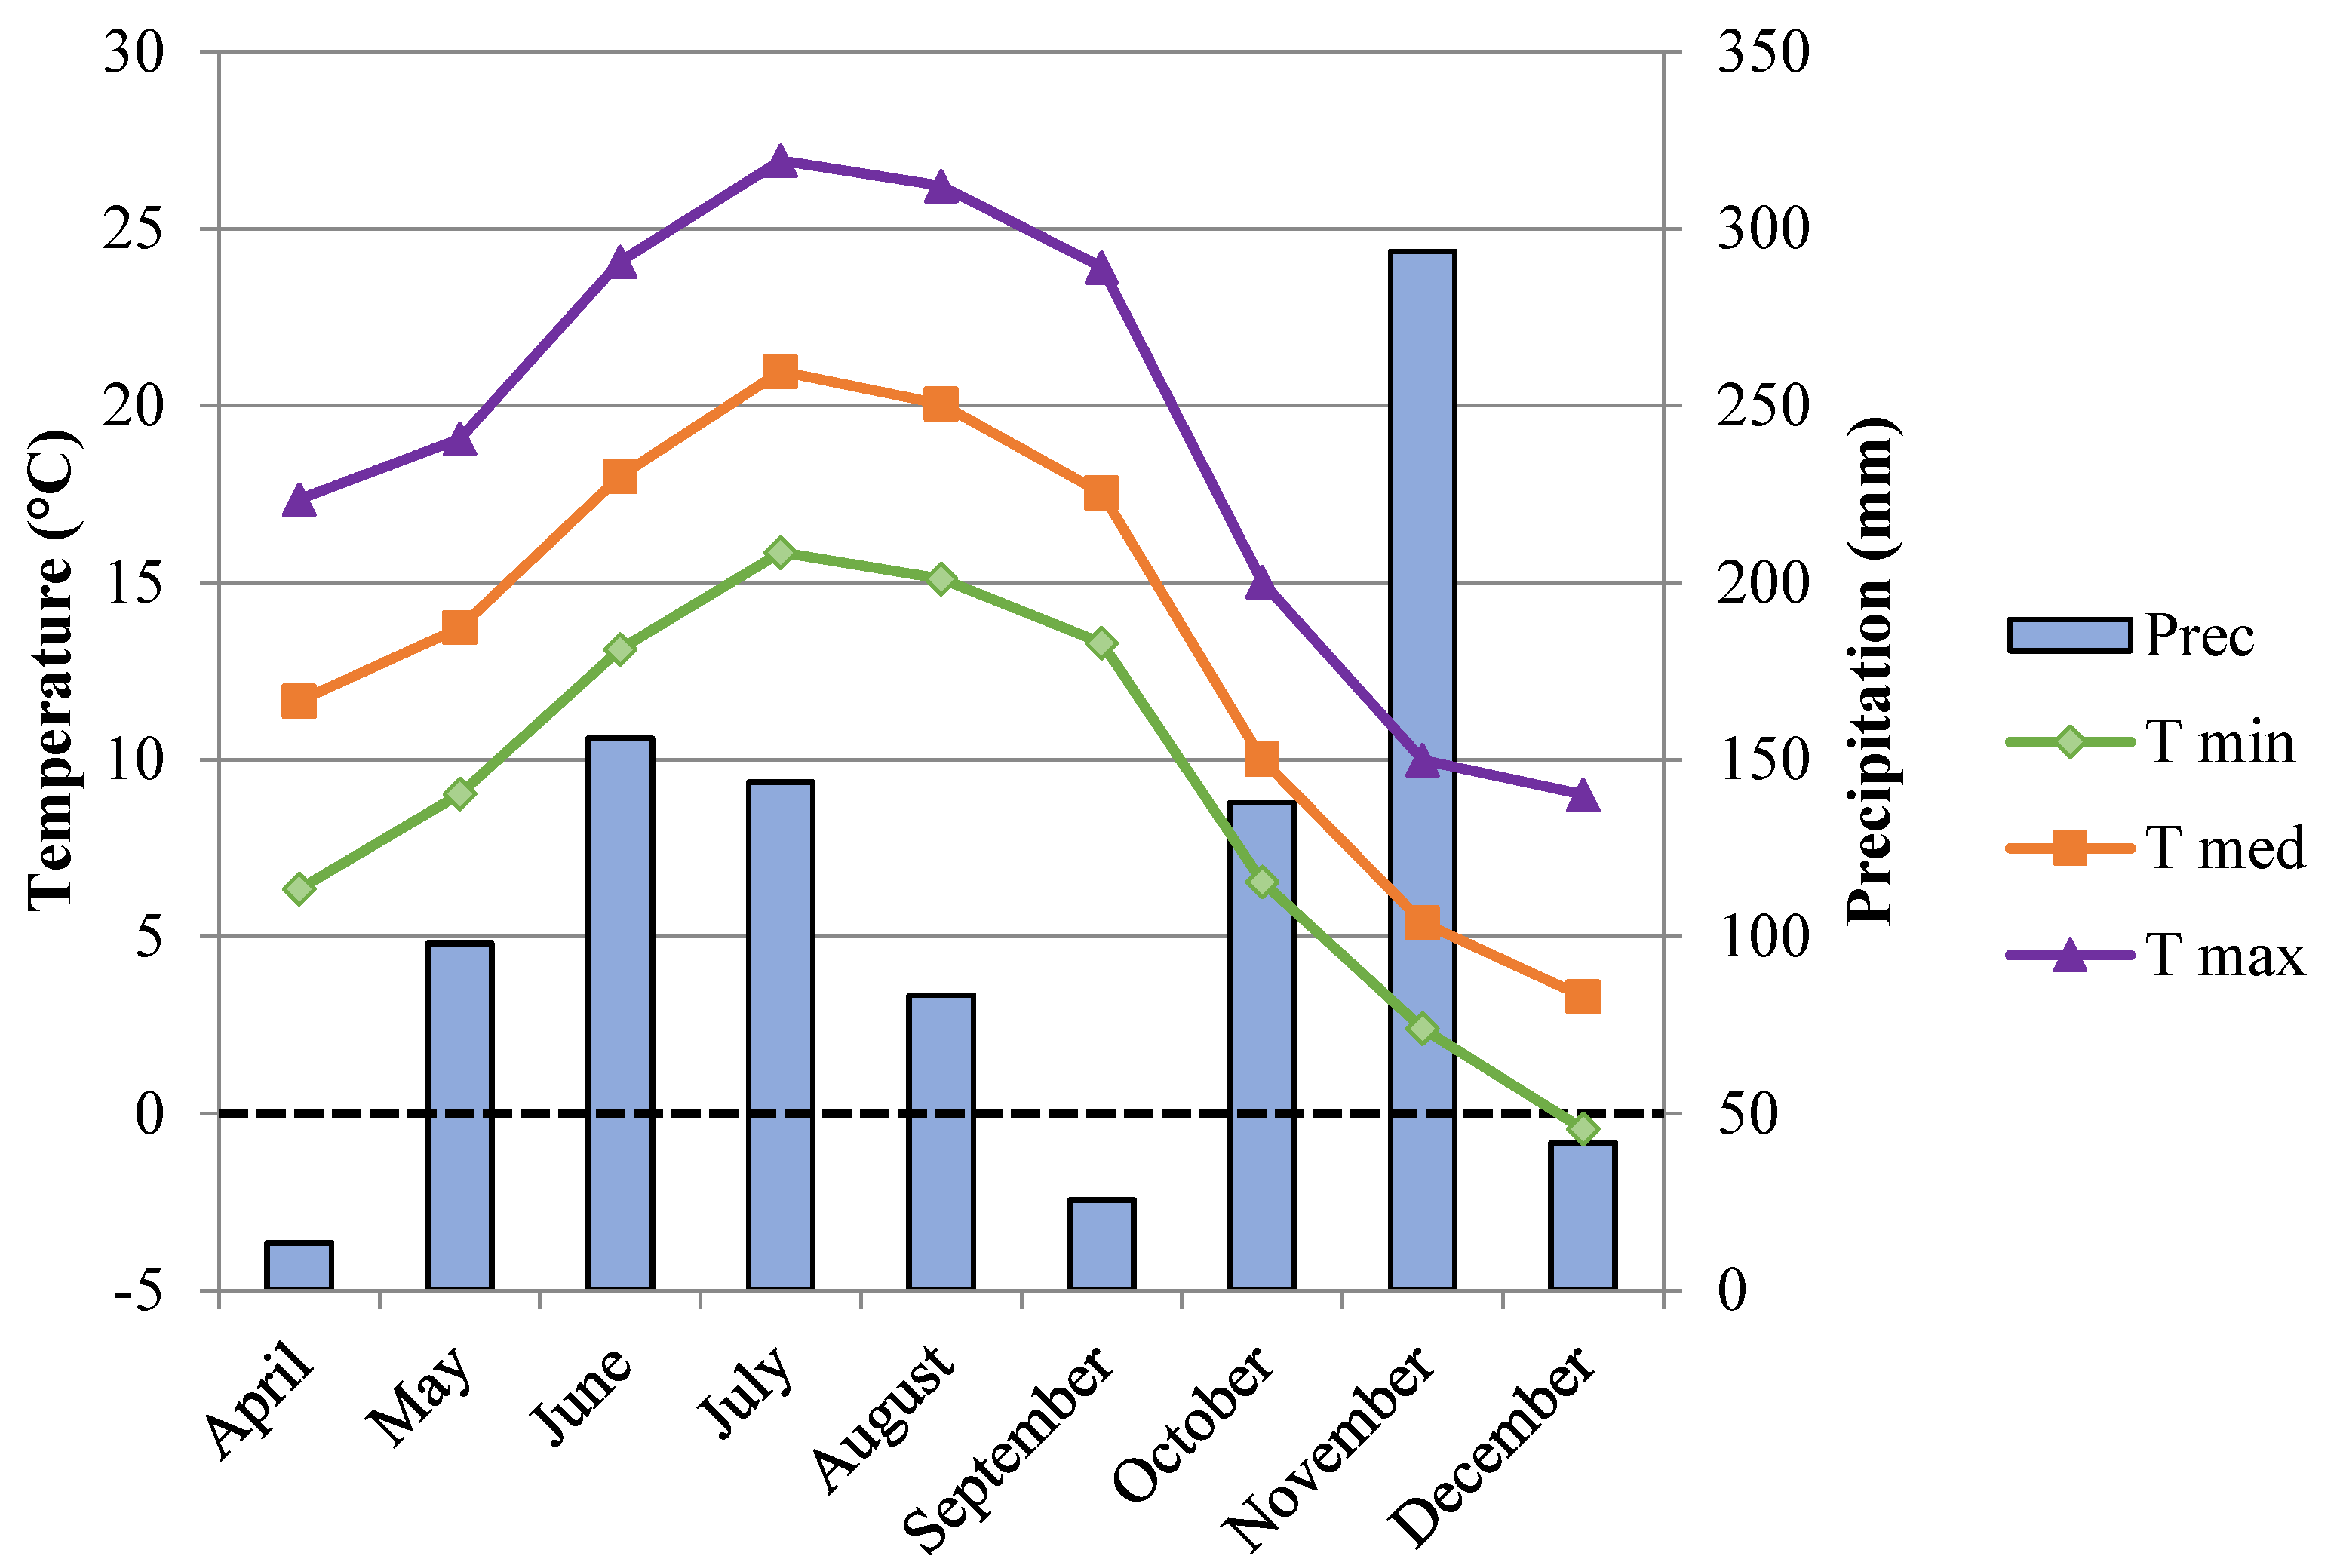
2.1. Plant Material and Sampling Site
2.2. Sample Preparation
2.3. Sensory Analysis
2.4. Extraction Protocols
2.5. Spectrophotometric Analysis
2.6. Chromatographic Analysis
2.7. Data Analysis
3. Results and Discussion
3.1. Sensory Analysis
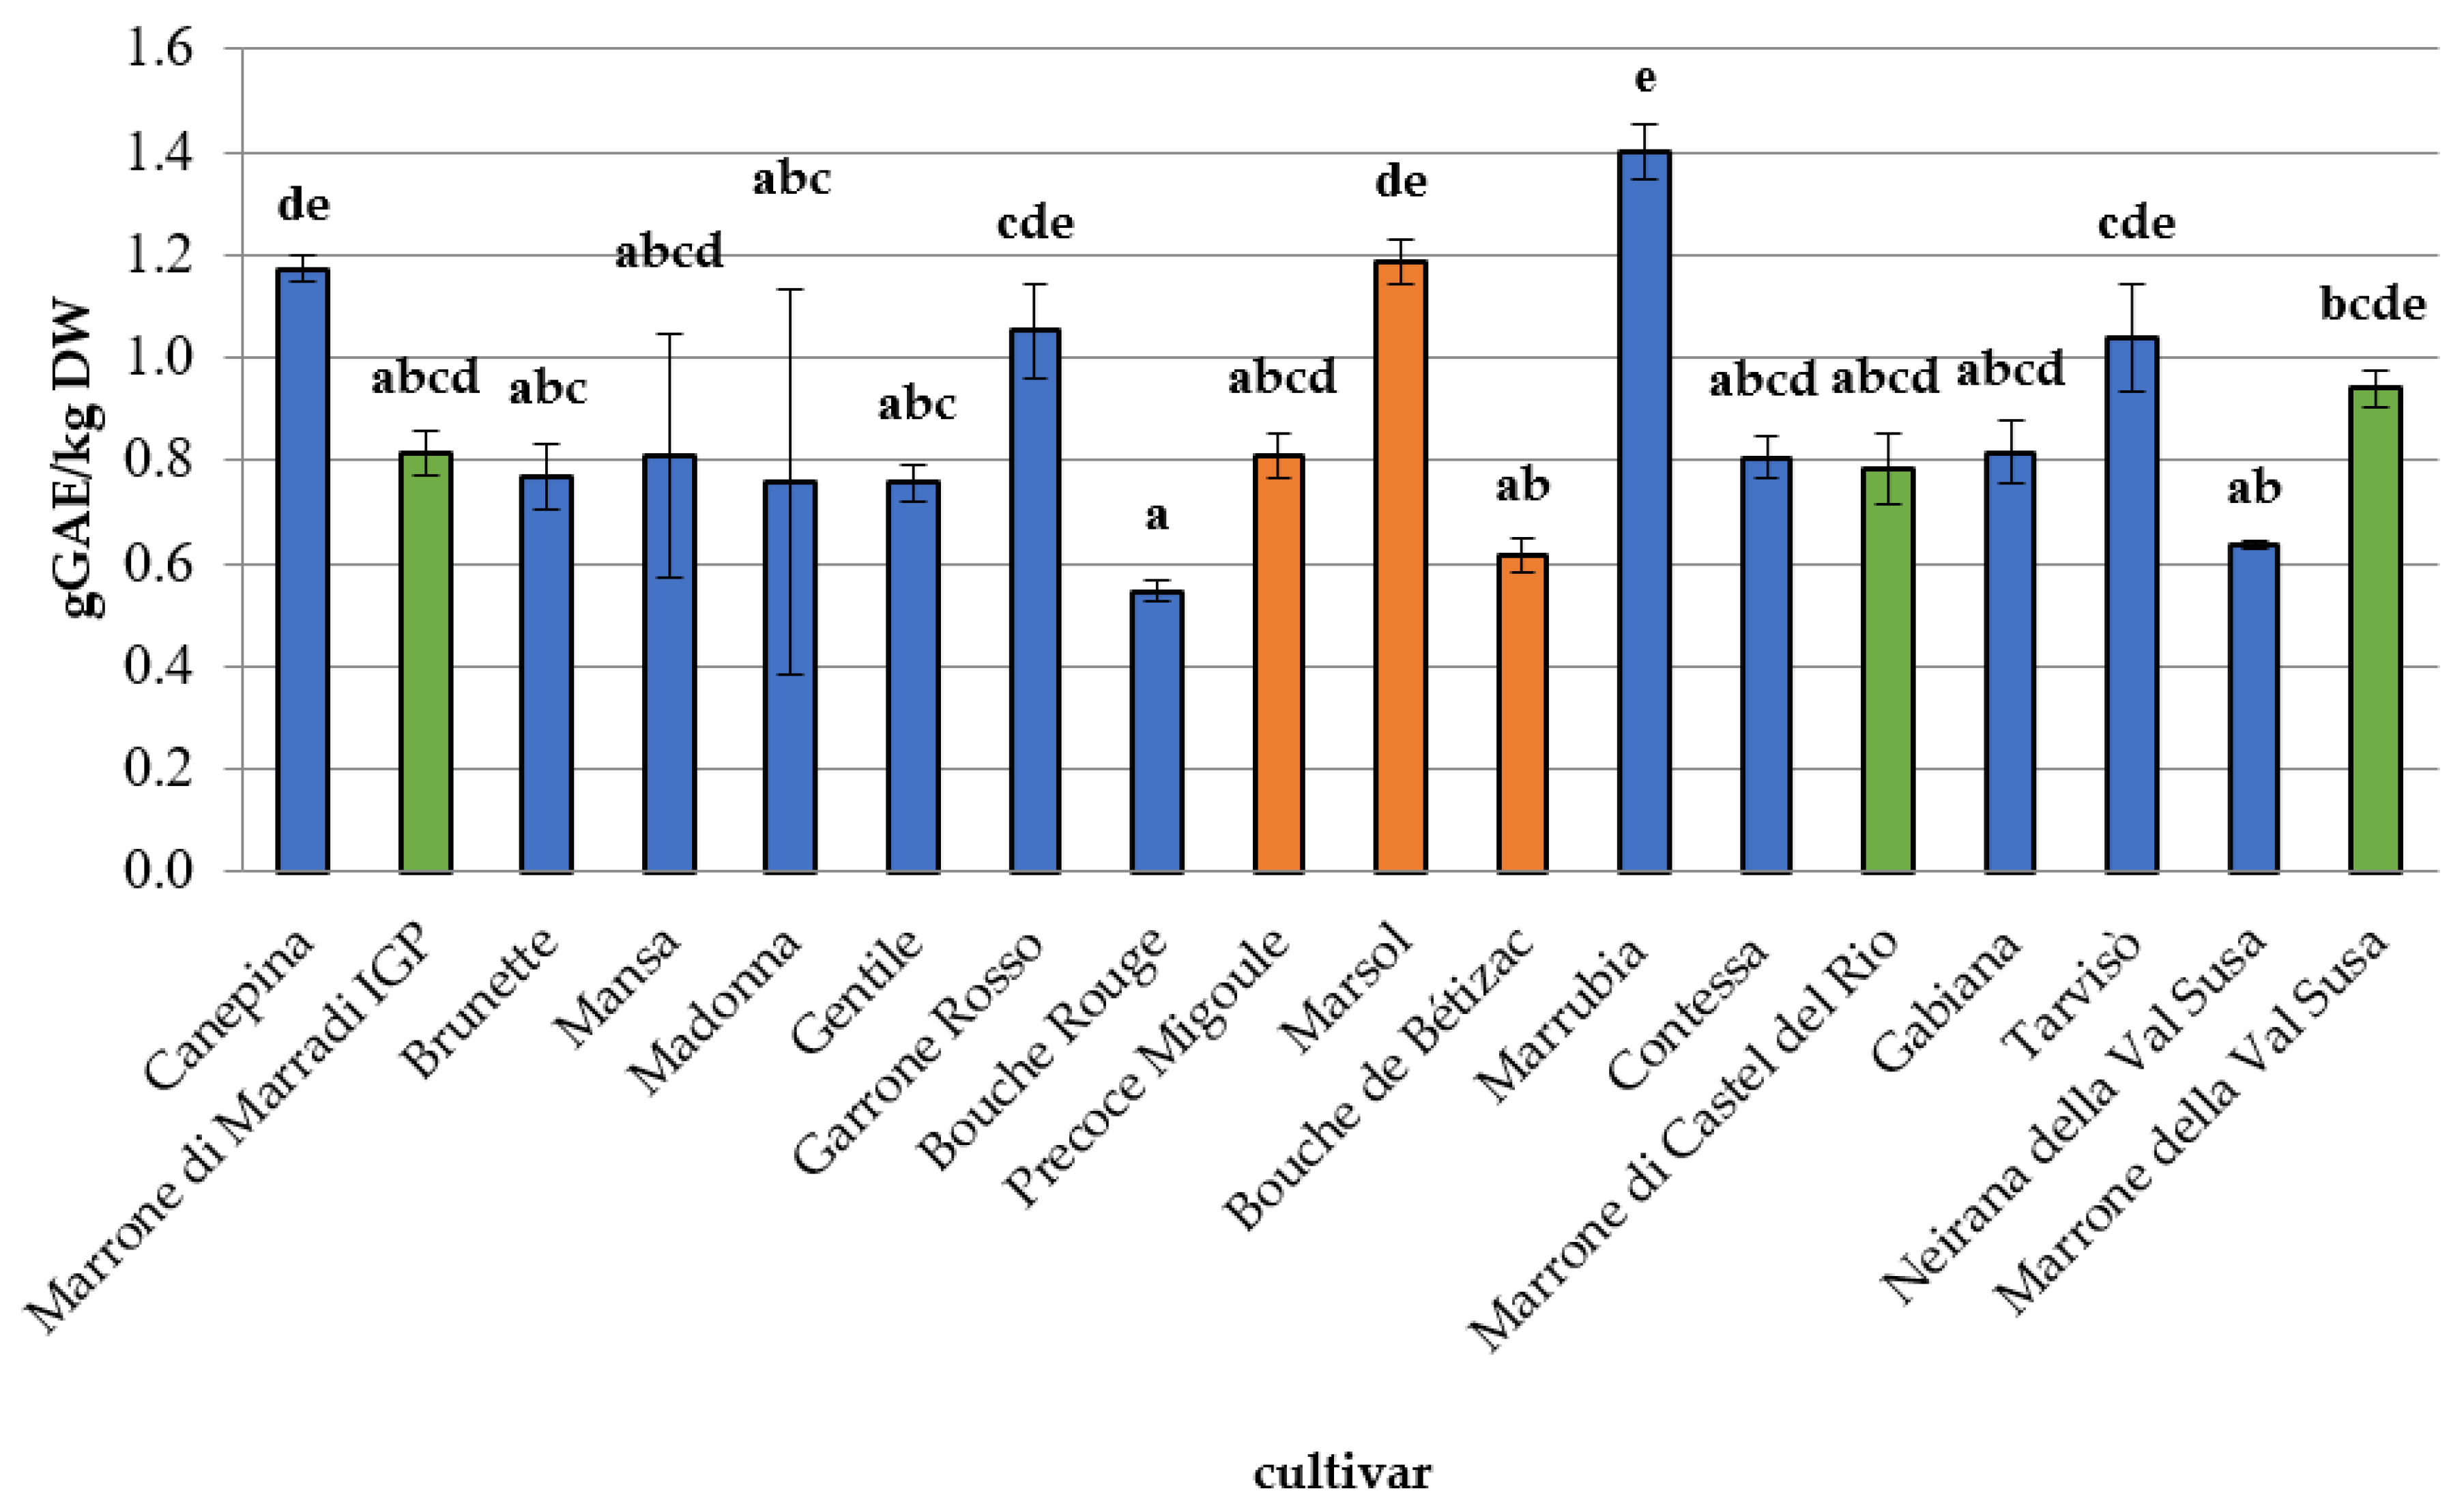
3.2. Phytochemical Composition, Antioxidant Capacity, and Nutritional Properties
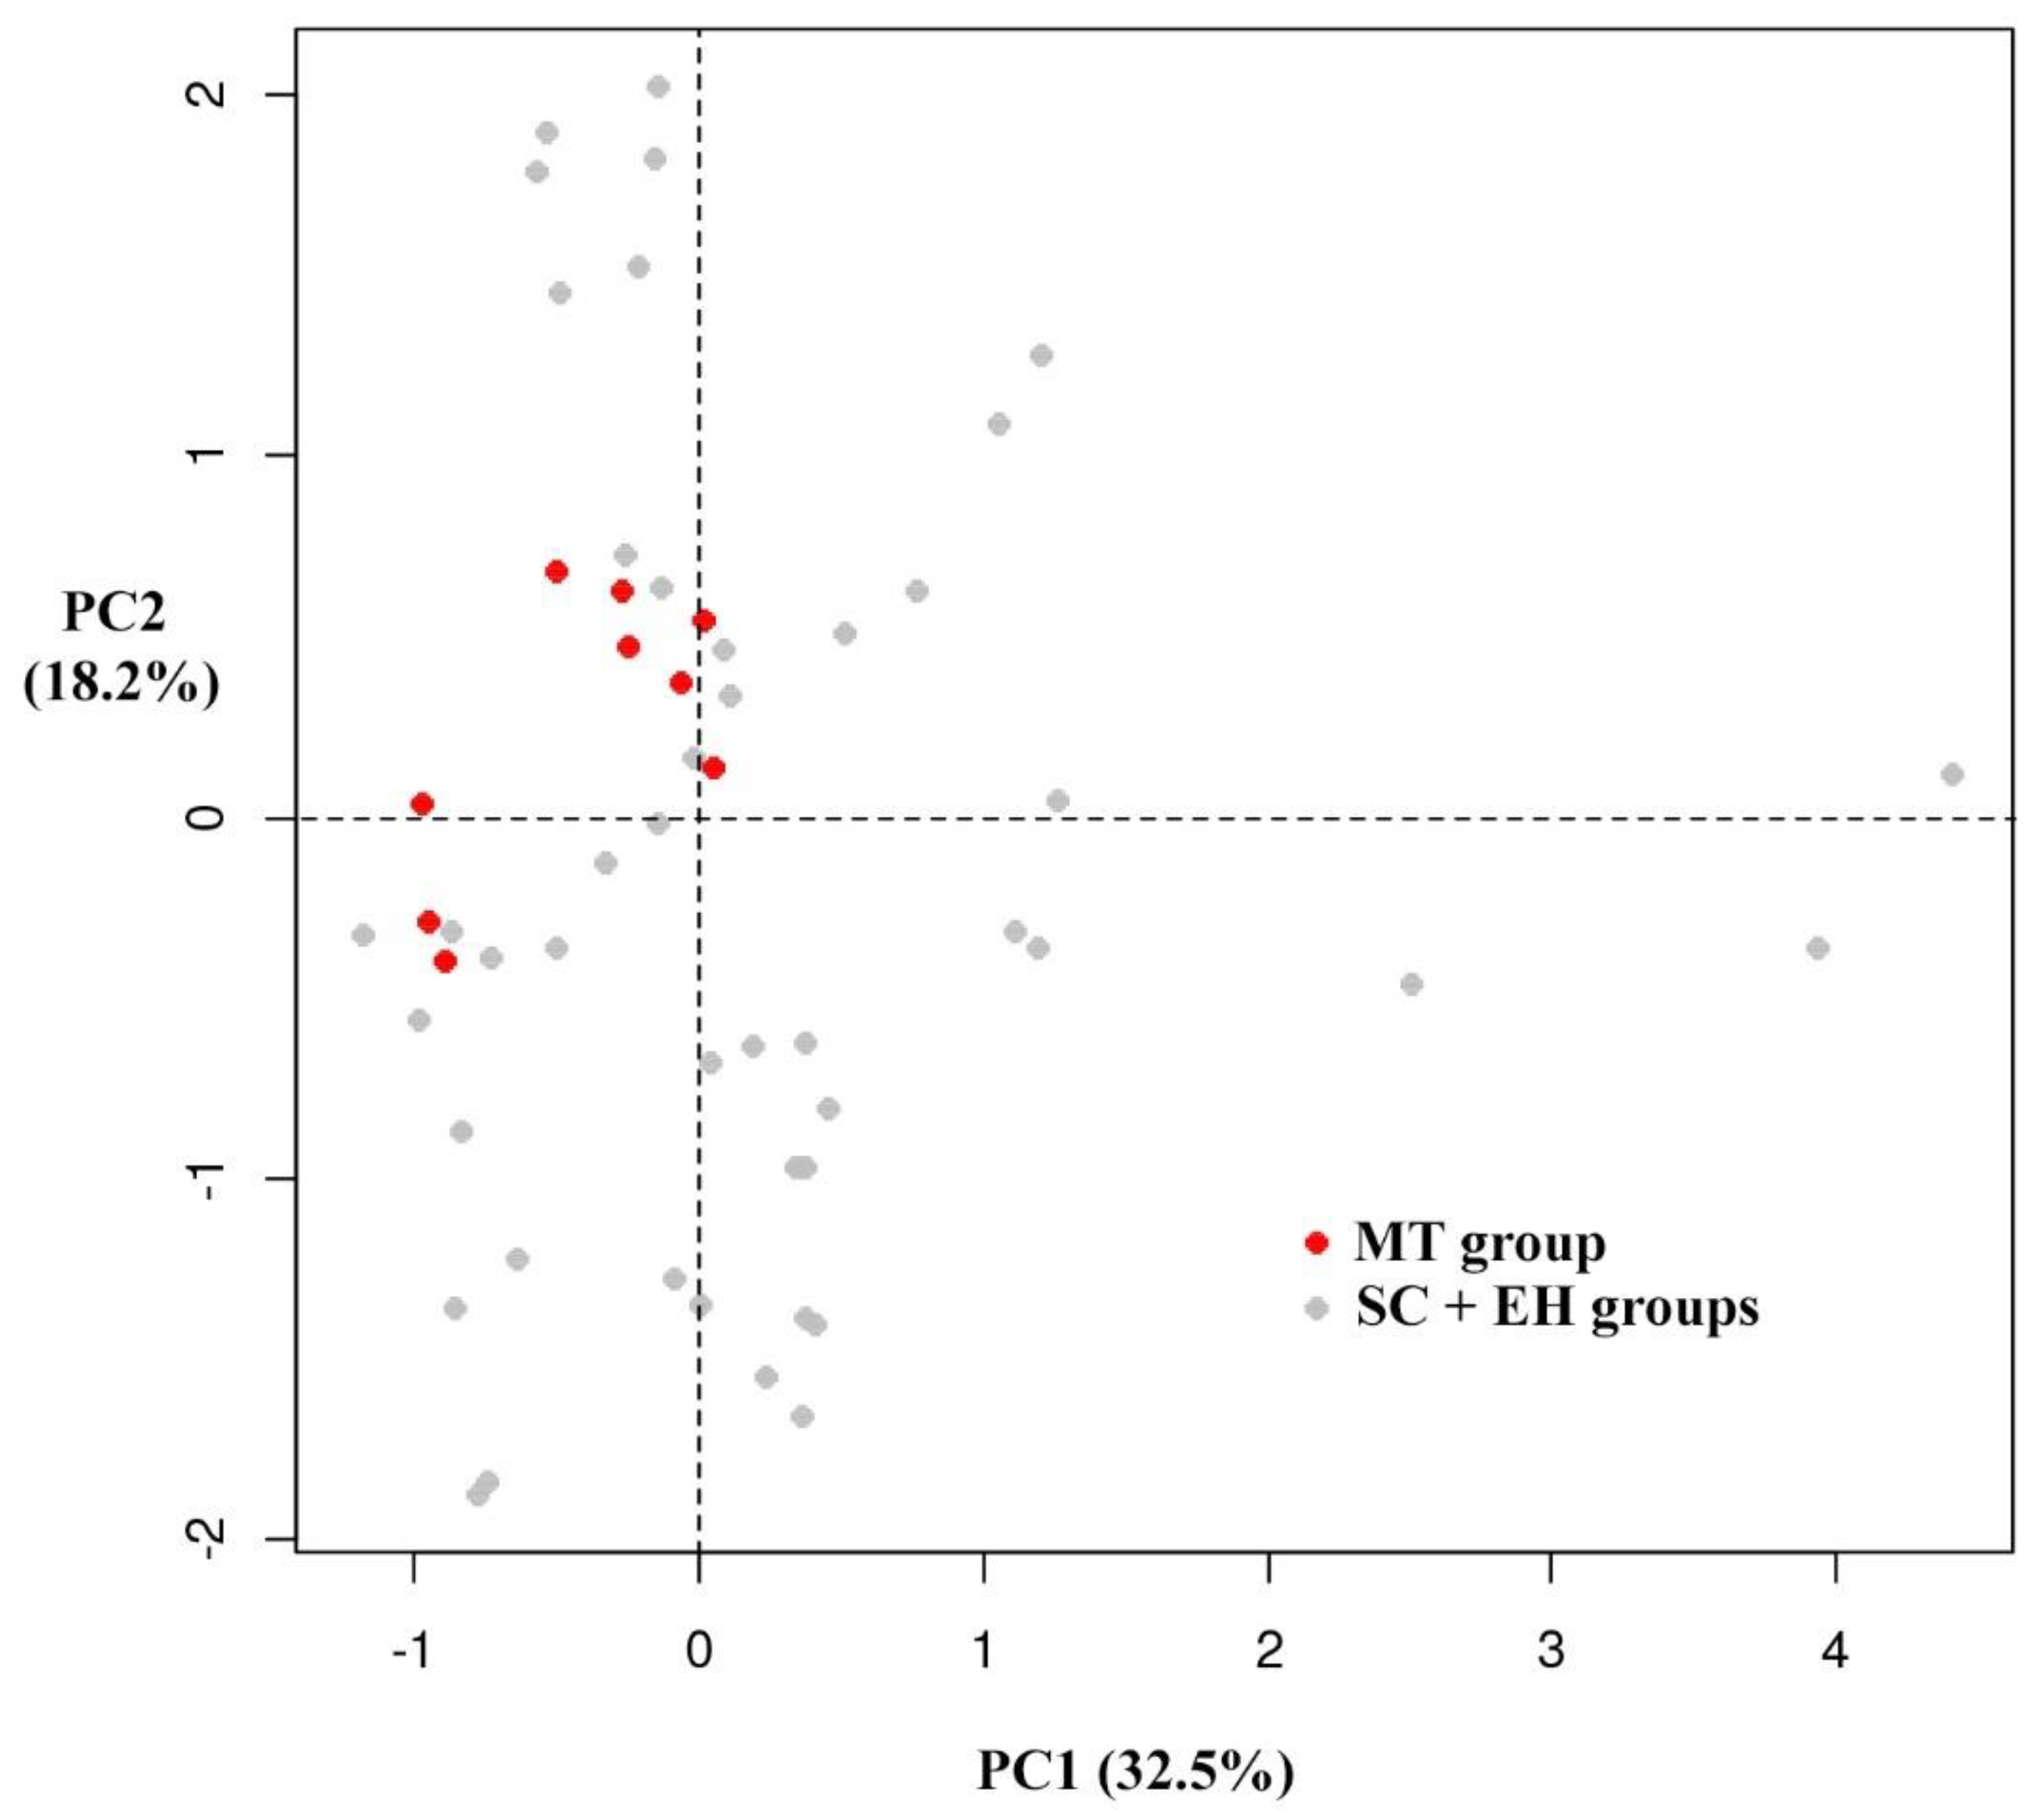
3.3. Multivariate Analysis
4. Conclusions
Supplementary Materials
Author Contributions
Funding
Conflicts of Interest
References
- Fischer, J.; Lindenmayer, D.B. Landscape modification and habitat fragmentation: A synthesis. Glob. Ecol. Biogeogr. 2007, 16, 265–280. [Google Scholar] [CrossRef]
- Beccaro, G.; Alma, A.; Bounous, G.; Gomes-Laranjo, J. The Chestnut Handbook: Crop & Forest Management; CRC Press: Boca Raton, FL, USA, 2019. [Google Scholar]
- Martín, M.A.; Mattioni, C.; Cherubini, M.; Villani, F.; Martín, L.M. A comparative study of European chestnut varieties in relation to adaptive markers. Agrofor. Syst. 2017, 91, 97–109. [Google Scholar] [CrossRef]
- Mellano, M.; Beccaro, G.; Donno, D.; Marinoni, D.T.; Boccacci, P.; Canterino, S.; Cerutti, A.; Bounous, G. Castanea spp. biodiversity conservation: Collection and characterization of the genetic diversity of an endangered species. Genet. Resour. Crop Evol. 2012, 59, 1727–1741. [Google Scholar] [CrossRef]
- Pitte, J.-R. Terres de Castanide: Hommes et Paysages du Châtaignier de L’Antiquité à nos Jours; Fayard: Paris, France, 1986. [Google Scholar]
- Bounous, G. Il Castagno: Coltura, Ambiente ed Utilizzazioni in Italia e nel Mondo; Edagricole: Bologna, Italy, 2002. [Google Scholar]
- Conedera, M.; Krebs, P.; Tinner, W.; Pradella, M.; Torriani, D. The cultivation of Castanea sativa (Mill.) in Europe, from its origin to its diffusion on a continental scale. Veg. Hist. Archaeobotany 2004, 13, 161–179. [Google Scholar] [CrossRef]
- Agnoletti, M. The degradation of traditional landscape in a mountain area of Tuscany during the 19th and 20th centuries: Implications for biodiversity and sustainable management. For. Ecol. Manag. 2007, 249, 5–17. [Google Scholar] [CrossRef]
- Bounous, G. The chestnut: A multipurpose resource for the new millennium. In Proceedings of the III International Chestnut Congress, Chaves, Portugal, 20–23 October 2004; pp. 33–40. [Google Scholar]
- Conedera, M.; Manetti, M.; Giudici, F.; Amorini, E. Distribution and economic potential of the Sweet chestnut (Castanea sativa Mill.) in Europe. Ecol. Mediterr. 2004, 30, 179–193. [Google Scholar]
- Gullino, P.; Larcher, F.; Devecchi, M. The importance of the chestnut cultivation and its evolution in the piedmont landscape (North-West Italy). In Proceedings of the I European Congress on Chestnut-Castanea, Cuneo, Italy, 13–16 October 2009; pp. 37–42. [Google Scholar]
- Spathelf, P.; Van Der Maaten, E.; Van Der Maaten-Theunissen, M.; Campioli, M.; Dobrowolska, D. Climate change impacts in European forests: The expert views of local observers. Ann. For. Sci. 2014, 71, 131–137. [Google Scholar] [CrossRef]
- Lione, G.; Danti, R.; Fernandez-Conradi, P.; Ferreira-Cardoso, J.; Lefort, F.; Marques, G.; Meyer, J.; Prospero, S.; Radócz, L.; Robin, C. The emerging pathogen of chestnut Gnomoniopsis castaneae: The challenge posed by a versatile fungus. Eur. J. Plant Pathol. 2019, 153, 671–685. [Google Scholar] [CrossRef]
- Rigling, D.; Prospero, S. Cryphonectria parasitica, the causal agent of chestnut blight: Invasion history, population biology and disease control. Mol. Plant Pathol. 2018, 19, 7–20. [Google Scholar] [CrossRef]
- Sartor, C.; Dini, F.; Marinoni, D.T.; Mellano, M.; Beccaro, G.; Alma, A.; Quacchia, A.; Botta, R. Impact of the Asian wasp Dryocosmus kuriphilus (Yasumatsu) on cultivated chestnut: Yield loss and cultivar susceptibility. Sci. Hortic. 2015, 197, 454–460. [Google Scholar] [CrossRef]
- Vettraino, A.; Morel, O.; Perlerou, C.; Robin, C.; Diamandis, S.; Vannini, A. Occurrence and distribution of Phytophthora species in European chestnut stands, and their association with Ink Disease and crown decline. Eur. J. Plant Pathol. 2005, 111, 169. [Google Scholar] [CrossRef]
- Turchetti, T.; Maresi, G. Biological control of chestnut diseases in Italy: Effectiveness of blight and ink disease management. In Proceedings of the International Workshop on Chestnut Management in Mediterranean Countries-Problems and Prospects, Bursa, Turkey, 23–25 October 2007; pp. 253–260. [Google Scholar]
- Anagnostakis, S.L. Chestnut breeding in the United States for disease and insect resistance. Plant Dis. 2012, 96, 1392–1403. [Google Scholar] [CrossRef] [PubMed]
- Lauteri, M.; Monteverdi, M.; Scarascia-Mugnozza, G. Preservation of chestnut (Castanea sativa Mill.) genetic resources and Adaptive potential in relation to environmental changes. In Proceedings of the I European Congress on Chestnut-Castanea, Cuneo, Italy, 13–16 October 2009; pp. 677–682. [Google Scholar]
- Mattioni, C.; Martin, M.A.; Chiocchini, F.; Cherubini, M.; Gaudet, M.; Pollegioni, P.; Velichkov, I.; Jarman, R.; Chambers, F.M.; Paule, L. Landscape genetics structure of European sweet chestnut (Castanea sativa Mill): Indications for conservation priorities. Tree Genet. Genomes 2017, 2, 1–14. [Google Scholar] [CrossRef]
- De Vasconcelos, M.C.; Bennett, R.N.; Rosa, E.A.; Ferreira-Cardoso, J.V. Composition of European chestnut (Castanea sativa Mill.) and association with health effects: Fresh and processed products. J. Sci. Food Agric. 2010, 90, 1578–1589. [Google Scholar] [CrossRef]
- Donno, D.; Beccaro, G.L.; Mellano, M.G.; Bonvegna, L.; Bounous, G. Castanea spp. buds as a phytochemical source for herbal preparations: Botanical fingerprint for nutraceutical identification and functional food standardisation. J. Sci. Food Agric. 2014, 94, 2863–2873. [Google Scholar] [CrossRef]
- Botta, R.; Marinoni, D.; Beccaro, G.; Akkak, A.; Bounous, G. Development of a DNA typing technique for the genetic certification of chestnut cultivars. For. Snow Landsc. Res. 2001, 76, 425–428. [Google Scholar]
- Donno, D.; Cerutti, A.; Prgomet, I.; Mellano, M.; Beccaro, G. Foodomics for mulberry fruit (Morus spp.): Analytical fingerprint as antioxidants‘ and health properties‘ determination tool. Food Res. Int. 2015, 69, 179–188. [Google Scholar] [CrossRef]
- Marinoni, D.; Akkak, A.; Bounous, G.; Edwards, K.J.; Botta, R. Development and characterization of microsatellite markers in Castanea sativa (Mill.). Mol. Breed. 2003, 11, 127–136. [Google Scholar] [CrossRef]
- Botta, R.; Guaraldo, P.; Bounous, G.; Akkak, A.; Mellano, M. DNA Typing and Quality Evaluation of Chestnut (“Castanea sativa” Mill.) Cultivars. Adv. Hortic. Sci. 2006, 20, 96–100. [Google Scholar]
- Boccacci, P.; Canterino, S.; Torello Marinoni, D.; Mellano, M.; Beccaro, G.; Bounous, G. Genetic characterization of chestnut accessions from ‘Centro Regionale di Castanicoltura’ (Cuneo, Italy). In Proceedings of the I European Congress on Chestnut-Castanea, Cuneo, Italy, 13–16 October 2009; pp. 97–101. [Google Scholar]
- Piggott, J.R.; Simpson, S.J.; Williams, S.A. Sensory analysis. Int. J. Food Sci. Technol. 1998, 33, 7–12. [Google Scholar] [CrossRef]
- Donno, D.; Beccaro, G.; Mellano, M.; Torello Marinoni, D.; Cerutti, A.; Canterino, S.; Bounous, G. Application of sensory, nutraceutical and genetic techniques to create a quality profile of ancient apple cultivars. J. Food Qual. 2012, 35, 169–181. [Google Scholar] [CrossRef]
- Mellano, M.G.; Rapalino, S.; Donno, D. Sensory profiles of Castanea sativa cultivars and eurojapanese hybrids. Castanea 2017, 2, 8–9. [Google Scholar]
- Mellano, M.; Bounous, G.; Botta, G. Valutazione mediante analisi sensoriale di cultivar piemontesi di castagno. Italus Hortus 2005, 12, 64. [Google Scholar]
- Zeppa, G.; Rolle, L.; Gerbi, V. Studio per la caratterizzazione dei prodotti tradizionali regionali. Il Marrone della Valle di Susa. Quad. della Reg. Piemonte 2003, 38, 35–39. [Google Scholar]
- Cartier, R.; Rytz, A.; Lecomte, A.; Poblete, F.; Krystlik, J.; Belin, E.; Martin, N. Sorting procedure as an alternative to quantitative descriptive analysis to obtain a product sensory map. Food Qual. Prefer. 2006, 17, 562–571. [Google Scholar] [CrossRef]
- Lima, V.; Melo, E.A.; Maciel, M.I.S.; Prazeres, F.G.; Musser, R.S.; Lima, D.E.S. Total phenolic and carotenoid contents in acerola genotypes harvested at three ripening stages. Food Chem. 2005, 90, 565–568. [Google Scholar] [CrossRef]
- Benzie, I.F.; Strain, J. Ferric reducing/antioxidant power assay: Direct measure of total antioxidant activity of biological fluids and modified version for simultaneous measurement of total antioxidant power and ascorbic acid concentration. Methods Enzymol. 1999, 299, 15–27. [Google Scholar]
- Slinkard, K.; Singleton, V.L. Total Phenol Analysis: Automation and Comparison with Manual Methods. Am. J. Enol. Vitic. 1977, 28, 49–55. [Google Scholar]
- Donno, D.; Mellano, M.G.; Prgomet, Z.; Beccaro, G.L. Advances in Ribes x nidigrolaria Rud. Bauer and A. Bauer fruits as potential source of natural molecules: A preliminary study on physico-chemical traits of an underutilized berry. Sci. Hortic. 2018, 237, 20–27. [Google Scholar] [CrossRef]
- Soifoini, T.; Donno, D.; Jeannoda, V.; Rakotoniaina, E.; Hamidou, S.; Achmet, S.M.; Solo, N.R.; Afraitane, K.; Giacoma, C.; Beccaro, G.L. Bioactive compounds, nutritional traits, and antioxidant properties of Artocarpus altilis (Parkinson) fruits: Exploiting a potential functional food for food security on the Comoros Islands. J. Food Qual. 2018, in press. [Google Scholar] [CrossRef]
- Crawley, M. The R book, 2nd ed.; John Wiley & Sons. Ltd.: Chichester, UK, 2013. [Google Scholar]
- Field, A. Discovering Statistics Using IBM SPSS Statistics; SAGE: Thousand Oaks, CA, USA, 2013. [Google Scholar]
- Dinç, İ.; Sigdel, M.; Dinç, S.; Sigdel, M.S.; Pusey, M.L.; Aygün, R.S. Evaluation of normalization and pca on the performance of classifiers for protein crystallization images. In Proceedings of the IEEE Southeastcon, Lexington, KY, USA, 10 November 2014; pp. 1–6. [Google Scholar]
- Lione, G.; Giordano, L.; Sillo, F.; Gonthier, P. Testing and modelling the effects of climate on the incidence of the emergent nut rot agent of chestnut Gnomoniopsis castanea. Plant Pathol. 2015, 64, 852–863. [Google Scholar] [CrossRef]
- Lione, G.; Gonthier, P. A permutation-randomization approach to test the spatial distribution of plant diseases. Phytopathology 2016, 106, 19–28. [Google Scholar] [CrossRef] [PubMed]
- Clark, P.J.; Evans, F.C. Distance to nearest neighbor as a measure of spatial relationships in populations. Ecology 1954, 35, 445–453. [Google Scholar] [CrossRef]
- Hothorn, T.; Hornik, K.; Zeileis, A. Unbiased recursive partitioning: A conditional inference framework. J. Comput. Graph. Stat. 2006, 15, 651–674. [Google Scholar] [CrossRef]
- Hothorn, T.; Zeileis, A. partykit: A modular toolkit for recursive partytioning in R. J. Mach. Learn. Res. 2015, 16, 3905–3909. [Google Scholar]
- Team, R.C. R: A Language and Environment Statistical Computing; R Foundation for Statistical Computing: Vienna, Austria, 2019. [Google Scholar]
- Warmund, M.R.; Elmore, J.R.; Adhikari, K.; McGraw, S. Descriptive sensory analysis and free sugar contents of chestnut cultivars grown in North America. J. Sci. Food Agric. 2011, 91, 1940–1945. [Google Scholar] [CrossRef]
- Künsch, U.; Schärer, H.; Patrian, B.; Höhn, E.; Conedera, M.; Sassella, A.; Jermini, M.; Jelmini, G. Effects of roasting on chemical composition and quality of different chestnut (Castanea sativa Mill) varieties. J. Sci. Food Agric. 2001, 81, 1106–1112. [Google Scholar] [CrossRef]
- Künsch, U.; Schärer, H.; Patrian, B.; Hurter, J.; Conedera, M.; Sassella, A.; Jermini, M.; Jelmini, G. Quality assessment of chestnut fruits. In Proceedings of the II International Symposium on Chestnut, Bordeaux, France, 19–23 October 1998; pp. 119–128. [Google Scholar]
- De Biaggi, M.; Rapalino, S.; Donno, D.; Mellano, M.G.; Beccaro, G.L. Genotype influence on chemical composition and sensory traits of chestnut in 18 cultivars grown on the same rootstock and at the same agronomic conditions. In Proceedings of the VI International Chestnut Symposium, Samsun, Turkey, 9–13 October 2017; pp. 215–220. [Google Scholar]
- Mellano, M.; Beccaro, G.; Bounous, G.; Trasino, C.; Barrel, A. Morpho-biological and sensorial quality evaluation of chestnut cultivars in Aosta Valley (Italy). In Proceedings of the International Workshop on Chestnut Management in Mediterranean Countries-Problems and Prospects, Bursa, Turkey, 23–25 October 2007; pp. 125–132. [Google Scholar]
- Rodríguez, L.; Cuenca, B.; Pato, B.; Cámara, M.; Ocaña, L. Cost and efficiency of propagating Castanea sativa hybrids in vitro and by cutting in a commercial nursery. In Proceedings of the III International Chestnut Congress, Chaves, Portugal, 20–23 October 2004; pp. 305–312. [Google Scholar]
- Isabelle, M.; Lee, B.L.; Lim, M.T.; Koh, W.P.; Huang, D.J.; Ong, C.N. Antioxidant activity and profiles of common fruits in Singapore. Food Chem. 2010, 123, 77–84. [Google Scholar] [CrossRef]
- Korel, F.; Balaban, M.Ö. Chemical Composition and Health Aspects of Chestnut (Castanea spp.). Tree Nuts: Compos. Phytochem. Health Eff. 2008. [Google Scholar] [CrossRef]
- Zhu, F. Properties and Food Uses of Chestnut Flour and Starch. Food Bioprocess Technol. 2017, 10, 1173–1191. [Google Scholar] [CrossRef]
- Alasalvar, C.; Shahidi, F. Tree Nuts: Composition, Phytochemicals, and Health Effects; CRC Press: Boca Raton, FL, USA, 2008. [Google Scholar]
- Esposito, T.; Celano, R.; Pane, C.; Piccinelli, A.L.; Sansone, F.; Picerno, P.; Zaccardelli, M.; Aquino, R.P.; Mencherini, T. Chestnut (Castanea sativa Miller.) Burs Extracts and Functional Compounds: UHPLC-UV-HRMS Profiling, Antioxidant Activity, and Inhibitory Effects on Phytopathogenic Fungi. Molecules 2019, 24, 302. [Google Scholar] [CrossRef] [PubMed]
- De Vasconcelos, M.D.C.B.M.; Bennett, R.N.; Rosa, E.A.S.; Cardoso, J.V.F. Primary and Secondary Metabolite Composition of Kernels from Three Cultivars of Portuguese Chestnut (Castanea sativa Mill.) at Different Stages of Industrial Transformation. J. Agric. Food Chem. 2007, 55, 3508–3516. [Google Scholar] [CrossRef]
- Donno, D.; Mellano, M.G.; De Biaggi, M.; Riondato, I.; Rakotoniaina, E.N.; Beccaro, G.L. New Findings in Prunus padus L. Fruits as a Source of Natural Compounds: Characterization of Metabolite Profiles and Preliminary Evaluation of Antioxidant Activity. Molecules (Basel, Switz.) 2018, 23, 725. [Google Scholar] [CrossRef]
- de Cassia da Silveira e Sa, R.; Andrade, L.N.; de Sousa, D.P. A review on anti-inflammatory activity of monoterpenes. Molecules 2013, 18, 1227–1254. [Google Scholar] [CrossRef]
- de Vasconcelos, M.; Bennett, R.N.; Quideau, S.; Jacquet, R.; Rosa, E.A.S.; Ferreira-Cardoso, J.V. Evaluating the potential of chestnut (Castanea sativa Mill.) fruit pericarp and integument as a source of tocopherols, pigments and polyphenols. Ind. Crop. Prod. 2010, 31, 301–311. [Google Scholar] [CrossRef]
- Ghirardello, D.; Bertolino, M.; Belviso, S.; Dal Bello, B.; Giordano, M.; Rolle, L.; Gerbi, V.; Antonucci, M.; Spigolon, N.; Zeppa, G. Phenolic composition, antioxidant capacity and hexanal content of hazelnuts (Corylus avellana L.) as affected by different storage conditions. Postharvest Biol. Technol. 2016, 112, 95–104. [Google Scholar] [CrossRef]
- Slatnar, A.; Mikulic-Petkovsek, M.; Stampar, F.; Veberic, R.; Solar, A. HPLC-MSn identification and quantification of phenolic compounds in hazelnut kernels, oil and bagasse pellets. Food Res. Int. 2014, 64, 783–789. [Google Scholar] [CrossRef]
- Pereira, J.A.; Oliveira, I.; Sousa, A.; Ferreira, I.C.F.R.; Bento, A.; Estevinho, L. Bioactive properties and chemical composition of six walnut (Juglans regia L.) cultivars. Food Chem. Toxicol. 2008, 46, 2103–2111. [Google Scholar] [CrossRef]
- Seeram, N.P. Berry fruits: Compositional elements, biochemical activities, and the impact of their intake on human health, performance, and disease. J. Agric. Food Chem. 2008, 56, 627–629. [Google Scholar] [CrossRef]
- Ammar, I.; Ennouri, M.; Bouaziz, M.; Ben Amira, A.; Attia, H. Phenolic Profiles, Phytchemicals and Mineral Content of Decoction and Infusion of Opuntia ficus-indica Flowers. Plant Food Hum. Nutr. 2015, 70, 388–394. [Google Scholar] [CrossRef]
- Del Rio, D.; Rodriguez-Mateos, A.; Spencer, J.P.; Tognolini, M.; Borges, G.; Crozier, A. Dietary (poly) phenolics in human health: Structures, bioavailability, and evidence of protective effects against chronic diseases. Antioxid. Redox Signal. 2013, 18, 1818–1892. [Google Scholar] [CrossRef] [PubMed]
- Landete, J.M. Ellagitannins, ellagic acid and their derived metabolites: A review about source, metabolism, functions and health. Food Res. Int. 2011, 44, 1150–1160. [Google Scholar] [CrossRef]
- Papaefthimiou, D.; Papanikolaou, A.; Falara, V.; Givanoudi, S.; Kostas, S.; Kanellis, A.K. Genus Cistus: A model for exploring labdane-type diterpenes’ biosynthesis and a natural source of high value products with biological, aromatic, and pharmacological properties. Front. Chem. 2014, 2. [Google Scholar] [CrossRef] [PubMed]
- Trombetta, D.; Castelli, F.; Sarpietro, M.G.; Venuti, V.; Cristani, M.; Daniele, C.; Saija, A.; Mazzanti, G.; Bisignano, G. Mechanisms of antibacterial action of three monoterpenes. Antimicrob. Agents Chemother. 2005, 49, 2474–2478. [Google Scholar] [CrossRef]
- Neri, L.; Dimitri, G.; Sacchetti, G. Chemical composition and antioxidant activity of cured chestnuts from three sweet chestnut (Castanea sativa Mill.) ecotypes from Italy. J. Food Compos. Anal. 2010, 23, 23–29. [Google Scholar] [CrossRef]
- Crowell, P.L. Prevention and therapy of cancer by dietary monoterpenes. J. Nutr. 1999, 129, 775S–778S. [Google Scholar] [CrossRef]
- De Biaggi, M.; Donno, D.; Mellano, M.G.; Riondato, I.; Rakotoniaina, E.N.; Beccaro, G.L. Cornus mas (L.) Fruit as a Potential Source of Natural Health-Promoting Compounds: Physico-Chemical Characterisation of Bioactive Components. Plant Food Hum. Nutr. 2018, 73, 89–94. [Google Scholar] [CrossRef]
- Alasalvar, C.; Bolling, B.W. Review of nut phytochemicals, fat-soluble bioactives, antioxidant components and health effects. Br. J. Nutr. 2015, 113, S68–S78. [Google Scholar] [CrossRef]
- Köksal, A.İ.; Artik, N.; Şimşek, A.; Güneş, N. Nutrient composition of hazelnut (Corylus avellana L.) varieties cultivated in Turkey. Food Chem. 2006, 99, 509–515. [Google Scholar] [CrossRef]
- Ertürk, Ü.; Mert, C.; Soylu, A. Chemical composition of fruits of some important chestnut cultivars. Braz. Arch. Biol. Technol. 2006, 49, 183–188. [Google Scholar] [CrossRef]
- Delgado, T.; Pereira, J.A.; Ramalhosa, E.; Casal, S. Comparison of different drying methods on the chemical and sensory properties of chestnut (Castanea sativa M.) slices. Eur Food Res Technol 2017, 243, 1957–1971. [Google Scholar] [CrossRef]
- Moodley, R.; Kindness, A.; Jonnalagadda, S.B. Elemental composition and chemical characteristics of five edible nuts (almond, Brazil, pecan, macadamia and walnut) consumed in Southern Africa. J. Environ. Sci. Health Part B 2007, 42, 585–591. [Google Scholar] [CrossRef] [PubMed]
- Bernardez, M.M.; Miguelez, J.D.M.; Queijeiro, J.G. HPLC determination of sugars in varieties of chestnut fruits from Galicia (Spain). J. Food Compos. Anal. 2004, 17, 63–67. [Google Scholar] [CrossRef]
- Beccaro, G.; Bounous, G.; De Biaggi, M.; Donno, D.; Marinoni, D.T.; Zou, F.; Mellano, M.G. Botany, Anatomy, and Nut Composition. In The Chestnut Handbook; CRC Press: Boca Raton, FL, USA, 2019; pp. 5–34. [Google Scholar]
- Lamothe, L.M.; Lê, K.-A.; Samra, R.A.; Roger, O.; Green, H.; Macé, K. The scientific basis for healthful carbohydrate profile. Crit. Rev. food sci. Nutr. 2019, 59, 1058–1070. [Google Scholar] [CrossRef] [PubMed]
- Nicoletti, M. Nutraceuticals and botanicals: Overview and perspectives. Int. J. Food Sci. Nutr. 2012, 63 (Suppl. 1), 2–6. [Google Scholar] [CrossRef] [PubMed]
- Cirlini, M.; Dall’Asta, C.; Silvanini, A.; Beghe, D.; Fabbri, A.; Galaverna, G.; Ganino, T. Volatile fingerprinting of chestnut flours from traditional Emilia Romagna (Italy) cultivars. Food Chem. 2012, 134, 662–668. [Google Scholar] [CrossRef]
- Donno, D.; Beccaro, G.L.; Carlen, C.; Ancay, A.; Cerutti, A.K.; Mellano, M.G.; Bounous, G. Analytical fingerprint and chemometrics as phytochemical composition control tools in food supplement analysis: Characterization of raspberry bud-preparations of different cultivars. J. Sci. Food Agric. 2016, 96, 3157–3168. [Google Scholar] [CrossRef]
- Karabagias, I.K.; Koutsoumpou, M.; Liakou, V.; Kontakos, S.; Kontominas, M.G. Characterization and geographical discrimination of saffron from Greece, Spain, Iran, and Morocco based on volatile and bioactivity markers, using chemometrics. Eur. Food Res. Technol. 2017, 243, 1577–1591. [Google Scholar] [CrossRef]
- Lione, G.; Giordano, L.; Turina, M.; Gonthier, P. Hail-induced infections of the chestnut blight pathogen Cryphonectria parasitica depend on wound size and may lead to severe diebacks. Phytopathology 2020. [Google Scholar] [CrossRef]


| Category | Species | Cultivar | Nut | ID | Country |
|---|---|---|---|---|---|
| Sweet chestnut (SC) | C. sativa | Canepina |  | 78 | Italy |
| C. sativa | Brunette |  | 9 | Italy | |
| C. sativa | Mansa |  | 390 | Spain | |
| C. sativa | Madonna |  | 1 | Italy | |
| C. sativa | Gentile |  | 186 | Italy | |
| C. sativa | Garrone Rosso |  | 39 | Italy | |
| C. sativa | Bouche Rouge |  | 286 | France | |
| C. sativa | Marrubia |  | 215 | Italy | |
| C. sativa | Contessa |  | 30 | Italy | |
| C. sativa | Gabiana |  | 45 | Italy | |
| C. sativa | Neirana della Val di Susa |  | 218 | Italy | |
| C. sativa | Tarvisò |  | 25 | Italy | |
| Marrone-type chestnut (MT) | C. sativa | Marrone di Castel del Rio |  | 130 | Italy |
| C. sativa | Marrone di Marradi IGP |  | 198 | Italy | |
| C. sativa | Marrone della Val di Susa |  | 47 | Italy | |
| Euro-Japanese hybrid (EH) | C. sativa x C. crenata | Precoce Migoule |  | 258 | France |
| C. sativa x C. crenata | Marsol |  | 5 | France | |
| C. sativa x C. crenata | Bouche de Bétizac |  | 159 | France |
| Method | Compounds of Interest | Stationary Phase | Mobile Phase | Flow (mL min−1) | Wavelength (nm) |
|---|---|---|---|---|---|
| A | cinnamic acids, flavonols | KINETEX—C18 column (4.6 × 150 mm, 5 μm) | A: 10 mM KH2PO4/H3PO4, pH = 2.8 | 1.5 | 330 |
| B: CH3CN | |||||
| B | benzoic acids, catechins, | KINETEX—C18 column (4.6 × 150 mm, 5 μm) | A: H2O/CH3OH/HCOOH (5:95:0.1 v/v/v), pH = 2.5 | 0.6 | 280 |
| Tannins | B: CH3OH/HCOOH (100:0.1 v/v) | ||||
| C | monoterpenes | KINETEX—C18 column (4.6 × 150 mm, 5 μm) | A: H2O | 1.0 | 250 |
| B: CH3CN | |||||
| D | organic acids | KINETEX—C18 column (4.6 × 150 mm, 5 μm) | A: 10 mM KH2PO4/H3PO4, pH = 2.8 | 0.6 | 214 |
| B: CH3CN | |||||
| E | vitamins | KINETEX—C18 column (4.6 × 150 mm, 5 μm) | A: 5 mM C16H33N(CH3)3Br/50 mM KH2PO4, pH = 2.5 | 0.9 | 261, 348 |
| B: CH3OH | |||||
| F | sugars | SphereClone—NH2 column (4.6 × 250 mm, 5 μm) | A: H2O | 0.5 | 286 |
| B: CH3CN |
| Cultivar | Cv Type | ID | Ease of Peeling | Seed Colour | Intensity of Flavour | Intensity of Sweetness | Intensity of Saltiness | Intensity of Bitterness | Flouryness | Chestnut Aroma | Subjective Judgement |
|---|---|---|---|---|---|---|---|---|---|---|---|
| Bouche de Betizac *** | EH | 159 | 5.86 ± 2.14 ab | 2.64 ± 1.97 b | 3.71 ± 1.60 b | 6.07 ± 1.30 a | 1.43 ± 0.98 a | 0.29 ± 0.49 ab | 6.86 ±0.80 a | 6.00 ± 1.55 a | 5.43 ± 2.24 a |
| Brunette * | SC | 9 | 4.21 ± 2.12 abcd | 5.21 ± 0.99 ab | 3.93 ± 2.01 ab | 6.14 ± 0.85 abc | 1.43 ± 1.27 a | 0.21 ± 0.39 ab | 5.36 ± 1.93 ab | 5.50 ± 1.12 ab | 5.79 ± 1.07 abcd |
| Canepina * | SC | 78 | 3.43 ± 1.30 bcd | 4.93 ± 0.84 ab | 3.00 ± 1.15 b | 4.36 ± 1.18 b | 1.07 ± 1.02 a | 0.43 ± 0.79 ab | 6.71 ± 1.15 a | 5.14 ± 0.90 b | 4.86 ± 1.35 cd |
| Contessa * | SC | 30 | 4.65 ± 1.73 abcd | 5.90 ± 1.78 ab | 5.65 ± 1.93 ab | 6.85 ± 1.70 abc | 1.97 ± 1.13 a | 0.00 ± 0.00 b | 6.35 ± 1.06 ab | 7.35 ± 1.60 ab | 7.10 ± 1.30 abcd |
| Gabiana * | SC | 45 | 5.33 ± 2.06 abcd | 4.44 ± 1.51 ab | 3.39 ± 1.32 ab | 5.50 ± 1.70 abc | 1.78 ± 1.30 a | 1.22 ± 0.79 a | 3.94 ± 1.24 b | 4.72 ± 1.95 b | 4.56 ± 2.07 d |
| Garrone Rosso * | SC | 39 | 5.43 ± 2.15 ab | 5.21 ± 1.35 ab | 5.21 ± 2.48 ab | 5.86 ± 1.70 abc | 1.71 ± 0.49 a | 0.29 ± 0.76 ab | 6.86 ± 1.35 a | 6.79 ± 1.47 ab | 7.07 ± 1.02 abcd |
| Gentile * | SC | 186 | 5.11 ± 1.27 abcd | 3.56 ± 0.98 b | 4.33 ± 1.22 ab | 4.72 ± 1.20 bc | 1.94 ± 0.73 a | 0.78 ± 0.79 ab | 6.06 ± 1.67 ab | 5.78 ± 1.99 ab | 6.00 ±1.58 abcd |
| Mansa * | SC | 390 | 3.13 ± 1.64 bcd | 5.13 ± 1.46 ab | 3.13 ± 0.79 b | 6.00 ± 1.60 abc | 1.94 ± 1.21 a | 1.31 ± 1.03 a | 6.13 ± 2.10 ab | 6.19 ± 1.13 ab | 5.17 ± 1.12 abcd |
| Marrone di Castel del Rio ** | MT | 130 | 5.21 ± 2.32 abcd | 4.36 ± 1.86 ab | 5.79 ± 2.14 ab | 7.07 ± 1.59 a | 1.86 ± 1.49 a | 0.14 ± 0.24 ab | 5.21 ± 2.10 ab | 7.14 ± 1.55 a | 7.43 ± 1.24 a |
| Marrone di Marradi IGP ** | MT | 198 | 5.67 ± 1.94 abc | 4.78 ± 1.30 ab | 5.22 ± 1.72 ab | 6.22 ± 1.12 abc | 1.83 ± 1.12 a | 0.44 ± 0.73 ab | 6.17 ± 2.12 ab | 6.33 ± 1.20 ab | 6.00 ± 1.32 abcd |
| Marrone della Val di Susa ** | MT | 47 | 2.64 ± 1.25 cd | 4.21 ± 1.78 b | 4.57 ± 2.23 ab | 5.21 ± 1.78 abc | 2.07 ± 1.84 a | 0.57 ± 0.79 ab | 6.21 ± 2.06 ab | 6.33 ± 1.60 ab | 5.92 ± 2.08 abcd |
| Marrubia * | SC | 215 | 7.00 ± 0.65 a | 5.07 ± 1.64 ab | 6.21 ± 1.38 a | 7.00 ± 0.82 ab | 1.71 ± 1.38 a | 0.00 ± 0.00 b | 6.14 ± 1.11 ab | 7.57 ± 0.98 a | 7.71 ± 0.76 a |
| Marsol *** | EH | 5 | 3.50 ± 0.71 b | 4.00 ± 1.70 ab | 6.00 ± 0 a | 4.20 ± 1.96 a | 1.90 ± 1.75 a | 0.90 ± 0.74 a | 5.10 ± 1.29 a | 5.80 ± 1.44 a | 5.60 ± 1.64 a |
| Neirana della Val di Susa * | SC | 218 | 5.90 ± 1.65 ab | 5.56 ± 2.01 ab | 5.06 ± 1.83 ab | 6.00 ± 1.98 abc | 2.11 ± 1.41 a | 0.44 ± 0.71 ab | 5.89 ± 1.70 ab | 5.72 ± 1.16 ab | 5.56 ± 1.20 abcd |
| Precoce Migoule *** | EH | 258 | 4.50 ± 1.53 ab | 5.93 ± 1.37 a | 4.14 ± 1.97 ab | 4.71 ± 1.73 a | 1.64 ± 1.11 a | 0.29 ± 0.57 ab | 5.64 ± 2.43 a | 6.50 ± 0.87 a | 5.43 ± 1.37 a |
| Tarvisò * | SC | 25 | 3.21 ± 1.22 bcd | 5.43 ± 1.99 ab | 3.57 ± 1.75 ab | 5.14 ± 2.25 abc | 1.50 ± 1.38 a | 0.14 ± 0.38 ab | 5.14 ± 2.73 ab | 5.86 ± 1.68 ab | 5.93 ± 1.59 abcd |
| Cinnamic Acids | Flavonols | Benzoic Acids | Catechins | Tannins | Monoterpenes | Vitamin C | |||||||||
|---|---|---|---|---|---|---|---|---|---|---|---|---|---|---|---|
| Mean Value | SD | Mean Value | SD | Mean Value | SD | Mean Value | SD | Mean Value | SD | Mean Value | SD | Mean Value | SD | ||
| CV | ID | g·kg−1 DW | g·kg−1 DW | g·kg−1 DW | g·kg−1 DW | g·kg−1 DW | g·kg−1 DW | g·kg−1 DW | |||||||
| Bouche de Bétizac *** | 159 | 0.204 | 0.001 | 0.089 | 0.007 | 0.014 | 0.001 | 0.079 | 0.007 | 0.173 | 0.022 | 3.365 | 0.118 | 0.124 | 0.018 |
| Bouche Rouge * | 286 | 0.151 | 0.080 | 0.011 | 0.000 | 0.025 | 0.000 | 0.049 | 0.001 | 0.060 | 0.008 | 0.643 | 0.158 | 0.189 | 0.029 |
| Brunette * | 9 | 0.158 | 0.080 | 0.085 | 0.001 | 0.036 | 0.001 | 0.065 | 0.002 | 0.174 | 0.008 | 1.614 | 0.095 | 0.126 | 0.008 |
| Canepina * | 78 | 0.208 | 0.001 | 0.244 | 0.034 | 0.064 | 0.007 | 0.159 | 0.034 | 1.201 | 0.348 | 7.590 | 1.788 | 0.055 | 0.023 |
| Contessa * | 30 | 0.199 | 0.005 | 0.145 | 0.024 | 0.027 | 0.000 | 0.019 | 0.002 | 0.196 | 0.004 | 2.595 | 0.576 | 0.160 | 0.023 |
| Gabiana * | 45 | 0.137 | 0.010 | 0.173 | 0.011 | 0.066 | 0.001 | 0.063 | 0.013 | 0.170 | 0.014 | 2.589 | 0.051 | 0.142 | 0.065 |
| Garrone Rosso * | 39 | 0.066 | 0.001 | 0.083 | 0.008 | 0.018 | 0.001 | 0.100 | 0.005 | 0.148 | 0.011 | 1.039 | 0.172 | 0.022 | 0.008 |
| Gentile * | 186 | 0.066 | 0.000 | 0.112 | 0.009 | 0.019 | 0.006 | 0.078 | 0.007 | 0.205 | 0.013 | 1.207 | 0.073 | 0.154 | 0.011 |
| Madonna * | 1 | 0.117 | 0.079 | 0.247 | 0.043 | 0.023 | 0.000 | 0.076 | 0.009 | 0.224 | 0.028 | 1.783 | 0.051 | 0.025 | 0.008 |
| Mansa * | 390 | 0.100 | 0.079 | 0.005 | 0.001 | 0.014 | 0.001 | 0.019 | 0.002 | 0.026 | 0.002 | 0.457 | 0.045 | 0.019 | 0.002 |
| Marrone di Castel del Rio ** | 130 | 0.198 | 0.014 | 0.163 | 0.008 | 0.021 | 0.001 | 0.078 | 0.017 | 0.232 | 0.016 | 1.581 | 0.054 | 0.100 | 0.016 |
| Marrone di Marradi IGP ** | 198 | 0.206 | 0.001 | 0.030 | 0.005 | 0.021 | 0.001 | 0.077 | 0.002 | 0.036 | 0.003 | 1.199 | 0.193 | 0.002 | 0.002 |
| Marrone della Val di Susa ** | 47 | 0.210 | 0.003 | 0.118 | 0.010 | 0.022 | 0.001 | 0.075 | 0.003 | 0.192 | 0.020 | 2.812 | 0.454 | 0.019 | 0.002 |
| Marrubia * | 215 | 0.200 | 0.004 | 0.171 | 0.008 | 0.026 | 0.001 | 0.080 | 0.003 | 0.105 | 0.020 | 1.124 | 0.083 | 0.017 | 0.010 |
| Marsol *** | 5 | 0.199 | 0.004 | 0.072 | 0.005 | 0.024 | 0.001 | 0.100 | 0.008 | 0.117 | 0.009 | 1.822 | 0.061 | 0.027 | 0.006 |
| Neirana della Val di Susa * | 218 | 0.155 | 0.001 | 0.039 | 0.001 | 0.012 | 0.009 | 0.023 | 0.012 | 0.211 | 0.017 | 1.526 | 0.068 | 0.047 | 0.017 |
| Precoce Migoule *** | 258 | 0.209 | 0.001 | 0.044 | 0.002 | 0.025 | 0.000 | 0.106 | 0.005 | 0.036 | 0.006 | 7.371 | 0.478 | 0.025 | 0.005 |
| Tarvisò * | 25 | 0.202 | 0.001 | 0.256 | 0.031 | 0.015 | 0.001 | 0.109 | 0.006 | 0.652 | 0.041 | 0.958 | 0.343 | 0.105 | 0.015 |
| Organic Acids | Sugars | ||||
|---|---|---|---|---|---|
| Mean Value | SD | Mean Value | SD | ||
| CV | ID | g·kg−1 DW | g·kg−1 DW | ||
| Bouche de Bétizac *** | 159 | 4.08 | 0.32 | 32.61 | 4.10 |
| Bouche Rouge * | 286 | 3.34 | 0.48 | 10.64 | 2.33 |
| Brunette * | 9 | 7.97 | 0.25 | 48.79 | 9.68 |
| Canepina * | 78 | 4.41 | 0.37 | 114.80 | 10.63 |
| Contessa * | 30 | 6.00 | 0.15 | 18.36 | 2.92 |
| Gabiana * | 45 | 3.88 | 0.43 | 38.32 | 3.86 |
| Garrone Rosso * | 39 | 1.20 | 0.21 | 14.90 | 2.07 |
| Gentile * | 186 | 2.63 | 0.19 | 48.97 | 2.19 |
| Madonna * | 1 | 4.34 | 0.80 | 62.47 | 3.38 |
| Mansa * | 390 | 6.58 | 0.71 | 273.38 | 21.16 |
| Marrone di Castel del Rio ** | 130 | 2.49 | 0.39 | 26.80 | 3.91 |
| Marrone di Marradi IGP ** | 198 | 3.18 | 0.31 | 29.22 | 2.03 |
| Marrone della Val di Susa ** | 47 | 1.30 | 0.15 | 14.26 | 1.76 |
| Marrubia * | 215 | 1.79 | 0.31 | 25.29 | 4.01 |
| Marsol *** | 5 | 5.01 | 0.45 | 29.07 | 9.82 |
| Neirana della Val Susa * | 218 | 3.22 | 0.21 | 20.00 | 2.67 |
| Precoce Migoule *** | 258 | 7.43 | 0.09 | 38.97 | 1.40 |
| Tarvisò * | 25 | 4.75 | 0.35 | 25.75 | 1.34 |
© 2020 by the authors. Licensee MDPI, Basel, Switzerland. This article is an open access article distributed under the terms and conditions of the Creative Commons Attribution (CC BY) license (http://creativecommons.org/licenses/by/4.0/).
Share and Cite
Beccaro, G.L.; Donno, D.; Lione, G.G.; De Biaggi, M.; Gamba, G.; Rapalino, S.; Riondato, I.; Gonthier, P.; Mellano, M.G. Castanea spp. Agrobiodiversity Conservation: Genotype Influence on Chemical and Sensorial Traits of Cultivars Grown on the Same Clonal Rootstock. Foods 2020, 9, 1062. https://doi.org/10.3390/foods9081062
Beccaro GL, Donno D, Lione GG, De Biaggi M, Gamba G, Rapalino S, Riondato I, Gonthier P, Mellano MG. Castanea spp. Agrobiodiversity Conservation: Genotype Influence on Chemical and Sensorial Traits of Cultivars Grown on the Same Clonal Rootstock. Foods. 2020; 9(8):1062. https://doi.org/10.3390/foods9081062
Chicago/Turabian StyleBeccaro, Gabriele L., Dario Donno, Guglielmo Gianni Lione, Marta De Biaggi, Giovanni Gamba, Sabrina Rapalino, Isidoro Riondato, Paolo Gonthier, and Maria Gabriella Mellano. 2020. "Castanea spp. Agrobiodiversity Conservation: Genotype Influence on Chemical and Sensorial Traits of Cultivars Grown on the Same Clonal Rootstock" Foods 9, no. 8: 1062. https://doi.org/10.3390/foods9081062
APA StyleBeccaro, G. L., Donno, D., Lione, G. G., De Biaggi, M., Gamba, G., Rapalino, S., Riondato, I., Gonthier, P., & Mellano, M. G. (2020). Castanea spp. Agrobiodiversity Conservation: Genotype Influence on Chemical and Sensorial Traits of Cultivars Grown on the Same Clonal Rootstock. Foods, 9(8), 1062. https://doi.org/10.3390/foods9081062