Visual Cultural Biases in Food Classification

Abstract

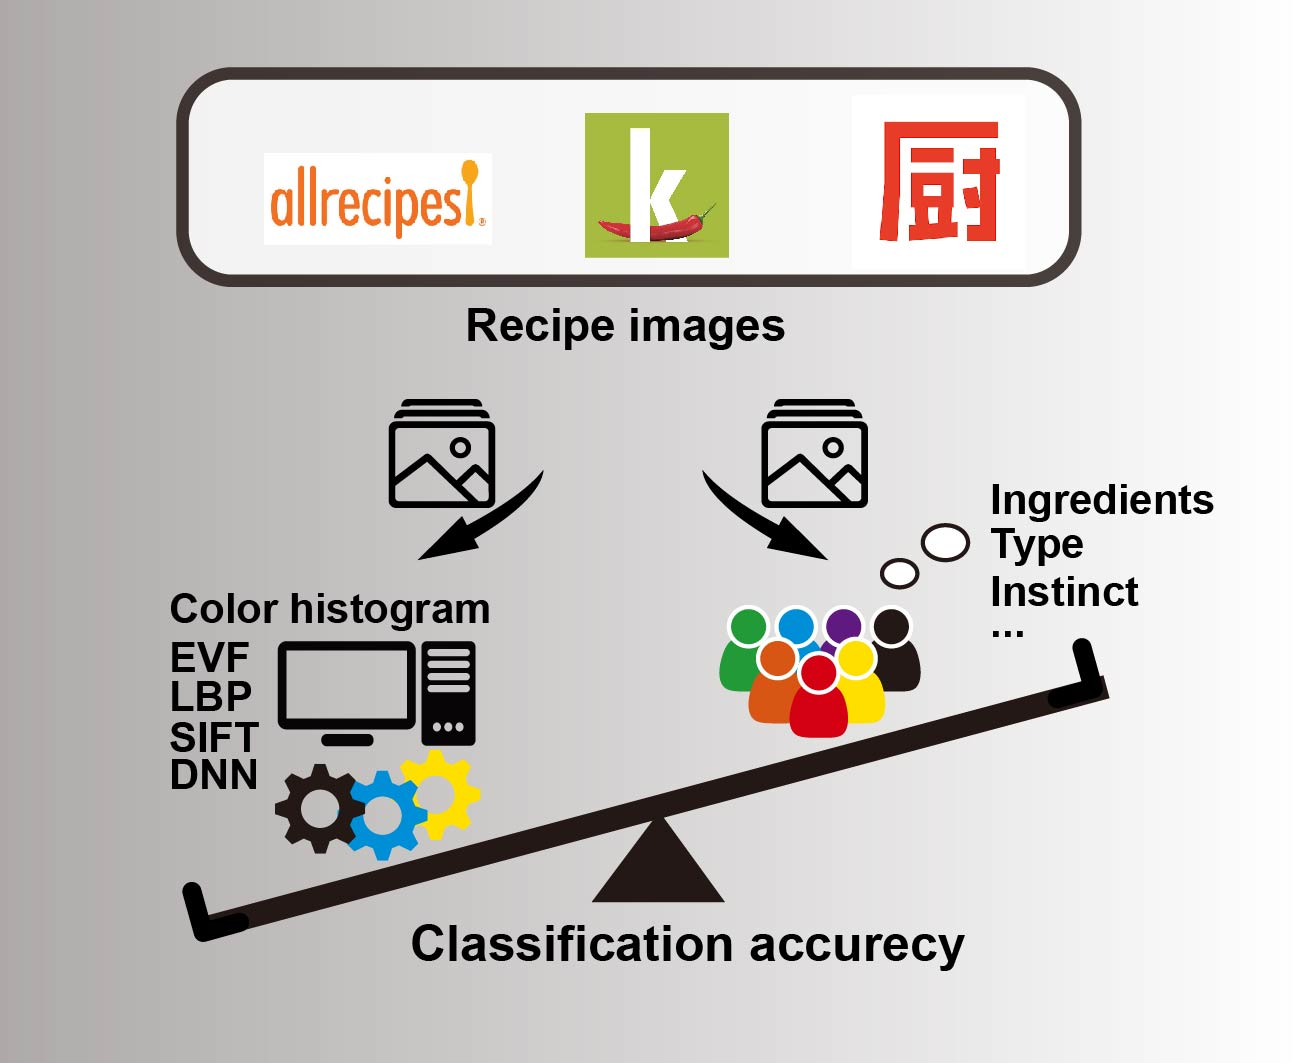
1. Introduction
- Determine how able humans are to categorise recipes by origin.
- Understand the visual and other factors which influence (and bias) the labels they apply.
- Compare the performance of humans and machine learning algorithms for this task.
- RQ1. To what extent is it possible to classify recipes from the recipe portals of different food cultures with machine learning models based only on visual properties?
- RQ2. How able are humans to distinguish recipes from the recipe portals of different food cultures solely by observing the recipe images?
- RQ3. Which factors (i.e., information cues from the images or user properties) influence the judgements made?
2. Materials and Methods
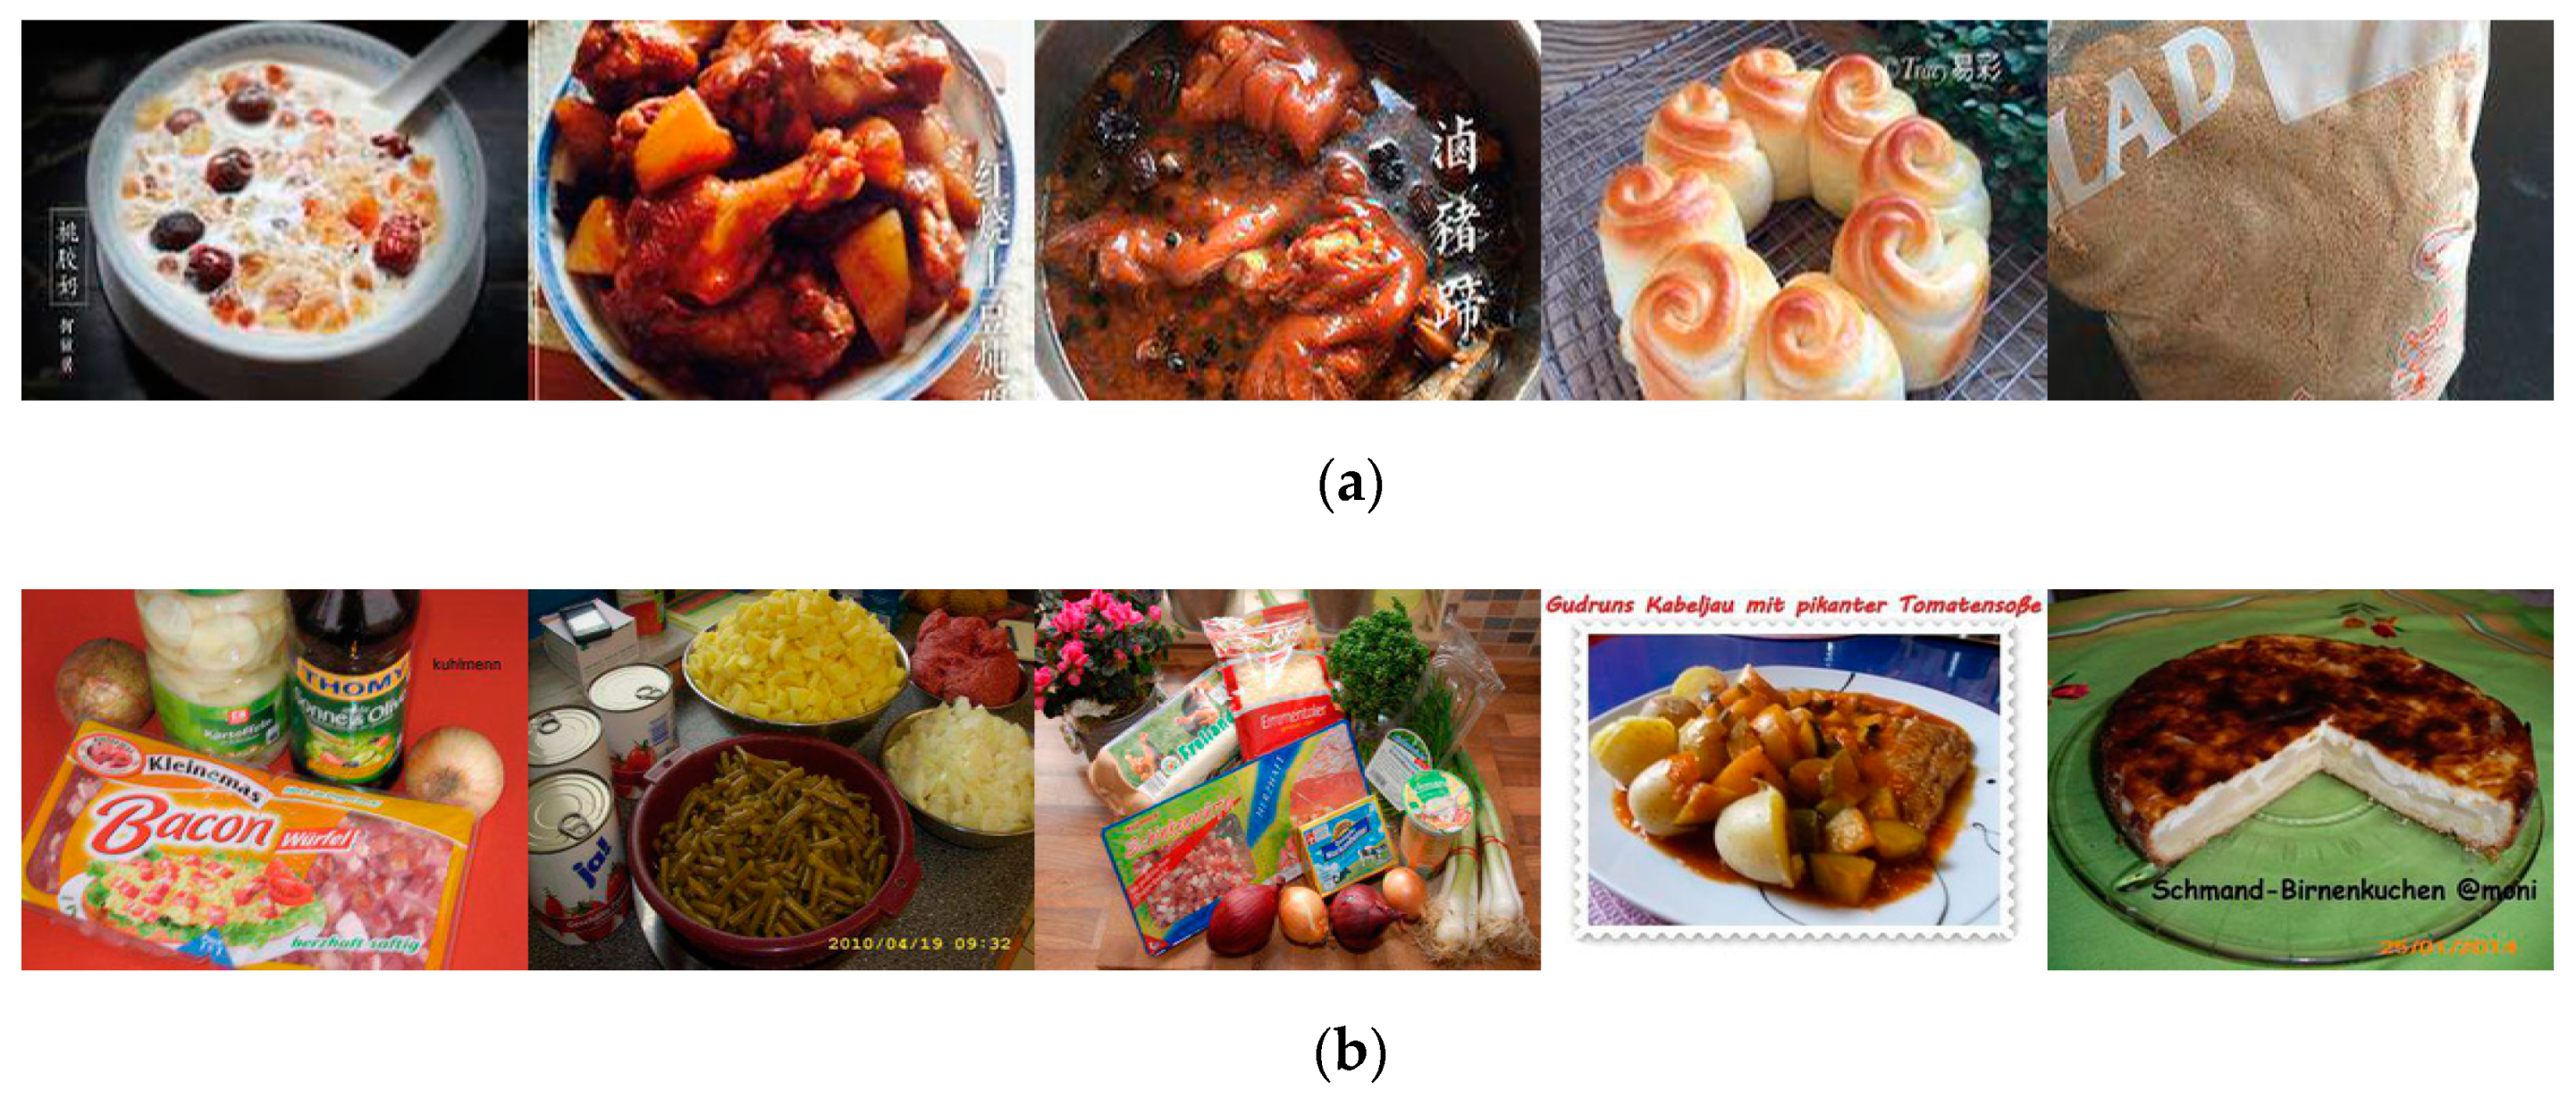
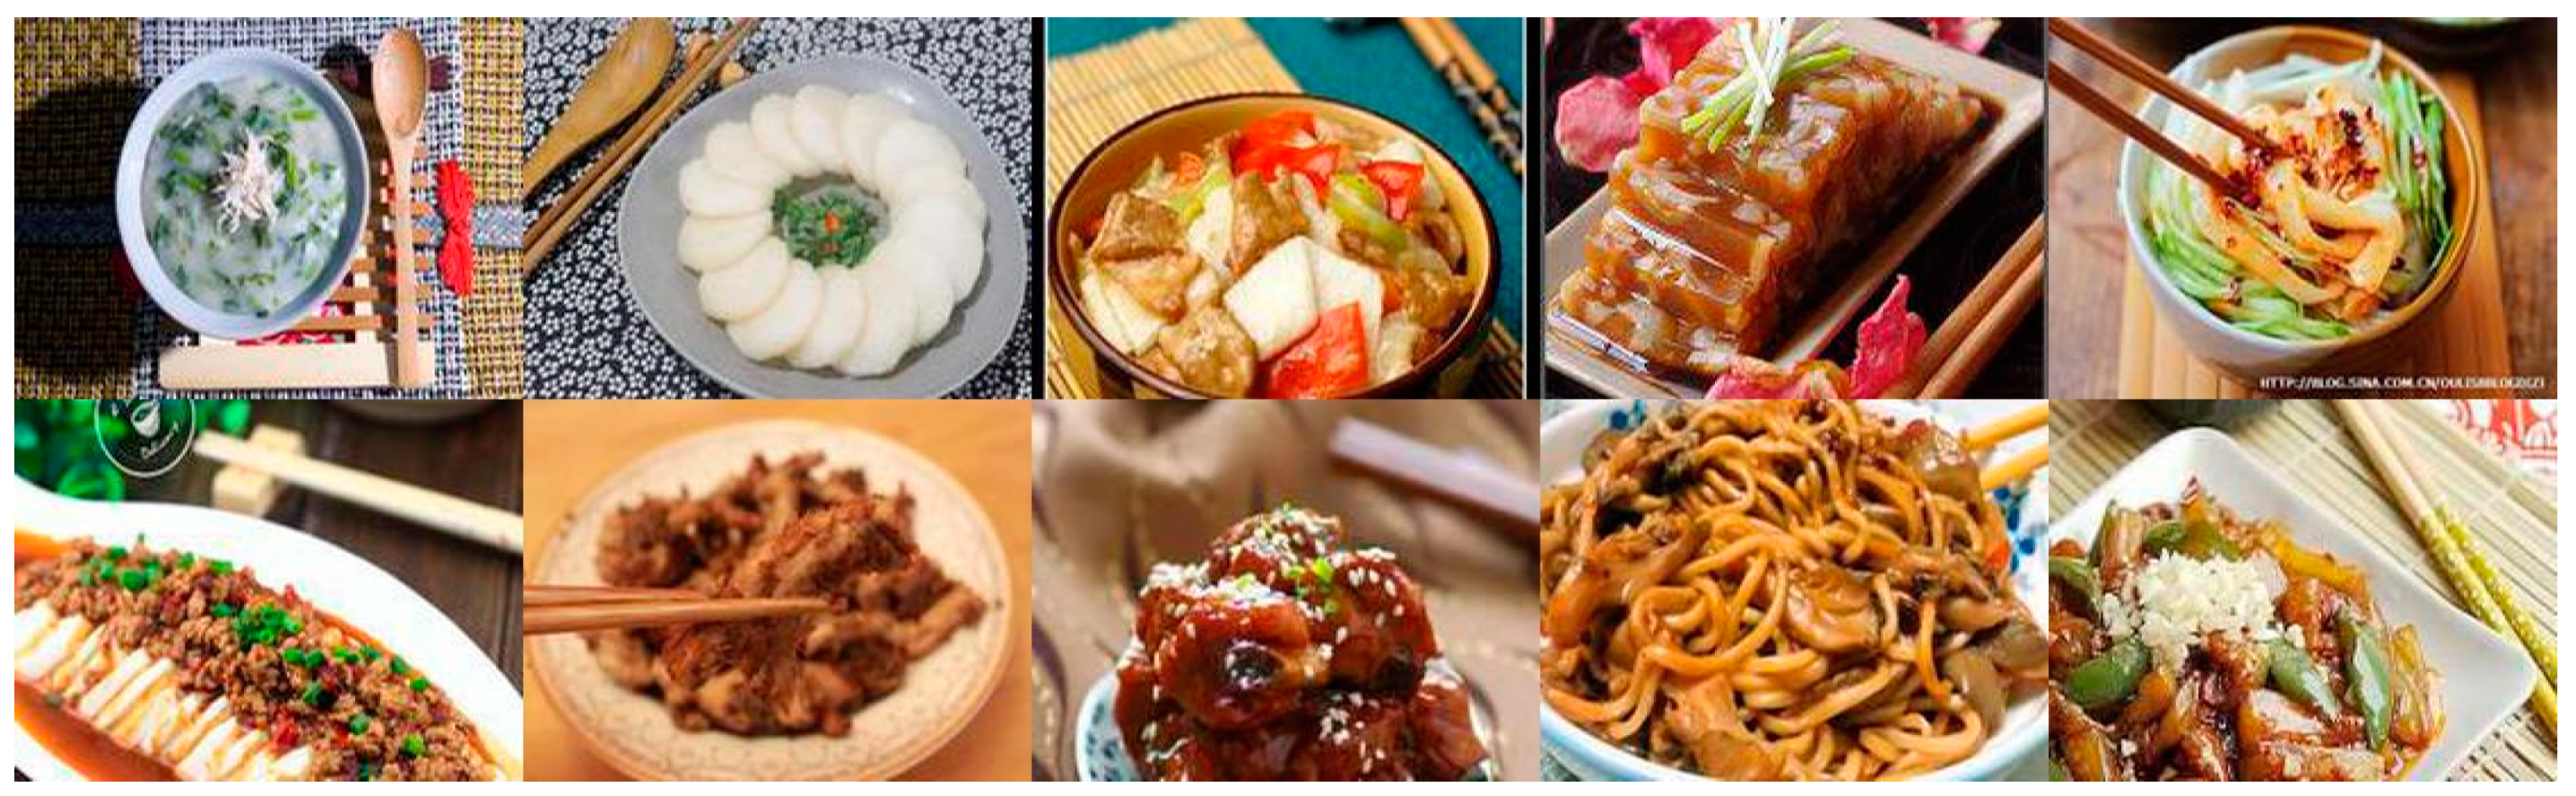
2.1. Data Collections
2.2. Food Classification by Means of Visual Features and Machine Learning
2.2.1. Explicit Visual Features (EVF)
2.2.2. Colour Histogram
2.2.3. Local Binary Patterns (LBP)
2.2.4. Descriptors of Scale-Invariant Feature Transform (SIFT)
2.2.5. Deep Neural Network Image Embeddings (DNN)
2.3. Food Classification by Means of Human Judgement
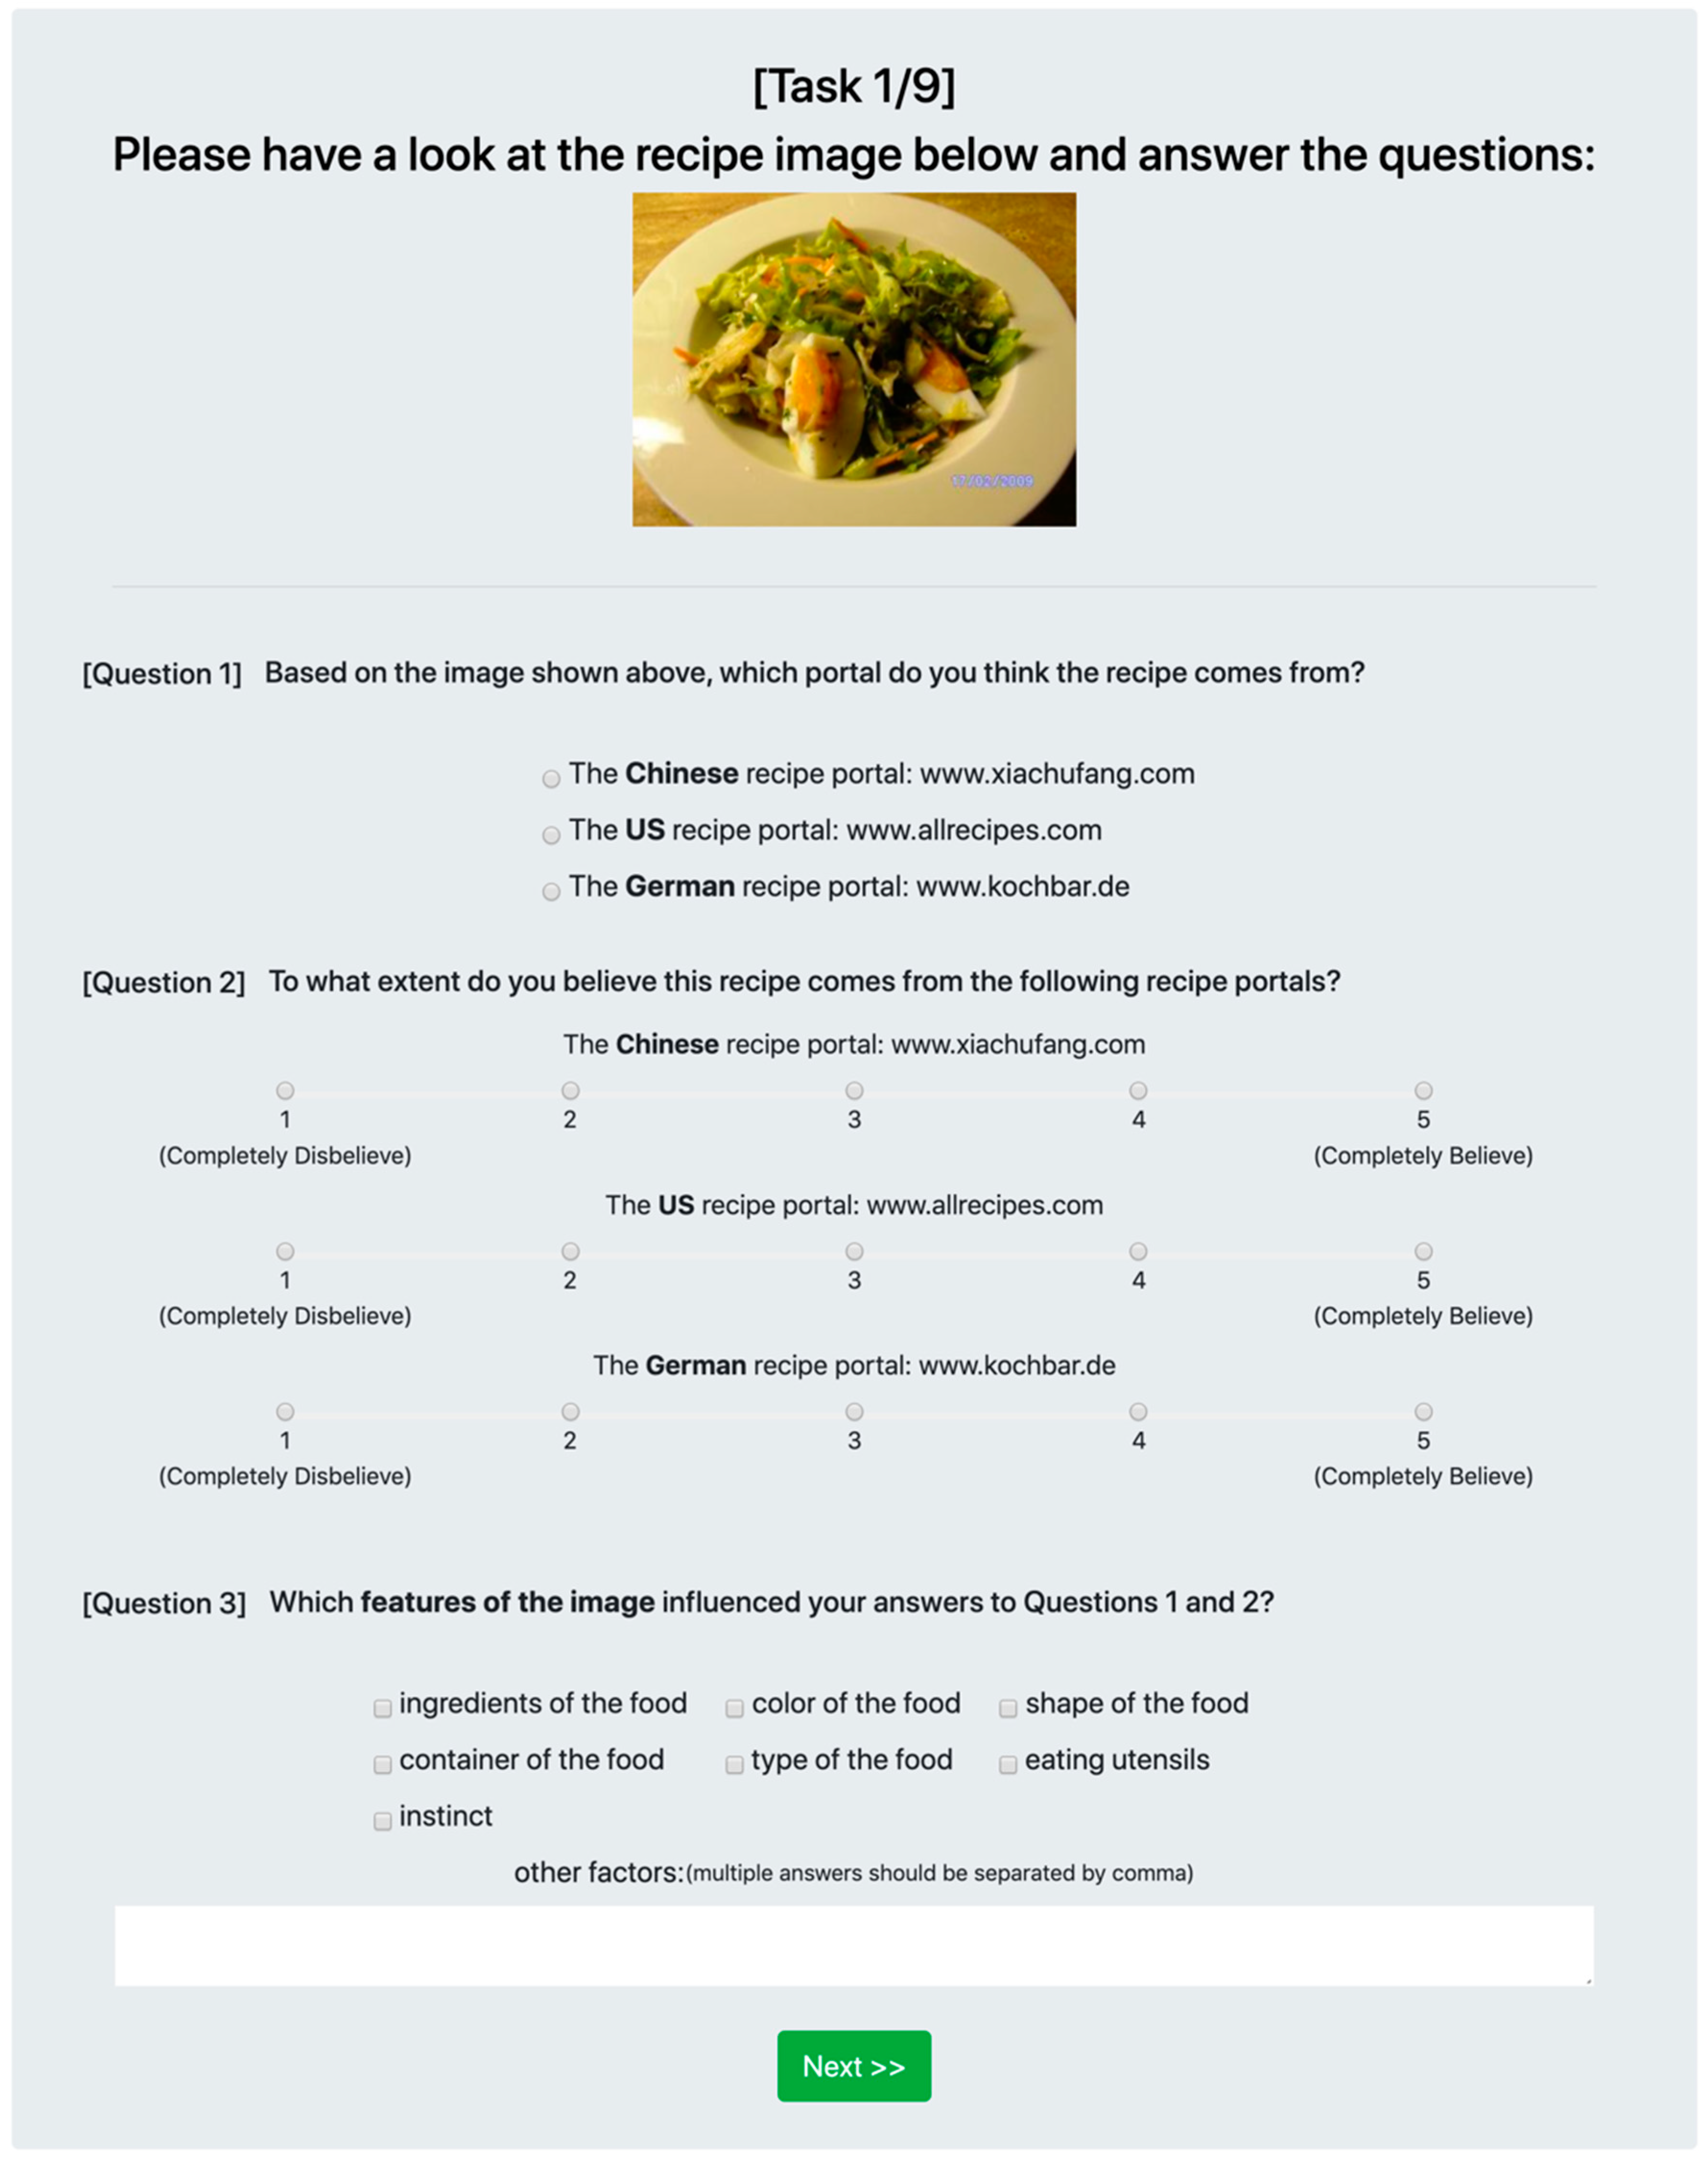
2.3.1. Study Design
- Type: As shown in [39], when food type is given, it is helpful for algorithms in predicting food ingredients. We put the factor Type here to see if food type has a positive influence for the human in making the judgement.
- Shape: This relates to the visual feature LBP. According to [42], humans rely on shape in classifying objects while algorithms pay more attention to texture.
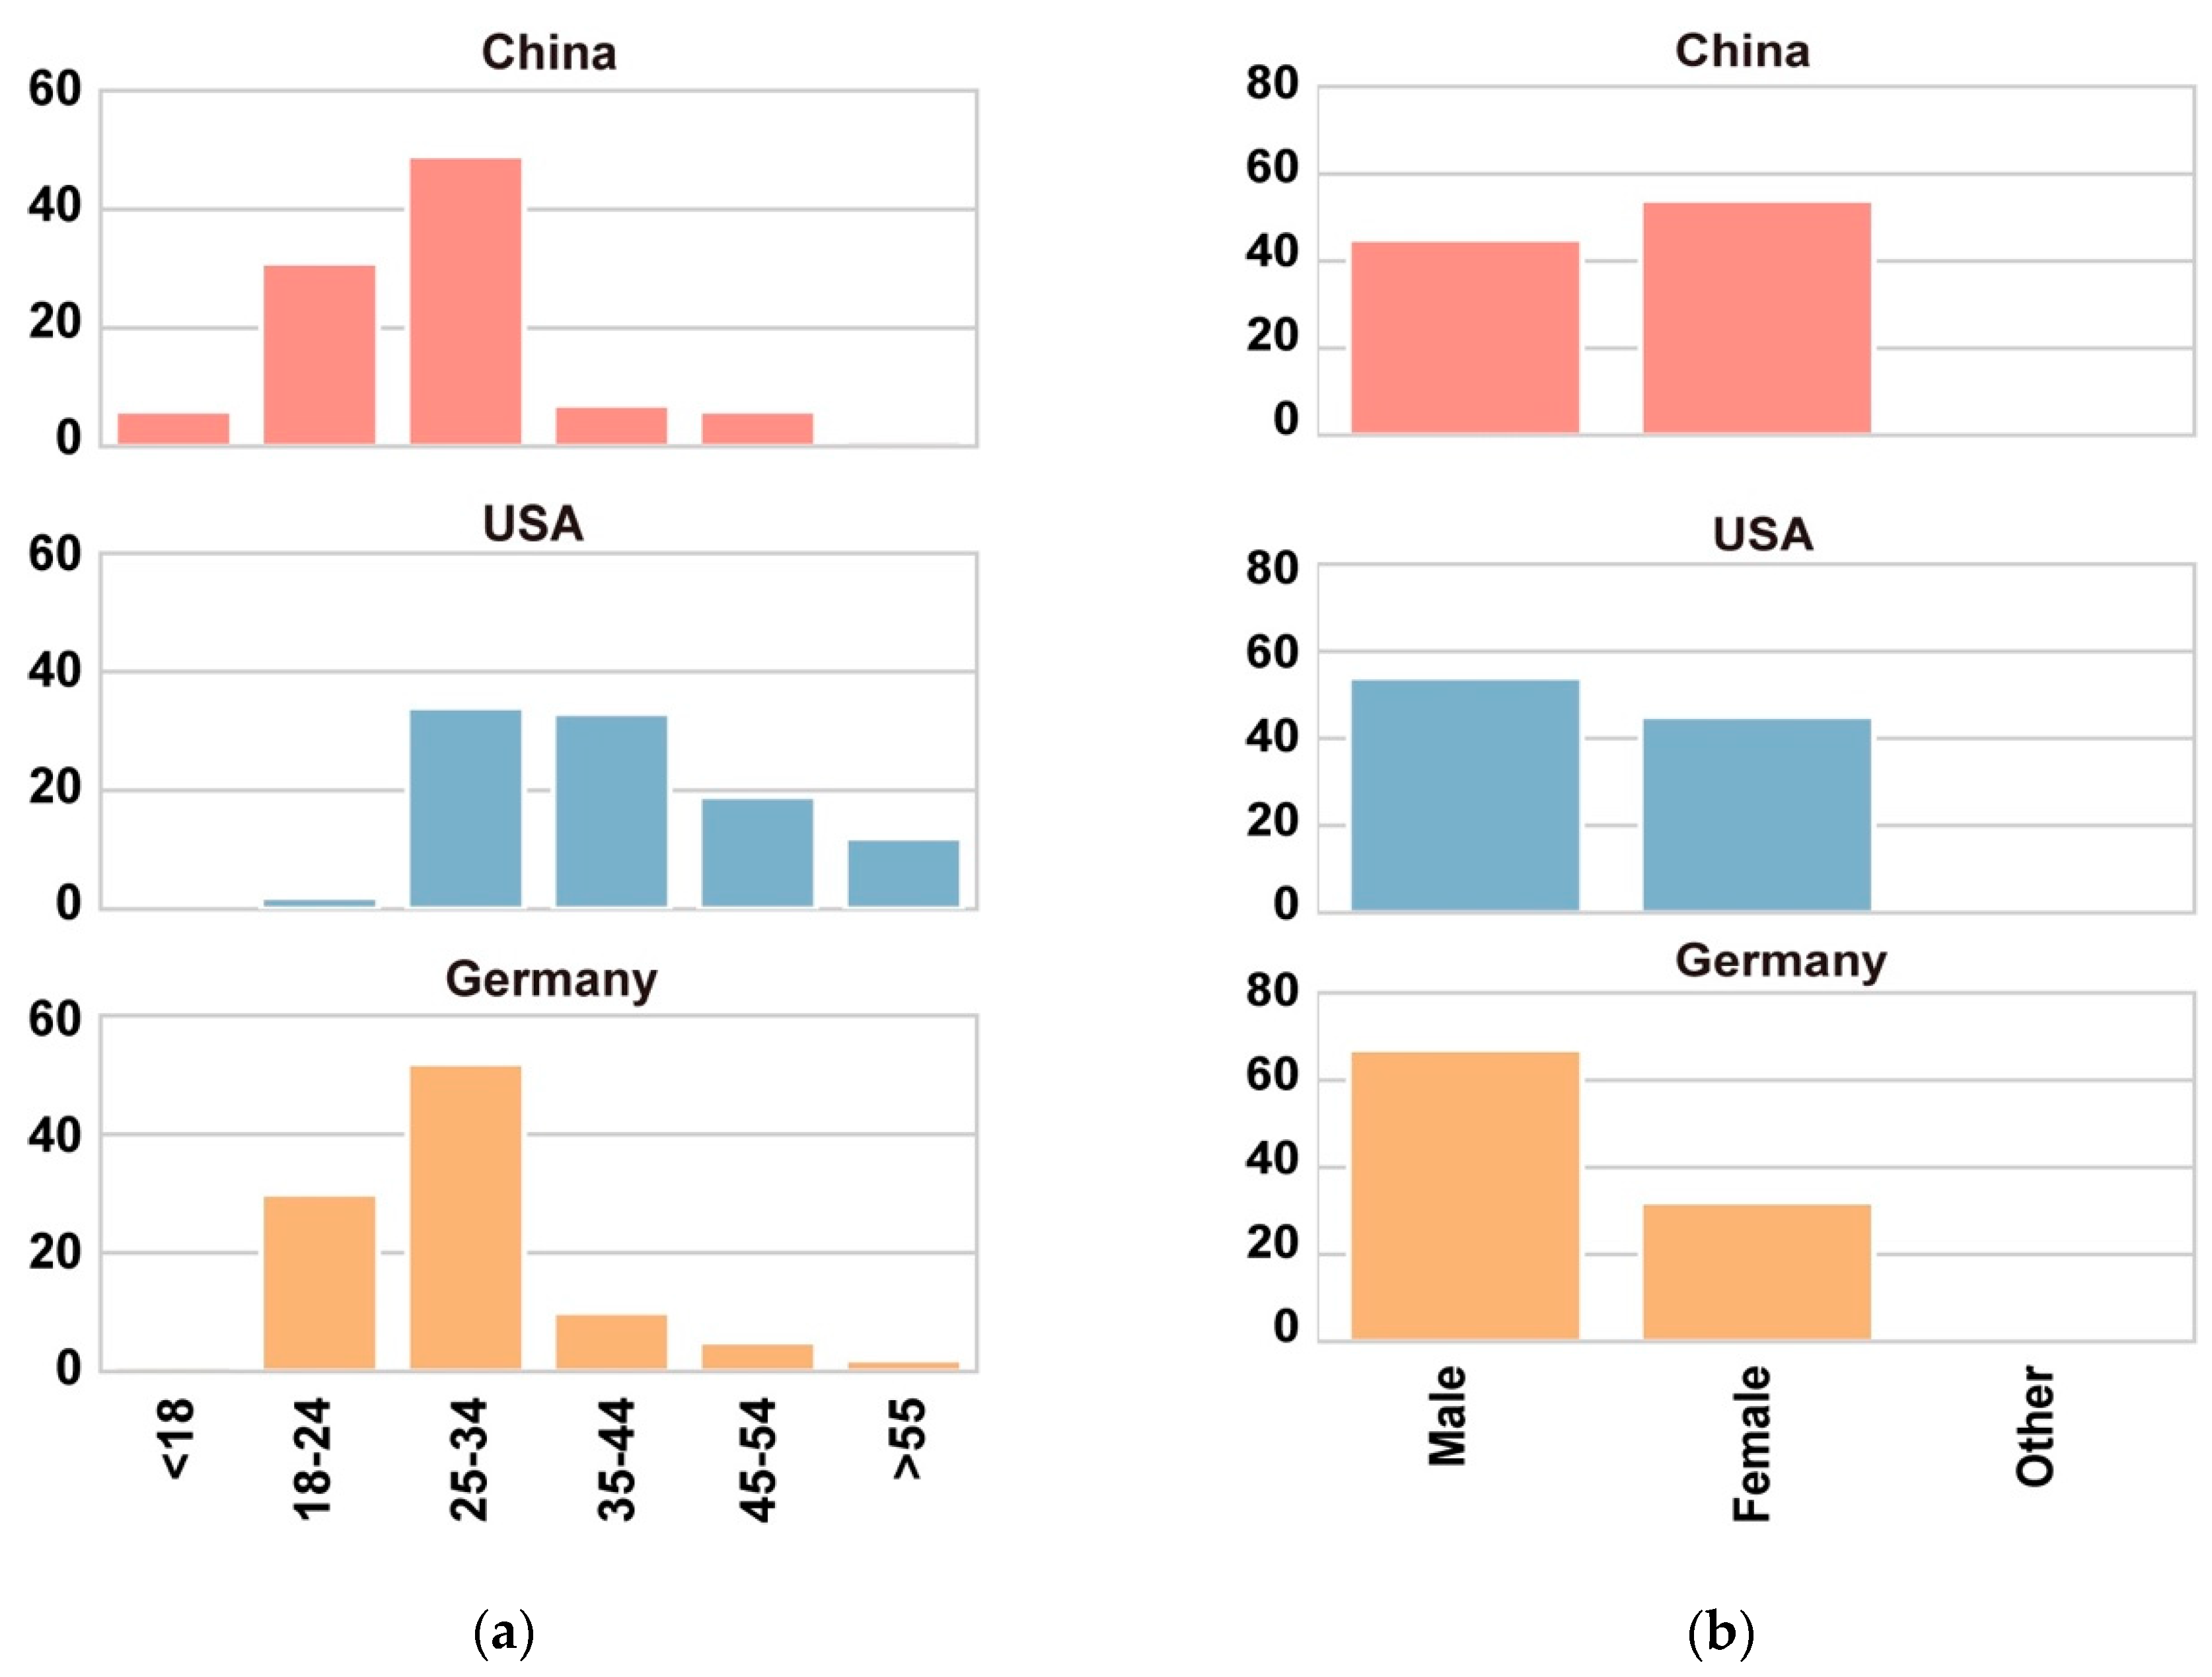
2.3.2. Participants
2.3.3. Methods of Data Analysis
3. Results
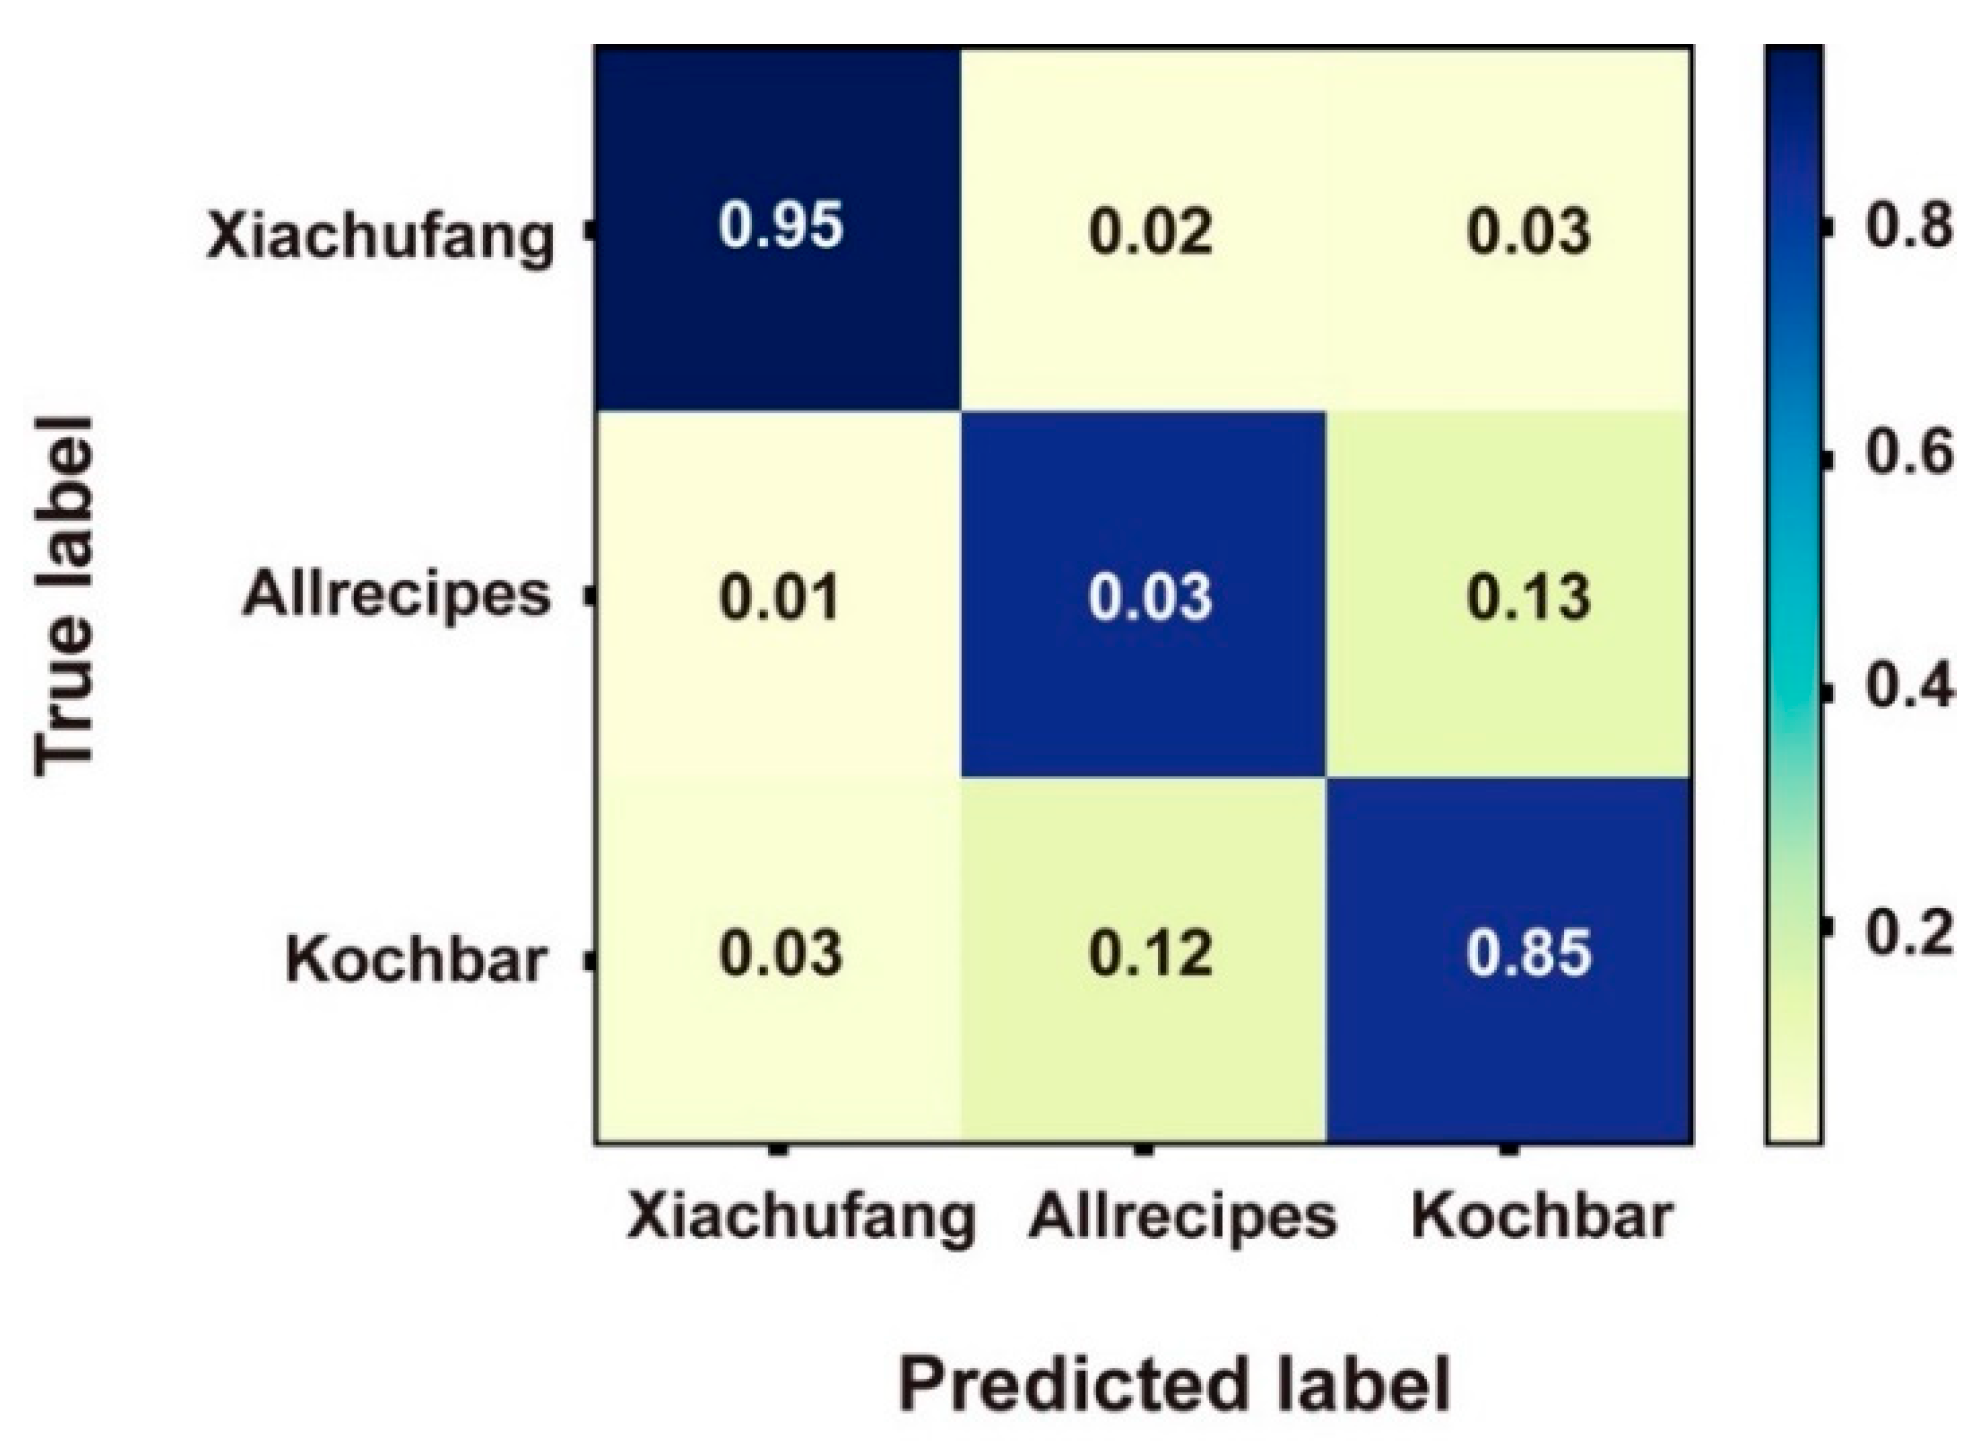
3.1. Classifying the Origin of Recipes Based on Visual Properties with Machine Learning Approaches (RQ1)
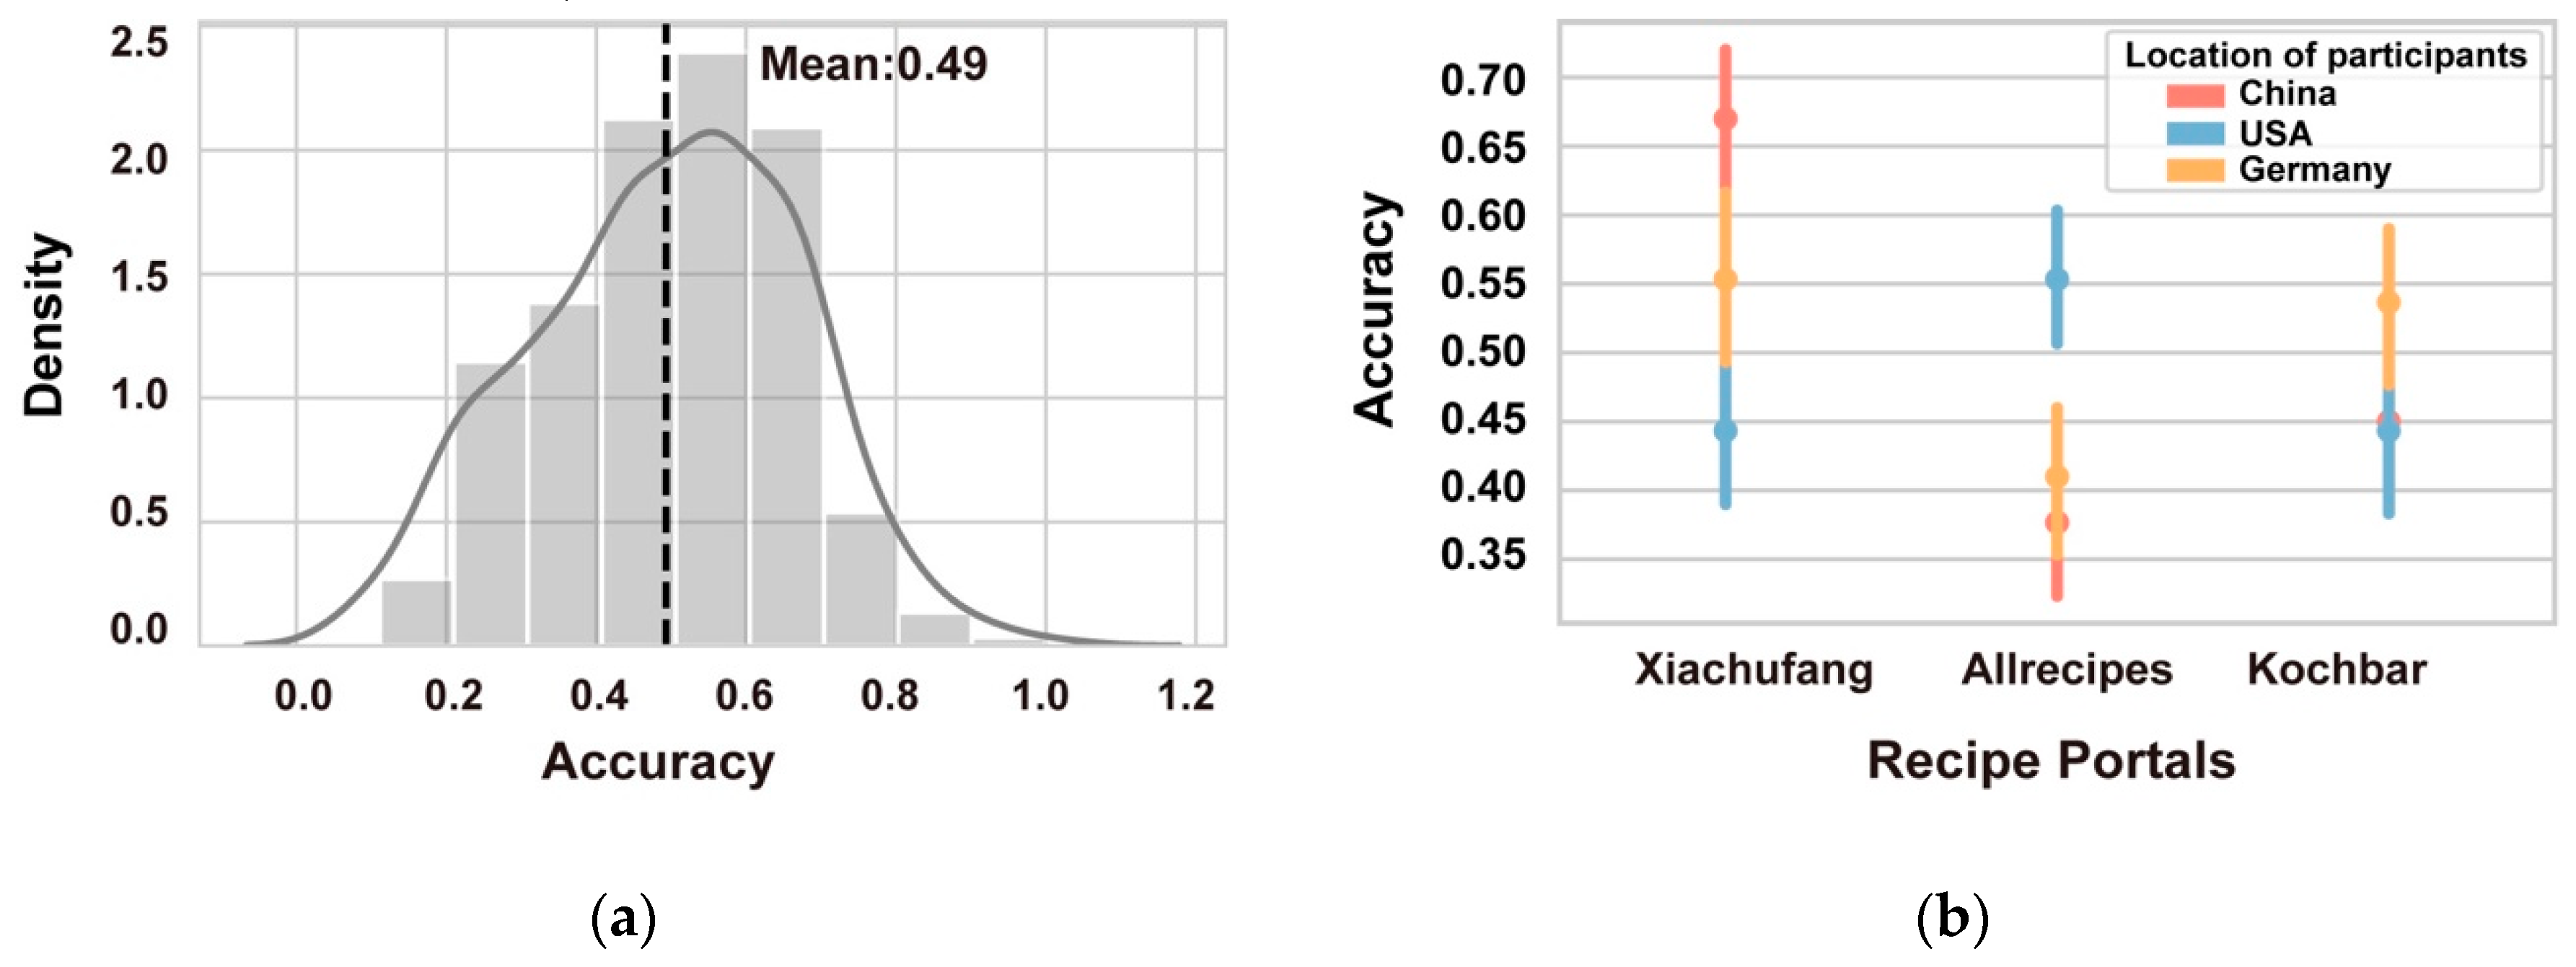
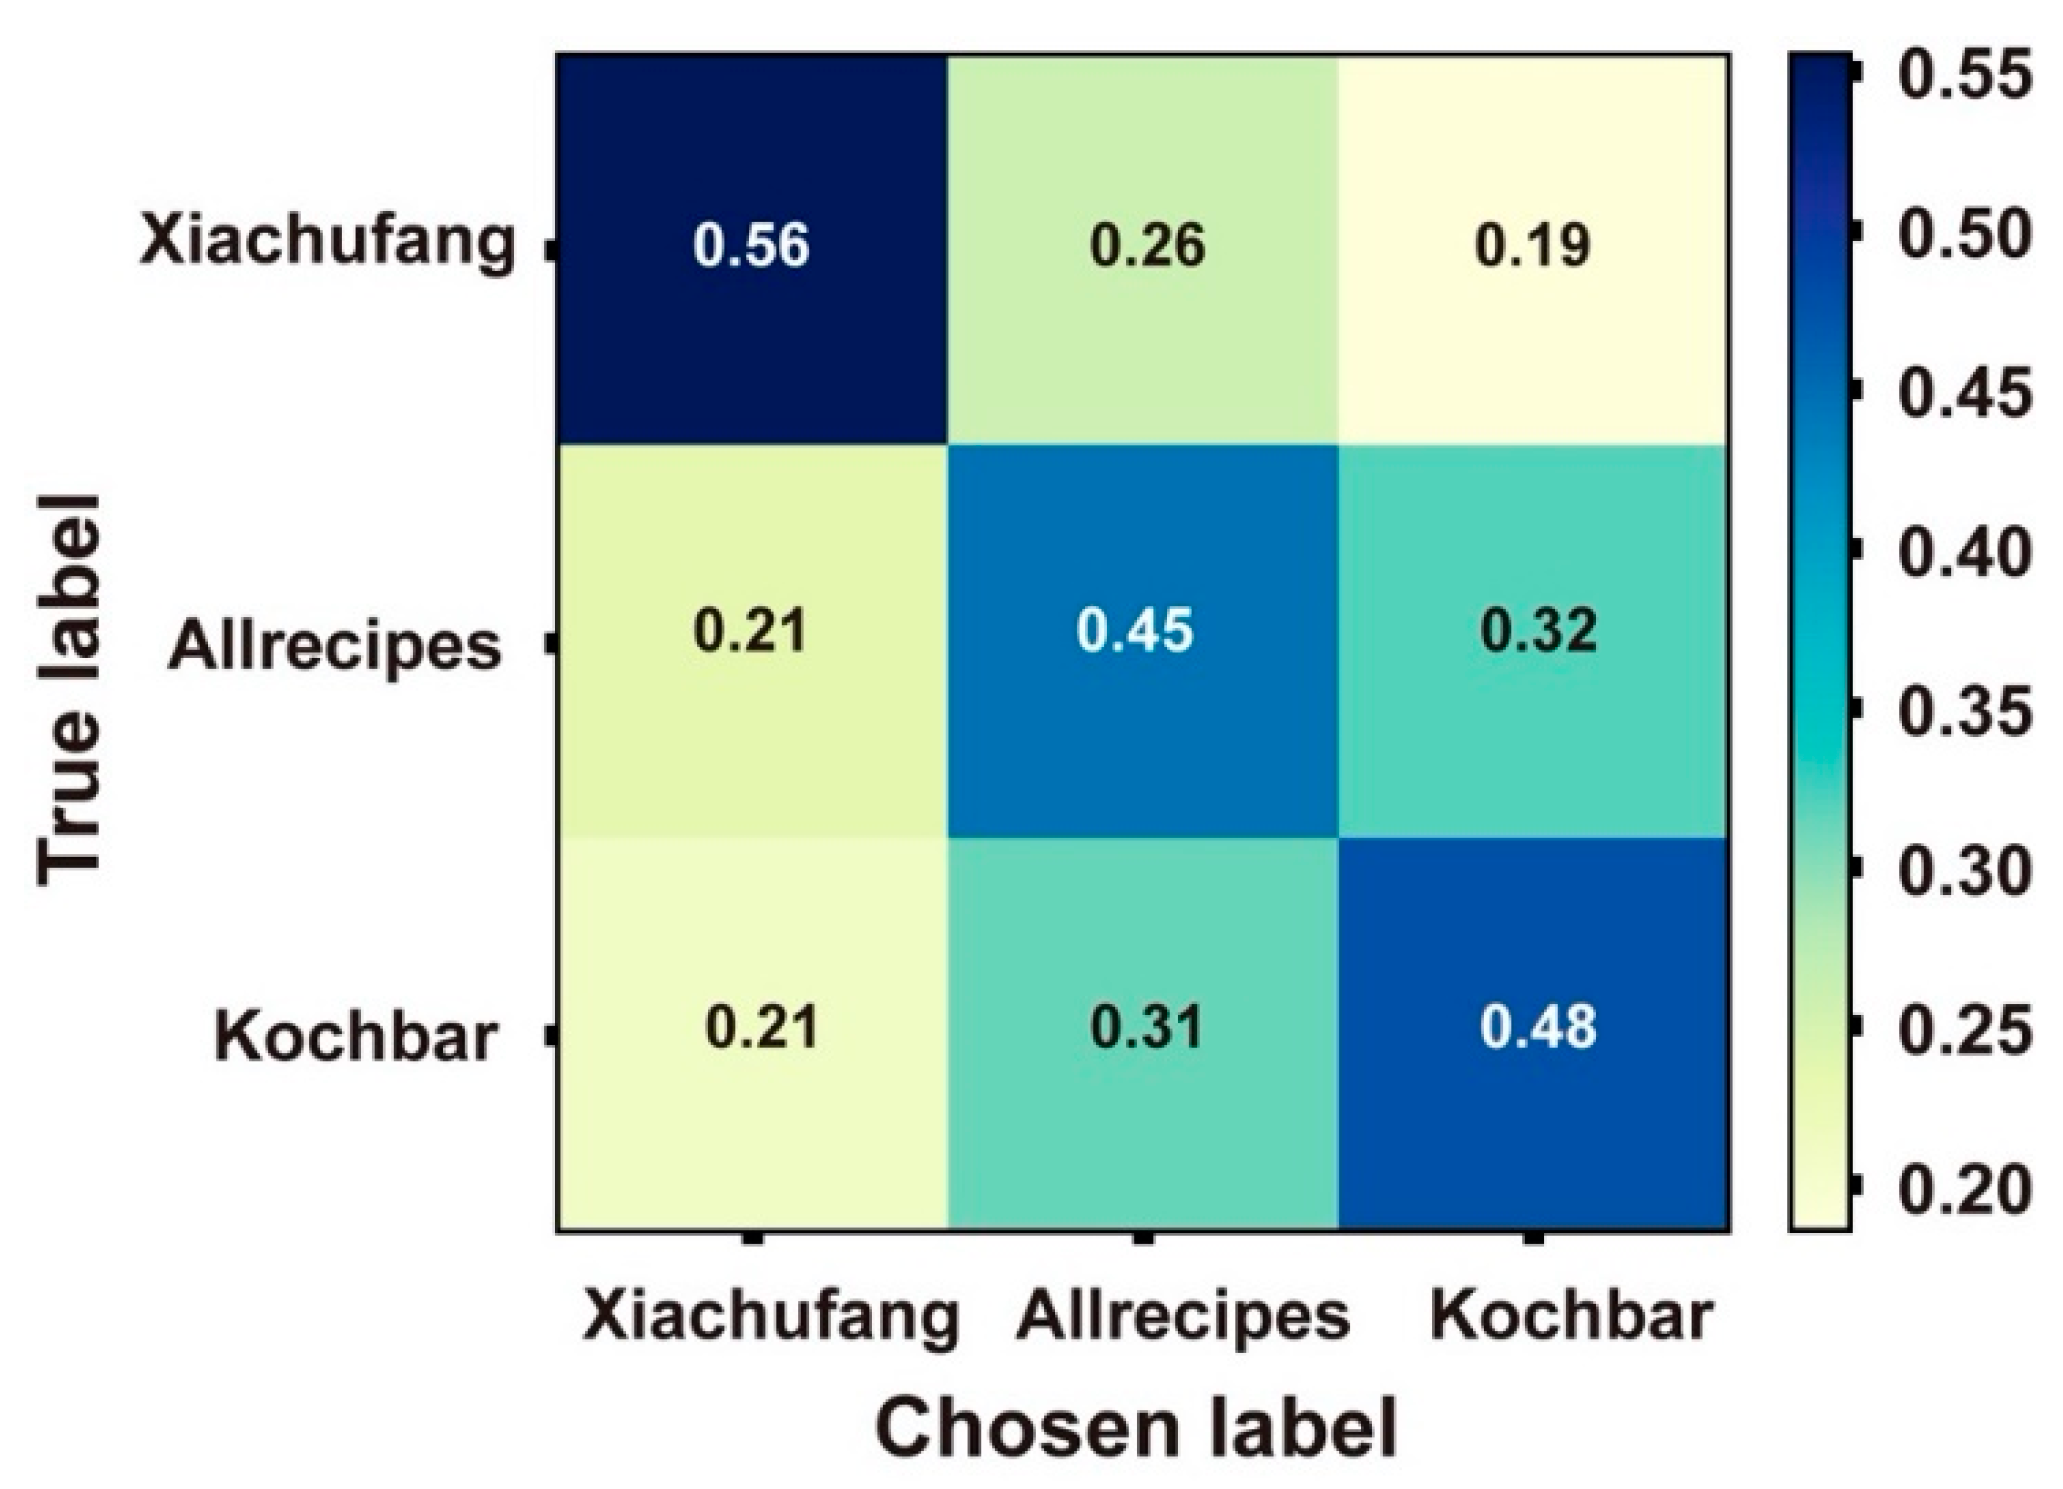
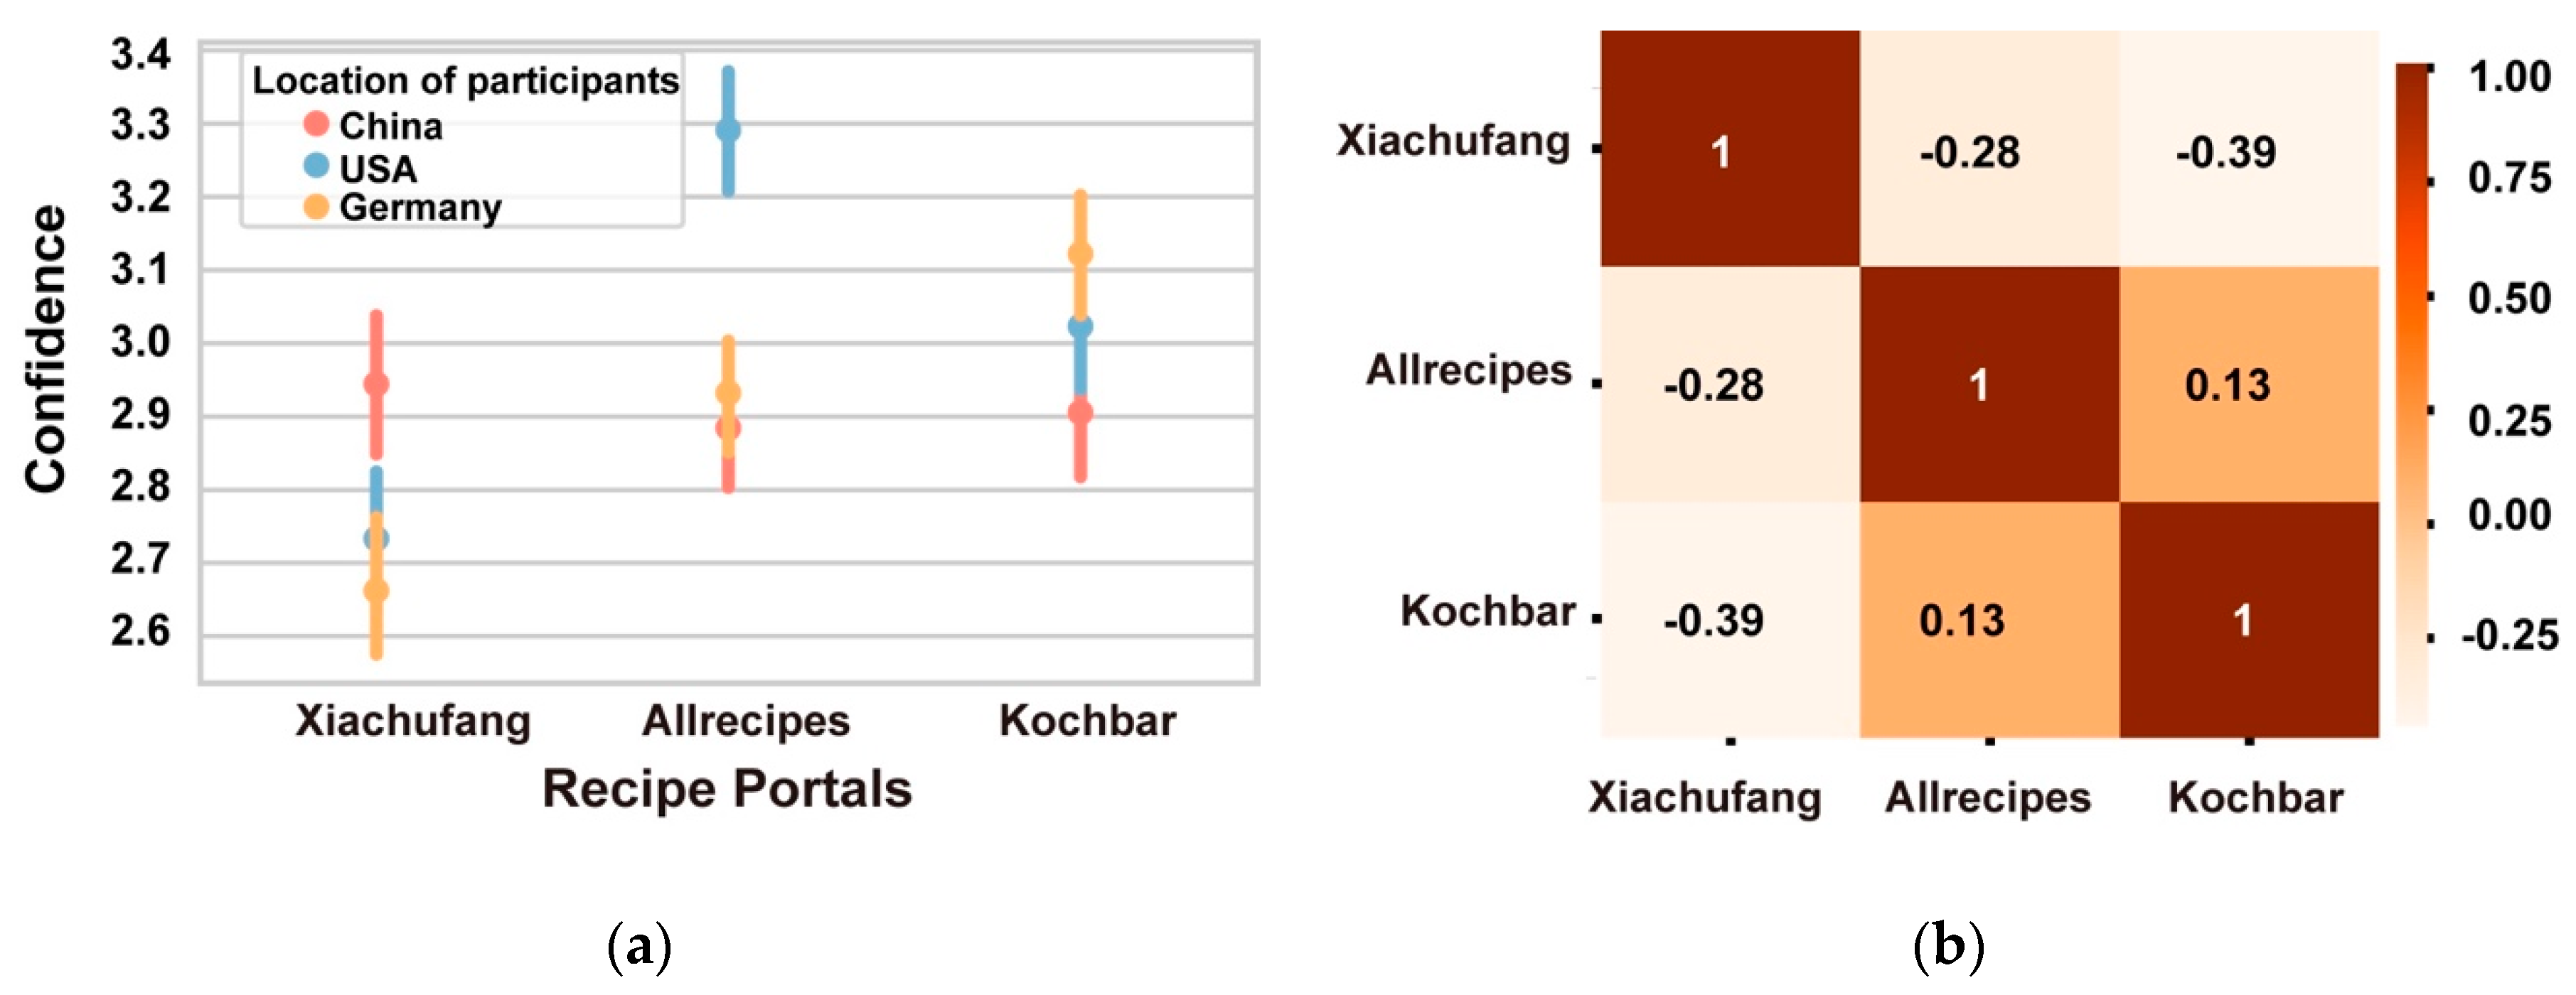
3.2. Analysing Human Labelling Performance (RQ2)
3.3. Factors Leading to or Influencing Participants’ Judgements (RQ3)
3.3.1. Predicting Participant Label Based on Visual Features
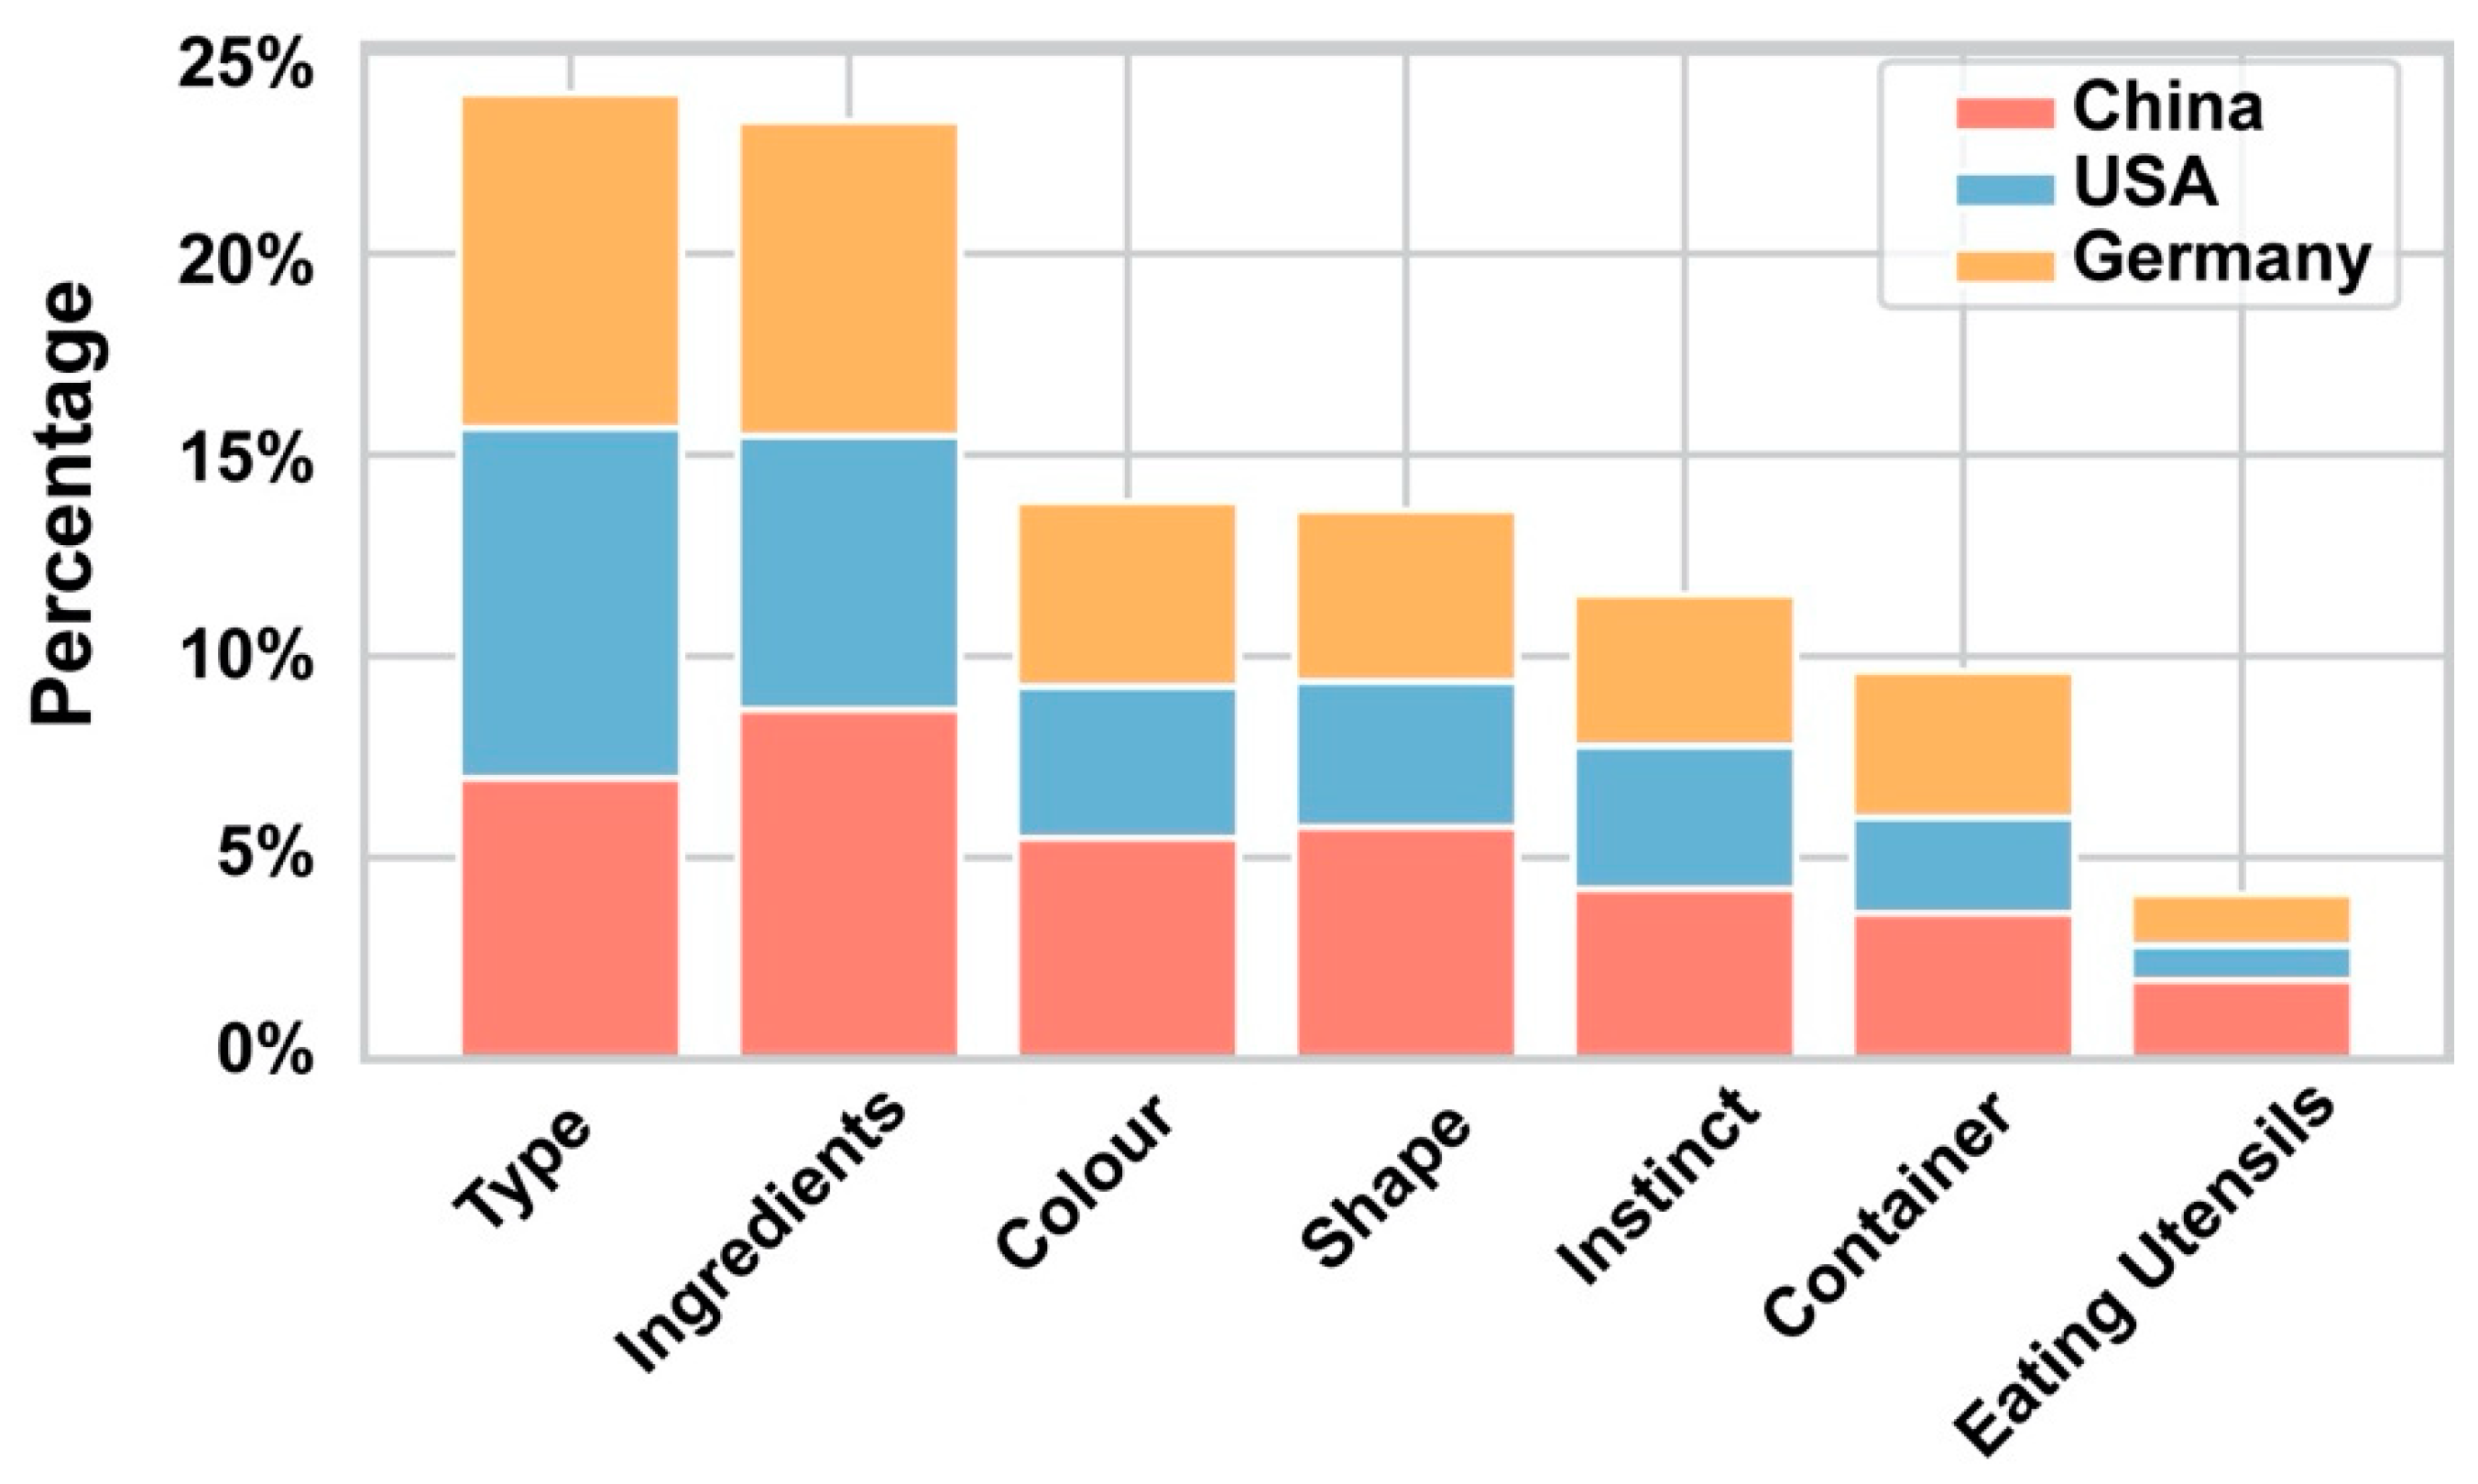
3.3.2. Participant Explanations for Labelling Choices
3.3.3. Free-Text Explanations
3.3.4. Factors Leading to Correct Classification Choices
3.3.5. Varying Performance across Participant Groups
4. Discussion and Conclusions
4.1. Implications of the Results
4.2. Limitations of the Study
Author Contributions
Funding
Conflicts of Interest
References
- Brascamp, J.; Blake, R.; Knapen, T. Negligible fronto-parietal BOLD activity accompanying unreportable switches in bistable perception. Nat. Neurosci. 2015, 18, 1672–1678. [Google Scholar] [CrossRef] [PubMed]
- Dean, M.; Neligh, N. Experimental Tests of Rational Inattention; Columbia University Libraries: New York, NY, USA, 2017. [Google Scholar]
- Clement, J.; Aastrup, J.; Charlotte Forsberg, S. Decisive visual saliency and consumers’ in-store decisions. J. Retail. Consum. Serv. 2015, 22, 187–194. [Google Scholar] [CrossRef]
- Dayan, E.; Bar-Hillel, M. Nudge to nobesity II: Menu positions influence food orders. Judgm. Decis. Mak. 2011, 6, 11. [Google Scholar]
- Chen, L.; Pu, P. Eye-Tracking Study of User Behavior in Recommender Interfaces. In User Modeling, Adaptation, and Personalization, Lecture Notes in Computer Science; De Bra, P., Kobsa, A., Chin, D., Eds.; Springer: Berlin/Heidelberg, Germany, 2010; Volume 6075, pp. 375–380. ISBN 978-3-642-13469-2. [Google Scholar]
- Salvador, A.; Hynes, N.; Aytar, Y.; Marin, J.; Ofli, F.; Weber, I.; Torralba, A. Learning Cross-Modal Embeddings for Cooking Recipes and Food Images. In Proceedings of the 2017 IEEE Conference on Computer Vision and Pattern Recognition (CVPR), Honolulu, HI, USA, 21–26 July 2017; pp. 3068–3076. [Google Scholar]
- Khosla, A.; Zhou, T.; Malisiewicz, T.; Efros, A.A.; Torralba, A. Undoing the Damage of Dataset Bias. In Computer Vision–ECCV 2012, Lecture Notes in Computer Science; Fitzgibbon, A., Lazebnik, S., Perona, P., Sato, Y., Schmid, C., Eds.; Springe: Berlin/Heidelberg, Germany, 2012; Volume 7572, pp. 158–171. ISBN 978-3-642-33717-8. [Google Scholar]
- Torralba, A.; Efros, A.A. Unbiased look at dataset bias. In Proceedings of the CVPR 2011, Colorado Springs, CO, USA, 20–25 June 2011; pp. 1521–1528. [Google Scholar]
- Palmer, S. Canonical perspective and the perception of objects. Atten. Perform. 1981, 135–151. [Google Scholar]
- Ellis, W.D. A Source Book of Gestalt Psychology; Psychology Press: London, UK, 1999; Volume 2. [Google Scholar]
- Vondrick, C.; Pirsiavash, H.; Oliva, A.; Torralba, A. Learning visual biases from human imagination. In Advances in Neural Information Processing Systems 28; Cortes, C., Lawrence, N.D., Lee, D.D., Sugiyama, M., Garnett, R., Eds.; Curran Associates, Inc.: Makati, Philippines, 2015; pp. 289–297. [Google Scholar]
- Zhu, Y.-X.; Huang, J.; Zhang, Z.-K.; Zhang, Q.-M.; Zhou, T.; Ahn, Y.-Y. Geography and Similarity of Regional Cuisines in China. PLoS ONE 2013, 8, e79161. [Google Scholar] [CrossRef]
- Ahn, Y.-Y.; Ahnert, S.E.; Bagrow, J.P.; Barabási, A.-L. Flavor network and the principles of food pairing. Sci. Rep. 2011, 1, 196. [Google Scholar] [CrossRef]
- Zhang, C.; Yue, Z.; Zhou, Q.; Ma, S.; Zhang, Z.-K. Using social media to explore regional cuisine preferences in China. Online Inf. Rev. 2019, 43, 1098–1114. [Google Scholar] [CrossRef]
- Trattner, C.; Moesslang, D.; Elsweiler, D. On the predictability of the popularity of online recipes. EPJ Data Sci. 2018, 7, 20. [Google Scholar] [CrossRef]
- San Pedro, J.; Siersdorfer, S. Ranking and classifying attractiveness of photos in folksonomies. In Proceedings of the 18th International Conference on World Wide Web-WWW’09, Madrid, Spain, 20–24 April 2009; p. 771. [Google Scholar]
- Messina, P.; Dominguez, V.; Parra, D.; Trattner, C.; Soto, A. Content-based artwork recommendation: Integrating painting metadata with neural and manually-engineered visual features. User Model. User-Adapt. Interact. 2019, 29, 251–290. [Google Scholar] [CrossRef]
- Spence, C.; Levitan, C.A.; Shankar, M.U.; Zampini, M. Does Food Color Influence Taste and Flavor Perception in Humans? Chemosens. Percept. 2010, 3, 68–84. [Google Scholar] [CrossRef]
- Spence, C. On the psychological impact of food colour. Flavour 2015, 4, 21. [Google Scholar] [CrossRef]
- Chapelle, O.; Haffner, P.; Vapnik, V.N. Support vector machines for histogram-based image classification. IEEE Trans. Neural Netw. 1999, 10, 1055–1064. [Google Scholar] [CrossRef] [PubMed]
- Kaur, K.P.; Singh, C.; Bhullar, E.W. Color Image Retrieval Using Color Histogram and Orthogonal Combination of Linear Binary Pattern. In Proceedings of the 2014 Indian Conference on Computer Vision Graphics and Image Processing-ICVGIP’14, Bangalore, India, 14–18 December 2014; pp. 1–8. [Google Scholar]
- Ojala, T.; Pietikainen, M. A Comparative Study of Texture Measures with Classification Based on Feature Distributions. Pattern Recognit. 1996, 29, 51–59. [Google Scholar] [CrossRef]
- Liao, S.; Zhu, X.; Lei, Z.; Zhang, L.; Li, S.Z. Learning Multi-scale Block Local Binary Patterns for Face Recognition. In Advances in Biometrics, Lecture Notes in Computer Science; Lee, S.-W., Li, S.Z., Eds.; Springer: Berlin/Heidelberg, Germany, 2007; Volume 4642, pp. 828–837. ISBN 978-3-540-74548-8. [Google Scholar]
- Yuan, X.; Yu, J.; Qin, Z.; Wan, T. A SIFT-LBP Image Retrieval Model Based on Bag-of-Features. In Proceedings of the IEEE International Conference on Image Processing, Kuala Lumpur, Malaysia, 16–18 November 2011. [Google Scholar]
- Trefný, J.; Matas, J. Extended Set of Local Binary Patterns for Rapid Object Detection. In Computer Vision Winter Workshop, Nové Hrady, Czech Republic, 3–5 February 2010; Špaček, L., Franc, V., Eds.; Czech Society for Cybernetics and Informatics: Prague, Czech Republic, 2010; pp. 1–7. [Google Scholar]
- Mikolajczyk, K.; Schmid, C. A Performance Evaluation of Local Descriptors. IEEE Trans. PATTERN Anal. Mach. Intell. 2005, 27, 16. [Google Scholar] [CrossRef]
- DeCost, B.L.; Holm, E.A. A computer vision approach for automated analysis and classification of microstructural image data. Comput. Mater. Sci. 2015, 110, 126–133. [Google Scholar] [CrossRef]
- Jurie, F.; Triggs, B. Creating efficient codebooks for visual recognition. In Proceedings of the Tenth IEEE International Conference on Computer Vision (ICCV’05) Volume 1, Beijing, China, 17–21 October 2005; pp. 604–610. [Google Scholar]
- Krizhevsky, A.; Sutskever, I.; Hinton, G.E. ImageNet classification with deep convolutional neural networks. Commun. ACM 2017, 60, 84–90. [Google Scholar] [CrossRef]
- Szegedy, C.; Liu, W.; Jia, Y.; Sermanet, P.; Reed, S.; Anguelov, D.; Erhan, D.; Vanhoucke, V.; Rabinovich, A. Going deeper with convolutions. In Proceedings of the 2015 IEEE Conference on Computer Vision and Pattern Recognition (CVPR), Boston, MA, USA, 7–12 June 2015; pp. 1–9. [Google Scholar]
- He, K.; Zhang, X.; Ren, S.; Sun, J. Deep Residual Learning for Image Recognition. In Proceedings of the IEEE Conference on Computer Vision and Pattern Recognition, Las Vegas, NV, USA, 1–26 July 2016. [Google Scholar]
- Wang, D.; Khosla, A.; Gargeya, R.; Irshad, H.; Beck, A.H. Deep Learning for Identifying Metastatic Breast Cancer. arXiv 2016, arXiv:1606.05718. [Google Scholar]
- Liu, L.; Wang, H.; Wu, C. A machine learning method for the large-scale evaluation of urban visual environment. arXiv 2016, arXiv:1608.03396. [Google Scholar]
- Bossard, L.; Guillaumin, M.; Van Gool, L. Food-101–Mining Discriminative Components with Random Forests. In Computer Vision–ECCV 2014, Lecture Notes in Computer Science; Fleet, D., Pajdla, T., Schiele, B., Tuytelaars, T., Eds.; Springer: Berlin/Heidelberg, Germany, 2014; Volume 8694, pp. 446–461. ISBN 978-3-319-10598-7. [Google Scholar]
- Myers, A.; Johnston, N.; Rathod, V.; Korattikara, A.; Gorban, A.; Silberman, N.; Guadarrama, S.; Papandreou, G.; Huang, J.; Murphy, K. Im2Calories: Towards an Automated Mobile Vision Food Diary. In Proceedings of the 2015 IEEE International Conference on Computer Vision (ICCV), Santiago, Chile, 7–13 December 2015; pp. 1233–1241. [Google Scholar]
- Simonyan, K.; Zisserman, A. Very Deep Convolutional Networks for Large-Scale Image Recognition. arXiv 2015, arXiv:1409.1556. [Google Scholar]
- Pan, L.; Pouyanfar, S.; Chen, H.; Qin, J.; Chen, S.-C. DeepFood: Automatic Multi-Class Classification of Food Ingredients Using Deep Learning. In Proceedings of the 2017 IEEE 3rd International Conference on Collaboration and Internet Computing (CIC), San Jose, CA, USA, 15–17 October 2017; pp. 181–189. [Google Scholar]
- Chen, J.; Ngo, C. Deep-based Ingredient Recognition for Cooking Recipe Retrieval. In Proceedings of the 2016 ACM on Multimedia Conference-MM ’16, Amsterdam, The Netherlands, 15–19 October 2016; pp. 32–41. [Google Scholar]
- Kusmierczyk, T.; Trattner, C.; Nørvåg, K. Understanding and Predicting Online Food Recipe Production Patterns. In Proceedings of the 27th ACM Conference on Hypertext and Social Media-HT ’16, Halifax, NS, Canada, 10–13 July 2016; pp. 243–248. [Google Scholar]
- Farinella, G.M.; Allegra, D.; Moltisanti, M.; Stanco, F.; Battiato, S. Retrieval and classification of food images. Comput. Biol. Med. 2016, 77, 23–39. [Google Scholar] [CrossRef]
- Appleton, K.M.; Smith, E. A Role for Identification in the Gradual Decline in the Pleasantness of Flavors with Age. J. Gerontol. B. Psychol. Sci. Soc. Sci. 2016, 71, 987–994. [Google Scholar] [CrossRef] [PubMed]
- Geirhos, R.; Michaelis, C.; Wichmann, F.A.; Rubisch, P.; Bethge, M.; Brendel, W. Imagenet-trained CNNS are biased towards texture; increasing shape bias improves accuracy and robustness. arXiv 2019, arXiv:1811.12231. [Google Scholar]
- Aldridge, V.; Dovey, T.M.; Halford, J.C.G. The role of familiarity in dietary development. Dev. Rev. 2009, 29, 32–44. [Google Scholar] [CrossRef]
- Heath, P.; Houston-Price, C.; Kennedy, O.B. Increasing food familiarity without the tears. A role for visual exposure? Appetite 2011, 57, 832–838. [Google Scholar] [CrossRef] [PubMed]
- Tan, H.S.G.; van den Berg, E.; Stieger, M. The influence of product preparation, familiarity and individual traits on the consumer acceptance of insects as food. Food Qual. Prefer. 2016, 52, 222–231. [Google Scholar] [CrossRef]
- Trattner, C.; Elsweiler, D. Food Recommender Systems: Important Contributions, Challenges and Future Research Directions. arXiv 2017, arXiv:1711.02760. [Google Scholar]
- Schedl, M.; Knees, P.; McFee, B.; Bogdanov, D.; Kaminskas, M. Music Recommender Systems. In Recommender Systems Handbook; Ricci, F., Rokach, L., Shapira, B., Eds.; Springer: Berlin/Heidelberg, Germany, 2015; ISBN 978-1-4899-7636-9. pp. 453–492. [Google Scholar]
- Marin, J.; Biswas, A.; Ofli, F.; Hynes, N.; Salvador, A.; Aytar, Y.; Weber, I.; Torralba, A. Recipe1M+: A Dataset for Learning Cross-Modal Embeddings for Cooking Recipes and Food Images. arXiv 2019, arXiv:1810.06553. [Google Scholar]
- Goel, N.; Faltings, B. Crowdsourcing with Fairness, Diversity and Budget Constraints. arXiv 2019, arXiv:1810.13314. [Google Scholar]
- Elsweiler, D.; Trattner, C.; Harvey, M. Exploiting Food Choice Biases for Healthier Recipe Recommendation. In Proceedings of the 40th International ACM SIGIR Conference on Research and Development in Information Retrieval, Tokyo, Japan, 7–11 August 2017; pp. 575–584. [Google Scholar]
- Rokicki, M.; Trattner, C.; Herder, E. The Impact of Recipe Features, Social Cues and Demographics on Estimating the Healthiness of Online Recipes. In Proceedings of the Twelfth International AAAI Conference on Web and Social Media, Palo Alto, CA, USA, 25–28 June 2018. [Google Scholar]


| Question | Scale |
|---|---|
| Personal information | |
| Age | <18, 18–24, 25–34, 35–44, 45–55, >55 |
| Gender | Male, Female, Other |
| Nationality | Select from a drop-down list |
| Experiences with the recipe portals | |
| Familiarity with each recipe portal | Likert scale 1 (Not at all)–5 (Very familiar) |
| Frequency of using recipe portals | Hardly use, At least once every three months, At least once per month, At least once per week, Use on a daily basis |
| Settlement and travel experience | |
| Experience in China | Never visited, I have been there once or a few times, I visit or have visited regularly, I have lived there for many months or longer, I am a permanent resident |
| Experience in USA | Never visited, I have been there once or a few times, I visit or have visited regularly, I have lived there for many months or longer, I am a permanent resident |
| Experience in Germany | Never visited, I have been there once or a few times, I visit or have visited regularly, I have lived there for many months or longer, I am a permanent resident |
| Frequency of cross-continental travelling | Never, Less than once per year, 1–2 times per year, More than 2 times per year |
| Interests in food/recipes from foreign cultures | |
| Interest in food/recipes from other cultures | Likert scale 1 (No interest at all)–5 (Very interested) |
| Frequency of trying food/recipe from other cultures | Hardly ever, Less than once per month, At least once per month, At least once per week, Most days |
| Free-text field | Blank space left for all participants |
| Features | Accuracy | ||
|---|---|---|---|
| NB | LOG | RF | |
| EVF (Brightness) | 0.41 | 0.41 | 0.42 |
| EVF (Sharpness) | 0.41 | 0.41 | 0.43 |
| EVF (Contrast) | 0.37 | 0.37 | 0.42 |
| EVF (Colourfulness) | 0.38 | 0.38 | 0.41 |
| EVF (Entropy) | 0.38 | 0.37 | 0.40 |
| EVF (RGB contrast) | 0.38 | 0.38 | 0.41 |
| EVF (Sharpness variation) | 0.41 | 0.41 | 0.41 |
| EVF (Saturation) | 0.39 | 0.39 | 0.40 |
| EVF (Saturation variation) | 0.39 | 0.38 | 0.41 |
| EVF (Naturalness) | 0.38 | 0.38 | 0.40 |
| EVF (All features) | 0.47 | 0.54 | 0.55 |
| Colour histogram | 0.43 | 0.52 | 0.54 |
| LBP | 0.48 | 0.52 | 0.52 |
| SIFT | 0.58 | 0.72 | 0.67 |
| DNN | 0.67 | 0.86 | 0.78 |
| All features | 0.73 | 0.89 | 0.85 |
| Accuracy | ||||||
|---|---|---|---|---|---|---|
| NB | LOG | RF | ||||
| Recipe’s Origin | Participants’ Judgements | Recipe’s Origin | Participants’ Judgements | Recipe’s Origin | Participants’ Judgements | |
| EVF (Brightness) | 0.43 | 0.36 | 0.41 | 0.33 | 0.41 | 0.34 |
| EVF (Sharpness) | 0.41 | 0.36 | 0.43 | 0.37 | 0.44 | 0.36 |
| EVF (Contrast) | 0.37 | 0.34 | 0.37 | 0.34 | 0.35 | 0.34 |
| EVF (Colourfulness) | 0.41 | 0.34 | 0.40 | 0.34 | 0.40 | 0.34 |
| EVF (Entropy) | 0.38 | 0.36 | 0.38 | 0.36 | 0.39 | 0.36 |
| EVF (RGB Contrast) | 0.37 | 0.34 | 0.38 | 0.35 | 0.37 | 0.35 |
| EVF (Sharpness variation) | 0.42 | 0.36 | 0.43 | 0.36 | 0.42 | 0.37 |
| EVF (Saturation) | 0.42 | 0.32 | 0.42 | 0.34 | 0.41 | 0.34 |
| EVF (Saturation variation) | 0.39 | 0.36 | 0.39 | 0.34 | 0.39 | 0.37 |
| EVF (Naturalness) | 0.39 | 0.36 | 0.40 | 0.36 | 0.40 | 0.34 |
| EVF (All features) | 0.50 | 0.38 | 0.56 | 0.38 | 0.55 | 0.38 |
| Colour histogram | 0.37 | 0.34 | 0.49 | 0.36 | 0.54 | 0.38 |
| LBP | 0.47 | 0.38 | 0.50 | 0.38 | 0.51 | 0.39 |
| SIFT | 0.57 | 0.40 | 0.52 | 0.39 | 0.65 | 0.44 |
| DNN | 0.66 | 0.43 | 0.82 | 0.42 | 0.77 | 0.45 |
| All features (Visually) | 0.69 | 0.43 | 0.85 | 0.43 | 0.84 | 0.46 |
| Ingredients | 0.34 | 0.35 | 0.34 | 0.35 | 0.34 | 0.35 |
| Type | 0.34 | 0.35 | 0.34 | 0.35 | 0.34 | 0.35 |
| Colour | 0.35 | 0.34 | 0.35 | 0.34 | 0.35 | 0.34 |
| Shape | 0.33 | 0.33 | 0.32 | 0.33 | 0.32 | 0.33 |
| Container | 0.34 | 0.36 | 0.34 | 0.36 | 0.34 | 0.36 |
| Eating utensils | 0.35 | 0.36 | 0.35 | 0.36 | 0.35 | 0.36 |
| Instinct | 0.35 | 0.36 | 0.35 | 0.36 | 0.35 | 0.36 |
| All factors | 0.34 | 0.38 | 0.35 | 0.37 | 0.35 | 0.36 |
| Factors | Count | Percentage |
|---|---|---|
| Ingredients, Type | 226 | 84% |
| Type | 226 | 84% |
| Ingredients | 164 | 61% |
| Instinct | 127 | 47% |
| Ingredients, Colour, Type | 94 | 35% |
| Shape, Type | 76 | 28% |
| Ingredients, Shape, Type | 76 | 28% |
| Ingredients, Type, Instinct | 75 | 28% |
| Ingredients, Colour | 62 | 23% |
| Type, Instinct | 62 | 23% |
| Categories | N 1 | Description | Examples 2 | |
|---|---|---|---|---|
| Food Factors | Adjective | 24 | Participants left single adjective to describe the food in the recipe image | GE_96 3: good US_98: healthy |
| Style | 26 | Participants reported how the food looked in the recipe image | CH_30: Chinese dish is generally not so ugly US_85: Plate design GE_1: Size of the food | |
| Ingredients | 17 | Participants reported at least one ingredient they saw in the recipe image | CH_10: There is rice US_95: The egg on top looks like oriental food. GE_58: Contains coriander and Chili? | |
| Cooking methods | 5 | Participants reported how to cook the food in the recipe image | CH_13: Production methods, it’s barbecue | |
| Non-food factors | Text | 49 | Participants reported the letters, characters or water marks, etc. they saw in the recipe image | CH_42: “猪肉” is Chinese character US_77: German writing GE_64: Date format: 19.02.2013 is German |
| Object/Background | 16 | Participants described the objects or setting in the recipe image instead of the food itself | CH_30: Stairs US_55: Newspaper GE_31: Kitchen utensils | |
| Photo | 9 | Participants described the photographic and post-processing of the recipe image instead of the food itself | CH_51: A popular filter was used US_72: Angle of the photo, light in the photo GE_39: Bad lighting | |
| Personal experience | 2 | Participants reported their own experience with the food in the recipe image | US_5: I know this type of food CH_41: It seems like I’ve eaten this | |
| Unknown | 18 | Participants left comments but offered deficient information | CH_41: It could come from any portal US_3: not sure what type of food that is GE_96: nothing | |
| Dependent Variable Correct/Wrong Answer | |||
|---|---|---|---|
| Coef(β) | 95% CI | OR | |
| Constant | −0.192 | [−0.364, −0.020] | 0.825 |
| Ingredients | 0.069 | [−0.085, 0.223] | 1.071 |
| Type | 0.184 * | [0.031, 0.338] | 1.202 * |
| Colour | 0.031 | [−0.134, 0.196] | 1.031 |
| Shape | −0.063 | [−0.229, 0.102] | 0.939 |
| Container | 0.013 | [−0.170, 0.196] | 1.013 |
| Eating utensils | 0.394 ** | [0.132, 0.657] | 1.483 ** |
| Instinct | 0.008 | [−0.163, 0.178] | 1.008 |
| McFadden’s R2 | 0.004 | ||
| Log likelihood | −1863.5 | ||
| AIC | 3743 | ||
| Dependent Variable | |||||||||
|---|---|---|---|---|---|---|---|---|---|
| Confidence on Xiachufang | Confidence on Allrecipes | Confidence on Kochbar | |||||||
| Coef(β) | 95% CI | OR | Coef(β) | 95% CI | OR | Coef(β) | 95% CI | OR | |
| Ingredients | 0.009 | [−0.126, 0.145] | 1.009 | −0.098 | [−0.233, 0.038] | 0.907 | −0.220 ** | [−0.356, −0.839] | 0.803 ** |
| Type | −0.294 *** | [−0.430, −0.158] | 0.745 *** | −0.030 | [−0.167, 0.105] | 0.970 | −0.031 | [−0.167, 0.104] | 0.970 |
| Colour | 0.156 * | [0.009, 0.302] | 1.168 * | −0.147 * | [−0.294, −0.000] | 0.863 * | −0.102 | [−0.249, 0.044] | 0.903 |
| Shape | 0.010 | [−0.137, 0.156] | 1.010 | −0.145 | [−0.292, 0.001] | 0.865 | −0.004 | [−0.151, 0.142] | 0.996 |
| Container | 0.241 ** | [0.078, 0.405] | 1.273 ** | −0.011 | [−0.172, 0.151] | 0.990 | −0.143 | [−0.306, 0.020] | 0.867 |
| Eating utensils | 0.365 ** | [0.123, 0.608] | 1.440 ** | −0.258 * | [−0.489, −0.027] | 0.772 * | −0.177 | [−0.413, 0.060] | 0.838 |
| Instinct | −0.208 ** | [−0.360, −0.057] | 0.812 ** | −0.198 * | [−0.349, −0.047] | 0.820 * | −0.093 | [−0.245, 0.060] | 0.912 |
| MacFadden’s R2 | 0.006 | 0.003 | 0.002 | ||||||
| Log likelihood | −4256.70 | −4248.05 | −4233.68 | ||||||
| AIC | 8535.41 | 8518.09 | 8489.36 | ||||||
| Overall Accuracy | Accuracy on Xiachufang | Accuracy on Allrecipes | Accuracy on Kochbar | |
|---|---|---|---|---|
| Mean (+/− Std) | Mean (+/− Std) | Mean (+/− Std) | Mean (+/−Std) | |
| Gender | ||||
| Male | 0.49(+/−0.17) | 0.51(+/−0.29) | 0.44(+/−0.28) | 0.51(+/−0.30) * |
| Female | 0.50(+/−0.18) | 0.61(+/−0.28) ** | 0.46(+/−0.28) | 0.44(+/−0.31) |
| Age | ||||
| Age <35 | 0.50(+/−0.18) | 0.59(+/−0.29) ** | 0.41(+/−0.27) | 0.50(+/−0.30) * |
| Age ≥35 | 0.48(+/−0.17) | 0.49(+/−0.29) | 0.52(+/−0.27) *** | 0.50(+/−0.30) |
| Experience of each country (China) | ||||
| Never visited–been there a few times | 0.49(+/−0.17) | 0.51(+/−0.29) | 0.47(+/−0.27) * | 0.49(+/−0.29) |
| Visit regularly–permanent resident | 0.50(+/−0.18) | 0.63(+/−0.28) *** | 0.41(+/−0.29) | 0.45(+/−0.31) |
| Experience of each country (The US) | ||||
| Never visited–been there a few times | 0.49(+/−0.18) | 0.61(+/−0.29) *** | 0.39(+/−0.28) | 0.49(+/−0.31) |
| Visit regularly–permanent resident | 0.48(+/−0.17) | 0.47(+/−0.27) | 0.53(+/−0.26) *** | 0.46(+/−0.30) |
| Experience of each country (Germany) | ||||
| Never visited–been there a few times | 0.48(+/−0.18) | 0.56(+/−0.27) | 0.46(+/−0.28) | 0.43(+/−0.31) |
| Visit regularly–permanent resident | 0.50(+/−0.17) | 0.55(+/−0.31) | 0.43(+/−0.28) | 0.54(+/−0.29) *** |
| Familiarity with each recipe portal (Xiachufang.com) | ||||
| Not familiar (≥2 on Likert scale) Familiar (≤3 on the Likert scale) | 0.51(+/−0.17) ** 0.46(+/−0.17) | 0.55(+/−0.29) 0.57(+/−0.31) | 0.46(+/−0.28) 0.42(+/−0.28) | 0.52(+/−0.29) *** 0.39(+/−0.31) |
| Familiarity with each recipe portal (Allrecipes.com) | ||||
| Not familiar (≥2 on Likert scale) Familiar (≤3 on the Likert scale) | 0.50(+/−0.17) 0.48(+/−0.17) | 0.62(+/−0.28) *** 0.48(+/−0.28) | 0.40(+/−0.28) 0.50(+/−0.27) *** | 0.50(+/−0.29) 0.46(+/−0.31) |
| Familiarity with each recipe portal (Kochbar.de) | ||||
| Not familiar (≥2 on Likert scale) Familiar (≤3 on the Likert scale) | 0.50(+/−0.17) 0.48(+/−0.18) | 0.58(+/−0.28) * 0.50(+/−0.32) | 0.44(+/−00.28) 0.46(+/−0.28) | 0.48(+/−0.30) 0.48(+/−0.31) |
| Interest in food from foreign cultures | ||||
| Not interested (≥2 on Likert scale) | 0.41(+/−0.23) | 0.46(+/−0.28) | 0.33(+/−0.33) | 0.45(+/−0.39) |
| Interested (≤3 on the Likert scale) | 0.50(+/−0.17) * | 0.56(+/−0.29) * | 0.46(+/−0.27) * | 0.48(+/−0.30) |
| Interest in recipes from foreign cultures | ||||
| Not interested (≥2 on Likert scale) Interested (≤3 on the Likert scale) | 0.45(+/−0.23) 0.50(+/−0.17) * | 0.50(+/−0.27) 0.56(+/−0.29) | 0.37(+/−0.33) 0.46(+/−0.27) * | 0.47(+/−0.34) 0.48(+/−0.30) |
| Frequency of trying recipes from other cultures | ||||
| Once per month | 0.48(+/−0.18) | 0.58(+/−0.29) * | 0.41(+/−0.28) | 0.46(+/−0.29) |
| Once per month | 0.50(+/−0.17) | 0.52(+/−0.29) | 0.49(+/−0.27) ** | 0.50(+/−0.32) ** |
© 2020 by the authors. Licensee MDPI, Basel, Switzerland. This article is an open access article distributed under the terms and conditions of the Creative Commons Attribution (CC BY) license (http://creativecommons.org/licenses/by/4.0/).
Share and Cite
Zhang, Q.; Elsweiler, D.; Trattner, C. Visual Cultural Biases in Food Classification. Foods 2020, 9, 823. https://doi.org/10.3390/foods9060823
Zhang Q, Elsweiler D, Trattner C. Visual Cultural Biases in Food Classification. Foods. 2020; 9(6):823. https://doi.org/10.3390/foods9060823
Chicago/Turabian StyleZhang, Qing, David Elsweiler, and Christoph Trattner. 2020. "Visual Cultural Biases in Food Classification" Foods 9, no. 6: 823. https://doi.org/10.3390/foods9060823
APA StyleZhang, Q., Elsweiler, D., & Trattner, C. (2020). Visual Cultural Biases in Food Classification. Foods, 9(6), 823. https://doi.org/10.3390/foods9060823