Physical, Chemical, and Microbiological Characteristics of Pulque: Management of a Fermented Beverage in Michoacán, Mexico


Abstract
1. Introduction
2. Materials and Methods
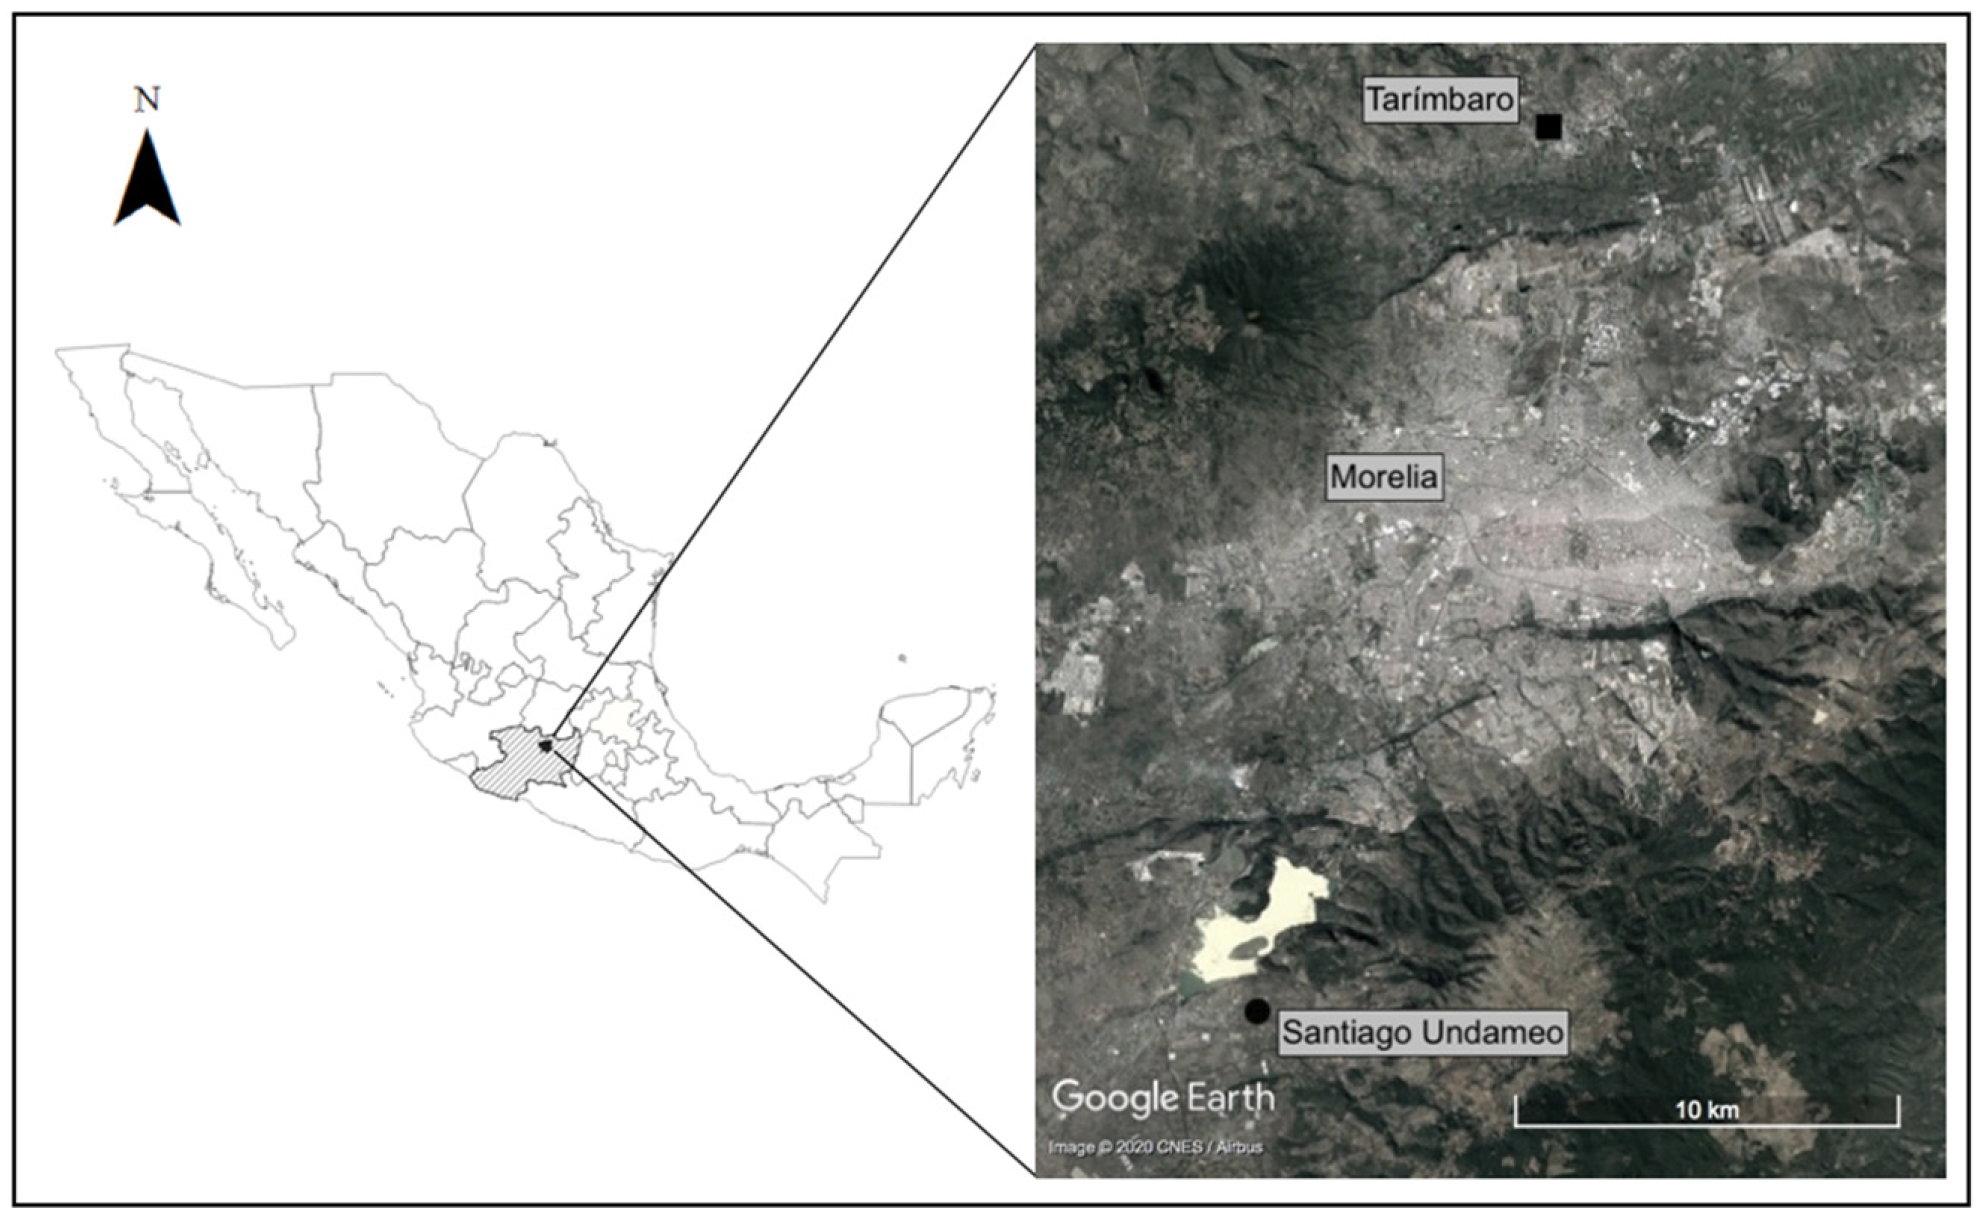
2.1. Study Site
2.2. Ethnobiological Fieldwork
2.3. Evaluation of Physical and Chemical Characteristics of Fermentation Phases
2.4. Microbiological Characterization of the Beverages through Colony-Forming Units (CFU)
2.5. Statistical Analyses
3. Results
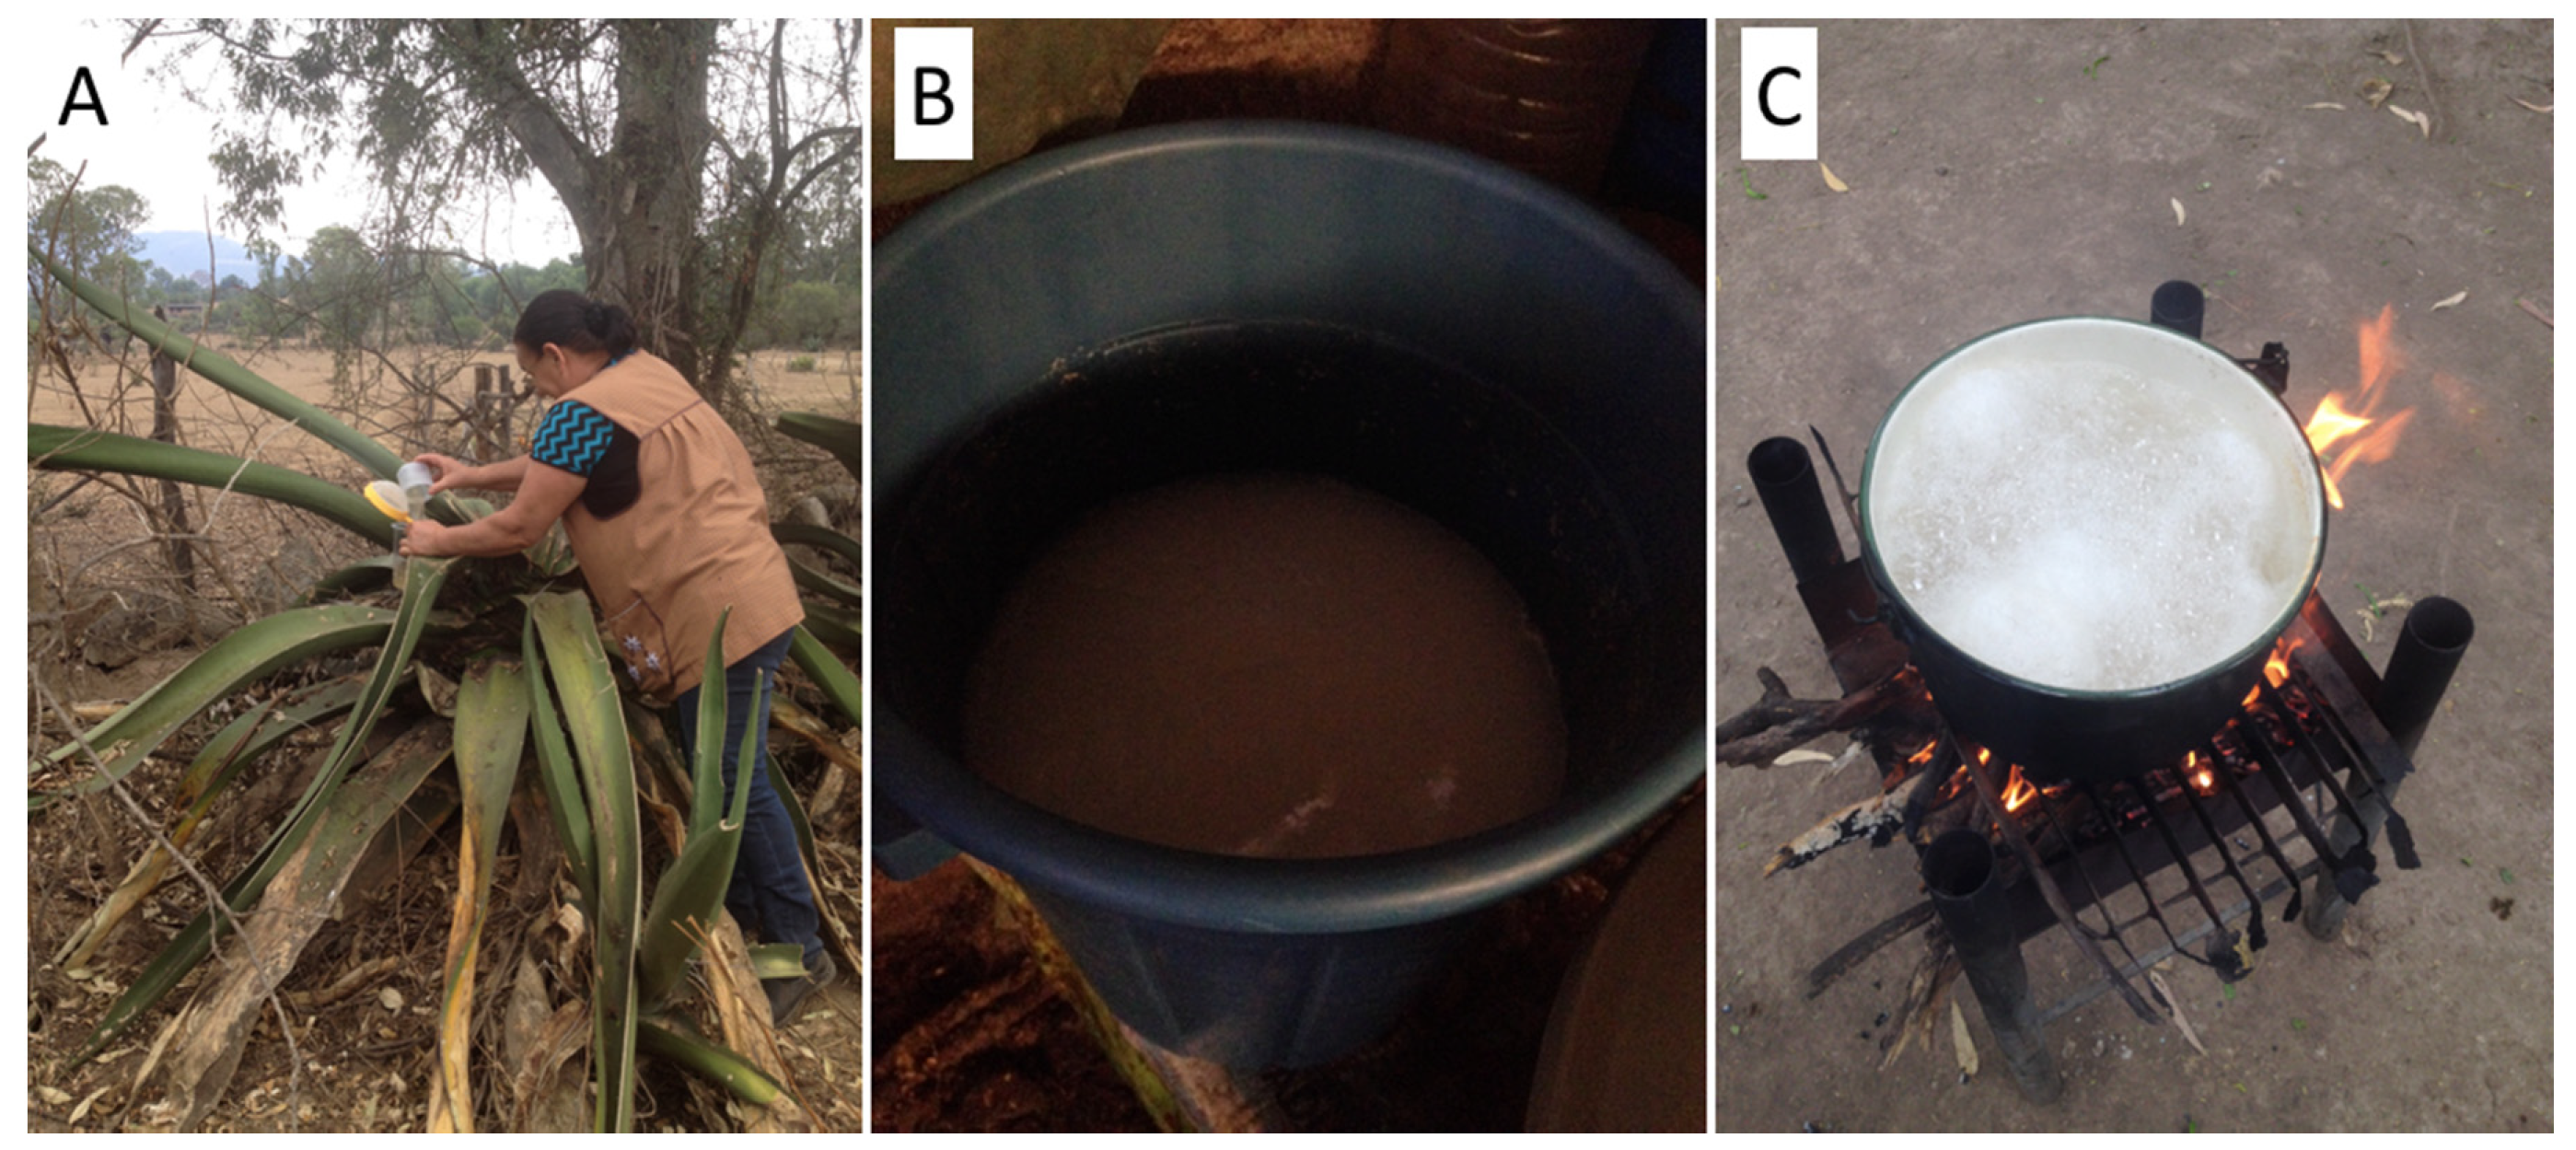
3.1. Sap Management for Pulque Production
3.2. Physical and Chemical Characteristics of Sap and Pulque
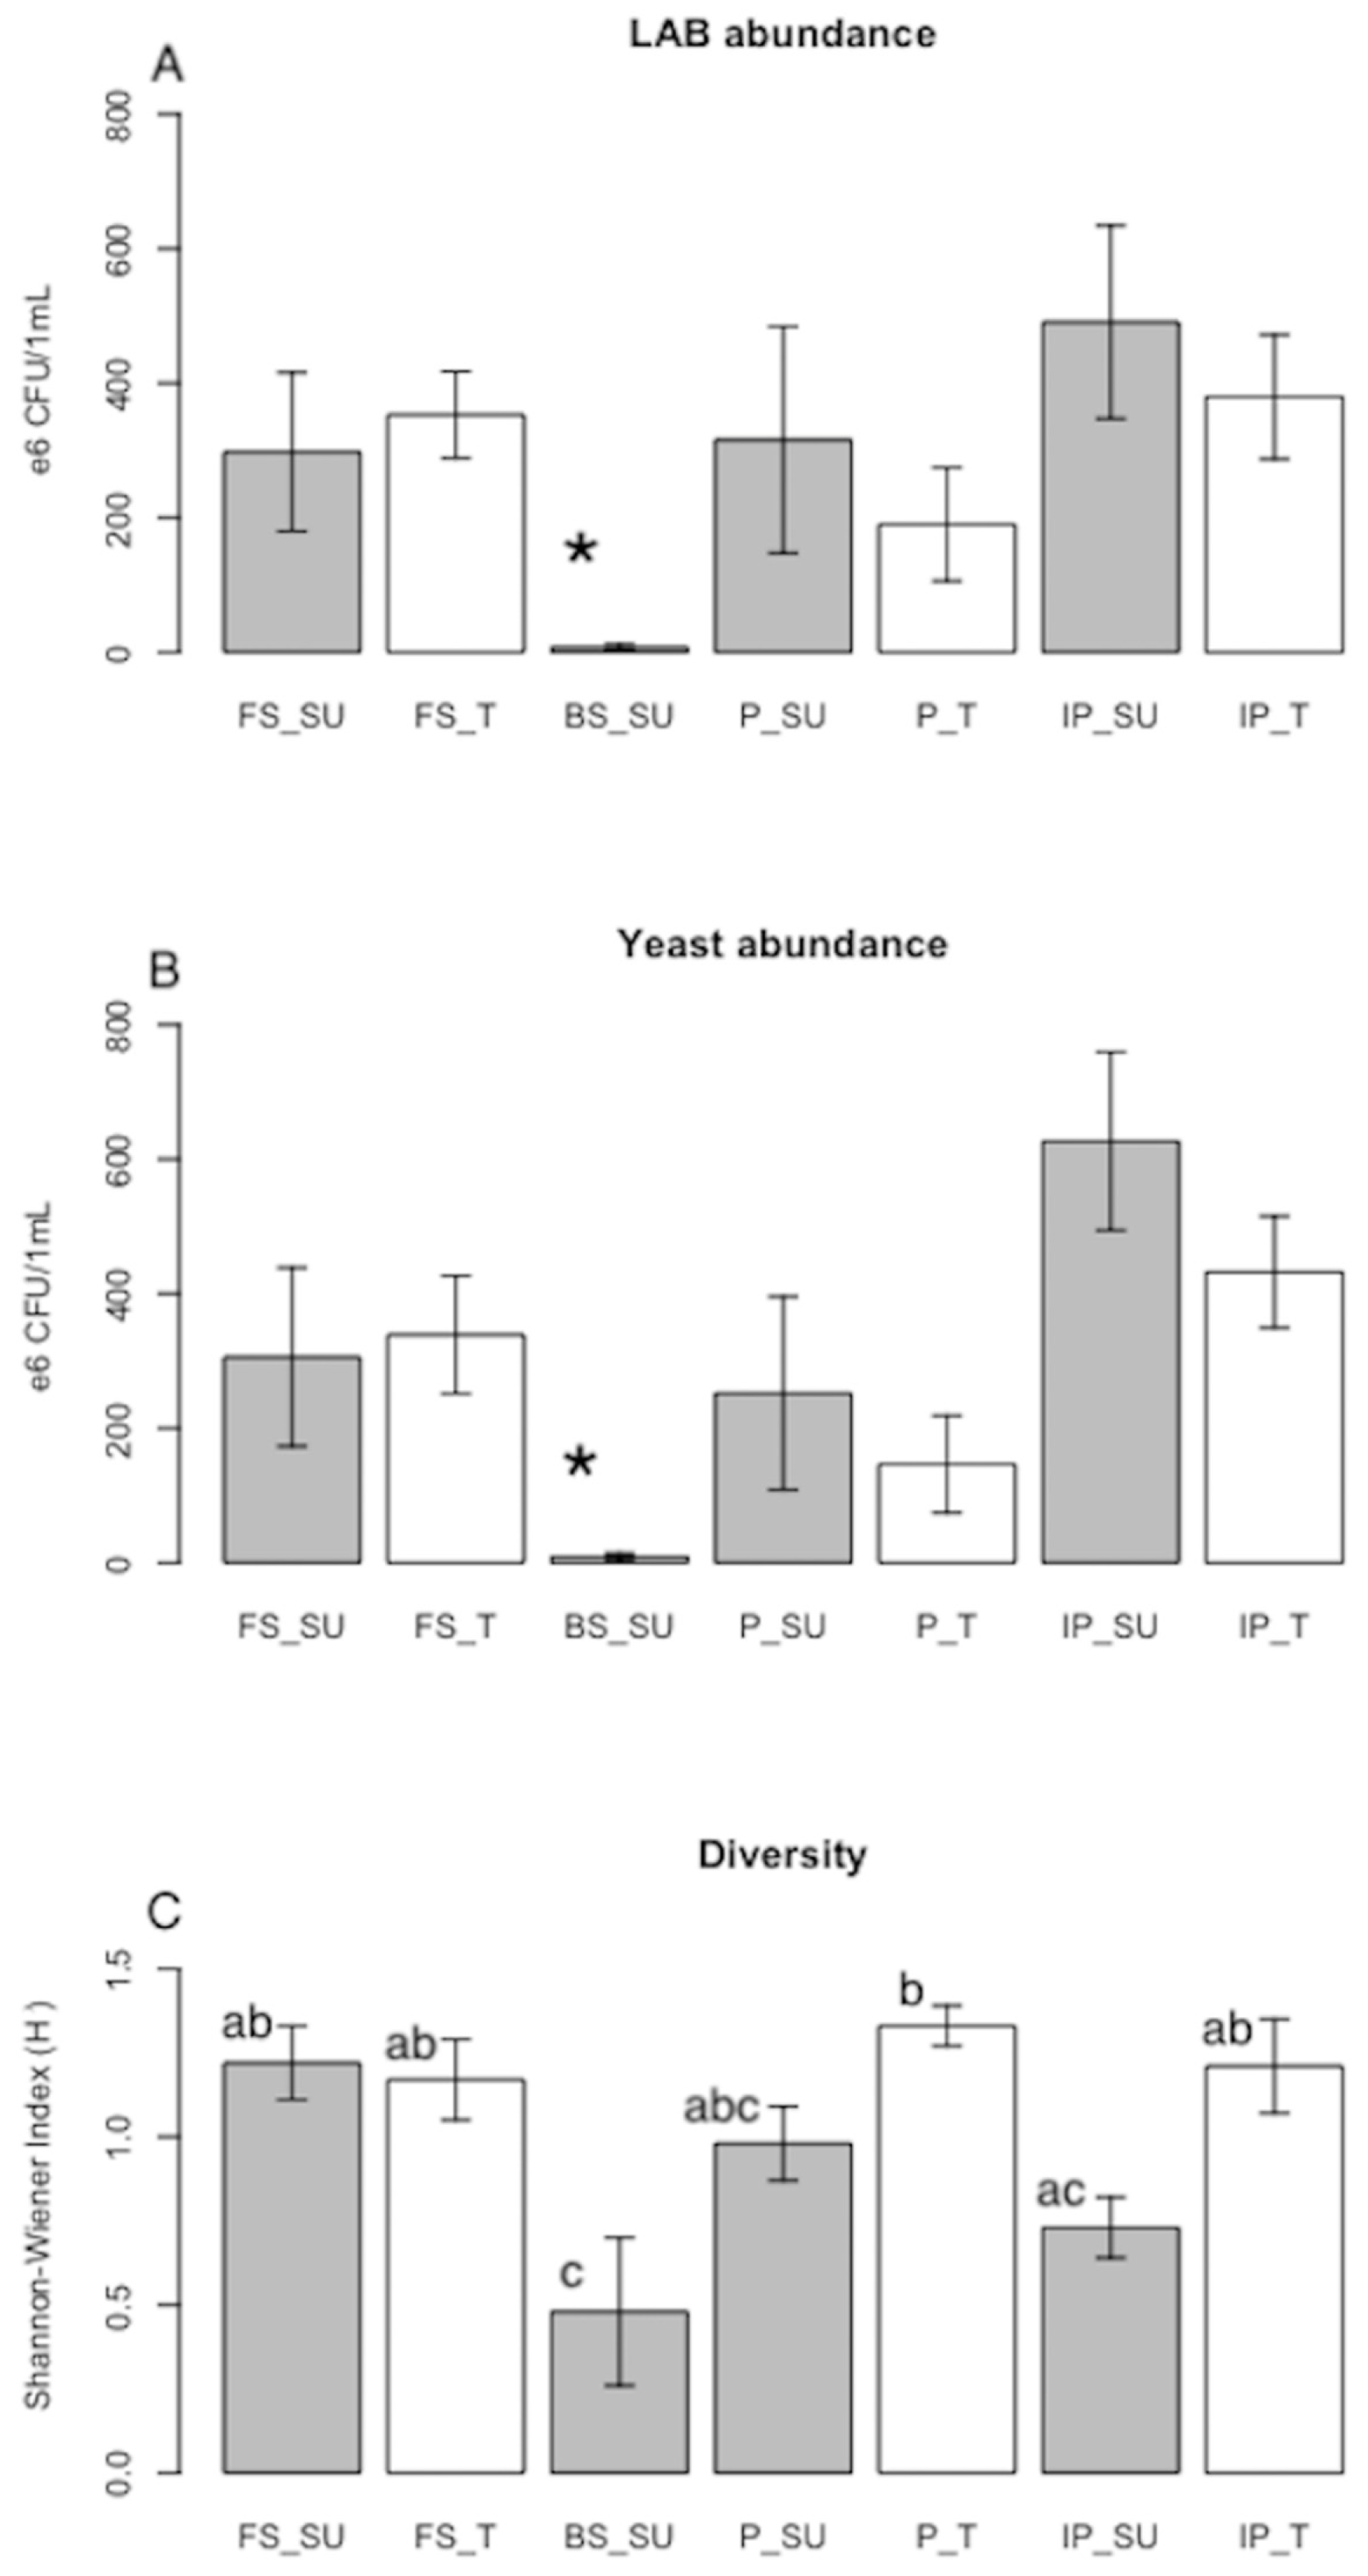
3.3. Fermenting Microorganisms
4. Discussion
4.1. Pulque Management in the State of Michoacán: Similarities and Contrasts with Other Regions
4.2. Importance of the Fermenting Microorganisms
4.3. Mexican Norms for Pulque Flavor and Identity
5. Conclusions
Author Contributions
Funding
Acknowledgments
Conflicts of Interest
Ethical Statement
References
- Cavalieri, D.; McGovern, P.E.; Hartl, D.; Mortimer, R.; Polsinelli, M. Evidence for S. cerevisiae Fermentation in Ancient Wine. J. Mol. Evol. 2003, 57, S226–S232. [Google Scholar] [CrossRef]
- McGovern, P.E.; Zhang, J.; Tang, J.; Zhang, Z.; Hall, G.R.; Moreau, R.A.; Nuñez, A.; Butrym, E.D.; Richards, M.P.; Wang, C.S.; et al. Fermented beverages of pre- and proto-historic China. Proc. Natl. Acad. Sci. USA 2004, 101, 17593–17598. [Google Scholar] [CrossRef] [PubMed]
- Ross, R.; Morgan, S.; Hill, C. Preservation and fermentation: Past, present and future. Int. J. Food Microbiol. 2002, 79, 3–16. [Google Scholar] [CrossRef]
- Caplice, E.; Fizgerald, G. Food fermentations: Role of microorganisms in food production and preservation. Int. J. Food Microbiol. 1999, 50, 131–149. [Google Scholar] [CrossRef]
- Legras, J.L.; Merdinoglu, D.; Cornuet, J.; Karst, F. Bread, beer and wine: Saccharomyces cerevisiae diversity reflects human history. Mol. Ecol. 2007, 16, 2091–2102. [Google Scholar] [CrossRef]
- Katz, S.E. The Art of Fermentation: An in-Depth Exploration of Essential Concepts and Processes from around the World; Chelsea Green Publishing: Hartford, CT, USA, 2012. [Google Scholar]
- Cavanagh, D.; Fitzgerald, G.F.; McAuliffe, O. From field to fermentation: The origins of Lactococcus lactis and its domestication to the dairy environment. Food Microbiol. 2015, 47, 45–61. [Google Scholar] [CrossRef]
- Gibbons, J.G.; Rinker, D.C. The genomics of microbial domestication in the fermented food environment. Curr. Opin. Genet. Dev. 2015, 35, 1–8. [Google Scholar] [CrossRef]
- Douglas, G.L.; Klaenhammer, T.R. Genomic Evolution of Domesticated Microorganisms. Annu. Rev. Food Sci. Technol. 2010, 1, 397–414. [Google Scholar] [CrossRef]
- Bokulich, N.; Ohta, M.; Lee, M.; Mills, D. Indigenous bacteria and fungi drive traditional kimoto sake fermentations. Appl. Environ. Microbiol. 2014, 80, 5522–5529. [Google Scholar] [CrossRef]
- Eldarov, A.M.; Kishkovskaia, S.A.; Tanaschuk, T.N.; Mardanov, A.V. Genomics and Biochemistry of Saccharomyces cerevisiae Wine Yeast Strains. Biochemistry 2016, 81, 1650–1668. [Google Scholar] [CrossRef]
- Álvarez-Ríos, G.D. Del Maguey Al Vaso: El Manejo Del Pulque en Las Pulquerías Del D.F. y Las Localidades Abastecedoras [From the Maguey to the Glass: The Management of Pulque in the Pulquerías of the Mexico City and in the Supplying Locations]. Bachelor’s Thesis, Universidad Nacional Autónoma de México, Morelia, Mexico, 2015. [Google Scholar]
- Herrera-Cano, A.N.; Suárez, M.E. Ethnobiology of algarroba beer, the ancestral fermented beverage of the Wichí people of the Gran Chaco I: A detailed recipe and a thorough analysis of the process. J. Ethn. Food 2020, 7. [Google Scholar] [CrossRef]
- Gallone, B.; Steensels, J.; Prahl, T.; Soriaga, L.; Saels, V.; Herrera-Malaver, B.; Merlevede, A.; Roncoroni, M.; Voordeckers, K.; Miraglia, L.; et al. Domestication and Divergence of Saccharomyces cerevisiae Beer Yeasts. Cell 2016, 166, 1397–1410. [Google Scholar] [CrossRef] [PubMed]
- Giles-Gómez, M.; García, J.G.S.; Matus, V.; Quintana, I.C.; Bolívar, F.; Escalante, A. In vitro and in vivo probiotic assessment of Leuconostoc mesenteroides P45 isolated from pulque, a Mexican traditional alcoholic beverage. Springer Plus 2016, 5, 708. [Google Scholar] [CrossRef] [PubMed]
- Kleerebezem, M.; Hugenholtz, J. Metabolic pathway engineering in lactic acid bacteria. Curr. Opin. Biotechnol. 2003, 14, 232–237. [Google Scholar] [CrossRef]
- Campbell-Platt, G. Fermented foods—A world perspective. Food Res. Int. 1994, 27, 253–257. [Google Scholar] [CrossRef]
- Nabhan, G.P. Ethnobiology for a diverse world: Microbial ethnobiology and the loss of distinctive food cultures. J. Ethnobiol. 2010, 30, 181–183. [Google Scholar] [CrossRef]
- Alcántara-Hernández, R.J.; Rodríguez-Álvarez, J.A.; Valenzuela-Encinas, C.; Gutiérrez-Miceli, F.A.; Castañón-González, H.; Marsch, R.; Ayora-Talavera, T.; Dendooven, L. The bacterial community in ‘taberna’ a traditional beverage of Southern Mexico. Lett. Appl. Microbiol. 2010, 51, 558–563. [Google Scholar] [CrossRef]
- Godoy, A.; Herrera, T.; Ulloa, M. Más allá del Pulque y el Tepache. Las Bebidas Alcohólicas no Destiladas Indígenas de México; Universidad Nacional Autónoma de México: Morelia, Mexico, 2003. [Google Scholar]
- Ojeda-Linares, C.I.; Vallejo, M.; Lappe-Oliveras, P.; Casas, A. Traditional management of microorganisms in fermented beverages from cactus fruits in Mexico: An ethnobiological approach. J. Ethnobiol. Ethnomedicine 2020, 16. [Google Scholar] [CrossRef]
- Chuchiak, J. “It Is Their Drinking That Hinders Them”: Balché and the Use of Ritual Intoxicants Among the Colonial Yucatec Maya, 1550–1780. Estud. Cult. Maya 2003, 24, 137–171. [Google Scholar]
- Kennedy, J. Tesguino Complex: The Role of Beer in Tarahumara Culture. Am. Anthropol. 1963, 65, 620–640. [Google Scholar] [CrossRef]
- Machuca, P. El vino de cocos en la Nueva España. In Historia de una Transculturación en el Siglo XVII; Colegio de Michoacán: Zamora, Michoacán, Mexico, 2018. [Google Scholar]
- Omar, N.B.; Ampe, F. Microbial Community Dynamics during Production of the Mexican Fermented Maize Dough Pozol. Appl. Environ. Microbiol. 2000, 66, 3664–3673. [Google Scholar] [CrossRef] [PubMed]
- Escalante, A.; Giles-Gómez, M.; Hernández, G.; Córdova-Aguilar, M.S.; López-Munguía, A.; Gosset, G.; Bolívar, F. Analysis of bacterial community during the fermentation of pulque, a traditional Mexican alcoholic beverage, using a polyphasic approach. Int. J. Food Microbiol. 2008, 124, 126–134. [Google Scholar] [CrossRef] [PubMed]
- Álvarez-Ríos, G.D.; Pacheco-Torres, F.; Figueredo-Urbina, C.J.; Casas, A. Management, morphological and genetic diversity of domesticated agaves in Michoacán, México. J. Ethnobiol. Ethnomedicine 2020, 16. [Google Scholar] [CrossRef] [PubMed]
- Colunga-GarcíaMarín, P.; Torres-García, I.; Casas, A.; Figueredo Urbina, C.J.; Rangel-Landa, S.; Delgado-Lemus, A.; Vargas, O.; Cabrera-Toledo, D.; Zizumbo-Villarreal, D.; Aguirre-Dugua, X.; et al. Los agaves y las prácticas mesoamericanas de aprovechamiento, manejo y domesticación [Agaves and Mesoamerican practices of exploitation, management and domestication]. In Domesticación en el Continente Americano; Universidad Nacional Autónoma de México: Morelia, Mexico, 2017; pp. 273–308. [Google Scholar]
- Correa-Ascencio, M.; Robertson, I.G.; Cabrera-Cortés, O.; Cabrera-Castro, R.; Evershed, R.P. Pulque production from fermented agave sap as a dietary supplement in Prehispanic Mesoamerica. Proc. Natl. Acad. Sci. USA 2014, 111, 14223–14228. [Google Scholar] [CrossRef] [PubMed]
- Robertson, I.G.; Cabrera-Cortés, M.O. Teotihuacan pottery as evidence for subsistence practices involving maguey sap. Archaeol. Anthropol. Sci. 2017, 9, 11–27. [Google Scholar] [CrossRef]
- Goncalves de Lima, O. El Maguey y el Pulque en los Códices Mexicanos; Fondo de Cultura Económica: Mexico City, Mexico, 1986. [Google Scholar]
- Sahagún, B. Historia General de las Cosas de Nueva España, 6th ed.; Editorial Porrúa: Mexico City, Mexico, 1985. [Google Scholar]
- Blas-Yañez, S.; Thomé-Ortiz, H.; Vizcarra-Bordi, I.; Espinoza-Ortega, A. Street sale of pulque and sociospatial practices: A gender perspective in central Mexico. J. Ethn. Foods 2018, 5, 311–316. [Google Scholar] [CrossRef]
- Enríquez-Salazar, M.I.; Veana, F.; Aguilar, C.N.; Iliana, M.; López, M.G.; Rutiaga-Quinones, O.M.; Morlett-Chávez, J.A.; Rodríguez-Herrera, R. Microbial diversity and biochemical profile of aguamiel collected from Agave salmiana and A. atrovirens during different seasons of year. Food Sci. Biotechnol. 2017, 26, 1003–1011. [Google Scholar] [CrossRef]
- Ortiz-Basurto, R.I.; Pourcelly, G.; Doco, T.; Williams, P.; Dornier, M.; Belleville, M.P. Analysis of the main components of the aguamiel produced by the maguey-pulquero (Agave mapisaga) throughout the harvest period. J. Agric. Food Chem. 2008, 56, 3682–3687. [Google Scholar] [CrossRef]
- Romero-López, M.R.; Osorio-Díaz, P.; Flores-Morales, A.; Robledo, N.; Mora-Escobedo, R. Chemical composition, antioxidant capacity and prebiotic effect of aguamiel (Agave atrovirens) during in vitro fermentation. Rev. Mex. Ing. Química 2015, 14, 281–292. [Google Scholar]
- Lappe-Oliveras, P.; Moreno-Terrazas, R.; Arrizón-Gaviño, J.; Herrera-Suárez, T.; García-Mendoza, A.; Gschaedler-Mathis, A. Yeasts associated with the production of Mexican alcoholic nondistilled and distilled Agave beverages. FEMS Yeast Res. 2008, 8, 1037–1052. [Google Scholar] [CrossRef]
- Villarreal Morales, S.L.; Enríquez Salazar, M.I.; Michel Michel, M.R.; Flores Gallegos, A.C.; Montañez-Saens, J.; Aguilar, C.N.; Herrera, R.R. Metagenomic Microbial Diversity in Aguamiel from Two Agave Species during 4-Year Seasons. Food Biotechnol. 2019, 33, 1–16. [Google Scholar] [CrossRef]
- García-Garibay, M.; Quintero-Ramírez, R.; López-Munguía, A. Biotecnología Alimentaria [Food Biotechnology]; Limusa: Mexico City, Mexico, 2004. [Google Scholar]
- Cervantes-Elizarrarás, A.; Cruz-Cansino, N.D.S.; Ramírez-Moreno, E.; Vega-Sánchez, V.; Velázquez-Guadarrama, N.; Zafra-Rojas, Q.Y.; Piloni-Martini, J. In Vitro Probiotic Potential of Lactic Acid Bacteria Isolated from Aguamiel and Pulque and Antibacterial Activity Against Pathogens. Appl. Sci. 2019, 9, 601. [Google Scholar] [CrossRef]
- Cleveland, J.; Montville, T.J.; Nes, I.F.; Chikindas, M.L. Bacteriocins: Safe, natural antimicrobials for food preservation. Int. J. Food Microbiol. 2001, 71, 1–20. [Google Scholar] [CrossRef]
- Secretaría de Urbanismo y Medio Ambiente del Estado de Michoacán (SUMA). Programa de Ordenamiento Territorial de la Zona Metropolitana de Morelia. [Territorial Planning Program of the Morelia Metropolitan Area]; Gobierno del Estado de Michoacán: Morelia, Mexico, 2009. [Google Scholar]
- Valadez-Blanco, R.; Bravo-Villa, G.; Santos-Sánchez, N.F.; Velasco-Almendarez, S.I.; Montville, T.J. The Artisanal Production of Pulque, a Traditional Beverage of the Mexican Highlands. Probiotics Antimicrob. Proteins 2012, 4, 140–144. [Google Scholar] [CrossRef]
- Álvarez-Palma, A.M.; Cassiano, G.; Villa-Kamel, A. La explotación del maguey pulquero en la zona de Metztitlan: Datos etnográficos y arqueológicos [The exploitation of the maguey of pulque in the Metztitlan 10rea: Ethnographic and archaeological data]. Dimens. Antropológica 1998, 5, 7–30. [Google Scholar]
- De la Torre, L.; Cummins, I.; Logan-Hines, E. Agave americana and Furcraea andina: Key Species to Andean Cultures in Ecuador. Bot. Sci. 2018, 96, 246–266. [Google Scholar] [CrossRef]
- Johns, C.; Chernoff, L.H.; Viehoever, A. A saponin from Agave lechuguilla Torrey. J. Biol. Chem. 1922, 52, 335–347. [Google Scholar]
- Makkar, H.P.; Siddhuraju, O.; Becker, K. Plant Secondary Metabolites; Humana Press: Totowa, NJ, USA, 2007. [Google Scholar]
- Escalante, A.; López Soto, D.R.; Velázquez Gutiérrez, J.E.; Giles-Gómez, M.; Bolívar, F.; López-Munguía, A. Pulque, a traditional Mexican alcoholic fermented beverage: Historical, microbiological, and technical aspects. Front. Microbiol. 2016, 7. [Google Scholar] [CrossRef]
- Torres-Maravilla, E.; Lenoir, M.; Mayorga-Reyes, L.; Allain, T.; Sokol, H.; Langella, P.; Sánchez-Pardo, M.E.; Bermúdez-Humarán, L.G. Identification of novel anti-inflammatory probiotic strains isolated from pulque. Appl. Microbiol. Biotechnol. 2016, 100, 385–396. [Google Scholar] [CrossRef]
- Secretaría de Economía. NOM-199-SCFI-2017 Bebidas Alcohólicas-Denominación, Especificaciones Fisicoquímicas, Información Comercial y Métodos de Prueba [Alcoholic Beverages-Denomination, Physicochemical Specifications, Commercial Information and Test Methods]; Dirección General de Normas: Chihuahua, Mexico, 2017. [Google Scholar]
- Secretaría de Economía. NMX-V-037-1972 Pulque Manejado a Granel [Bulk Handled Pulque]; Dirección General de Normas: Chihuahua, Mexico, 1972. [Google Scholar]
- Secretaría de Economía. NMX-V-022-1972 Aguamiel [Fresh sap]; Dirección General de Normas: Chihuahua, Mexico, 1972. [Google Scholar]
- Sánchez-Marroquín, A.; Hope, P.H. Agave juice fermentation and chemical composition studies of some species. J. Agric. Food Chem. 1953, 1, 246–249. [Google Scholar] [CrossRef]
- Urbina, C.J.F.; Casas, A.; Martínez-Díaz, Y.; Santos-Zea, L.; Gutiérrez-Uribe, J.A. Domestication and saponins contents in a gradient of management intensity of agaves: Agave cupreata, A. inaequidens and A. hookeri in central Mexico. Genet. Resour. Crop Evol. 2018, 65, 1133–1146. [Google Scholar] [CrossRef]
- Bruman, H. Alcohol in Ancient Mexico; The University of Utah Press: Salt Lake City, UT, USA, 2000. [Google Scholar]


| Fermented Beverage | Species | Fermented Substrate | Region of Mexico | References |
|---|---|---|---|---|
| Tepache | Spondias spp. or Ananas comosus | Fruit with peel | Center and South | [20] |
| Colonche | Columnar cacti or Opuntia spp. | Fruit without peel and seeds | Arid areas in the Center and North | [20,21] |
| Pozol | Zea mays | Nixtamalized and ground grains | Southeast and Yucatan Peninsula | [25] |
| Tesgüino | Zea mays | Germinated grains | North and Northwest | [23] |
| Balche | Lonchocarpus longistylus | Bark | Southeast and Yucatan Peninsula | [6,22] |
| Taberna | Acrocomia aculeata | Sap | Southeast | [19,20] |
| Tuba | Cocos nucifera | Sap | Southwest coast | [6,24] |
| Pulque | Agave spp. | Sap | Arid and temperate areas in the Center and North | [12,26,27] |
| Characteristic | Fresh Sap (FS) | Boiled Sap (BS) | Pulque (P) | Inoculum for Pulque (IP) | |||
|---|---|---|---|---|---|---|---|
| SU | T | SU | SU | T | SU | T | |
| Concentration of sugar (°Bx) * | 9.8 ± 0.89 (ab) | 9.57 ± 0.76 (ab) | 11.7 ± 0.3 (a) | 8.22 ± 0.49 (b) | 7.48 ± 0.4 (bc) | 5.47 ± 0.4 (c) | 5.42 ± 0.29 (c) |
| Acidity (pH) * | 6.23 ± 0.39 (a) | 4.58 ± 0.13 (b) | 7.32 ± 0.58 (a) | 4.15 ± 0.14 (b) | 3.94 ± 0.08 (b) | 3.87 ± 0.13 (b) | 3.69 ± 0.05 (b) |
| Density (g/cm3) * | 1.01 ± 0.001 (ab) | 1 ± 0.003 (ab) | 1.02 ± 0.006 (b) | 0.99 ± 0.007 (ac) | 0.98 ± 0.001 (cd) | 0.97 ± 0.002 (d) | 0.97 ± 0.003 (d) |
| Lactic acid (gr/100 mL) * | 0.23 ± 0.04 (a) | 0.53 ± 0.06 (b) | 0.05 ± 0.02 (a) | 0.82 ± 0.05 (cd) | 0.67 ± 0.06 (bc) | 1.02 ± 0.03 (d) | 0.77 ± 0.06 (c) |
| Alcohol (%) * | 0.00 ± 0 (a) | 0.00 ± 0 (a) | 0.53 ± 0.15 (a) | 3.88 ± 0.47(b) | 4.92 ± 0.29 (bc) | 6.73 ± 0.75 (d) | 6.03 ± 0.35 (cd) |
| Viscosity (cP) * | 1.22 ± 0.12 (a) | 1.3 ± 0.09 (a) | 1.14 ± 0.03 (a) | 1.59 ± 0.19 (a) | 1.48 ± 0.13 (a) | 2.92 ± 0.16 (b) | 2.48 ± 0.09 (b) |
| Fresh Sap (FS) | Boiled Sap (BS) | Pulque (P) | Inoculum for Pulque (IP) | |||||||||||||
|---|---|---|---|---|---|---|---|---|---|---|---|---|---|---|---|---|
| SU | T | SJO | LAO | LPO | HM | SU | SU | T | SJO | LAO | LPO | HM | SU | T | HM | |
| LAB abundance (CFU/mL) * | 2.98 ± 1.18 × 10⁸ (a) | 3.53 ± 0.65 × 10⁸ (a) | 6.2 × 10⁷ | 3.7 × 10⁹ | 4.5 × 10⁸ | 3.2 × 10⁸ | 7.15 ± 4.55 × 10⁶ (b) | 3.16 ± 1.68 × 10⁸ (a) | 1.9 ± 0.84 × 10⁸ (a) | 7.1 × 10⁷ | 8.3 × 10⁷ | 2.7 × 10¹¹ | 1.5 × 10⁸ | 4.91 ± 1.44 × 10⁸ (a) | 3.80 ± 0.92 × 10⁸ (a) | 1.5 × 10⁸ |
| LAB richness * | 4.3 ± 0.7 (a) | 4.3 ± 0.8 (a) | ND | ND | ND | ND | 0.6 ± 0.2 (b) | 3 ± 0.5 (ab) | 4.2 ± 0.9 (a) | ND | ND | ND | ND | 2 ± 0.5 (ab) | 3.8 ± 0.5 (a) | ND |
| Yeast abundance (CFU/mL) * | 3.06 ± 1.33 × 10⁸ (a) | 3.39 ± 0.88 ×10⁸ (a) | ND | ND | ND | 3.1 × 10⁴ | 8.72 ± 6 × 10⁶ (b) | 2.52 ± 1.44 × 10⁸ (a) | 1.47 ± 0.72 × 10⁸ (a) | ND | ND | ND | 8.8 × 10⁶ | 6.27 ± 1.33 × 10⁸ (a) | 4.32 ± 0.83 × 10⁸ (a) | 1.4 × 10⁷ |
| Yeast richness * | 4.5 ± 0.6 (a) | 4.5 ± 0.6 (a) | ND | ND | ND | ND | 1 ± 0.4 (b) | 1.8 ± 0.3 (b) | 3 ± 0.6 (ab) | ND | In order toND | ND | ND | 1.3 ± 0.3 (b) | 2.3 ± 0.5 (ab) | ND |
| Diversity (H’) * | 1.22 ± 0.11 (ab) | 1.17 ± 0.12 (ab) | ND | ND | ND | ND | 0.48 ± 0.22 (c) | 0.98 ± 0.11 (abc) | 1.33 ± 0.06 (b) | ND | ND | ND | ND | 0.73 ± 0.09 (ac) | 1.21 ± 0.14 (ab) | ND |
| Species | Locality | Concentration of Sugar (°Bx) | Acidity (pH) | Lactic Acid (g/100 mL) | Reference |
|---|---|---|---|---|---|
| Agave sp. | ND | 11 | 7 | 0.18 | [53] |
| A. mapisaga | Lomas de Romero, Puebla | ND | 4.5 | 0.5 | [35] |
| Agave sp. | Tamazulapan, Oaxaca | 16 | 4.3 | 0.68 | [43] |
| A. atrovirens | Michoacán | 11.1 | 6.29 | 0.6 | [36] |
| A. atrovirens | Las Mangas, Coahuila | 9.55 | 6 | ND | [34] |
| A. salmiana | Las Mangas, Coahuila | 9.85 | 5.73 | ND | [34] |
| A. salmiana var. salmiana | Santiago Undameo, Michoacán | 9.8 | 6.23 | 0.23 | This study |
| A. mapisaga | Tarímbaro, Michoacán | 9.57 | 4.58 | 0.53 | This study |
| Range NMX | 8–12 | 6.6–7.5 | 0.9–1.03 | [50,51,52,53] |
| Locality | Concentration of Sugar (°Bx) | Acidity (pH) | Lactic Acid (g/100mL) | %Alcohol | Reference |
|---|---|---|---|---|---|
| ND | 6 | 4.6 | 0.348 | 5.43 | [53] |
| Tamazulapan, Oaxaca | 7.4 | 3.8 | ND | 1.32 | [43] |
| Santiago Undameo, Michoacán | 8.22 | 4.15 | 0.82 | 3.88 | This study |
| Tarímbaro, Michoacán | 7.48 | 3.94 | 0.67 | 4.92 | This study |
| Range NMX | 2–5 | 3.5–4 | 0.4–0.7 | 4–7.5 | [50,51,52] |
© 2020 by the authors. Licensee MDPI, Basel, Switzerland. This article is an open access article distributed under the terms and conditions of the Creative Commons Attribution (CC BY) license (http://creativecommons.org/licenses/by/4.0/).
Share and Cite
D. Álvarez-Ríos, G.; Figueredo-Urbina, C.J.; Casas, A. Physical, Chemical, and Microbiological Characteristics of Pulque: Management of a Fermented Beverage in Michoacán, Mexico. Foods 2020, 9, 361. https://doi.org/10.3390/foods9030361
D. Álvarez-Ríos G, Figueredo-Urbina CJ, Casas A. Physical, Chemical, and Microbiological Characteristics of Pulque: Management of a Fermented Beverage in Michoacán, Mexico. Foods. 2020; 9(3):361. https://doi.org/10.3390/foods9030361
Chicago/Turabian StyleD. Álvarez-Ríos, Gonzalo, Carmen Julia Figueredo-Urbina, and Alejandro Casas. 2020. "Physical, Chemical, and Microbiological Characteristics of Pulque: Management of a Fermented Beverage in Michoacán, Mexico" Foods 9, no. 3: 361. https://doi.org/10.3390/foods9030361
APA StyleD. Álvarez-Ríos, G., Figueredo-Urbina, C. J., & Casas, A. (2020). Physical, Chemical, and Microbiological Characteristics of Pulque: Management of a Fermented Beverage in Michoacán, Mexico. Foods, 9(3), 361. https://doi.org/10.3390/foods9030361