Does Fermentation Really Increase the Phenolic Content in Cereals? A Study on Millet


 , , ,
, , ,  ,
, 
Abstract
:
1. Introduction
2. Materials and Methods
2.1. Samples and Reagents
2.2. Fermentation Process
2.3. Extraction of Phenolic Compounds
2.4. Analytical HPLC-DAD
2.5. MS Analysis
2.6. Quantitative Determination of Phenolic Acids And Flavonoids
2.7. Folin-Ciocalteu Reducing Capacity
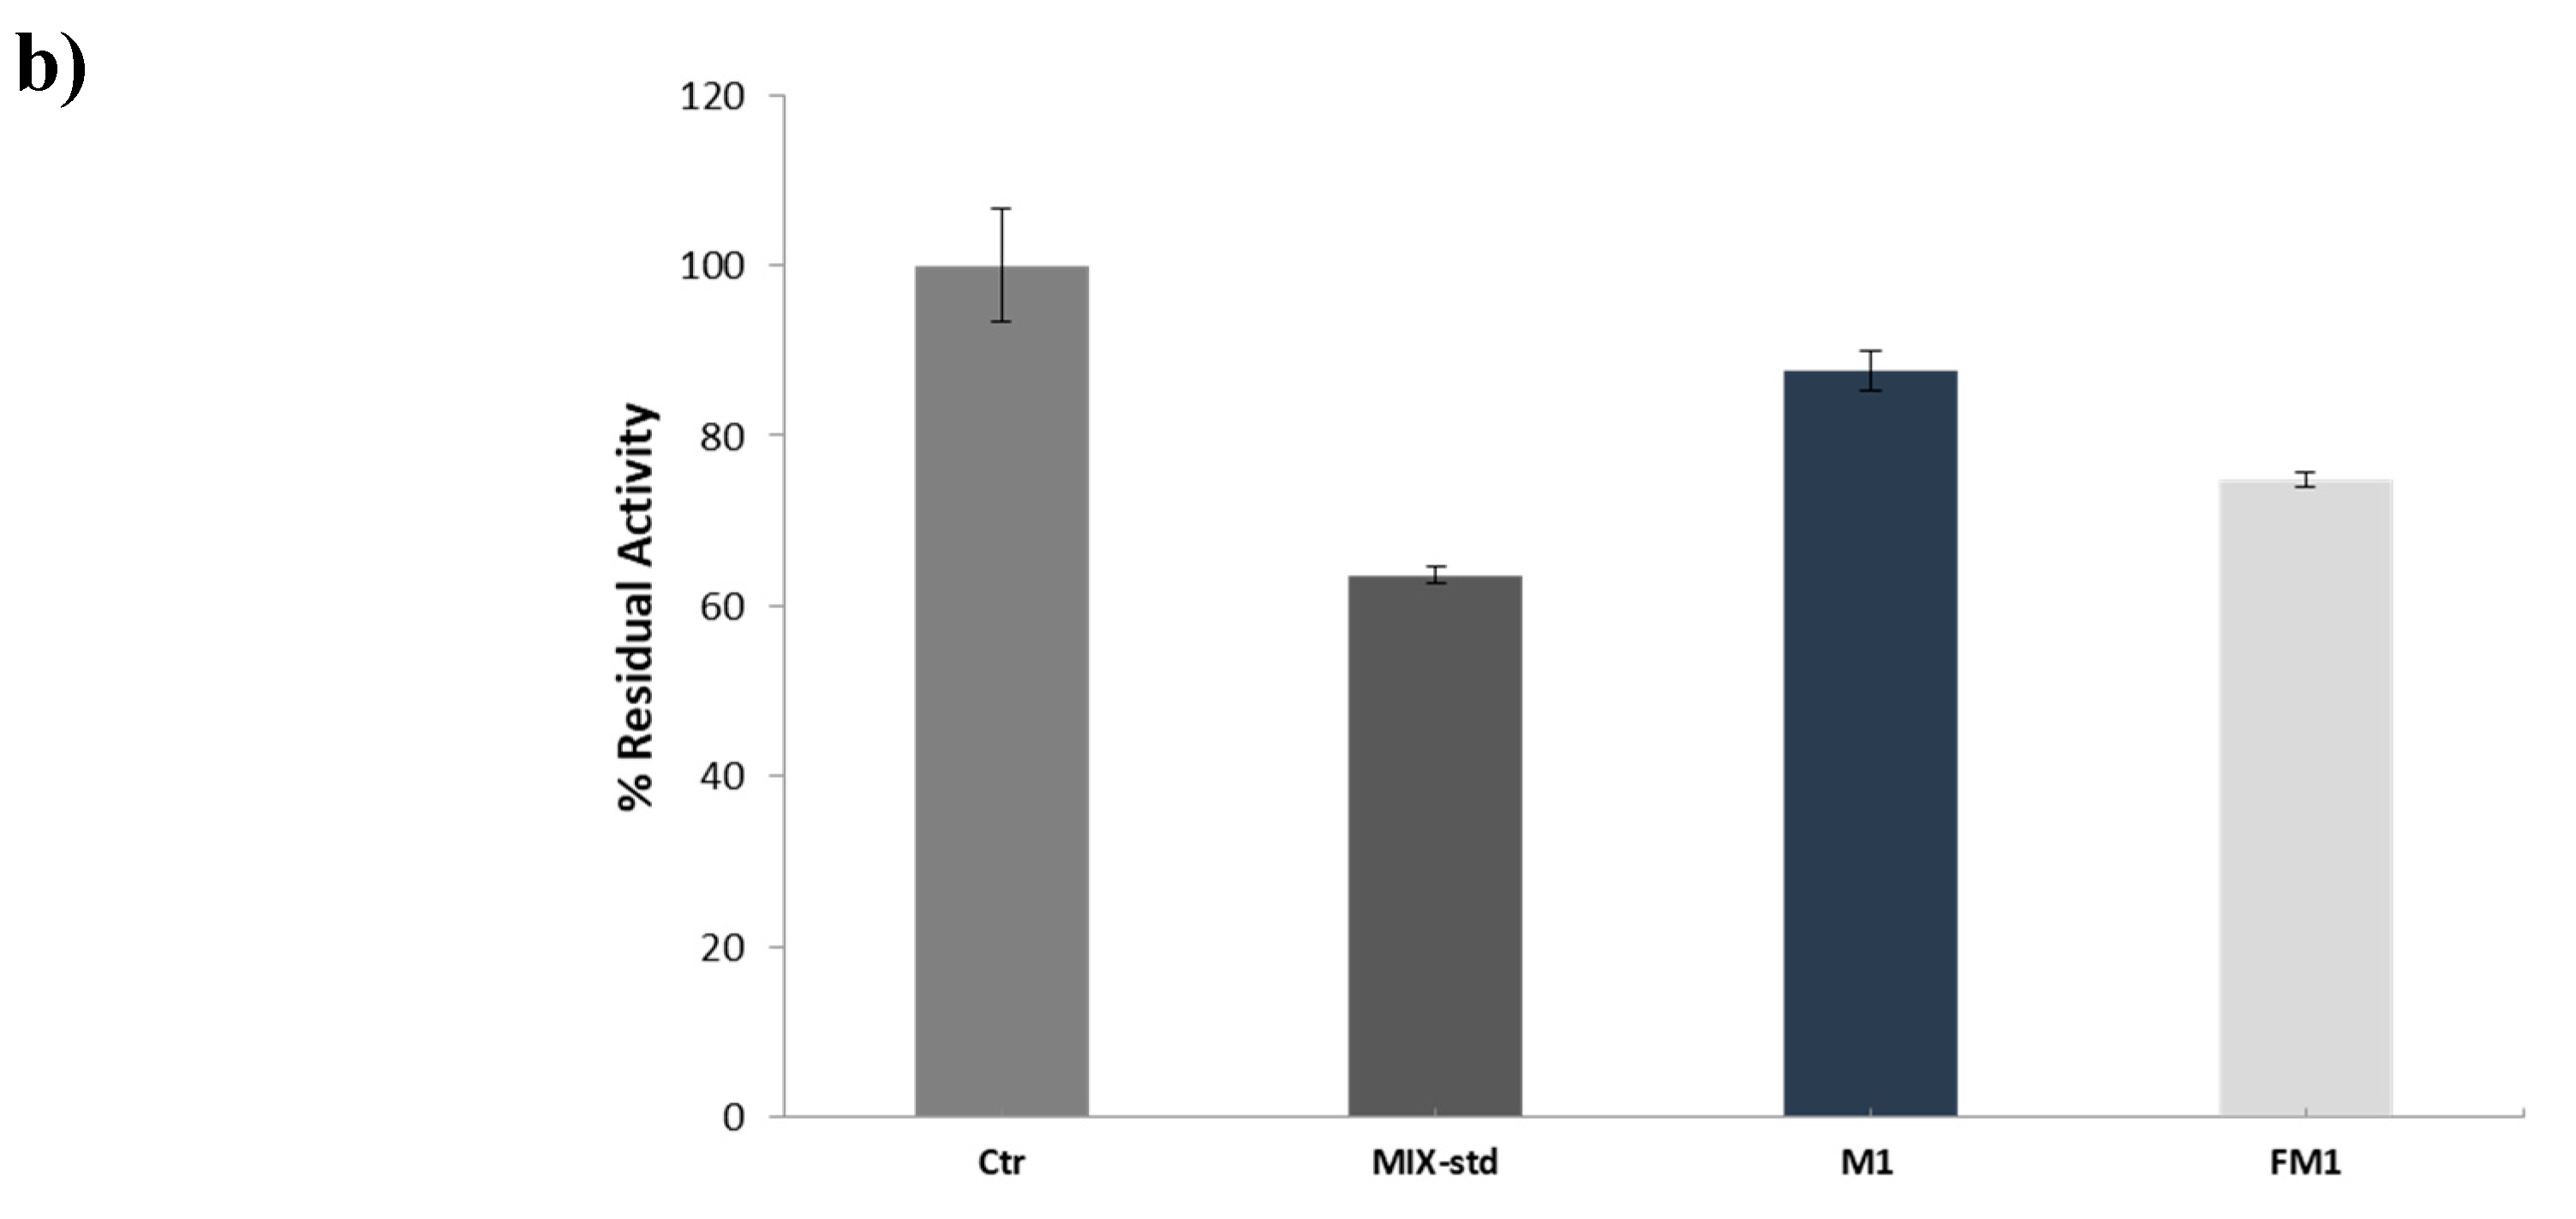
2.8. Inhibition Test on PTP1B Enzyme
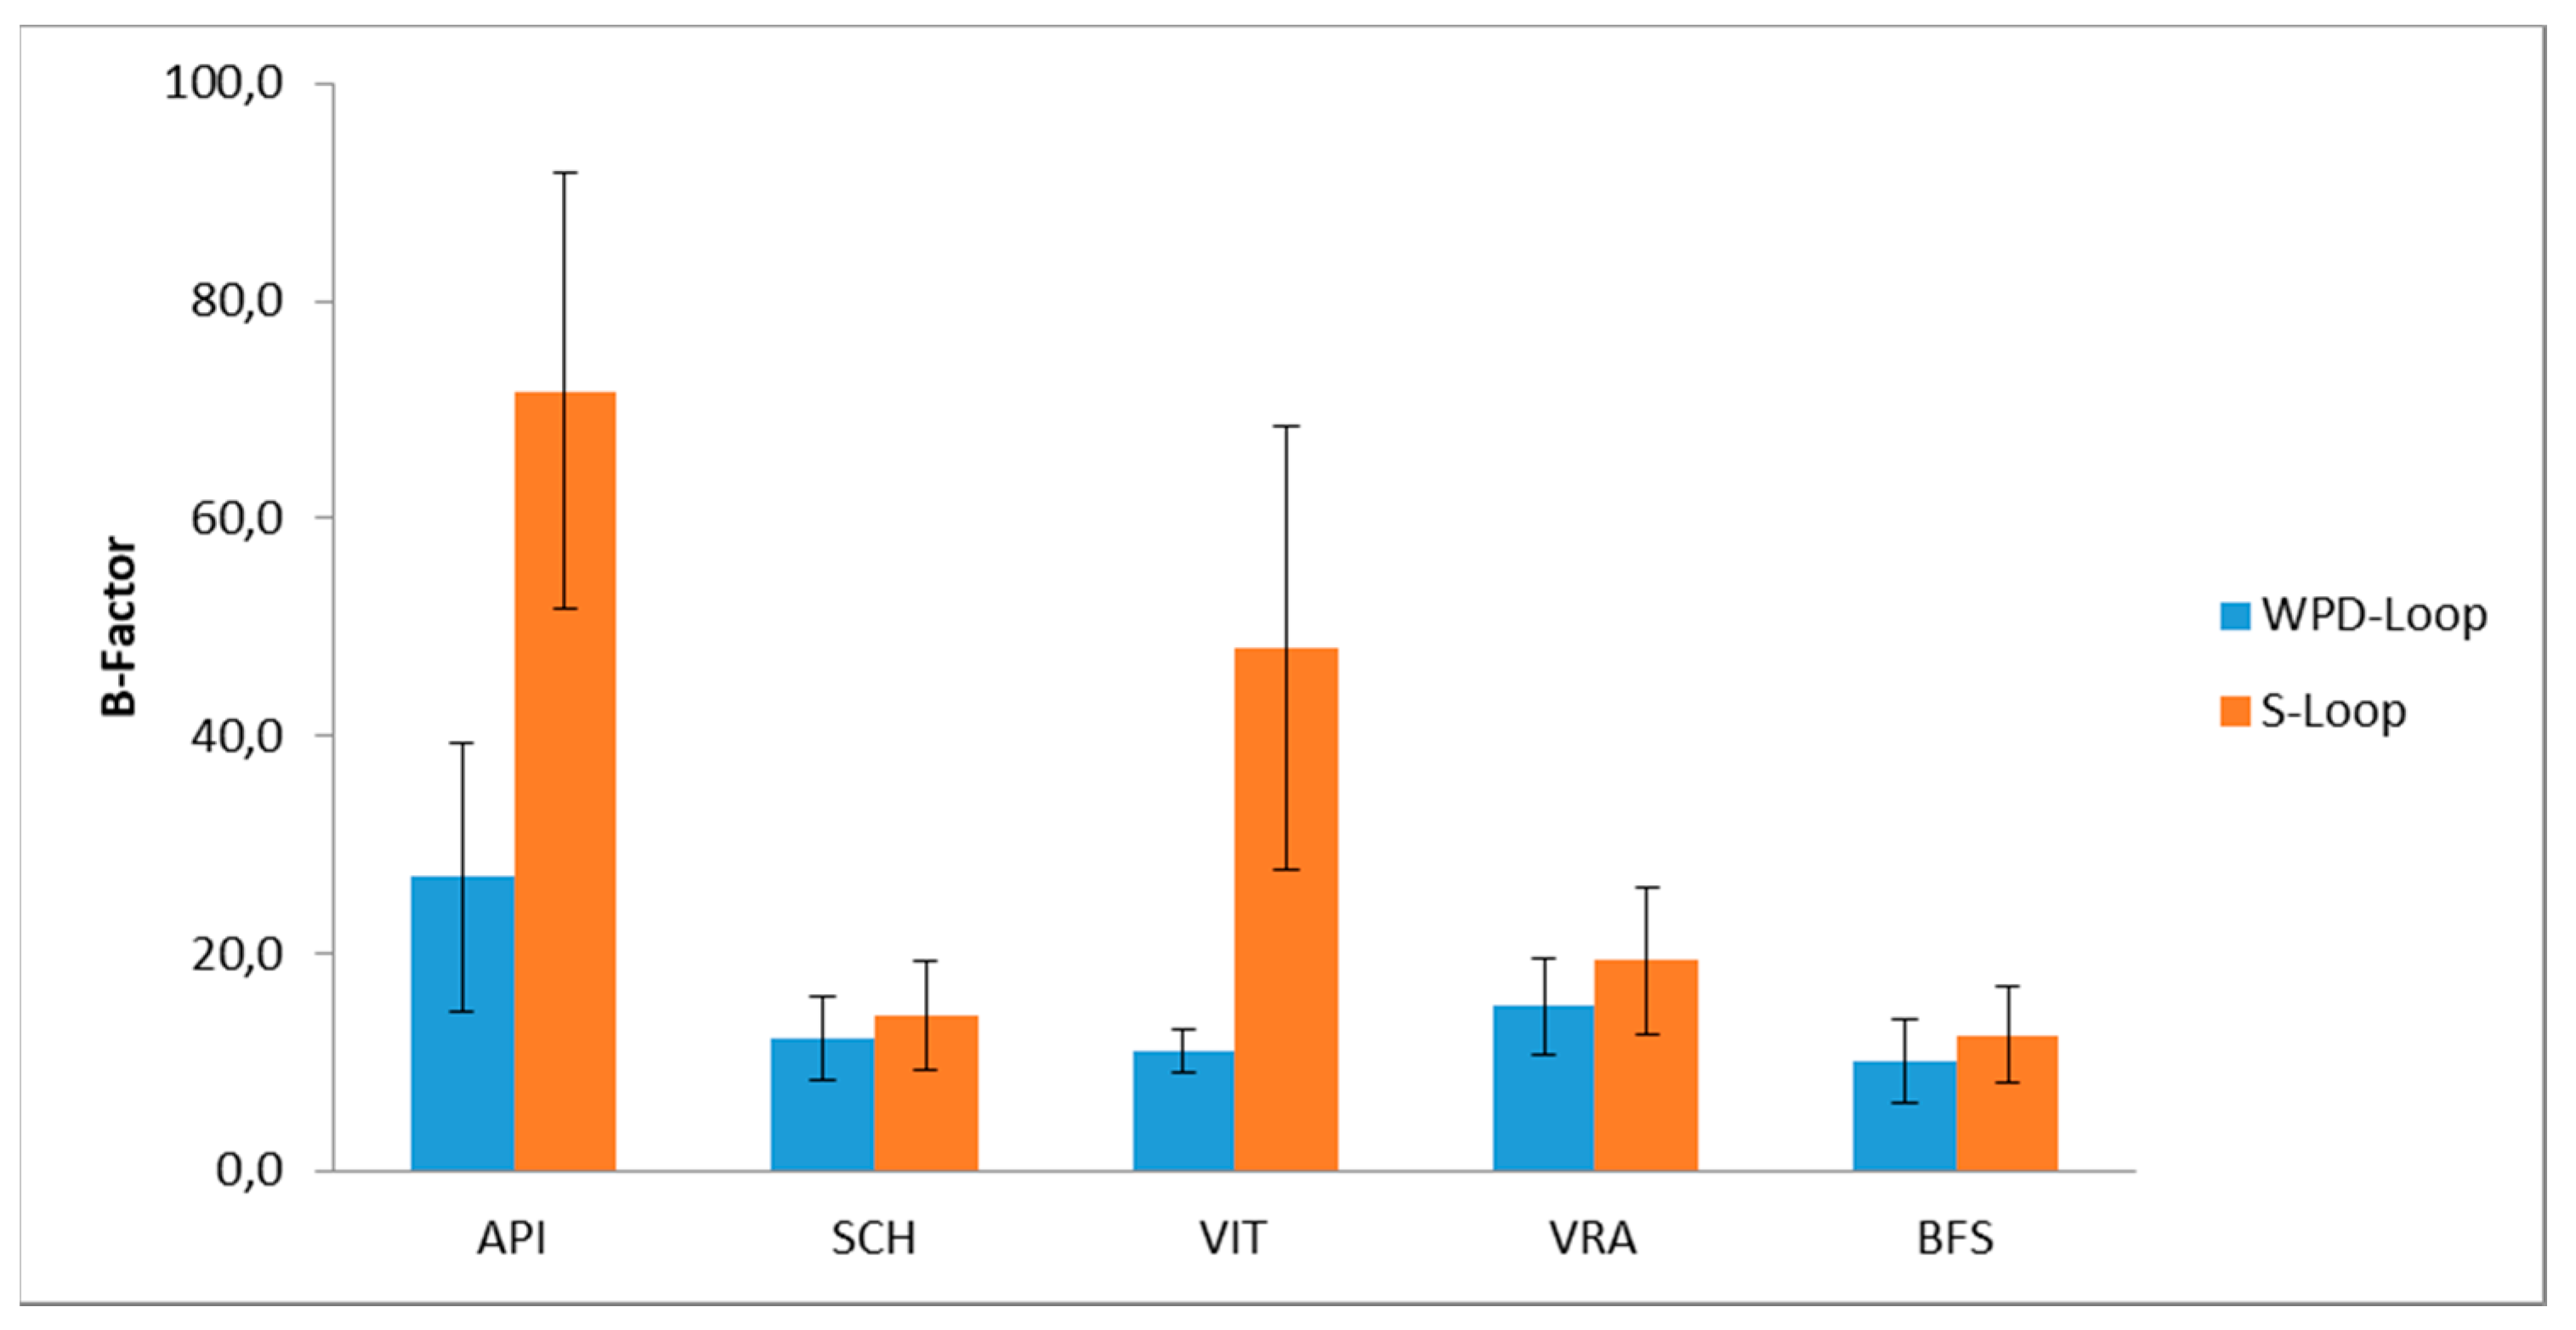
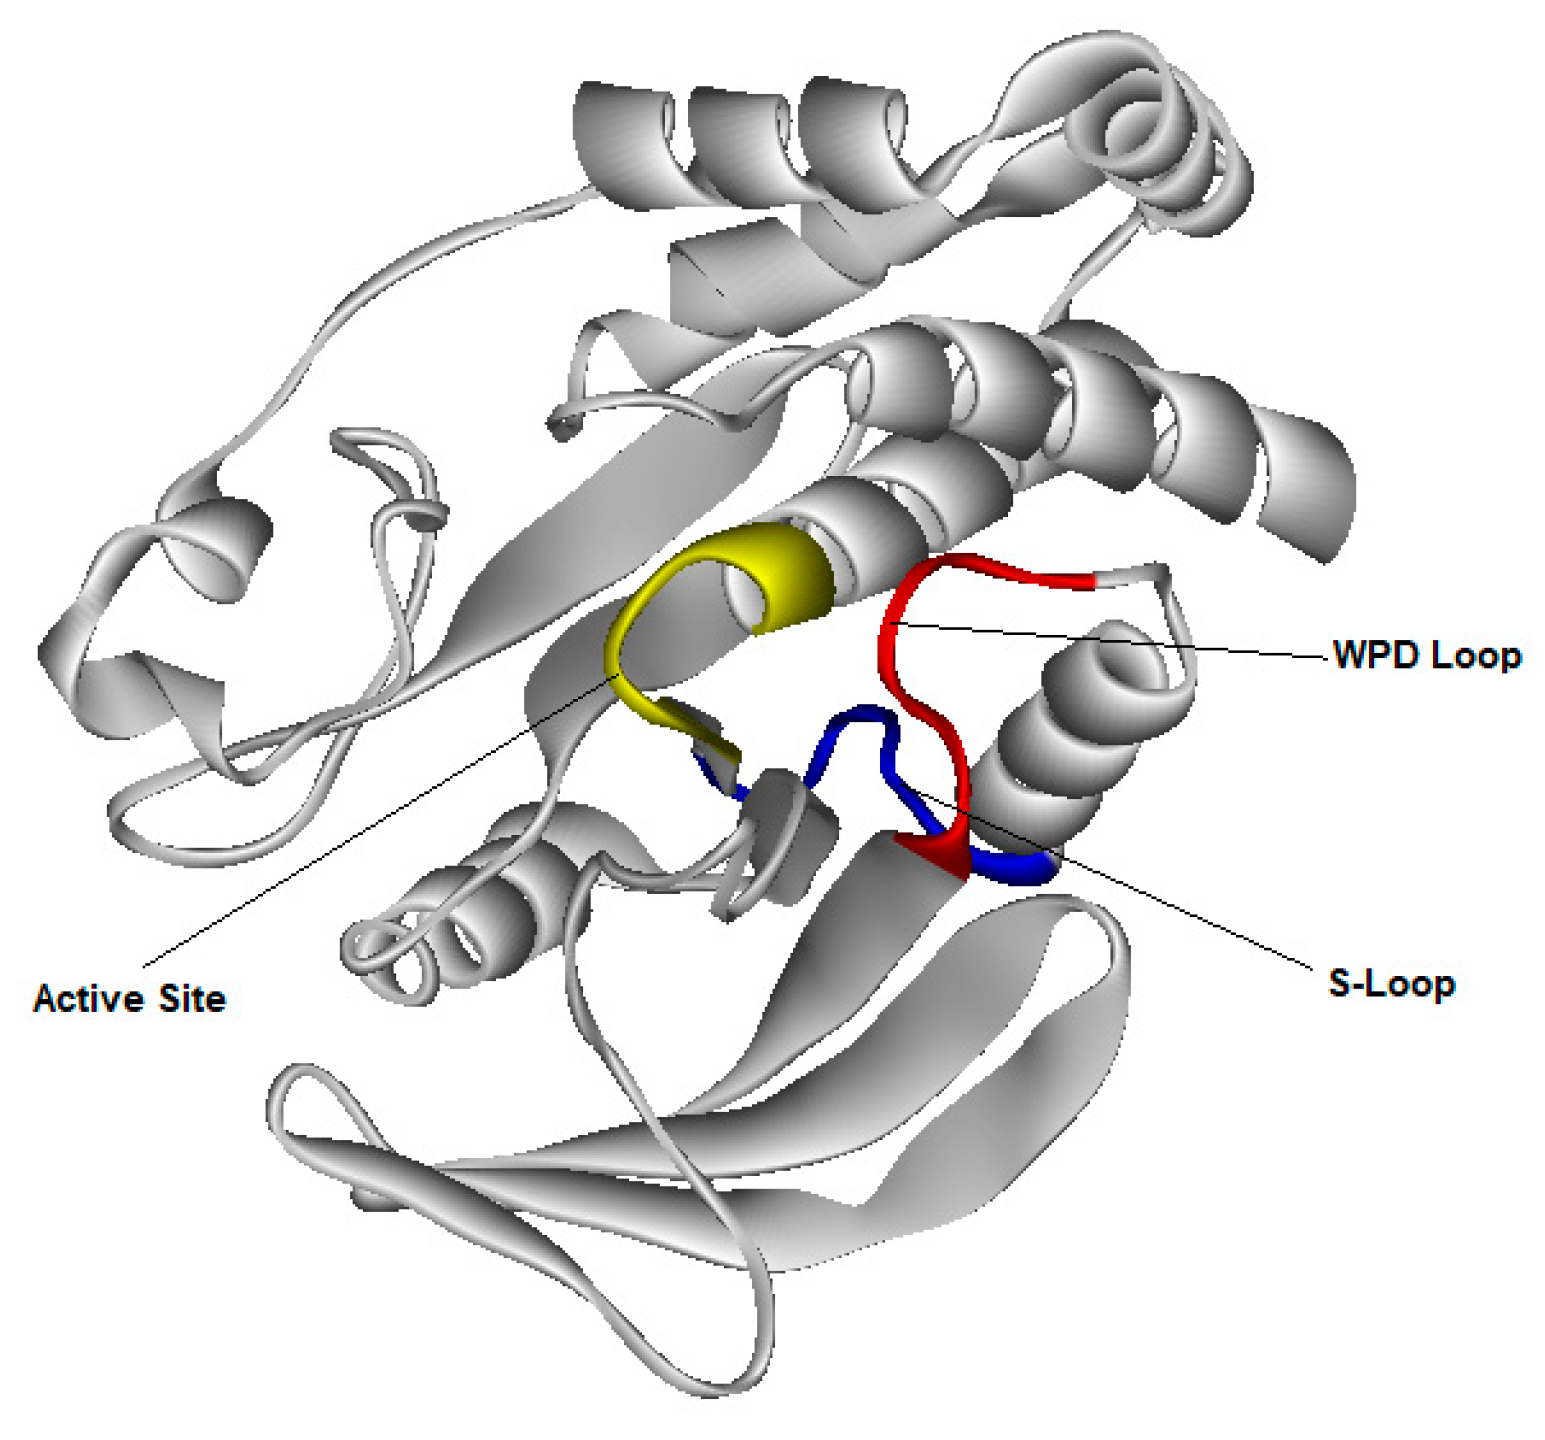
2.9. Molecular Dynamics Simulation for PTP1B Enzyme
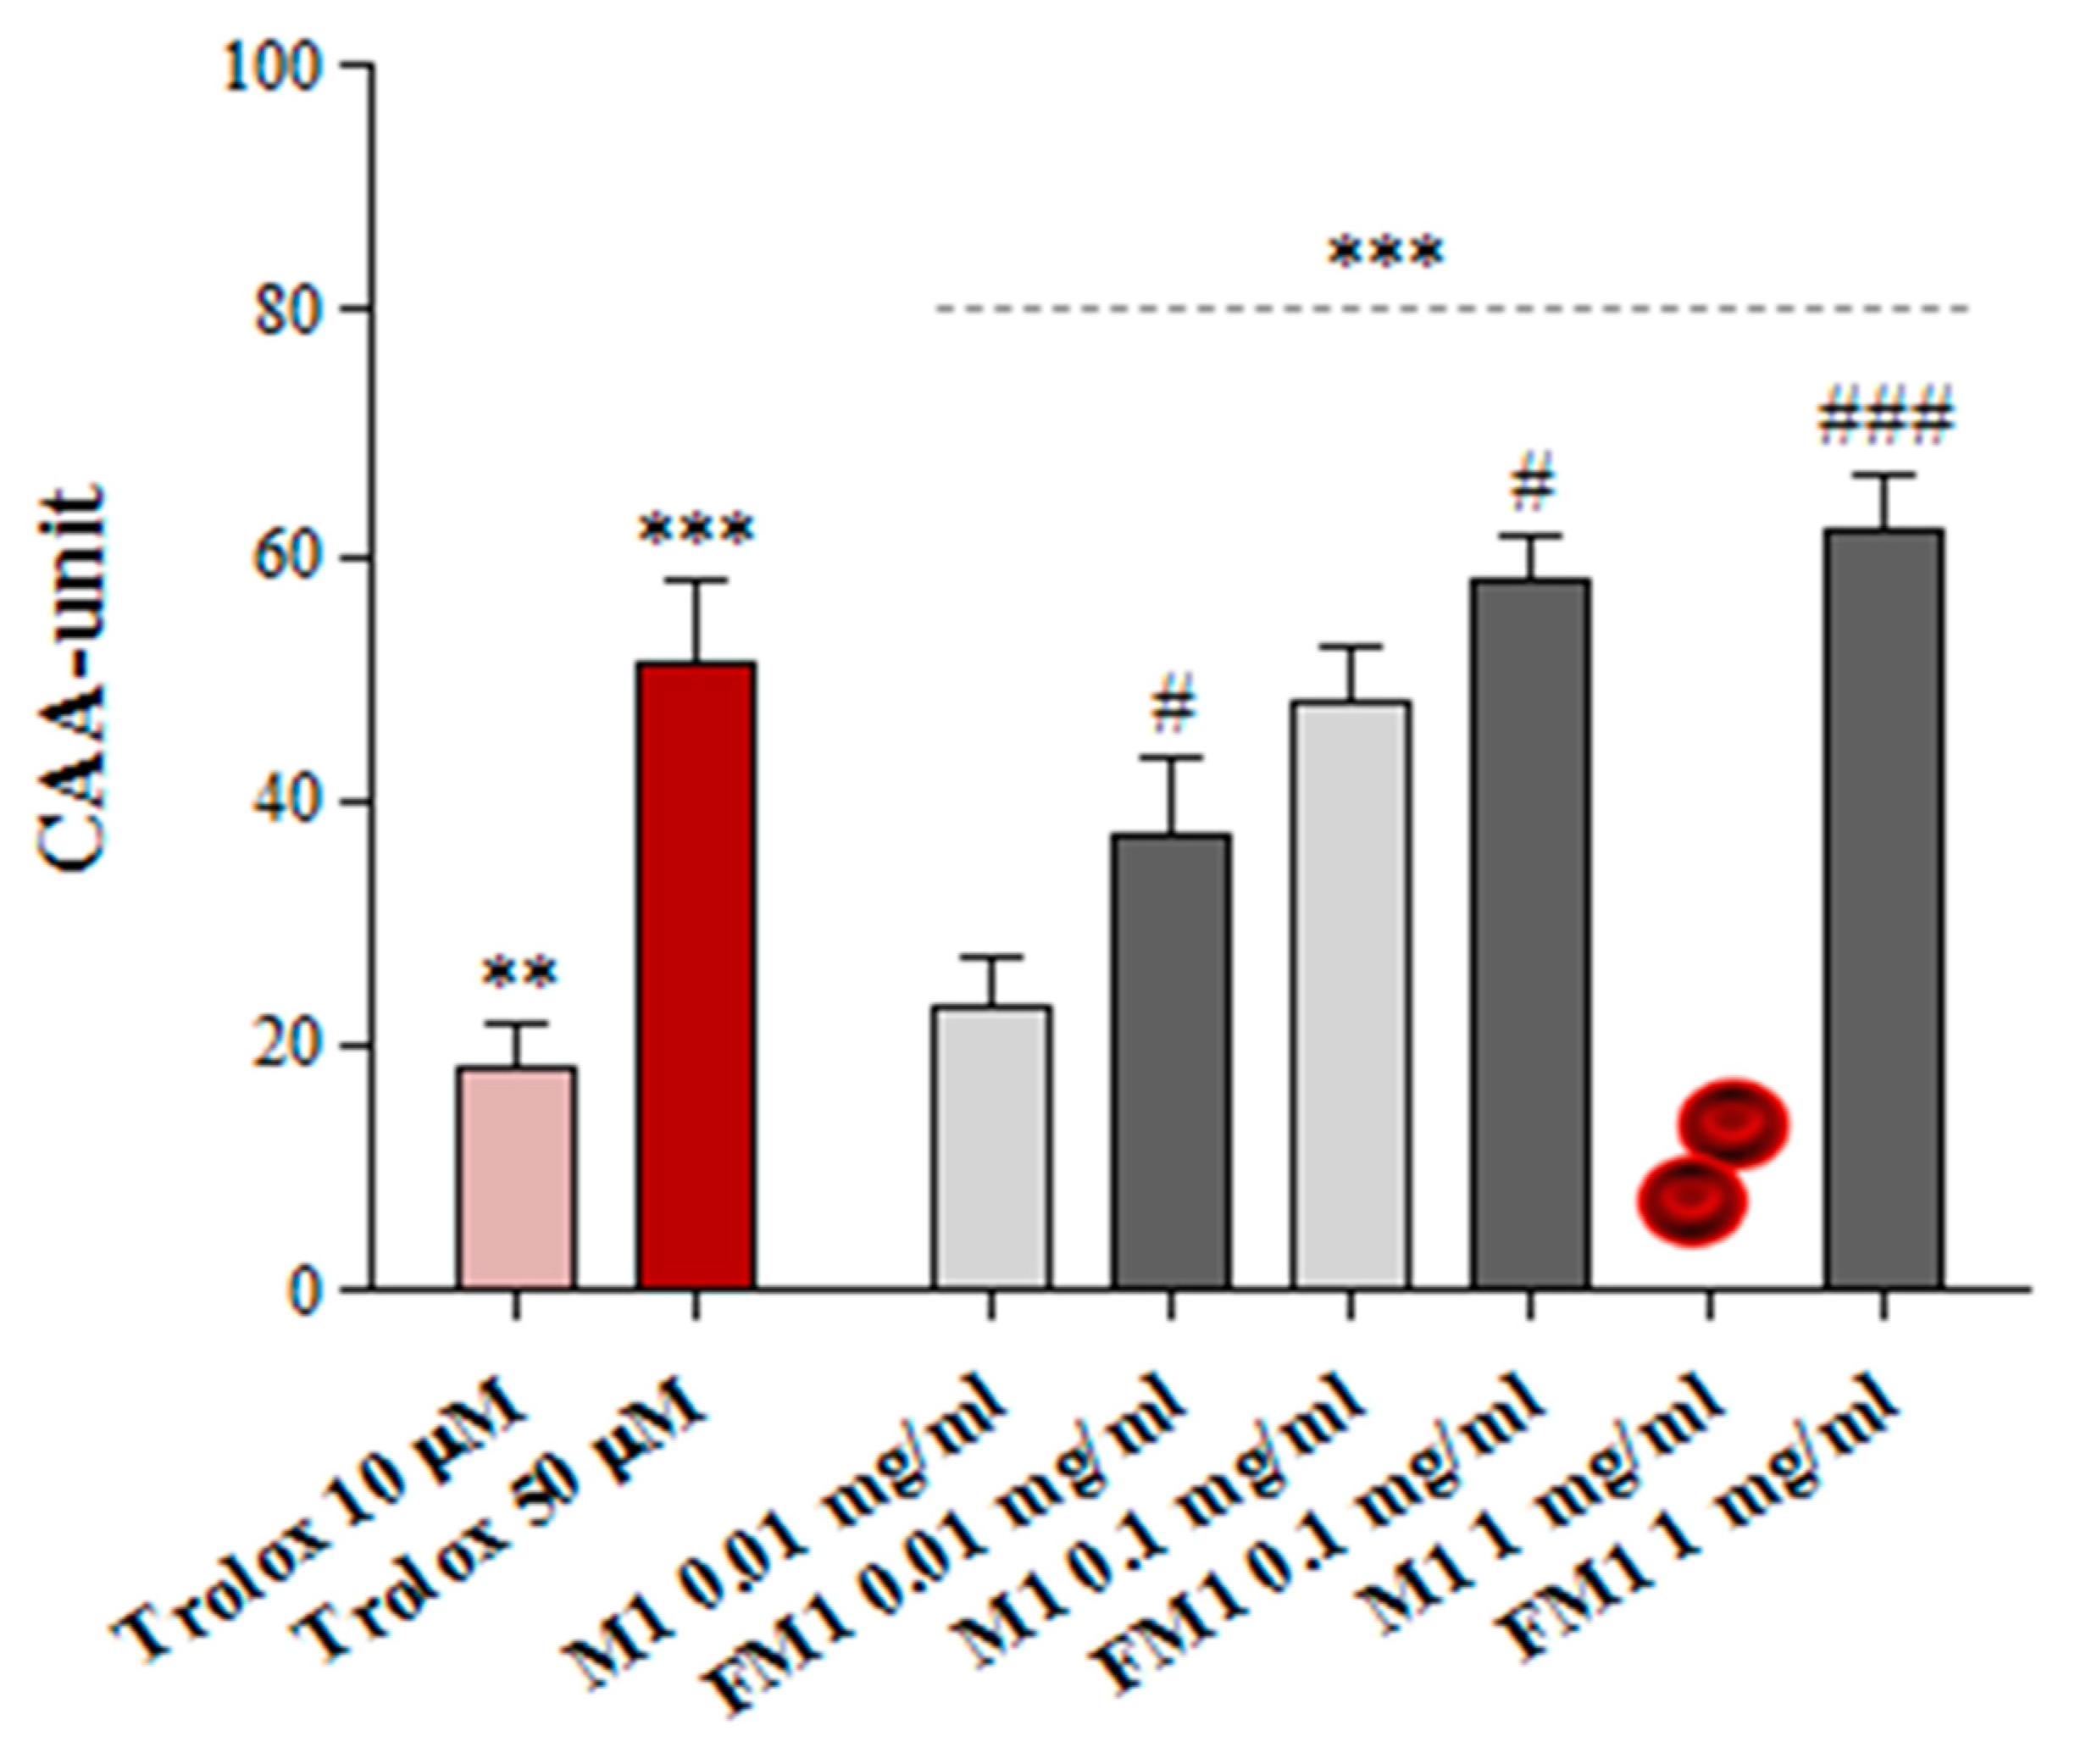
2.10. Ex Vivo Cellular Antioxidant Activity (CAA-RBC) Assay in Red Blood Cells
2.11. Statistical Analysis
2.12. Proximate Analysis
3. Results and Discussion
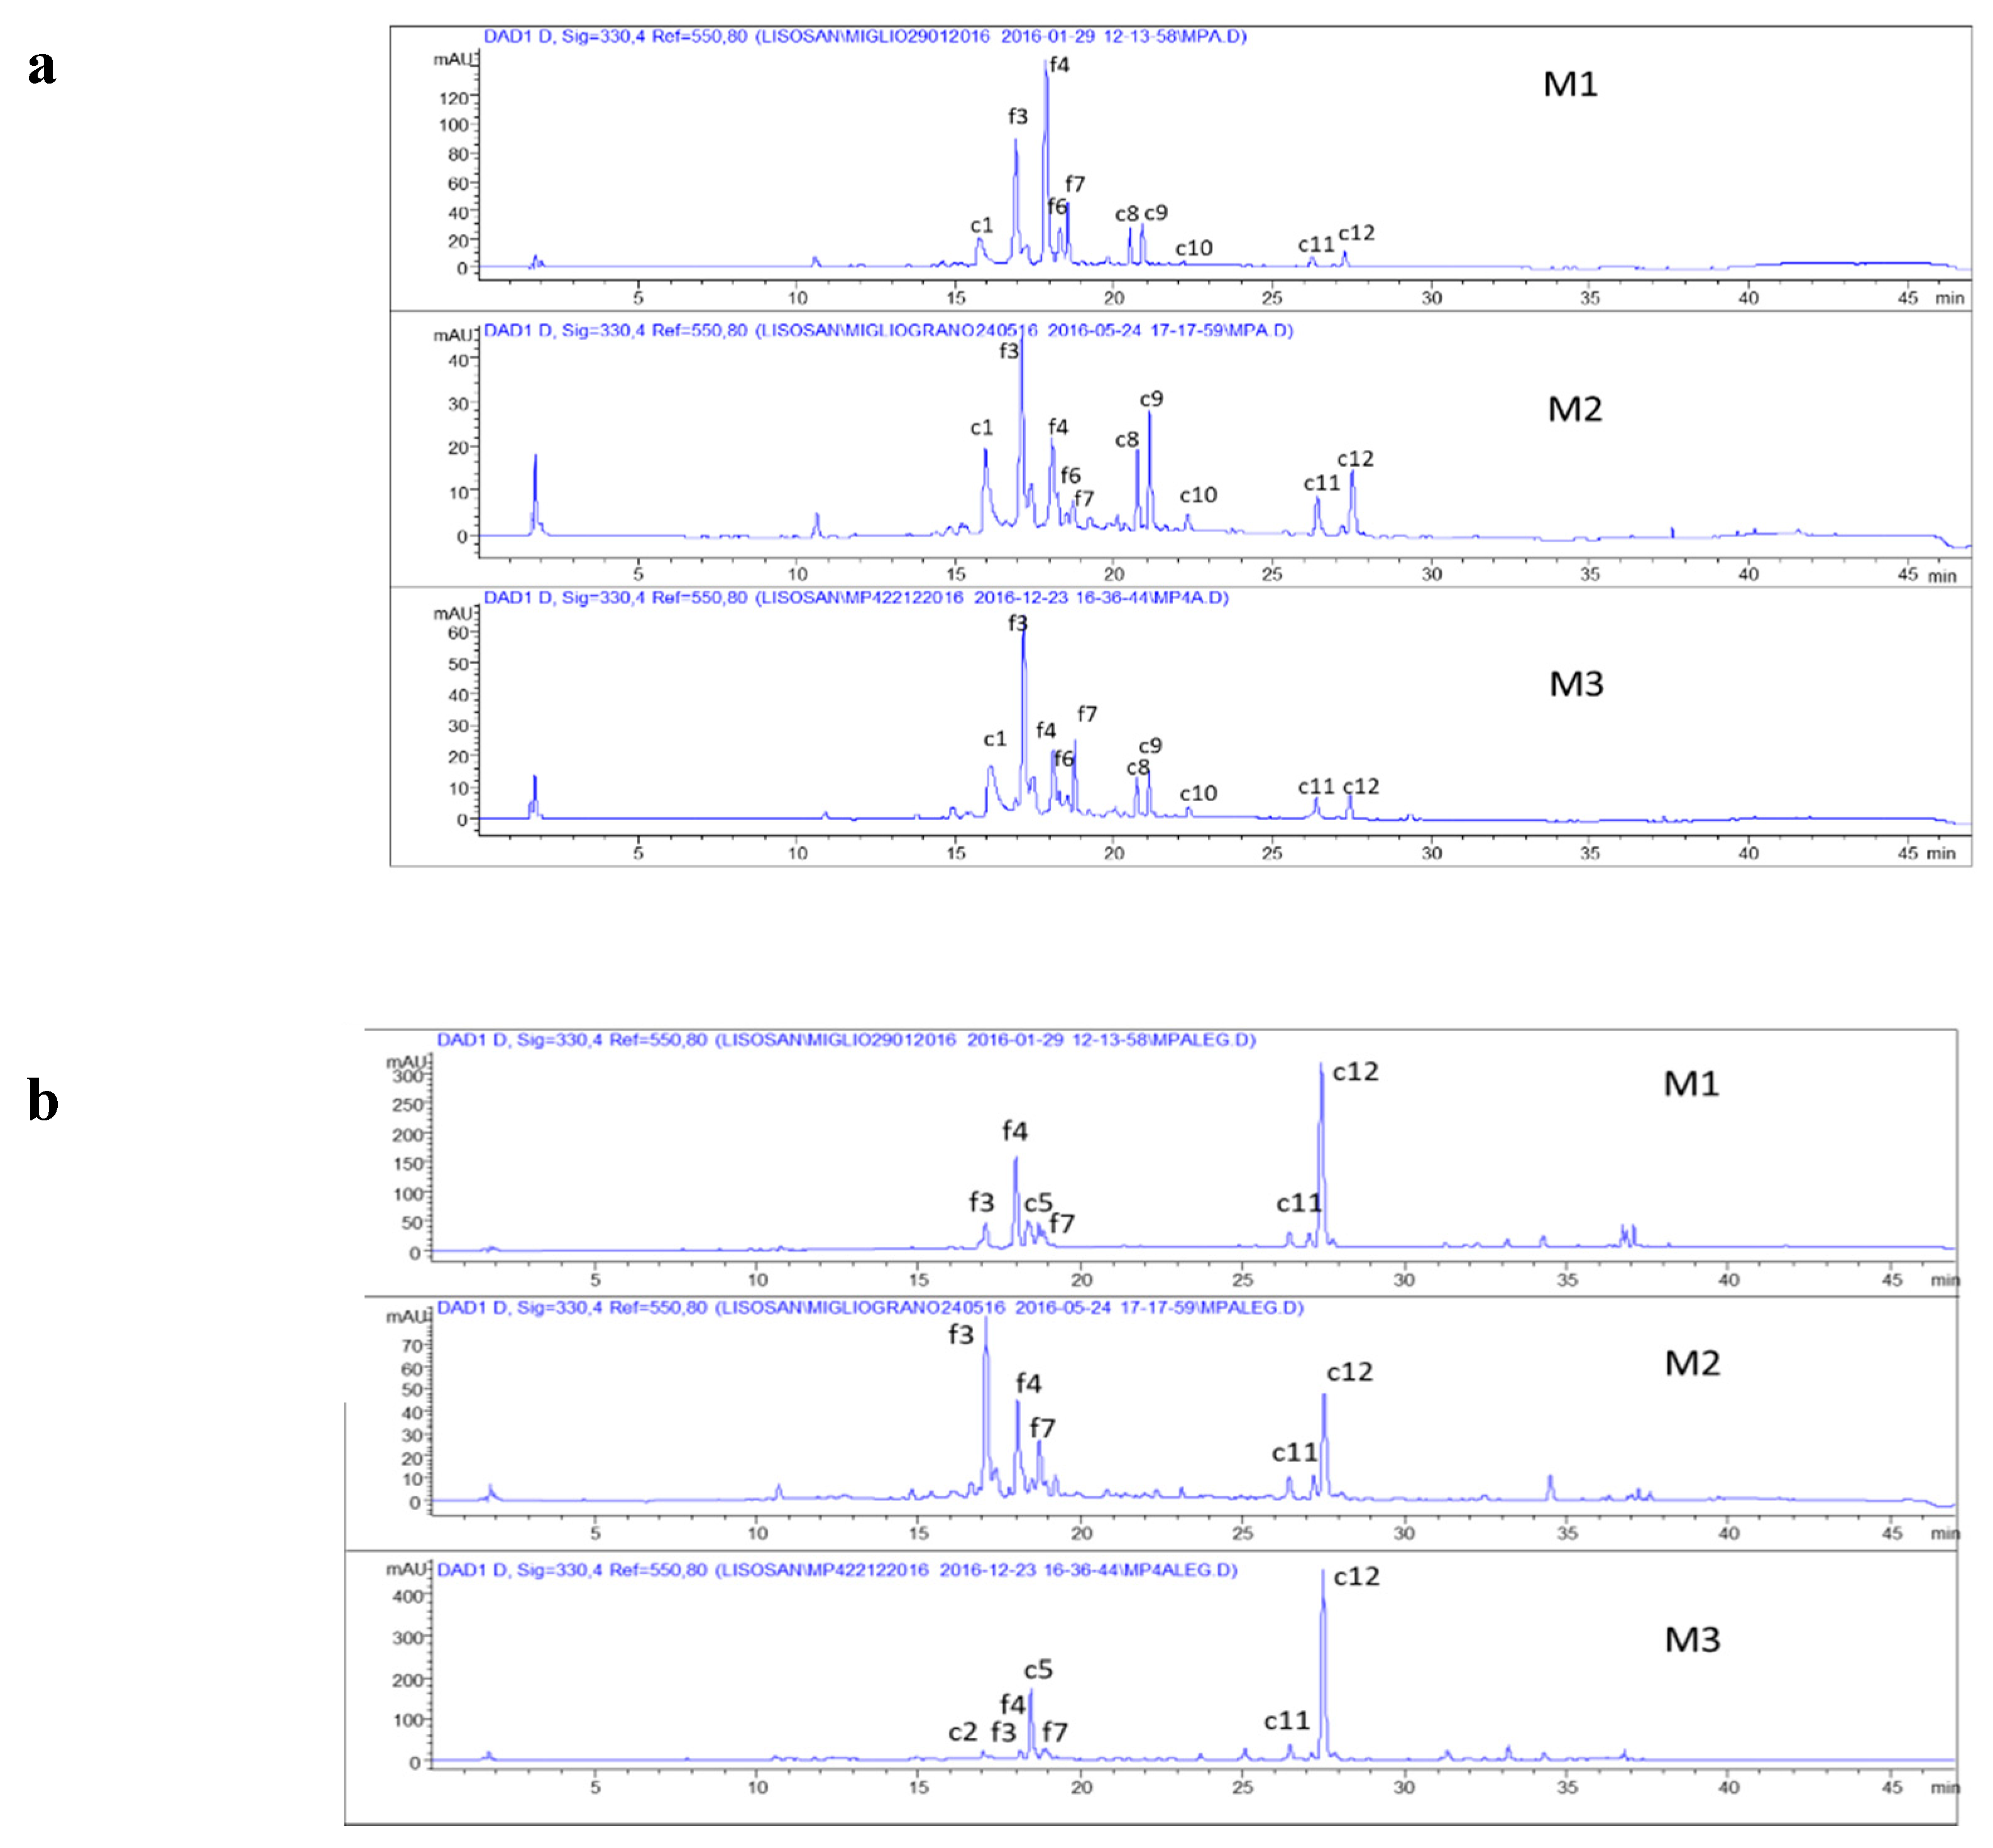
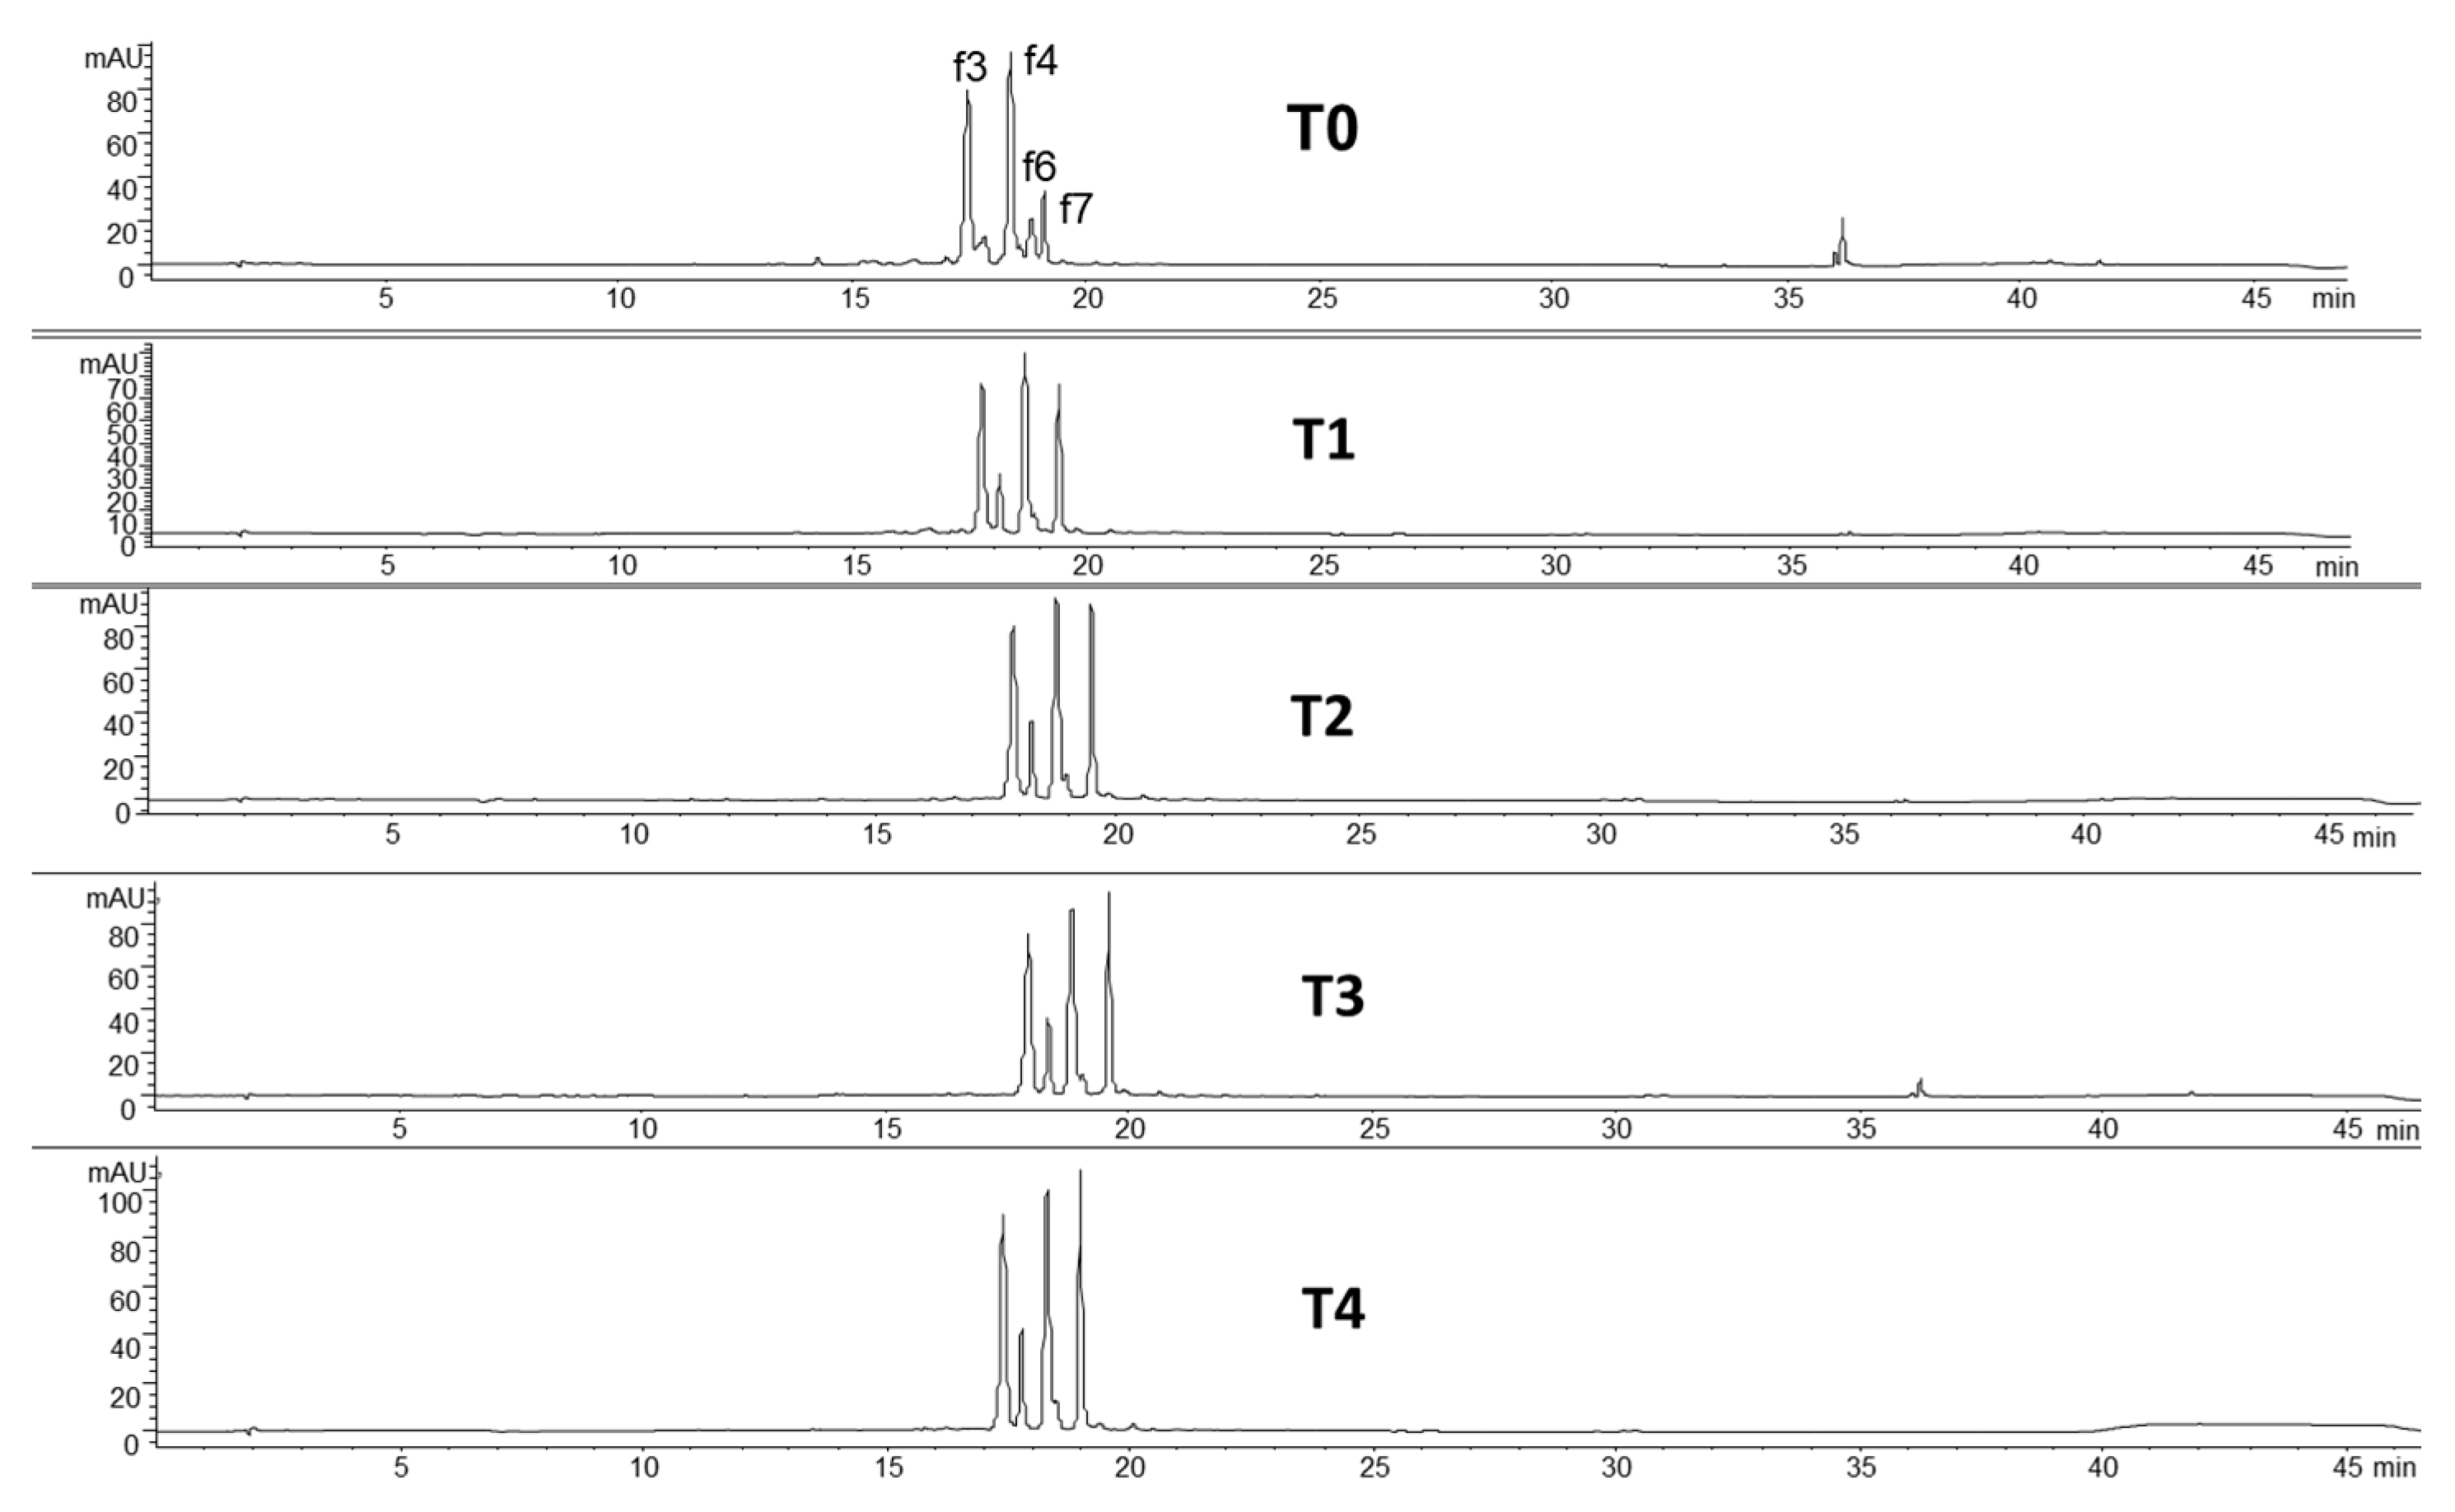
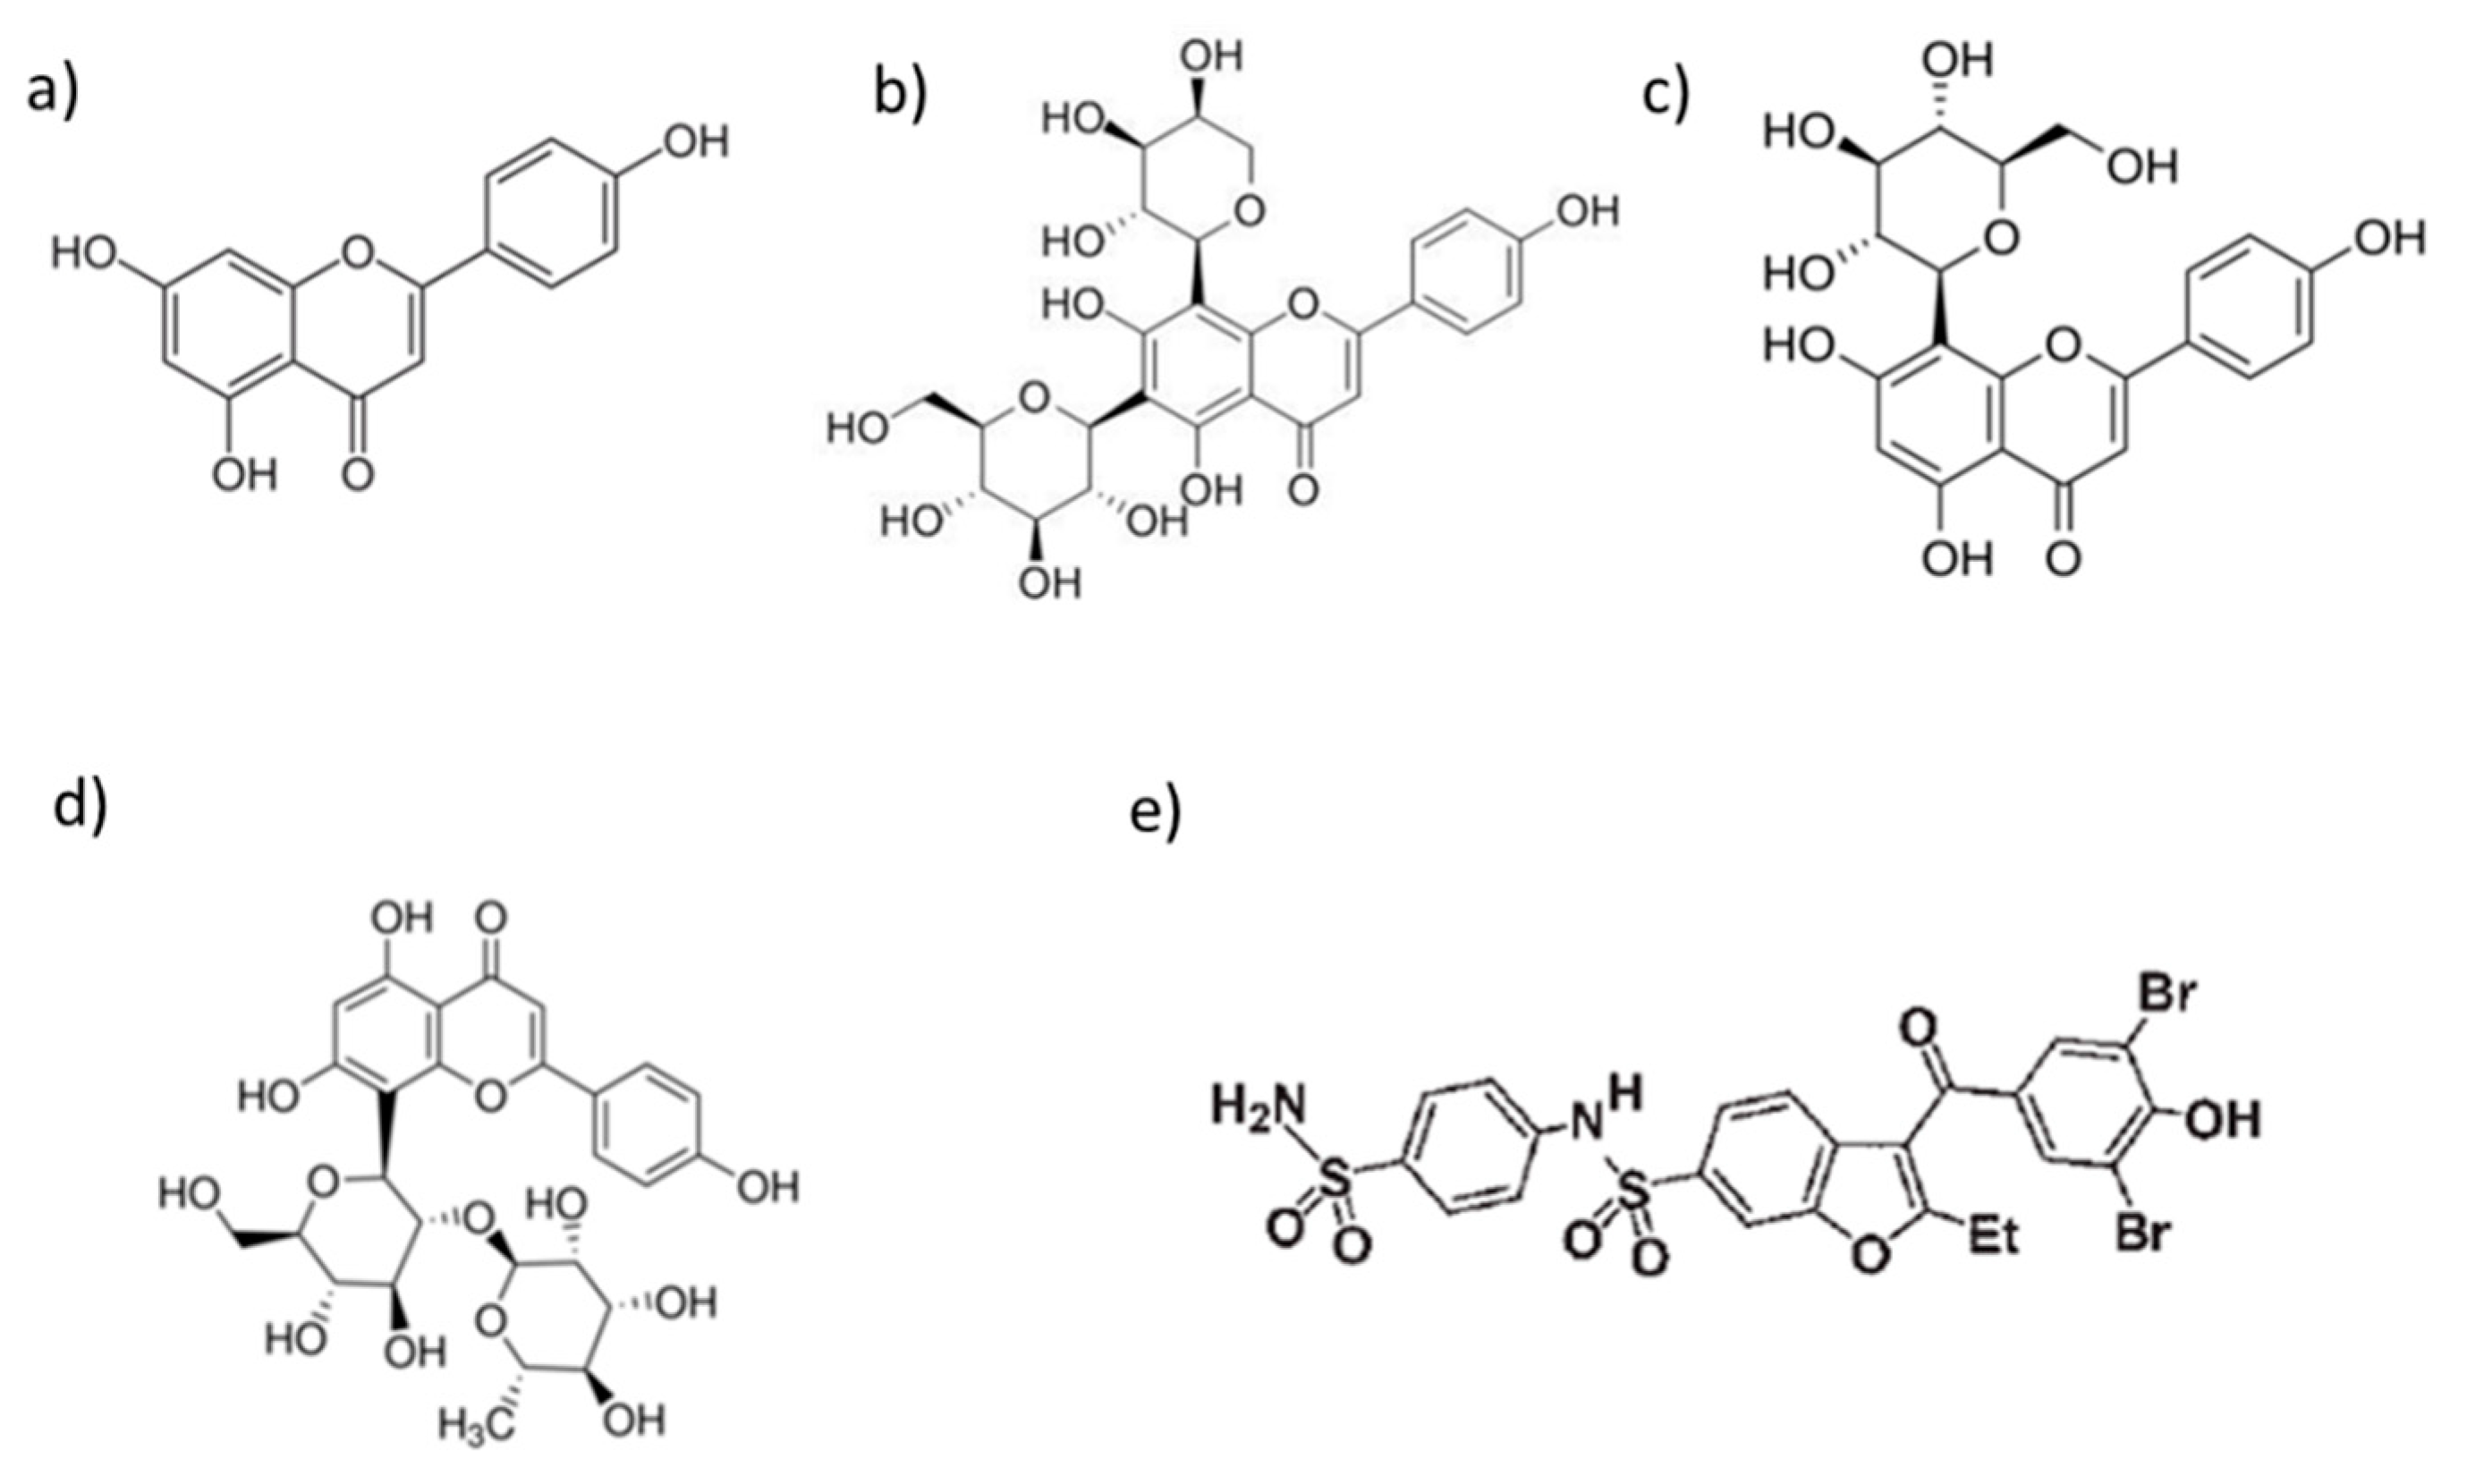
3.1. Phenolic Characterization of Nonfermented Flours
3.2. Phenolic Characterization of Fermented Flours
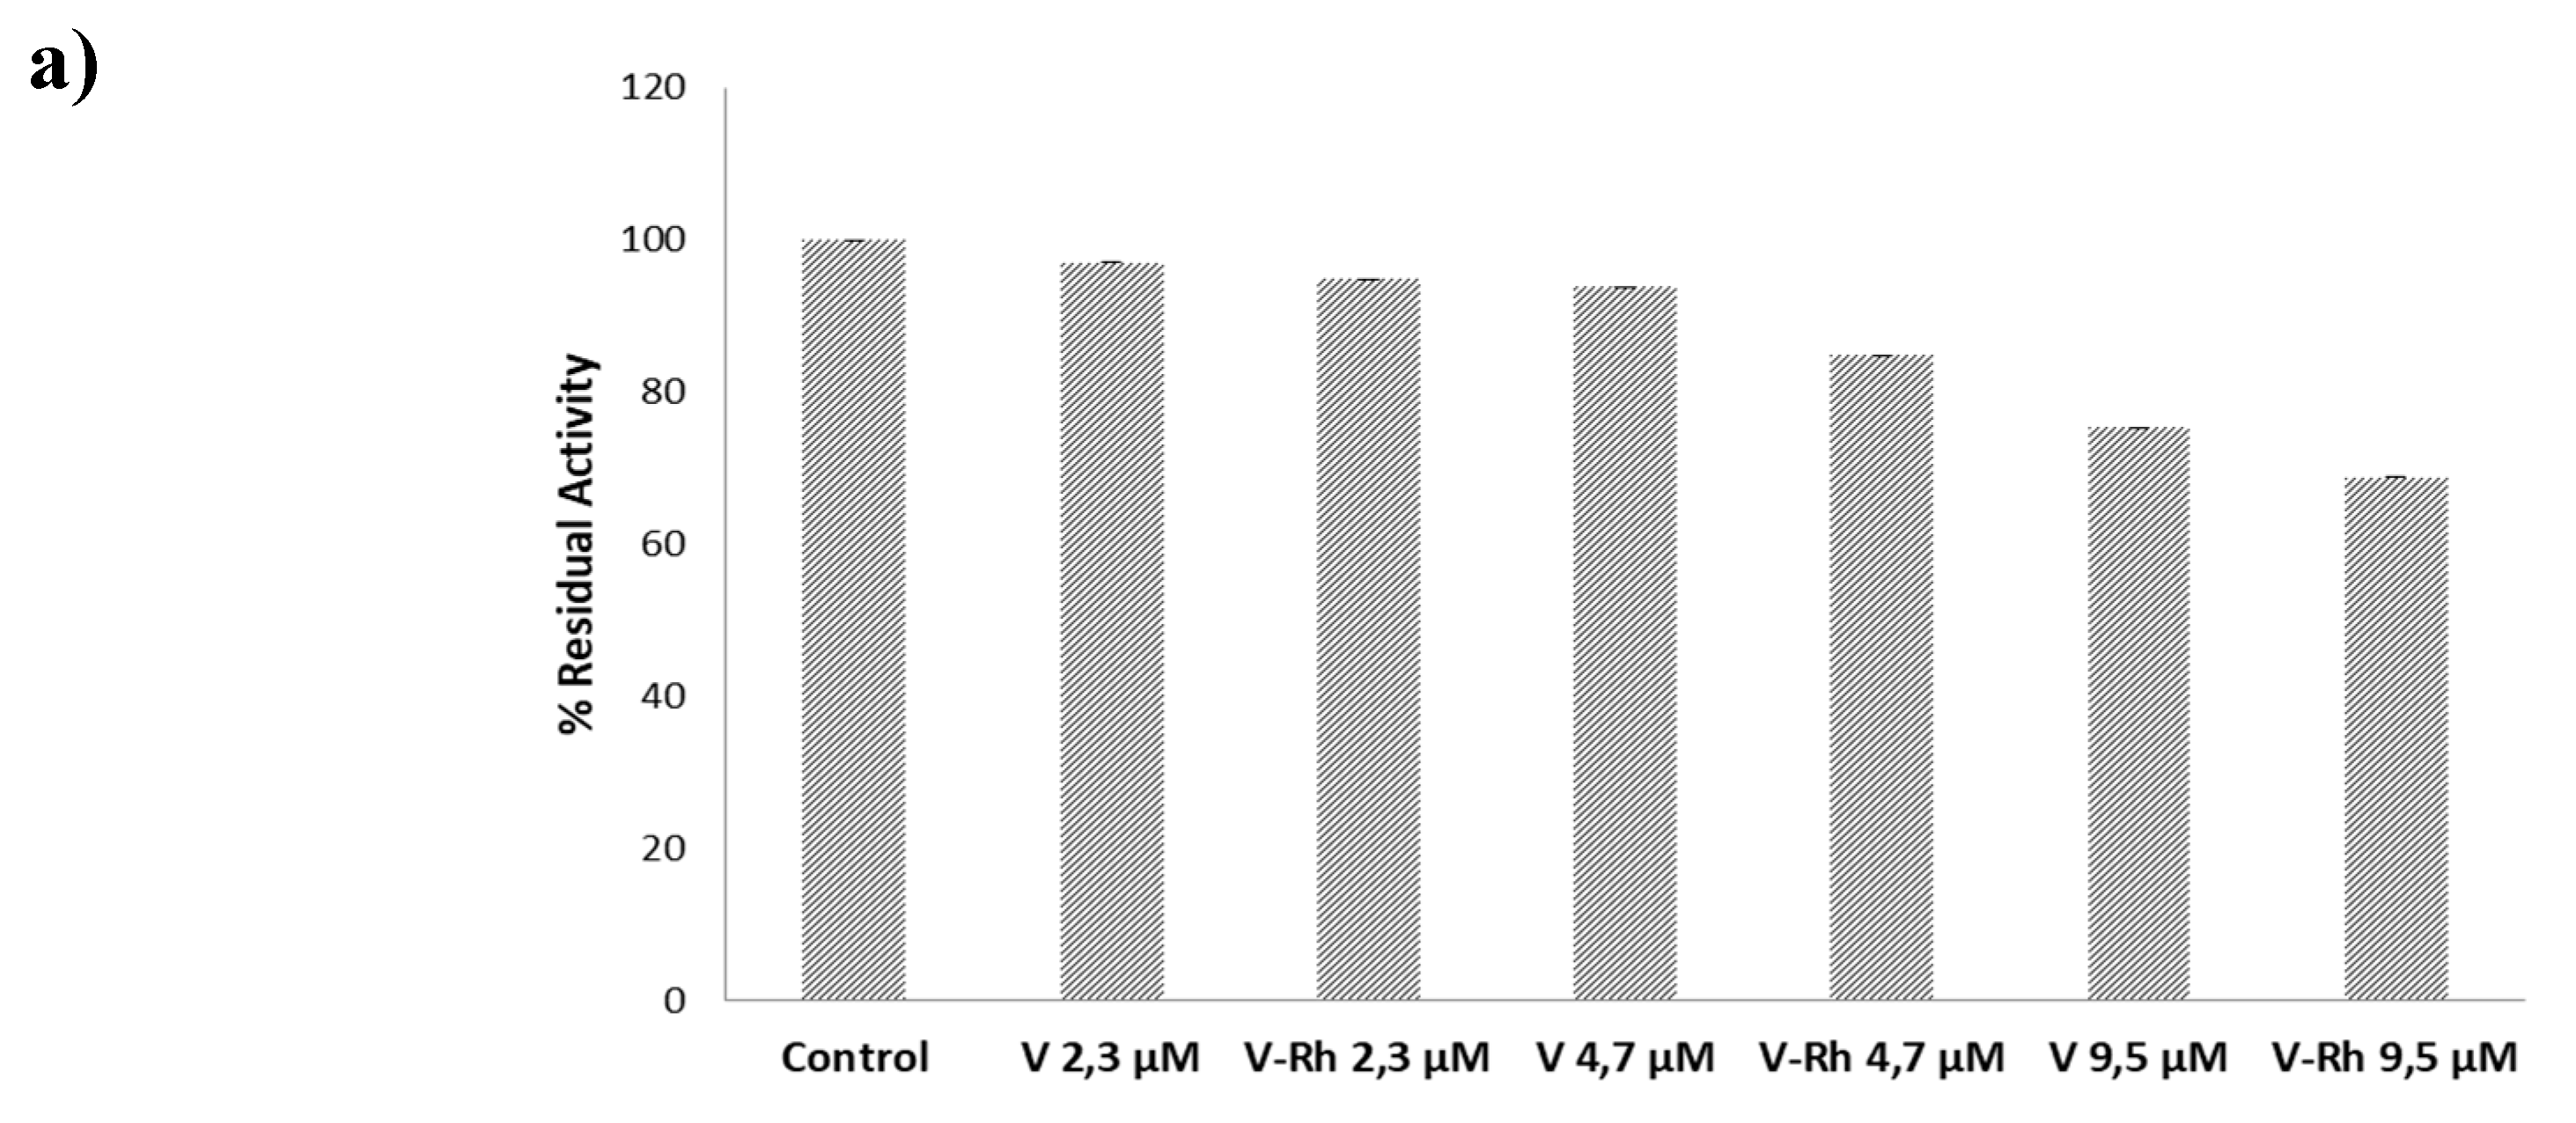
3.3. Inhibition Test on PTP1B Enzyme
3.4. Molecular Dynamic Simulation for PTP1B Enzyme
3.5. Ex Vivo Cellular Antioxidant Activity on Human Erythrocytes
4. Conclusions
Supplementary Materials
Author Contributions
Funding
Conflicts of Interest
References
- Chandr, A. Millet grain phenolics and their role in disease risk reduction and health promotion: A review. J. Funct. Foods 2013, 5, 570–581. [Google Scholar]
- Muthamilarasan, M.; Dhaka, A.; Yadav, R.; Prasad, M. Exploration of millet models for developing nutrient rich graminaceous crops. Plant Sci. 2015, 242, 89–97. [Google Scholar] [CrossRef] [Green Version]
- Wei, S.; Cheng, D.; Yu, H.; Wang, X.; Song, S.; Wang, C. Millet-enriched diets attenuate high salt-induced hypertension and myocardial damage in male rats. J. Funct. Foods 2018, 44, 304–312. [Google Scholar] [CrossRef]
- Collar, C. Gluten-Free Dough-Based Foods and Technologies. Sorghum and Millets. In Sorghum and Millets, 2nd ed.; Taylor, J.R.N., Duodo, G.K., Eds.; AACCI: Eagan, MN, USA, 2019; pp. 331–354. [Google Scholar]
- Dias-martins, A.M.; Letícia, K.; Pessanha, F.; Pacheco, S.; Avelino, J.; Rodrigues, S.; Wanderlei, C.; Carvalho, P. Potential use of pearl millet (Pennisetum glaucum (L.) R. Br.) in Brazil: Food security, processing, health benefits and nutritional products. Food Res. Int. 2018, 109, 175–186. [Google Scholar] [CrossRef] [Green Version]
- Chandrasekara, A.; Shahidi, F. Determination of antioxidant activity in free and hydrolyzed fractions of millet grains and characterization of their phenolic profiles by HPLC-DAD-ESI-MSn. J. Funct. Foods 2011, 3, 144–158. [Google Scholar] [CrossRef]
- Wang, T.; He, F.; Chen, G. Improving bioaccessibility and bioavailability of phenolic compounds in cereal grains through processing technologies: A concise review. J. Funct. Foods 2014, 7, 101–111. [Google Scholar] [CrossRef]
- Adebiyi, J.A.; Obadina, A.O.; Adebo, O.A.; Kayitesi, E. Comparison of nutritional quality and sensory acceptability of biscuits obtained from native, fermented, and malted pearl millet (Pennisetum glaucum) flour. Food Chem. 2017, 232, 210–217. [Google Scholar] [CrossRef]
- Hur, S.J.; Lee, S.Y.; Kim, Y.C.; Choi, I.; Kim, G.B. Effect of fermentation on the antioxidant activity in plant-based foods. Food Chem. 2014, 160, 346–356. [Google Scholar] [CrossRef] [PubMed]
- Nout, M.J.R. Rich nutrition from the poorest—Cereal fermentations in Africa and Asia. Food Microbiol. 2009, 26, 685–692. [Google Scholar] [CrossRef] [PubMed]
- Terefe, N.S. Food Fermentation. In Reference Module in Food Science; Elsevier: Amsterdam, The Netherlands, 2016. [Google Scholar]
- Ganguly, S.; Sabikhi, L.; Singh, A.K. Effect of whey-pearl millet-barley based probiotic beverage on Shigella-induced pathogenicity in murine model. J. Funct. Foods 2019, 54, 498–505. [Google Scholar] [CrossRef]
- Oguntoyinbo, F.A.; Narbad, A. Multifunctional properties of Lactobacillus plantarum strains isolated from fermented cereal foods. J. Funct. Foods 2015, 17, 621–631. [Google Scholar] [CrossRef] [Green Version]
- Prakash, J. Safety of Fermented Cereals and Legumes. In Regulating Safety of Traditional and Ethnic Foods; Elsevier: Amsterdam, The Netherlands, 2016; pp. 283–310. [Google Scholar]
- Dey, T.B.; Kuhad, R.C. Enhanced production and extraction of phenolic compounds from wheat by solid-state fermentation with Rhizopus oryzae RCK2012. Biotechnol. Rep. 2014, 4, 120–127. [Google Scholar]
- Saharan, P.; Sadh, P.K.; Duhan, J.S. Biocatalysis and Agricultural Biotechnology Comparative assessment of effect of fermentation on phenolics, flavonoids and free radical scavenging activity of commonly used cereals. Biocatal. Agric. Biotechnol. 2017, 12, 236–240. [Google Scholar] [CrossRef]
- Acosta-Estrada, B.A.; Gutiérrez-Uribe, J.A.; Serna-Saldívar, S.O. Bound phenolics in foods, a review. Food Chem. 2014, 152, 46–55. [Google Scholar] [CrossRef]
- Ciesarová, Z.; Mikušová, L.; Magala, M.; Kohajdová, Z.; Karovičová, J. Nonwheat Cereal-Fermented-Derived Products. In Fermented Foods in Health and Disease Prevention; Elsevier: Amsterdam, The Netherlands, 2016; pp. 417–432. [Google Scholar]
- Zhen, L.; Hai, R. Phenolic and carotenoid profiles and antiproliferative activity of foxtail millet. Food Chem. 2015, 174, 495–501. [Google Scholar] [CrossRef]
- Peters, G.H.; Frimurer, T.M.; Andersen, J.N.; Olson, O.H. Molecular dynamics simulations of protein-tyrosine phosphatase 1B ligand-induced changes in protein motions. Biophys. J. 1999, 77, 505–515. [Google Scholar] [CrossRef] [Green Version]
- Peters, G.H.; Frimurer, T.M.; Andersen, J.N.; Olson, O.H. Molecular dynamics simulations of protein-tyrosine phosphatase 1B. II substrate–enzyme interactions and dynamics. Biophys. J. 2000, 78, 2191–2200. [Google Scholar] [CrossRef] [Green Version]
- Kamerlin, S.C.; Rucker, R.; Boresch, S.S.C.L. A molecular dynamics study of WPD-loop flexibility in PTP1B. Biochem. Biophys. Res. Commun. 2007, 356, 1011–1016. [Google Scholar] [CrossRef]
- Jiang, C.S.; Liang, L.F.; Guo, Y.W. Natural products possessing protein tyrosine phosphatase 1B (PTP1B) inhibitory activity found in the last decades. Acta Pharmacol. Sin. 2012, 33, 1217–1245. [Google Scholar] [CrossRef]
- Balli, D.; Bellumori, M.; Paoli, P.; Pieraccini, G.; Paola, M.D.; Filippo, C.D.; Gioia, D.D.; Mulinacci, N.; Innocenti, M. Study on a Fermented Whole Wheat: Phenolic Content, Activity on PTP1B Enzyme and In Vitro Prebiotic Properties. Molecules 2019, 24, 1120. [Google Scholar] [CrossRef] [Green Version]
- Balli, D.; Bellumori, M.; Orlandini, S.; Cecchi, L.; Mani, E.; Pieraccini, G.; Mulinacci, N.; Innocenti, M. Optimized hydrolytic methods by response surface methodology to accurately estimate the phenols in cereal by HPLC-DAD: The case of millet. Food Chem. 2020, 303, 125393. [Google Scholar] [CrossRef] [PubMed]
- Gabriele, M.; Parri, E.; Felicioli, A.; Sagona, S.; Pozzo, L.; Pucci, L.; Domenici, V. Phytochemical composition and antioxidant activity of Tuscan bee pollen of different botanic origins. Ital. J. Food Sci. 2015, 27, 248–259. [Google Scholar]
- Paoli, P.; Cirri, P.; Caselli, A.; Ranaldi, F.; Bruschi, G.; Santi, A.; Camici, G. The insulin-mimetic effect of Morin: A promising molecule in diabetes treatment. Biochim. Biophys. Acta Gen. Subj. 2013, 1830, 3102–3111. [Google Scholar] [CrossRef] [PubMed]
- Pronk, S.; Páll, S.; Schulz, R.; Larsson, P.; Bjelkmar, P.; Apostolov, R.; Shirts, M.R.; Smith, J.C.; Kasson, P.M.; Van der Spoel, D.; et al. GROMACS 4.5: A high-throughput and highly parallel open source molecular simulation toolkit. Bioinformatics 2013, 29, 845–854. [Google Scholar] [CrossRef] [PubMed]
- Pettersen, E.F.; Goddard, T.D.; Huang, C.C.; Couch, G.S.; Greenblatt, D.M.; Meng, E.C.; Ferrin, T.E. UCSF Chimera—A visualization system for exploratory research and analysis. J. Comput. Chem. 2004, 13, 1605–1612. [Google Scholar] [CrossRef] [PubMed] [Green Version]
- Sousa da Silva, A.W.; VRANKEN, W.F. ACPYPE—AnteChamber PYthon Parser interfacE. BMC Res. Notes 2012, 5, 367. [Google Scholar] [CrossRef] [Green Version]
- Wang, J.; Wang, W.; Kollman, P.A.; Case, D.A. Automatic atom type and bond type perception in molecular mechanical calculations. J. Mol. Graph. Model. 2006, 25, 247–260. [Google Scholar] [CrossRef]
- Jorgensen, W.L.; Maxwell, D.S.; Tirado-Rives, J. Development and Testing of the OPLS All-Atom Force Field on Conformational Energetics and Properties of Organic Liquids. J. Am. Chem. Soc. 1996, 118, 11225–11236. [Google Scholar] [CrossRef]
- Bussi, G.; Donadio, D.; Parrinello, M. Canonical sampling through velocity rescaling. J. Chem. Phys. 2007, 126, 014101. [Google Scholar] [CrossRef] [Green Version]
- Hess, B.; Bekker, H.; Berendsen, H.J.C.; Fraaije, J.G.E.M. LINCS: A linear constraint solver for molecular simulations. J. Comput. Chem. 1997, 18, 1463–1472. [Google Scholar] [CrossRef]
- Gabriele, M.; Pucci, L.; Julius, A.; Longo, V. Anti-inflammatory and antioxidant effect of fermented whole wheat on TNFα-stimulated HT-29 and NF-κB signaling pathway activation. J. Funct. Food 2018, 45, 392–400. [Google Scholar] [CrossRef]
- Frassinetti, S.; Gabriele, M.; Caltavuturo, L.; Longo, V.; Pucci, L. Antimutagenic and Antioxidant Activity of a Selected Lectin-free Common Bean (Phaseolus vulgaris L.) in Two Cell-based Models. Plant Foods Hum. Nutr. 2015, 70, 35–41. [Google Scholar] [CrossRef] [PubMed]
- Chandrasekara, A.; Shahidi, F. Content of Insoluble Bound Phenolics in Millets and Their Contribution to Antioxidant Capacity. J. Agric. Food Chem. 2010, 58, 6706–6714. [Google Scholar] [CrossRef] [PubMed]
- Saleh, A.S.M.; Zhang, Q.; Chen, J.; Shen, Q. Millet grains: Nutritional quality, processing, and potential health benefits. Compr. Rev. Food Sci. Food Saf. 2013, 12, 281–295. [Google Scholar] [CrossRef]
- Dey, T.B.; Chakraborty, S.; Jain, K.K.; Sharma, A.; Kuhad, R.C. Antioxidant phenolics and their microbial production by submerged and solid state fermentation process: A review. Trends Food Sci. Technol. 2016, 53, 60–74. [Google Scholar]
- Wang, C.; Wu, S.; Shyu, Y.; Al, W.E.T.; Ioeng, J.B.I.B. Antioxidant properties of certain cereals as affected by food-grade bacteria fermentation. J. Biosci. Bioeng. 2014, 117, 449–456. [Google Scholar] [CrossRef]
- Taylor, J.R.N.; Duodu, K.G. Effects of processing sorghum and millets on their phenolic phytochemicals and the implications of this to the health-enhancing properties of sorghum and millet food and beverage products. J. Sci. Food Agric. 2014, 95, 225–237. [Google Scholar] [CrossRef] [Green Version]
- Curiel, J.A.; Rodríguez, H.; Landete, J.M.; De las Rivas, B.; Muñoz, R. Ability of Lactobacillus brevis strains to degrade food phenolic acids. Food Chem. 2010, 120, 225–229. [Google Scholar] [CrossRef] [Green Version]
- Adisakwattana, S.; Pongsuwan, J.; Wungcharoen, C.; Yibchok-Anun, S. In vitro effects of cinnamic acid derivatives on protein tyrosine phosphatase 1B. J. Enzym. Inhib. Med. Chem. 2013, 28, 1067–1072. [Google Scholar] [CrossRef]
- Choi, J.S.; Islam, M.N.; Ali, M.Y.; Kim, E.J.; Kim, Y.M.; Jung, H.A. Effects of C-glycosylation on anti-diabetic, anti-Alzheimer’s disease and anti-inflammatory potential of apigenin. Food Chem. Toxicol. 2014, 64, 27–33. [Google Scholar] [CrossRef]
- Wiesmann, C.; Kenneth, B.J.; Kung, J.; Zhu, J.; Erlanson, D.; Shen, W.; Fahr, B.J.; Zhong, M.; Taylor, L.; Randal, M.; et al. Allosteric inhibition of protein tyrosine phosphatase 1B. Nat. Struct. Mol. Biol. 2004, 11, 730–737. [Google Scholar] [CrossRef] [PubMed]
- Jin, T.; Yu, H.; Huang, X. Selective binding modes and allosteric inhibitory effects of lupane triterpenes on protein tyrosine phosphatase 1B. Sci. Rep. 2016, 6, 20766. [Google Scholar] [CrossRef] [PubMed] [Green Version]
- Morris, G.M.; Huey, R.; Lindstrom, W.; Sanner, M.F.; Belew, R.K.; Goodsell, D.S.; Olson, A.J. Autodock4 and AutoDockTools4: Automated docking with selective receptor flexiblity. J. Comput. Chem. 2009, 16, 2785–2791. [Google Scholar] [CrossRef] [PubMed] [Green Version]
- Caddeo, C.; Pucci, L.; Gabriele, M.; Carbone, C.; Fernàndez-busquets, X.; Valenti, D.; Pons, R.; Vassallo, A.; Maria, A.; Manconi, M. Stability, biocompatibility and antioxidant activity of PEG-modified liposomes containing resveratrol. Int. J. Pharm. 2018, 538, 40–47. [Google Scholar] [CrossRef] [PubMed]


| Analytes | [M − H]− | Identified Compounds |
|---|---|---|
| c1 | 468 | N2,N4-dicaffeoylspermidine |
| c2 | p-coumaric acid | |
| c5 | ferulic acid | |
| c8 | 339 | ferulic acid rhamnoside |
| c9 | 339 | ferulic acid rhamnoside isomer |
| c10 | 193 | isoferulic acid |
| c11 | 177 | methylhydroxycinnamate |
| c12 | 192 | methyl ferulate |
| f3 | 609 | luteolin-(7-O-glucopyranosyl)-8-C-glucopyranoside |
| f4 | 593 | vicenin II |
| f6 | 577 | vitexin 2″-O-rhamnoside |
| f7 | 431 | vitexin |
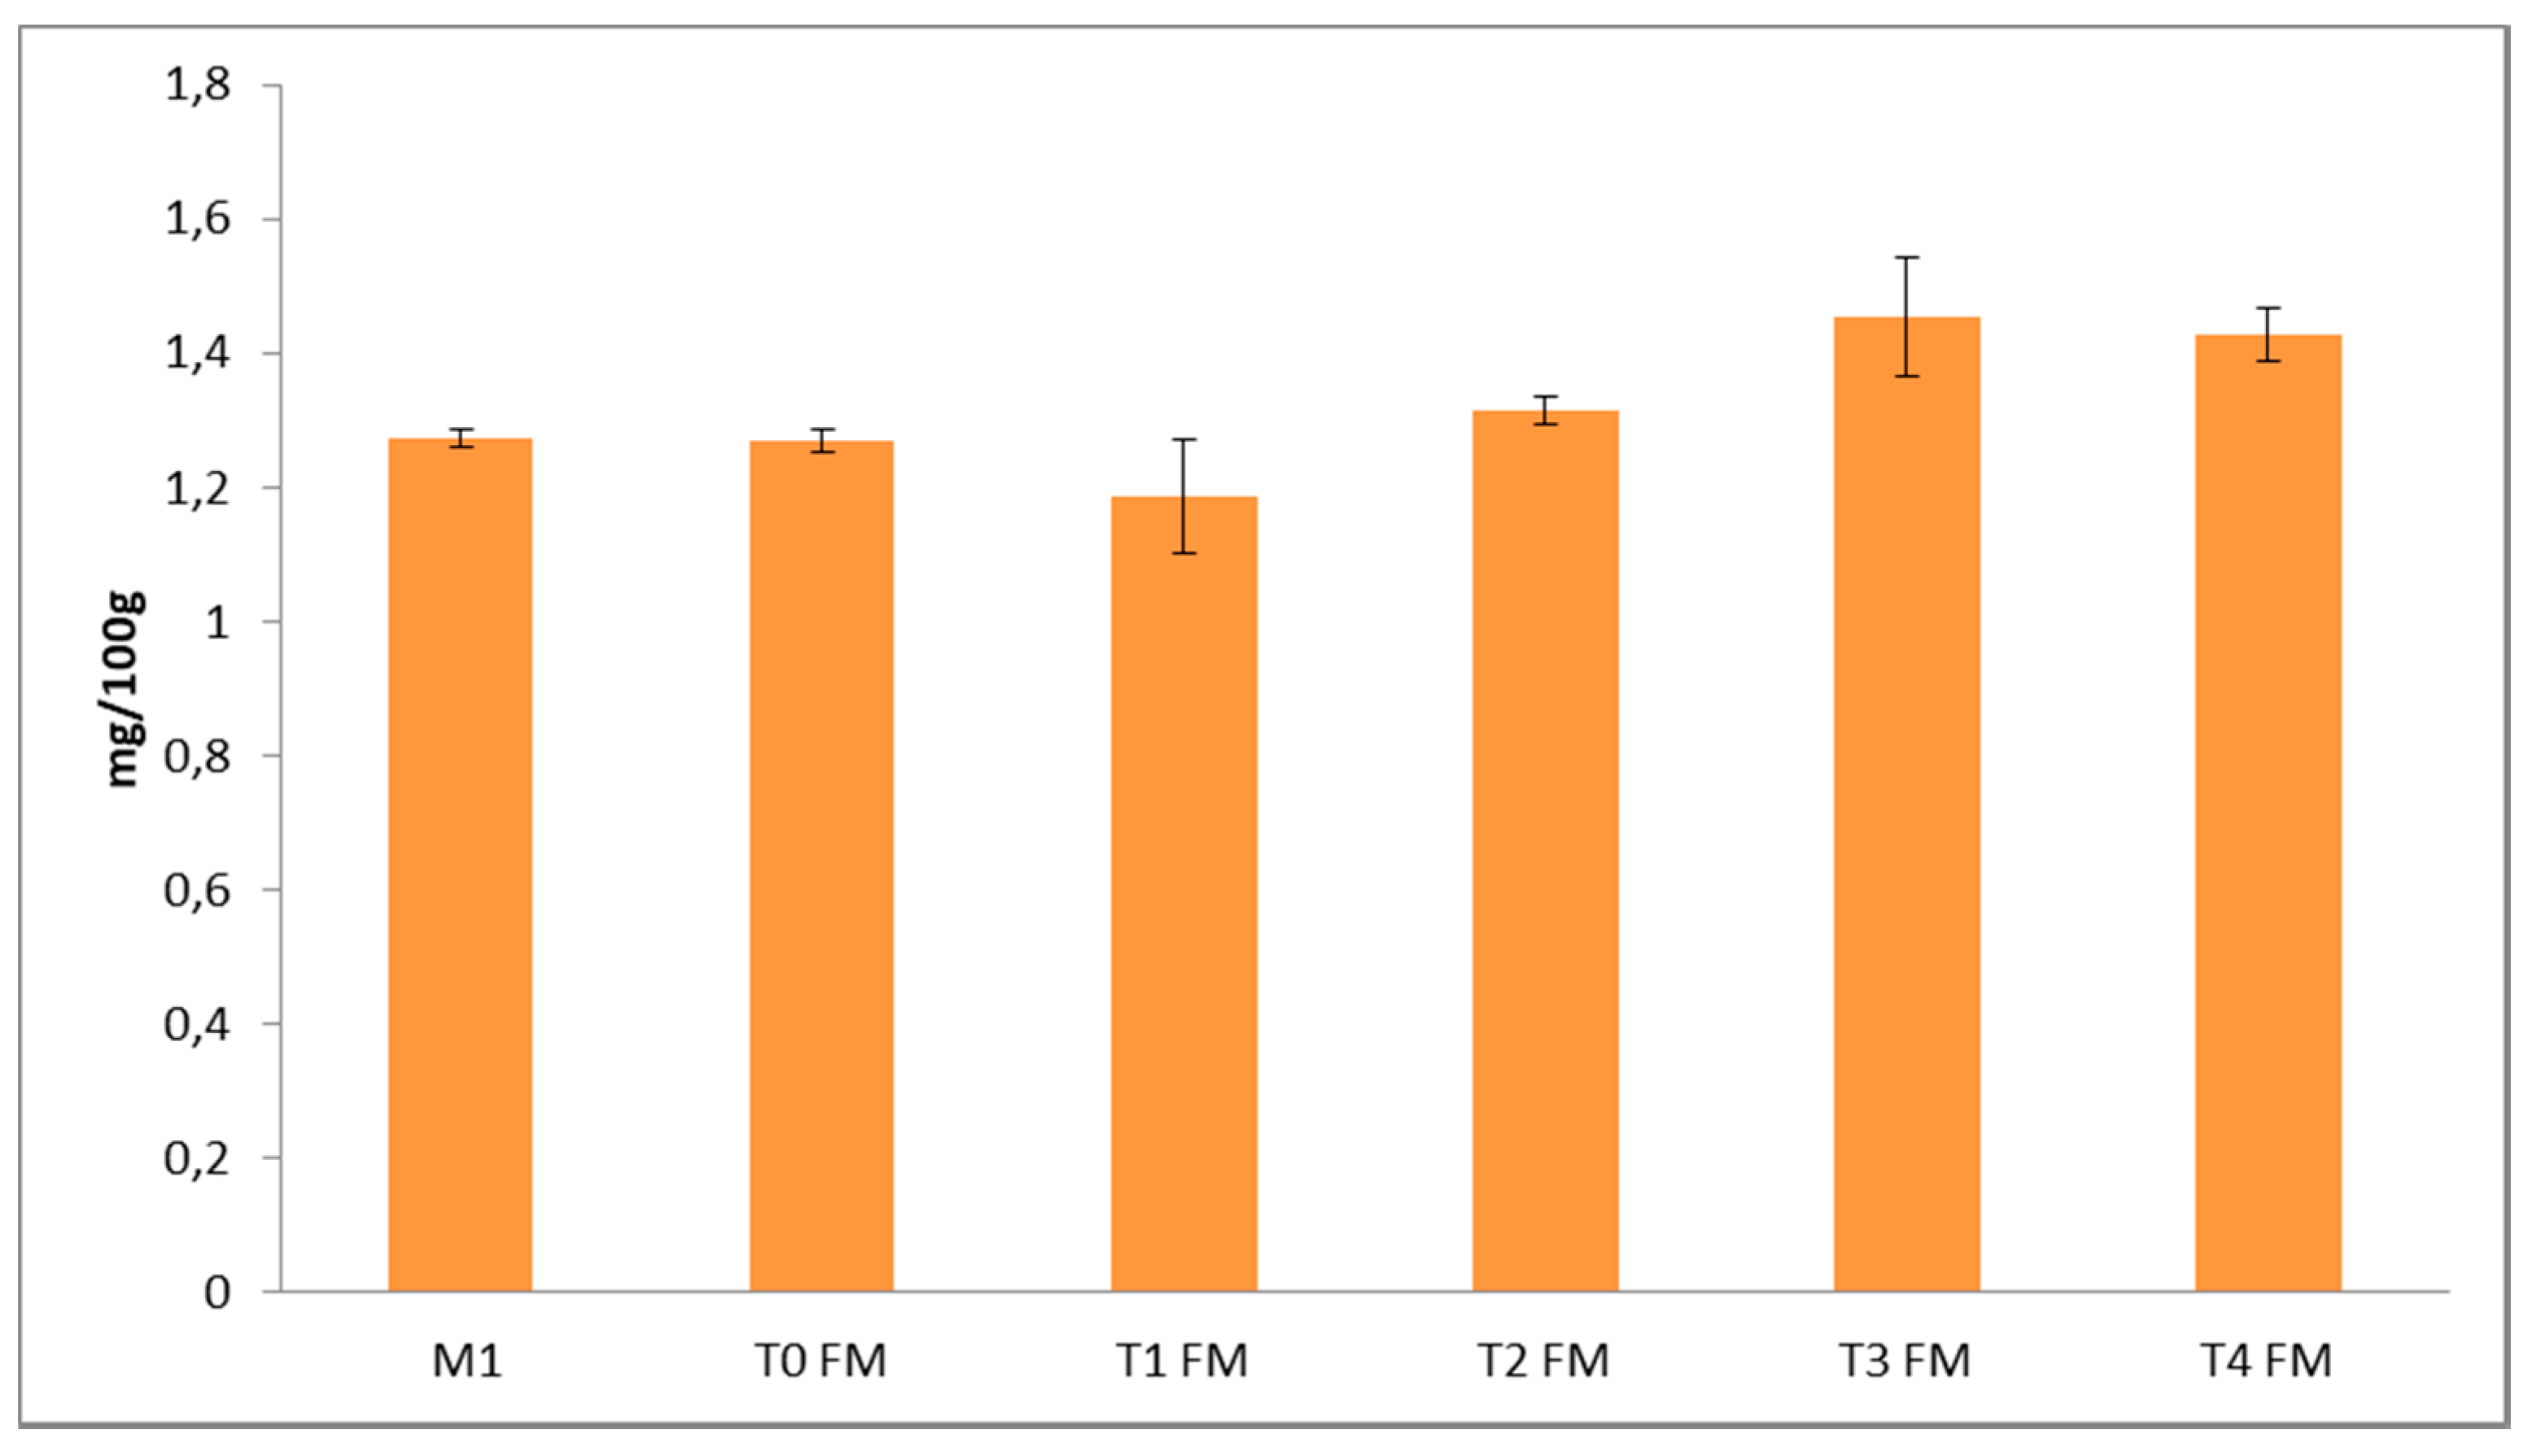
| Free Phenols, mg/100 g | Total Phenols after Basic Hydrolysis mg/100 g | |||||
|---|---|---|---|---|---|---|
| Analytes | M1 | M2 | M3 | M1 | M2 | M3 |
| c1 | 6.8 a | 7.4 a | 7.1 a | - | - | - |
| c2 | - | - | - | - | - | 2.3 |
| c5 | - | - | - | 16.5 b | - | 34.2 a |
| c8 | 2.5 a | 1.9 a | 1.3 a | - | - | - |
| c9 | 3.2 a | 1.6 b | 1.6 b | - | - | - |
| c10 | 1.1 a | 1.1 a | 0.5 b | - | - | - |
| c11 | 1.1 a | 1.3 a | 1.2 a | 4.4 b | - | 5.3 a |
| c12 | 1.7 a | 2.0 a | 1.1 b | 56.5 b | 40.8 c | 67.1 a |
| f3 | 44.3 a | 22.0 c | 35.3 b | 17.3 a | 13.9 b | 3.2 c |
| f4 | 44.7 a | 7.4 b | 7.6 b | 45.2 a | 8.6 b | 6.7 c |
| f6 | 12.9 a | 1.5 c | 3.0 b | - | - | - |
| f7 | 9.1 a | 2.0 c | 4.6 b | 9.4 a | 3.2 c | 4.9 b |
| TCC | 16.4 a | 15.3 b | 12.8 c | 77.4 b | 40.8 c | 108.9 a |
| TFC | 111 a | 32.9 c | 53.2 b | 71.9 a | 22.7 b | 14.8 c |
| TPC | 127.4 a | 48.2 c | 64.0 b | 149.3 a | 66.5 c | 123.7 b |
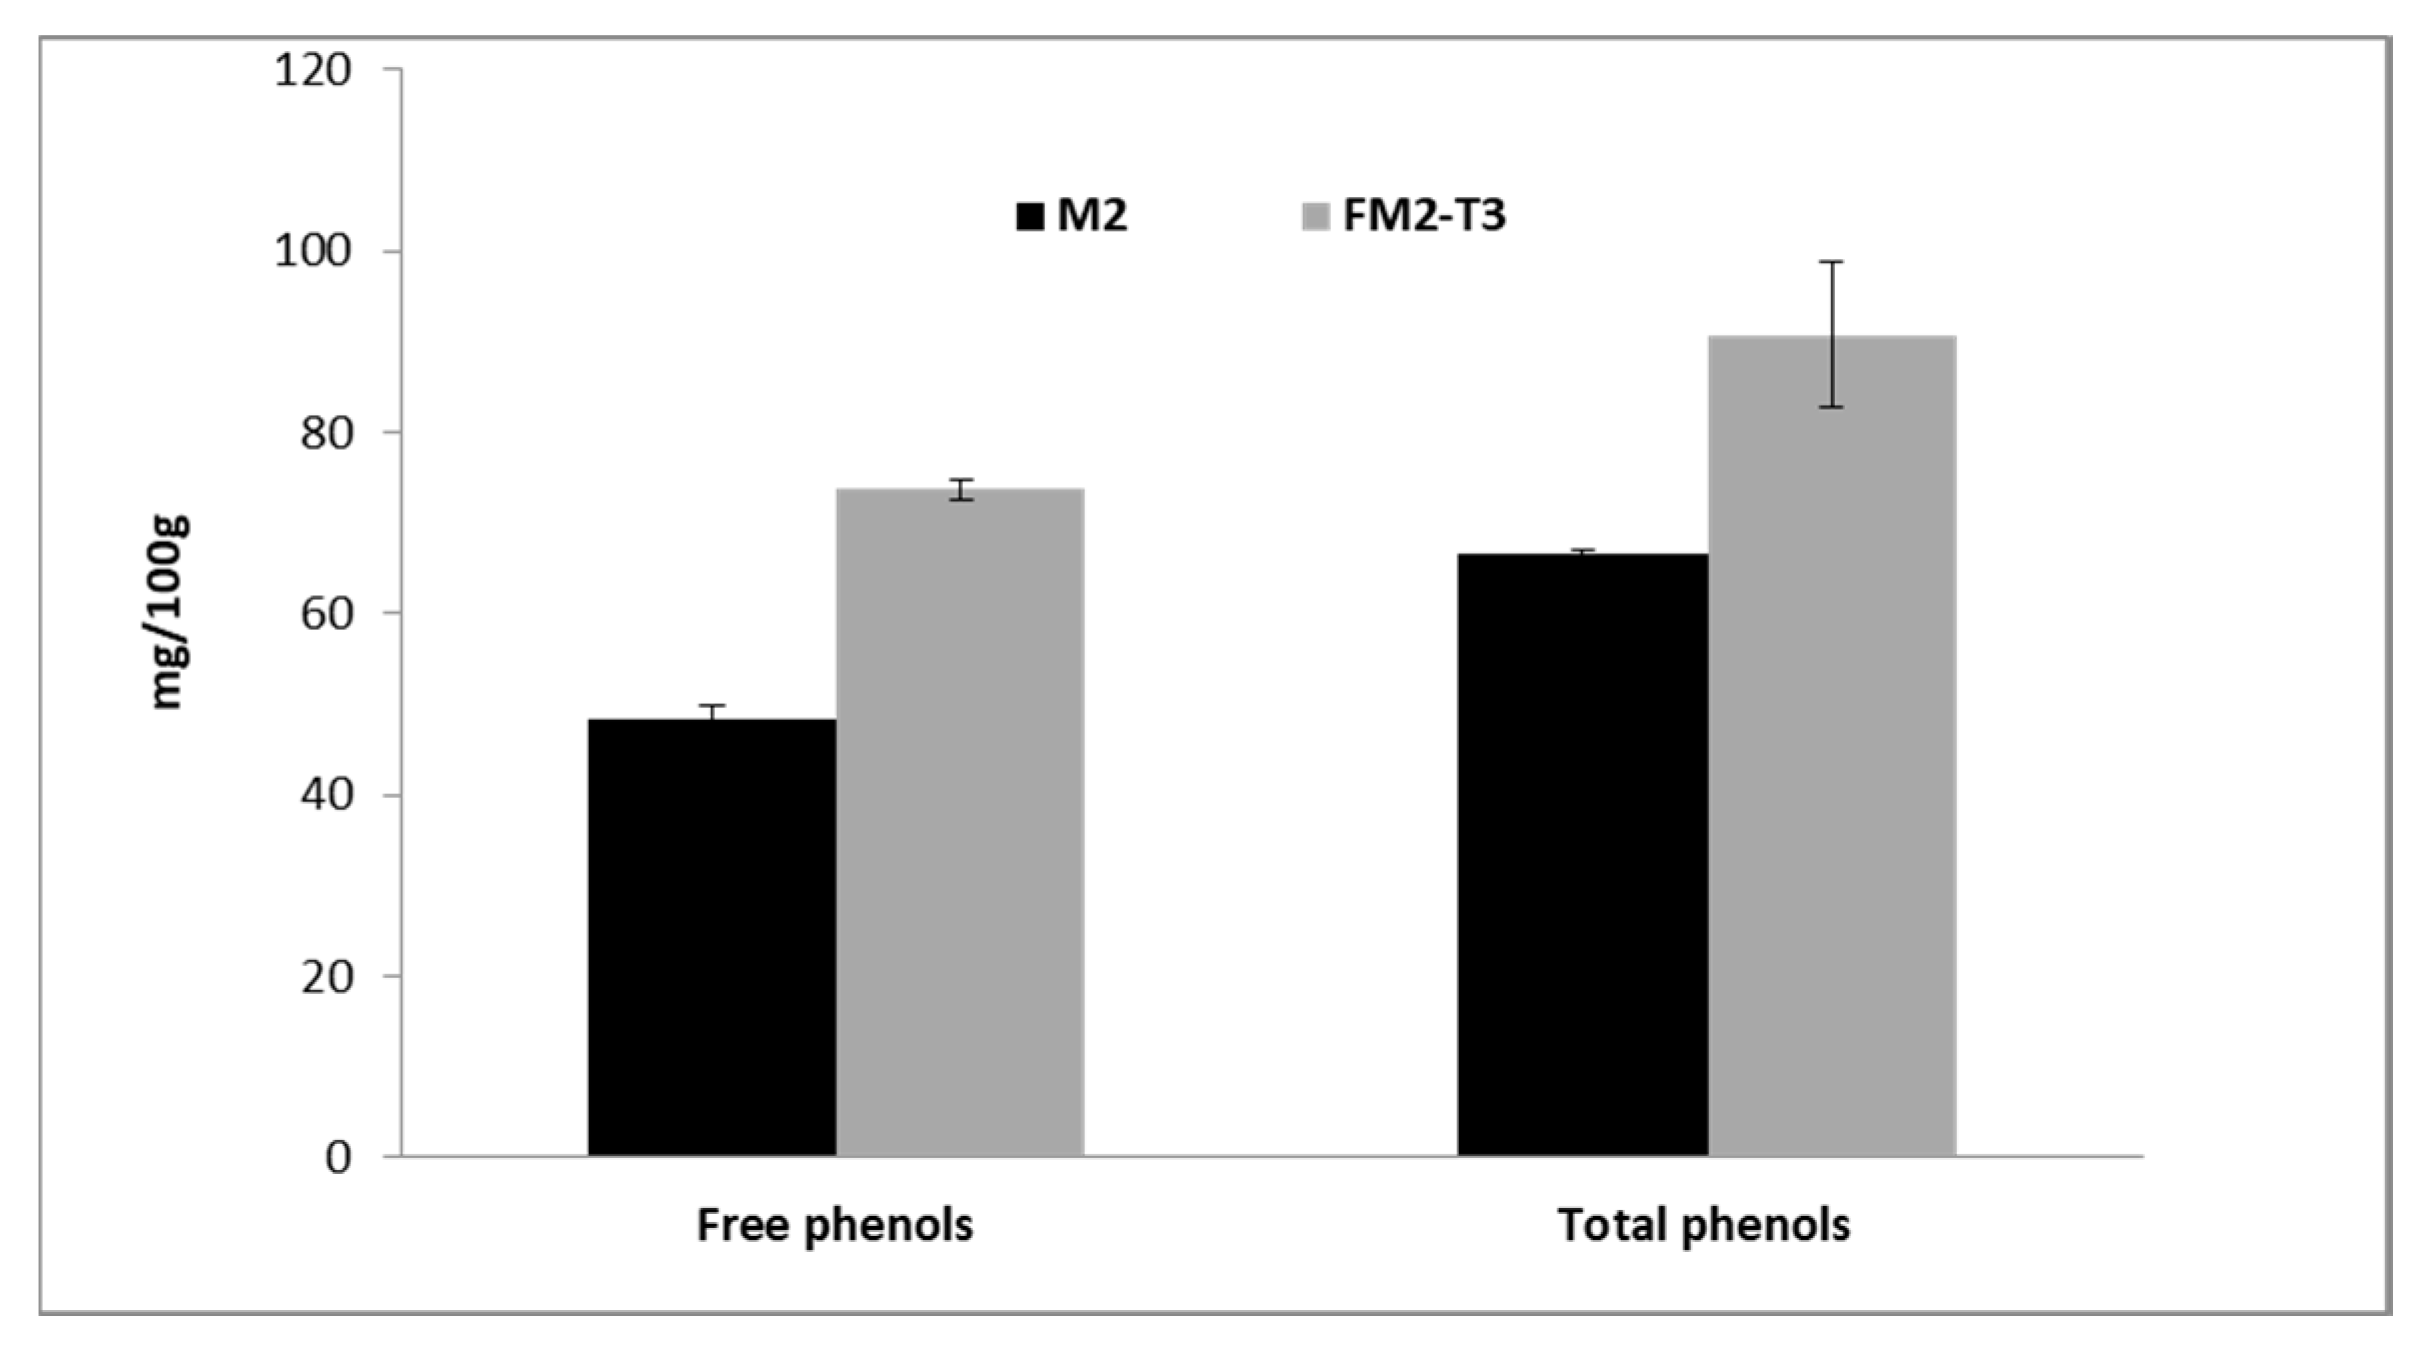
| Total Phenols after Basic Hydrolysis (mg/100 g) | Total Phenols after Acidic Hydrolysis (mg/100 g) | |
|---|---|---|
| M1 | 149.3 ± 3.2 * | 193.6 ± 4.0 * |
| FM1-T3 | 206.2 ± 0.8 * | 278.3 ± 1.8 * |
© 2020 by the authors. Licensee MDPI, Basel, Switzerland. This article is an open access article distributed under the terms and conditions of the Creative Commons Attribution (CC BY) license (http://creativecommons.org/licenses/by/4.0/).
Share and Cite
Balli, D.; Bellumori, M.; Pucci, L.; Gabriele, M.; Longo, V.; Paoli, P.; Melani, F.; Mulinacci, N.; Innocenti, M. Does Fermentation Really Increase the Phenolic Content in Cereals? A Study on Millet. Foods 2020, 9, 303. https://doi.org/10.3390/foods9030303
Balli D, Bellumori M, Pucci L, Gabriele M, Longo V, Paoli P, Melani F, Mulinacci N, Innocenti M. Does Fermentation Really Increase the Phenolic Content in Cereals? A Study on Millet. Foods. 2020; 9(3):303. https://doi.org/10.3390/foods9030303
Chicago/Turabian StyleBalli, Diletta, Maria Bellumori, Laura Pucci, Morena Gabriele, Vincenzo Longo, Paolo Paoli, Fabrizio Melani, Nadia Mulinacci, and Marzia Innocenti. 2020. "Does Fermentation Really Increase the Phenolic Content in Cereals? A Study on Millet" Foods 9, no. 3: 303. https://doi.org/10.3390/foods9030303
APA StyleBalli, D., Bellumori, M., Pucci, L., Gabriele, M., Longo, V., Paoli, P., Melani, F., Mulinacci, N., & Innocenti, M. (2020). Does Fermentation Really Increase the Phenolic Content in Cereals? A Study on Millet. Foods, 9(3), 303. https://doi.org/10.3390/foods9030303