Article

Insights into the Identification of the Specific Spoilage Organisms in Chicken Meat

by
Cinthia E. Saenz-García
1,
Pilar Castañeda-Serrano
2,
Edmundo M. Mercado Silva
1,
Christine Z. Alvarado
3 and
Gerardo M. Nava
1,*
1
Departamento de Investigación y Posgrado de Alimentos, Universidad Autónoma de Querétaro, Querétaro 76010, QRO, Mexico
2
Facultad de Medicina Veterinaria y Zootecnia, Universidad Nacional Autónoma de México, Tláhuac 13300, CDMX, Mexico
3
Department of Poultry Science, Texas A&M University, College Station, TX 77843, USA
*
Author to whom correspondence should be addressed.
Foods 2020, 9(2), 225; https://doi.org/10.3390/foods9020225
Submission received: 8 January 2020 / Revised: 11 February 2020 / Accepted: 12 February 2020 / Published: 20 February 2020
(This article belongs to the Section Food Microbiology)

Abstract

:
Poultry meat deterioration is caused by environmental conditions, as well as proliferation of different bacterial groups, and their interactions. It has been proposed that meat spoilage involves two bacterial groups: one group that initiates the deterioration process, known as specific spoilage organisms (SSOs), and the other known as spoilage associated organisms (SAOs) which represents all bacteria groups recovered from meat samples before, during, and after the spoilage process. Numerous studies have characterized the diversity of chicken meat SAOs; nonetheless, the identification of the SSOs remains a long-standing question. Based on recent genomic studies, it is suggested that the SSOs should possess an extensive genome size to survive and proliferate in raw meat, a cold, complex, and hostile environment. To evaluate this hypothesis, we performed comparative genomic analyses in members of the meat microbiota to identify microorganisms with extensive genome size and ability to cause chicken meat spoilage. Our studies show that members of the Pseudomonadaceae family have evolved numerous biological features such as large genomic size, slow-growing potential, low 16S rRNA copy number, psychrotrophic, and oligotrophic metabolism to initiate the spoilage of poultry meat. Moreover, inoculation experiments corroborated that these biological traits are associated with the potential to cause chicken meat deterioration. Together, these results provide new insights into the identification of SSO. Further studies are in progress to elucidate the impact of the SSO on meat quality and microbiota diversity.

1. Introduction

Microbiological quality of chicken meat is affected by handling during catching, transport, processing, and storage [1]. After these steps occur, chicken meat holds a diversity of bacterial groups known as microbiota [2]. Proliferation and interactions between members of the microbiota leads to deterioration of poultry meat [3]. For decades, numerous efforts have been made to identify bacterial groups responsible for meat spoilage; as a result, it has been proposed that meat microbiota is the result of microbial associations between two important bacterial groups: spoilage associated organisms (SAOs) and specific spoilage organisms (SSOs) [4].
The SAOs represent all bacterial genera recovered from meat samples before, during, and after the spoilage process. This group includes members of the Pseudomonadaceae, Listeriaceae, Enterobacteriaceae, Staphylococcaceae, Shewanellaceae, Moraxellaceae, Carnobacteriaceae, Aeromonadaceae, and Leuconostocaceae families [4,5,6]. In contrast, the SSO group represents a fraction of the SAO population and it is considered the direct cause of food spoilage [4,7,8]. Many biological traits remain unknown; nonetheless, it has been show that SSOs have a lower growth rate compared to SAO members [9,10]. Also antagonistic (e.g., competition for nutrients) or cooperative interactions (e.g., cross-feeding) between SSOs and SAOs have been described [7]. Isolation and identification of the SSO has been challenging due the complex interactions among members of the meat microbiota and the lack of adequate microbiological methods. For instance, analysis of meat microbiota by conventional methods cannot differentiate between bacterial groups that initiate meat spoilage and bacterial populations altered by this process [9]. Moreover, molecular studies have revealed that some bacterial species with spoilage potential cannot be isolated in reference media [10]; thus, there is a need to develop new microbiological strategies to identify bacteria belonging to the SSO group.
It has been proposed that the SSOs initiate proliferation after glucose is consumed by fast-growing members of the SAO group [11,12,13,14,15,16], suggesting that the SSOs have evolved different metabolic features to obtain nutrients from poultry meat. To gain insights into the identification of the SSOs, it is important to take advantage of the recent progress in microbial genomics to uncover some of the SSO biological traits. For example, it has been shown that bacteria adapted to cold and hostile environments possess an extensive genome size [10]. Also, bacteria with large genomes have evolved regulatory networks to proliferate in complex sites were nutrients are scarce or not readily available [17,18]. Based on these premises, the working hypothesis of the present study was that members of the poultry meat microbiota with extensive genome size, slow-growing phenotype, and ability to cause chicken meat spoilage could represent the SSOs of poultry meat. Therefore, comparative genomic analyses and in vitro experiments were performed to corroborate this idea.

2. Materials and Methods

2.1. Genomic Analyses of Bacterial Groups Associated with Spoilage in Chicken Meat

A comprehensive list of bacterial groups linked to chicken meat spoilage was integrated by performing an exhaustive literature review and analysis. Three renowned databases (PubMed, Google Scholar, and Science Direct) were used to find and retrieve peer review articles describing microbial analysis on chicken meat. Keywords such as Bacteria, Chicken, Isolation, Meat, Microbiota, Pseudomonas, and Spoilage were used for the searches. Bacterial genera reported in the literature were recorded and classified at the family level, using the Hierarchy Browser tool at the Ribosomal Database Project [19]. The list of bacterial families associated to chicken meat spoilage was used to retrieve whole genome information from the Integrated Microbial Genomes and Microbiomes (IMG/M) system [20]. Genomes were annotated by the DOE-JGI Microbial Genome Annotation Pipeline [20], and information such as genome size, number of protein-coding genes, and tRNAs was compared between different bacterial families.

2.2. Isolation of SSO Candidates from Spoiled Chicken Meat

To isolate potential SSOs, a novel microbiological strategy was designed to isolate bacteria adapted to cold and hostile environments. To accomplish this objective, 12 fresh skinless chicken breasts obtained from a poultry processing plant were aseptically transferred into sterile plastic containers and stored aerobically during 14 days at 4 °C. At days 10 (n = 10) and 14 (n = 10), subsamples (25 g) of meat were rinsed with 50 mL of sterile saline solution (SS), manually massaged for 3 min, and serially diluted (1:10) in SS. Dilutions were plated on three different oligotrophic agars, (1) 1.7 g tryptone, 0.05 g NaCl, 0.25 g K2HPO4, and 0.25 g glucose per liter of distilled water; (2) 0.17 g tryptone, 0.005 g NaCl, 0.025 g K2HPO4, and 0.025 g glucose per liter of distilled water; and (3) 0.0017 g tryptone, 0.0005 g NaCl, 0.0025 g K2HPO4, and 0.0025 g glucose per liter of distilled water. Bacteriological agar (16 g/L of distilled water) was added to all media. Agar plates were then incubated at 4 °C for 96 h. Representative colonies (n = 15–17) with different morphology were selected from each medium and pure cultures were obtained. Each isolated bacterium was subjected to DNA extraction using a commercial kit (Quick-gDNA Zymo Research, USA). Genomic DNA was used for near full-length (~1500 nt) 16S rRNA gene PCR amplification with primers 8F (AGAGTTTGATCCTGGCTCAG) and 1510R (CGGTTACCTTGTTACGACTT [21]. The PCR protocol consisted of an initial step of 3 min at 94 °C and 35 cycles of 45 s at 94 °C, 30 s at 55.3 °C, and 30 s at 72 °C, followed by a final extension of 5 min at 72 °C. PCR products were purified and subjected to Sanger sequencing using an ABI 3730XL capillary sequencer. Inspection, alignment, and trimming of sequences were performed with MEGA6 software [22]. Sequences were classified using Seqmatch (RDP Release 11.5) tool at the Ribosomal Database Project [19].

2.3. Bacterial Growth Rate Analysis

Members of five bacterial families, Aeromonadaceae (Aeromonas sp. n = 1), Enterobacteriaceae (Hafnia spp. n = 3; Enterobacter spp. n = 3), Listeriaceace (Brochothrix spp. n = 3), Moraxellaceae (Acinetobacter spp. n = 2), and Pseudomonadaceae (Pseudomonas spp. n = 12) were used to estimate maximum growth rates. These isolates (n = 24) were obtained from the laboratory stock collection and all of them were recovered from spoiled chicken meat. Cultures were grown overnight in Tryptic Soy Broth (TSB; DIBICO, México) and an aliquot (200 uL) were individually placed into 25 mL of fresh TSB and incubated at 22 °C, a temperature which allows growth of the different genera isolated. Subsamples (200 uL) were collected every four hours, from 0 to 60 h of incubation, to measure optical density (550 nm) using a spectrophotometer (Varioskan Flash, Thermo Scientific; Waltham, MA. USA). Two independent experiments were performed, each carried out in triplicate. Growth curves were fitted using DMFit software [23] based on the model of Baranyi and Roberts [24] to calculate the parameters of maximum growth rate (μmax).

2.4. Analysis of 16S rRNA Copy Number

To corroborate phenotypic differences observed during growth curve analysis, the number of 16S rRNA copies of each bacterial family was estimated. This genetic information was retrieved from the Ribosomal RNA Operon Copy Number Database, a curated resource for copy number information for Bacteria and Archaea [25]. For each bacterial family, the number of 16S rRNA copies was obtained using the Search Taxonomy tool and then retrieved and archived for statistical analysis.

2.5. Analysis of Meat Spoilage Potential

To evaluate the capacity of different bacterial isolates to cause meat spoilage (as assessed via the quantification of total volatile basic nitrogen [TVB-N, >20 mg/100 g] [5]) inoculation experiments were performed. First, fresh skinless chicken breast (~25 g) were decontaminated by rinsing each piece of meat five times with sterile distilled water, three times with a 20% chlorine solution, and one additional time with sterile distilled water. The piece of meat was then submerged into 96% ethanol and flamed to dry [26]. The burned meat surface was removed using a sterile knife. Decontaminated meat was placed into a sterile plastic container to perform inoculation experiments as described elsewhere [27]. Briefly, the decontaminated meat samples (5 pieces per group) were inoculated (~4.0 log CFU/g) with either Pseudomonas sp., Brochothrix sp., Hafnia sp., Acinetobacter sp. or saline solution (negative control). These isolates were recovered from spoiled chicken meat as described in Section 2.2. All samples were incubated at 4 °C and subsamples for TVB-N analyses were collected at 0, 2, 4, 6, and 8 days of incubation. This experiment was performed in triplicate.

2.6. Quantification of TVB-N

The method of Conway microdiffusion was used for qualification of TVB-N [5]. Briefly, 5 g of meat were homogenized using 15 mL of sterile distilled water for 1 min. This homogenate was mixed with sterile distilled water to bring the volume up to 50 mL; the mixture was filtered through a Whatman paper (No. 1). One milliliter of the filtered mixture was placed into the outer compartment of the Conway unit, and 1 mL of TVB-N reagent (0.66%: methyl red and 0.33% bromocresol green in alcohol 1:1) was added into the inner compartment of the unit. Then, one milliliter of saturated K2CO3 was added to the outer compartment and the unit was closed immediately. The Conway unit was incubated at 37 °C for 2 h and then 0.02% N H2SO4 was added to the inner compartment for titration. The concentration of TVB-N was estimated as described elsewhere [28].

2.7. Statistical Analysis

Results were analyzed by means of ANOVA Fisher’s protected least significant difference test using StatView version 5.0.1. Differences were considered significant at p < 0.05.

3. Results and Discussion

3.1. Genomic Analysis of Bacteria Associated with Chicken Meat Spoilage

A comprehensive revision of literature (>25 published articles), covering a time period from 1996 to 2018, revealed that 11 bacterial families comprising 14 genera have been isolated from spoiled chicken meat samples (Table 1). To identify SSO candidates, based on large genome size and slow-growing phenotype, a series of comparative genomic analyses were performed. A total of 11,412 bacterial genomes (Table 2) were evaluated to identify three important traits: genome size, number of genes, and tRNA genes. These analyses revealed that genome size in SAOs varied between 6.2 and 1.8 Mb. On average, the Pseudomonadaceae family exhibited the largest (p < 0.05) chromosome (6.2 Mb) and Leuconostocaceae the lowest one (1.8 Mb; Figure 1A). Also, it was revealed that the number of protein coding genes varied between 5833 and 1945 in members of SAO group. On average, the Pseudomonadaceae family possessed the largest (p < 0.05) number of protein coding sequences (5833 genes) and Leuconostocaceae the shortest number (1945 genes; Figure 1B). These results suggest that members of the Pseudomonadaceae family possess an extensive genomic repertoire with potential to survive meat processing conditions, colonize muscle tissue, and extract nutrients from this complex matrix consisting of myofibers, as well as connective and adipose tissue. Therefore, Pseudomonadaceae species could represent one of the SSO in chicken meat. This idea is supported by numerous reports showing that bacterial adaptation to cold, complex, and hostile environments is driven by genome size and gene content [17], these traits provide bacteria with a wide metabolic versatility for a successful survival in hostile milieus such as temperature variations and chemical interventions as observed during the processing of chicken. Large genomes (>5500 genes) provide bacteria with large networks to regulate gene expression and rapid adaptation to diverse environmental conditions [18,29].
At the initial stage of meat storage, glucose, lactic acid, and water-soluble proteins are consumed by fast-growing members of the SAO group; therefore, SSOs initiate a slow proliferation in this nutrient-depleted milieu by extracting nutrients from muscle tissue [4,8].Interestingly, it has been shown that slow-growing bacteria possess a low number of tRNA genes in their genome [44,45]. Thus, the number of tRNA genes was analyzed in the 11 families of chicken meat SAOs. The analysis showed that this bacterial group possess an average and median of 64 and 56 tRNA genes, respectively, in their genomes [44,45]. The largest number (93 genes) was observed in the Aeromonadaceae family whereas the lowest number was found in Leuconostocaceae (46 genes). Members of the Pseudomonadaceae (56 genes), Staplylococcaceae (56 genes), Listeriaceae (54 genes), Carnobacteriaceae (53 genes), and Enterococcaceae (52 genes) families possess the second lowest number of tRNA genes (Figure 1C), suggesting that these bacterial groups possess a slow-growth rate. It has been reported that fast-growing bacteria require a large number of tRNA gene copies for rapid protein translation and multiplication. In contrast, bacteria where speed of translation is not a limiting factor, copies of tRNA genes are reduced [44,45,46]. Also, it has been proposed that a low number tRNA is an biological adaptation to success in environments with limited nutrient concentrations [46]. Taken together, these results suggests that, under these experimental conditions, members of the Pseudomonadaceae family are the most predominant group possessing an extensive genome encoding for a versatile collection of metabolic enzymes and low number of tRNA genes for a slow-growth in a hostile environment.

3.2. Isolation of SSO Candidates from Spoiled Chicken Meat

It has been reported that conventional agar media cannot allow the recovery of bacteria with a potential to cause meat spoilage [4]; thus, a novel microbiological strategy was developed. Our working hypothesis was that an extensive genome size and low tRNA copy number allow SSOs to proliferate under showed environments. Therefore, to address this goal, it is important to design bacterial culture media that are able to select psychrotrophic bacteria with large genomes. Extensive genome size allows microorganisms to succeed in cold and oligotrophic environments [47,48,49]. Based on this information, an oligotrophic medium was designed and used to recover psychrotrophic and slow-growing bacteria (~96 h incubation). Using this approach, a total of 47 bacterial isolates were recovered from spoiled chicken meat. Amplification and sequencing of the 16S rRNA gene revealed that the majority of the isolates belonged to genus Pseudomonas (43/47, 91.5%), follow by the genera Brochothrix (2/47, 4.3%), Hafnia (1/47, 2.1%), and Acinetobacter (1/47, 2.1%). These genera belonged to four families (Pseudomonadaceae, Listeriaceae, Enterobacteriaceae, and Moraxellaceae, respectively). These results indicate that members of the Pseudomonadaceae family are the most predominant group able to proliferate under stressful conditions such as psychrotrophic and oligotrophic environments, as found in meat processing conditions, and could represent one of the SSOs in chicken meat.

3.3. Identification of Slow-Growing Bacteria

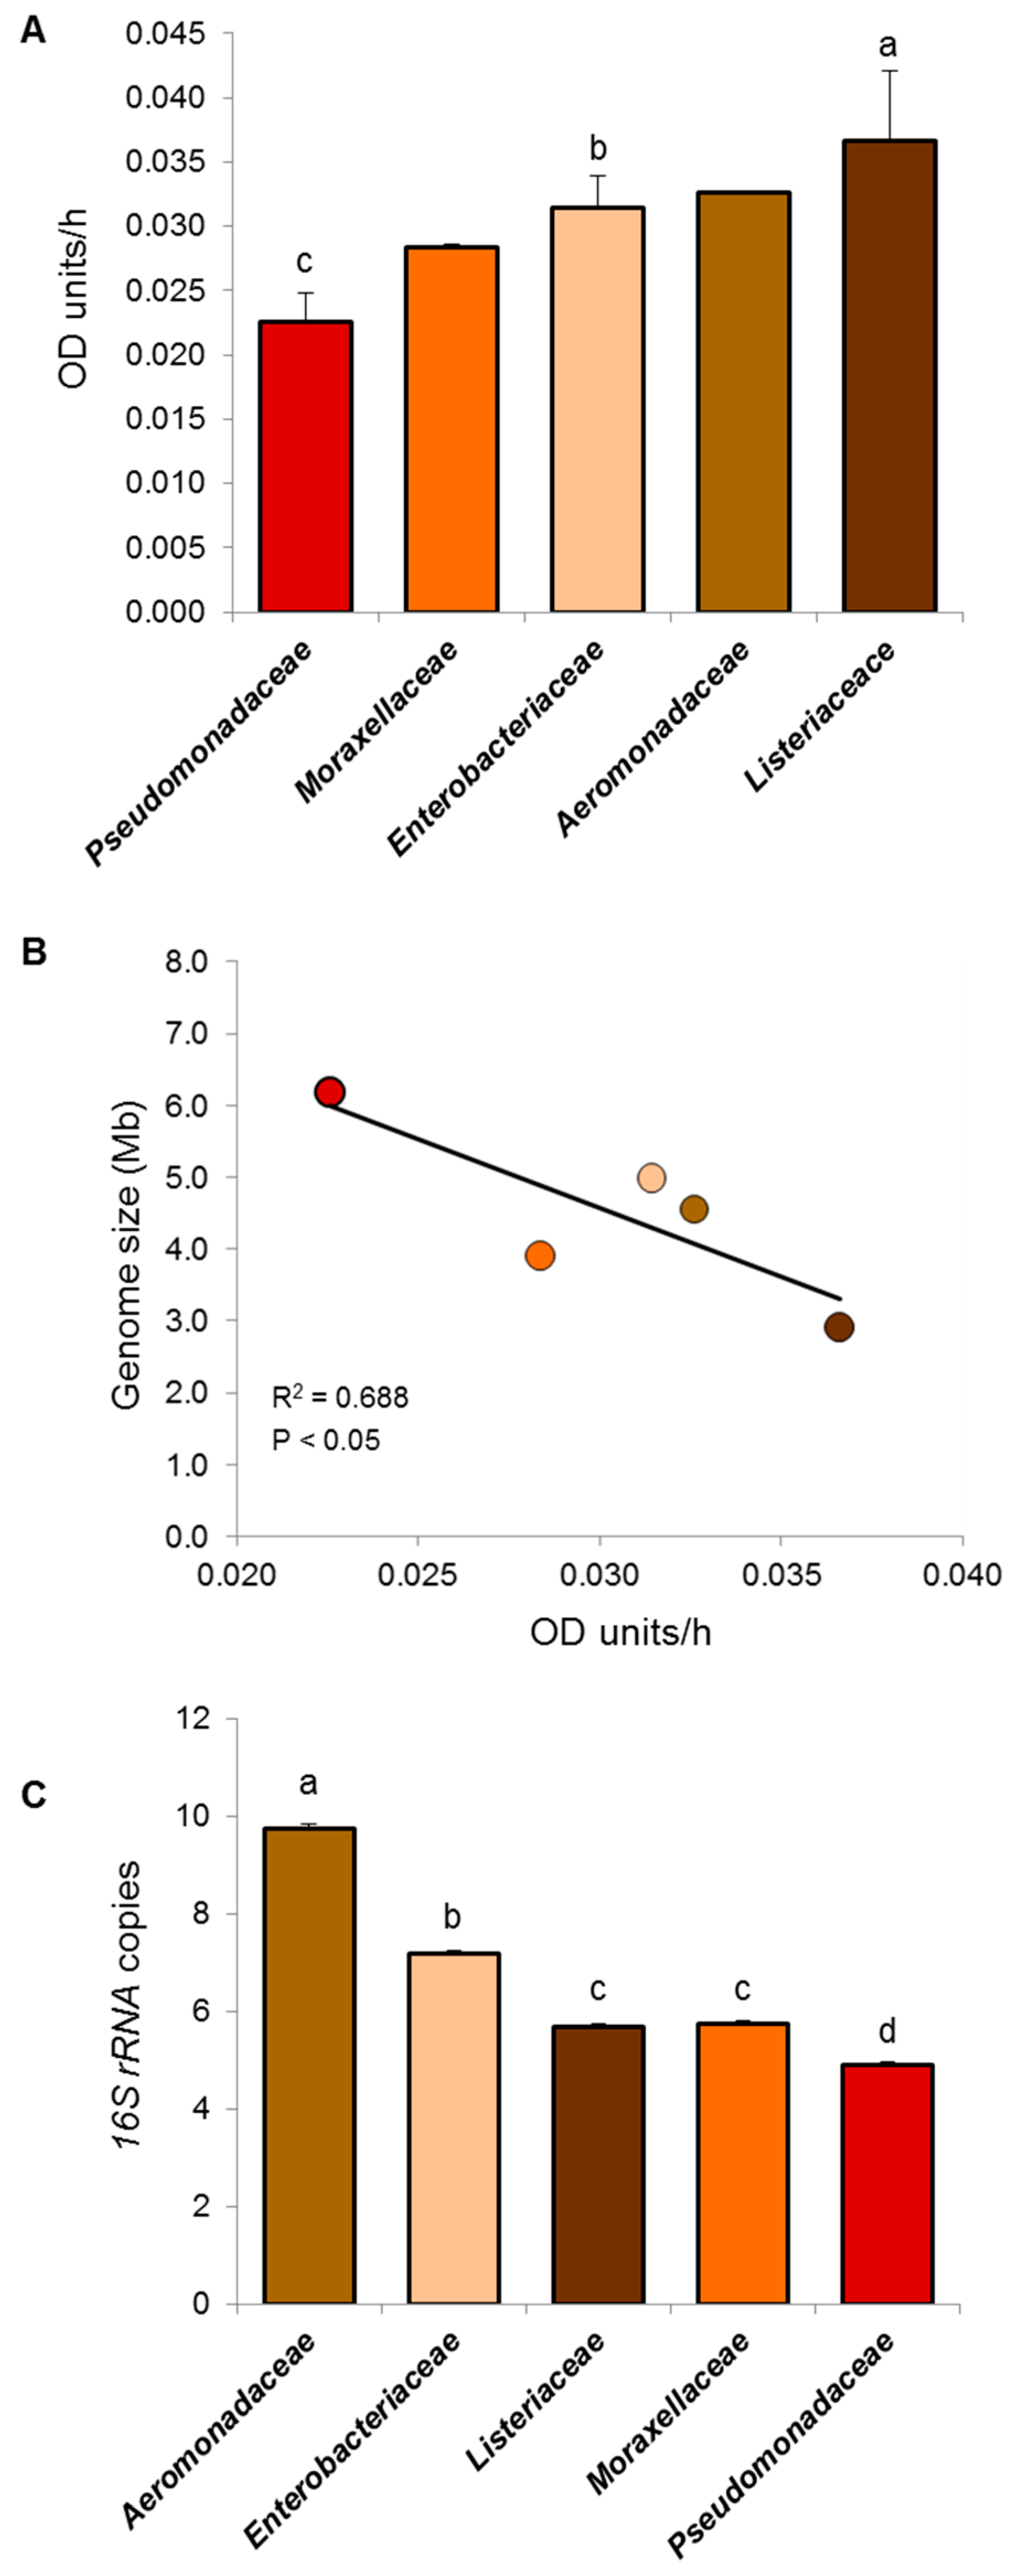
To corroborate the slow-growing phenotype of these SSO candidates, maximum growth rates were estimated using twenty-four isolates recovered from chicken meat. These isolates belonged to five different bacterial families. As expected, members of Pseudomonadaceae family showed the lowest maximum growth rate (p < 0.05), followed by members of the Moraxellaceae, Enterobacteriaceae Aeromonadaceae, and Listeriaceae families after 60 h of incubation (Figure 2A). Interestingly, maximum growth rate correlated (R = 0.688; p < 0.05) negatively with bacterial genome size (Figure 2B). Also, differences in maximum growth rates were associated with lower 16S rRNA copy numbers showing that members of Pseudomonadaceae (4.9 genes) possess the lowest (p < 0.05), number of copies followed by Listeriaceae (average = 5.7 genes), Moraxellaceae (5.8 genes), and Enterobacteriaceae (7.2 genes; Figure 2C). It has been documented that low 16S rRNA copy number represents a bacterial ecological strategy to proliferate successfully in environments with low nutrient concentrations; this molecular strategy reduces metabolic expenses because the production of ribosomes is restricted [44,50]. Taken together, these results indicate that members of the Pseudomonadaceae family have evolved numerous ecological features to proliferate in a complex matrix comprising a cold and hostile environment. Thus, it was hypothesized that this bacterial group represents one of the SSOs in chicken meat.

3.4. Proof-of-Concept: Validation of SSO Potential

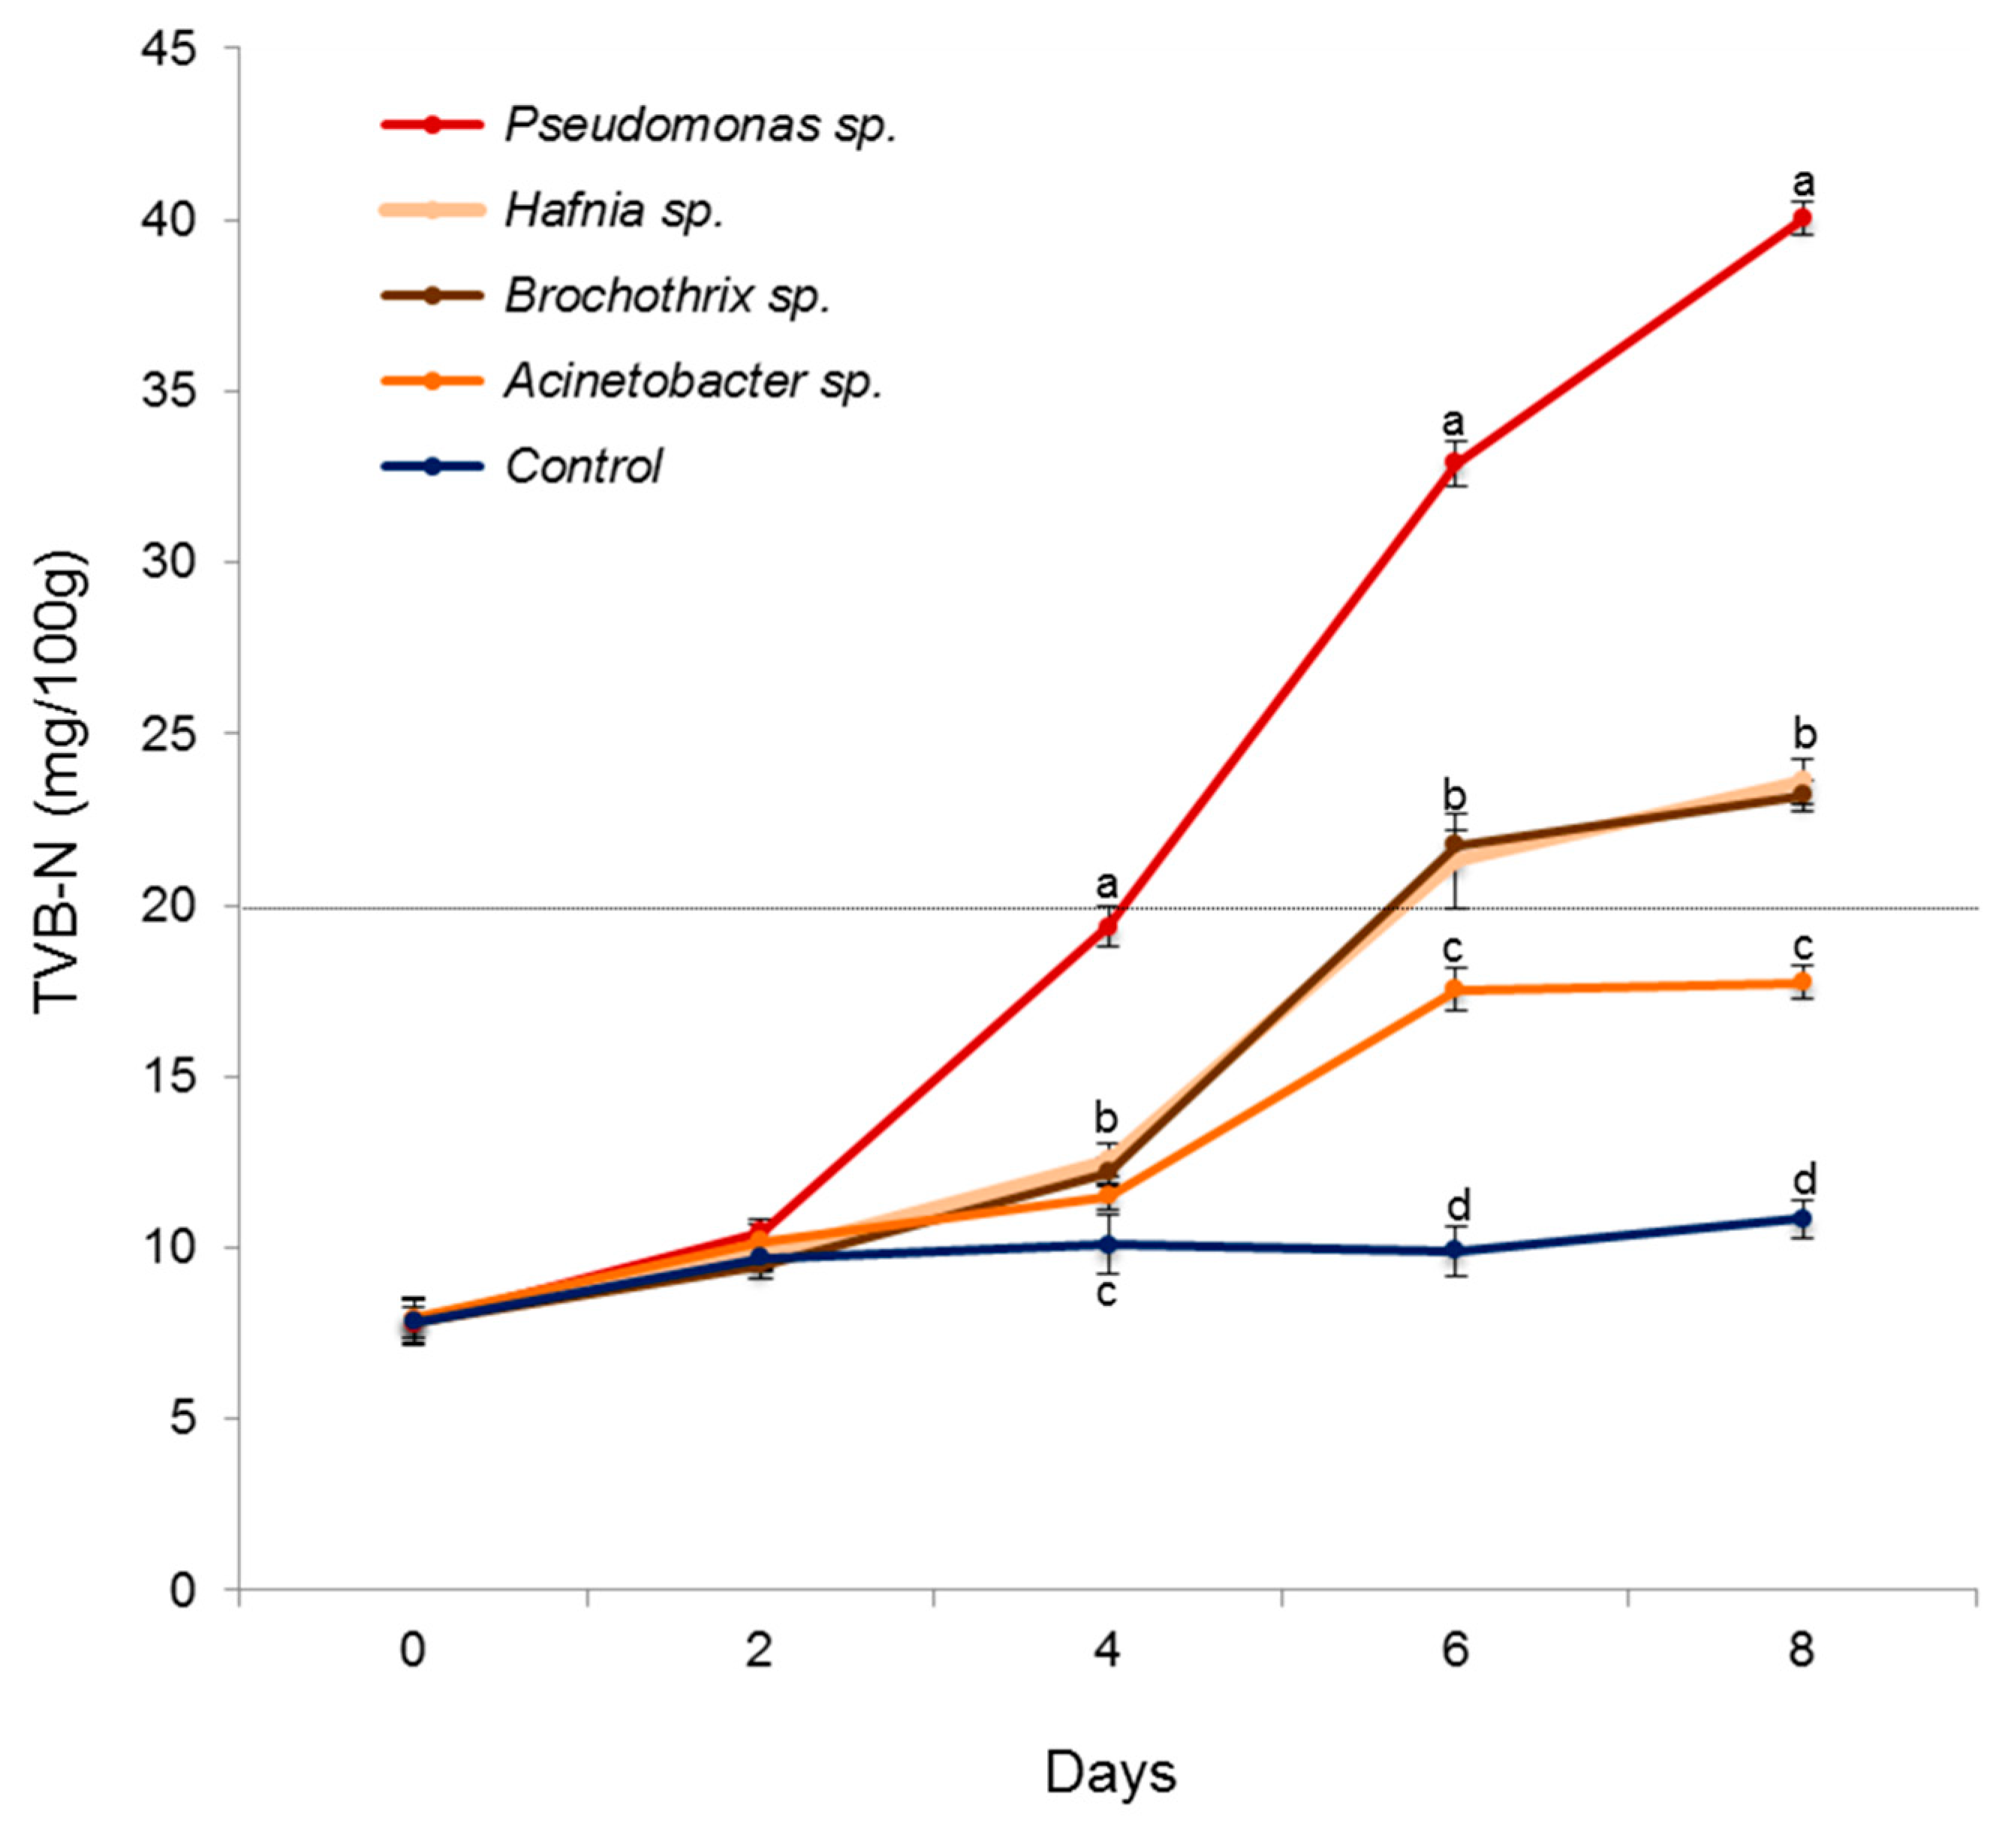
To validate the hypothesis that psychrotrophic, oligotrophic and slow-growing Pseudomonadaceae isolates could represent one of the SSOs in chicken meat, inoculation experiments were carried out. Fresh and decontaminated chicken meat samples were inoculated with representative isolates of Pseudomonadaceae, Listeriaceae, Enterobacteriaceae, and Moraxellaceae families, and stored under commercial conditions (4 °C) for a total time period of 8 days. Meat spoilage was assessed by means of TVB-N concentrations, as it is considered one of the main chemical parameters associated to microbial spoilage in chicken meat [5,30]. Remarkably, Pseudomonas sp. induced meat spoilage (≥20 mg TVB-N/100g [5]) just after 4 days of storage (Figure 3). Production of TVB-N initiated on day 2 (10.4 mg TVB-N/100g) and increased gradually to reach the highest (p < 0.05) concentrations (40.0 mg TVB-N/100g) on day 6 of storage. Inoculation with Brochothrix sp. and Hafnia sp. caused meat spoilage on day 6 of storage; however, TVB-N production reached a plateau phase after this point. In contrast, Acinetobacter sp. did not generated meat spoilage as determined by TVB-N levels (Figure 3). These results represent a proof-of-concept indicating that members of the Pseudomonadaceae family could be considered one of the SSOs in chicken meat. This idea is supported by an independent study showing that Pseudomonas fragi or fluorecens are the main spoilage microorganisms when inoculated in fresh meat [30]. Also, numerous studies have indirectly linked the increase in Pseudomonadaceae density during storage to meat deterioration, suggesting that colonization and proliferation by this bacterial group could be the main cause of poultry meat spoilage under aerobic conditions [30,37,39,40].

4. Conclusions

The present study provides new insights into the identification of bacteria responsible for meat spoilage. Supported by comparative genomic analyses, we identified that SSOs have evolved numerous ecological features to proliferate in a cold and hostile environment, such as poultry meat. These characteristics involve acquisition of an extensive genome size directed to successfully survive in a psychrotrophic and oligotrophic environment; traits found in members of the Pseudomonadaceae family. Further studies need to be implemented to elucidate the impact of these potential SSOs on meat quality and microbiota diversity. This information is essential to establish new strategies to reduce meat spoilage.

Author Contributions

C.E.S.-G., P.C.-S., E.M.M.S., C.Z.A., and G.M.N. conceptualized the study; C.E.S.-G., P.C.-S., and G.M.N. preformed experiments and analyzed the data; C.E.S.-G., P.C.-S., E.M.M.S., C.Z.A., and G.M.N. interpreted results, as well as wrote and revised the manuscript. All authors have read and agreed to the published version of the manuscript.

Funding

This research received no external funding.

Acknowledgments

We thank CONACYT-Mexico for the graduate scholarship granted to CESG.

Conflicts of Interest

The authors declare no conflict of interest.

References

  1. Rouger, A.; Tresse, O.; Zagorec, M. Bacterial Contaminants of Poultry Meat: Sources, Species, and Dynamics. Microorganisms 2017, 5, 50. [Google Scholar] [CrossRef] [PubMed]
  2. Slader, J.; Domingue, G.; Jørgensen, F.; McAlpine, K.; Owen, R.J.; Bolton, F.J.; Humphrey, T.J. Impact of transport crate reuse and of catching and processing on Campylobacter and Salmonella contamination of broiler chickens. Appl. Environ. Microbiol. 2002, 68, 713–719. [Google Scholar] [CrossRef] [PubMed] [Green Version]
  3. Remenant, B.; Jaffrès, E.; Dousset, X.; Pilet, M.-F.; Zagorec, M. Bacterial spoilers of food: behavior, fitness and functional properties. Food Microbiol. 2015, 45, 45–53. [Google Scholar] [CrossRef]
  4. Boziaris, I.S.; Parlapani, F.F. Specific Spoilage Organisms (SSOs) in Fish. In The Microbiological Quality of Food; Elsevier: Amsterdam, The Netherlands, 2017; pp. 61–98. ISBN 978-0-08-100502-6. [Google Scholar]
  5. Zhang, Q.Q.; Han, Y.Q.; Cao, J.X.; Xu, X.L.; Zhou, G.H.; Zhang, W.Y. The spoilage of air-packaged broiler meat during storage at normal and fluctuating storage temperatures. Poult. Sci. 2012, 91, 208–214. [Google Scholar] [CrossRef]
  6. Cesare, A.D.; Palma, F.; Lucchi, A.; Pasquali, F.; Manfreda, G. Microbiological profile of chicken carcasses: A comparative analysis using shotgun metagenomic sequencing. Ital. J. Food Saf. 2018, 7, 6923. [Google Scholar] [CrossRef] [Green Version]
  7. Gram, L.; Ravn, L.; Rasch, M.; Bruhn, J.B.; Christensen, A.B.; Givskov, M. Food spoilage—interactions between food spoilage bacteria. Int. J. Food Microbiol. 2002, 78, 79–97. [Google Scholar] [CrossRef]
  8. Ammor, M.S.; Michaelidis, C.; Nychas, G.-J.E. Insights into the Role of Quorum Sensing in Food Spoilage. J. Food Prot. 2008, 71, 1510–1525. [Google Scholar] [CrossRef]
  9. Doulgeraki, A.I.; Ercolini, D.; Villani, F.; Nychas, G.-J.E. Spoilage microbiota associated to the storage of raw meat in different conditions. Int. J. Food Microbiol. 2012, 157, 130–141. [Google Scholar] [CrossRef]
  10. Broekaert, K.; Heyndrickx, M.; Herman, L.; Devlieghere, F.; Vlaemynck, G. Seafood quality analysis: Molecular identification of dominant microbiota after ice storage on several general growth media. Food Microbiol. 2011, 28, 1162–1169. [Google Scholar] [CrossRef]
  11. Shelef, L.A. Effect of glucose on the bacterial spoilage of beef. J. Food Sci. 1977, 42, 1172–1175. [Google Scholar] [CrossRef]
  12. Gill, C.O. Substrate limitation of bacterial growth at meat surfaces. J. Appl. Bacteriol. 1976, 41, 401–410. [Google Scholar] [CrossRef] [PubMed]
  13. Gill, C.O. Meat Spoilage and Evaluation of the Potential Storage Life of Fresh Meat. J. Food Prot. 1983, 46, 444–452. [Google Scholar] [CrossRef]
  14. Gill, C.O.; Badoni, M. Recovery of bacteria from poultry carcasses by rinsing, swabbing or excision of skin. Food Microbiol. 2005, 22, 101–107. [Google Scholar] [CrossRef]
  15. Gill, C.O.; Newton, K.G. Development of bacterial spoilage at adipose tissue surfaces of fresh meat. Appl. Environ. Microbiol. 1980, 39, 1076–1077. [Google Scholar] [CrossRef] [Green Version]
  16. Wickramasinghe, N.N.; Ravensdale, J.; Coorey, R.; Chandry, S.P.; Dykes, G.A. The Predominance of Psychrotrophic Pseudomonads on Aerobically Stored Chilled Red Meat. Compr. Rev. Food Sci. Food Saf. 2019, 18, 1622–1635. [Google Scholar] [CrossRef] [Green Version]
  17. Stover, C.K.; Pham, X.Q.; Erwin, A.L.; Mizoguchi, S.D.; Warrener, P.; Hickey, M.J.; Brinkman, F.S.L.; Hufnagle, W.O.; Kowalik, D.J.; Lagrou, M.; et al. Complete genome sequence of Pseudomonas aeruginosa PAO1, an opportunistic pathogen. Nature 2000, 406, 959–964. [Google Scholar] [CrossRef]
  18. Konstantinidis, K.T.; Tiedje, J.M. Trends between gene content and genome size in prokaryotic species with larger genomes. Proc. Natl. Acad. Sci. USA 2004, 101, 3160–3165. [Google Scholar] [CrossRef] [Green Version]
  19. Cole, J.R.; Wang, Q.; Fish, J.A.; Chai, B.; McGarrell, D.M.; Sun, Y.; Brown, C.T.; Porras-Alfaro, A.; Kuske, C.R.; Tiedje, J.M. Ribosomal Database Project: data and tools for high throughput rRNA analysis. Nucleic Acids Res. 2014, 42, D633–D642. [Google Scholar] [CrossRef] [Green Version]
  20. Chen, I.-M.A.; Chu, K.; Palaniappan, K.; Pillay, M.; Ratner, A.; Huang, J.; Huntemann, M.; Varghese, N.; White, J.R.; Seshadri, R.; et al. IMG/M v.5.0: an integrated data management and comparative analysis system for microbial genomes and microbiomes. Nucleic Acids Res. 2019, 47, D666–D677. [Google Scholar] [CrossRef]
  21. Frank, J.A.; Reich, C.I.; Sharma, S.; Weisbaum, J.S.; Wilson, B.A.; Olsen, G.J. Critical evaluation of two primers commonly used for amplification of bacterial 16S rRNA genes. Appl. Environ. Microbiol. 2008, 74, 2461–2470. [Google Scholar] [CrossRef] [Green Version]
  22. Tamura, K.; Stecher, G.; Peterson, D.; Filipski, A.; Kumar, S. MEGA6: Molecular Evolutionary Genetics Analysis Version 6.0. Mol. Biol. Evol. 2013, 30, 2725–2729. [Google Scholar] [CrossRef] [PubMed] [Green Version]
  23. Baranyi, J.; Tamplin, M.L. ComBase: a common database on microbial responses to food environments. J. Food Prot. 2004, 67, 1967–1971. [Google Scholar] [CrossRef]
  24. Baranyi, J.; Roberts, T.A. A dynamic approach to predicting bacterial growth in food. Int. J. Food Microbiol. 1994, 23, 277–294. [Google Scholar] [CrossRef]
  25. Stoddard, S.F.; Smith, B.J.; Hein, R.; Roller, B.R.K.; Schmidt, T.M. rrnDB: improved tools for interpreting rRNA gene abundance in bacteria and archaea and a new foundation for future development. Nucleic Acids Res. 2015, 43, D593–D598. [Google Scholar] [CrossRef] [PubMed] [Green Version]
  26. Signorini, M.; Ponce-Alquicira, E.; Guerrero-Legarreta, I. Proteolytic and Lipolytic Changes in Beef Inoculated with Spoilage Microorganisms and Bioprotective Lactic Acid Bacteria. Int. J. Food Prop. 2003, 6, 147–163. [Google Scholar] [CrossRef]
  27. Ercolini, D.; Casaburi, A.; Nasi, A.; Ferrocino, I.; Di Monaco, R.; Ferranti, P.; Mauriello, G.; Villani, F. Different molecular types of Pseudomonas fragi have the same overall behaviour as meat spoilers. Int. J. Food Microbiol. 2010, 142, 120–131. [Google Scholar] [CrossRef]
  28. Hwang, K.-E.; Choi, Y.-S.; Kim, H.-W.; Choi, M.-S.; Song, D.-H.; Kim, Y.-J.; Ham, Y.-K.; Kim, C.-J. Combined Effects of Mugwort Herb and Vitamin C on Shelf-Life of Vacuum-Packed Seasoned Pork. Korean J. Food Sci. Anim. Resour. 2015, 35, 421–430. [Google Scholar] [CrossRef] [Green Version]
  29. Stanborough, T.; Fegan, N.; Powell, S.M.; Singh, T.; Tamplin, M.; Chandry, P.S. Genomic and metabolic characterization of spoilage-associated Pseudomonas species. Int. J. Food Microbiol. 2018, 268, 61–72. [Google Scholar] [CrossRef]
  30. Wang, G.; Wang, H.; Han, Y.; Xing, T.; Ye, K.; Xu, X.; Zhou, G. Evaluation of the spoilage potential of bacteria isolated from chilled chicken in vitro and in situ. Food Microbiol. 2017, 63, 139–146. [Google Scholar] [CrossRef]
  31. Casaburi, A.; Piombino, P.; Nychas, G.-J.; Villani, F.; Ercolini, D. Bacterial populations and the volatilome associated to meat spoilage. Food Microbiol. 2015, 45, 83–102. [Google Scholar] [CrossRef]
  32. Russell, S.M.; Fletcher, D.L.; Cox, N.A. Spoilage Bacteria of Fresh Broiler Chicken Carcasses. Poult. Sci. 1995, 74, 2041–2047. [Google Scholar] [CrossRef]
  33. Hinton, A.; Cason, J.A.; Ingram, K.D. Tracking spoilage bacteria in commercial poultry processing and refrigerated storage of poultry carcasses. Int. J. Food Microbiol. 2004, 91, 155–165. [Google Scholar] [CrossRef]
  34. Herbert, U.; Rossaint, S.; Khanna, M.-A.; Kreyenschmidt, J. Comparison of argon-based and nitrogen-based modified atmosphere packaging on bacterial growth and product quality of chicken breast fillets. Poult. Sci. 2013, 92, 1348–1356. [Google Scholar] [CrossRef]
  35. Ellis, D.I.; Broadhurst, D.; Kell, D.B.; Rowland, J.J.; Goodacre, R. Rapid and Quantitative Detection of the Microbial Spoilage of Meat by Fourier Transform Infrared Spectroscopy and Machine Learning. Appl. Environ. Microbiol. 2002, 68, 2822–2828. [Google Scholar] [CrossRef] [Green Version]
  36. Sahar, A.; Dufour, é. Use of Fourier transform-infrared spectroscopy to predict spoilage bacteria on aerobically stored chicken breast fillets. LWT Food Sci. Technol. 2014, 56, 315–320. [Google Scholar] [CrossRef]
  37. Rukchon, C.; Nopwinyuwong, A.; Trevanich, S.; Jinkarn, T.; Suppakul, P. Development of a food spoilage indicator for monitoring freshness of skinless chicken breast. Talanta 2014, 130, 547–554. [Google Scholar] [CrossRef]
  38. Morales, P.A.; Aguirre, J.S.; Troncoso, M.R.; Figueroa, G.O. Phenotypic and genotypic characterization of Pseudomonas spp. present in spoiled poultry fillets sold in retail settings. LWT 2016, 73, 609–614. [Google Scholar] [CrossRef]
  39. Jiménez, S.M.; Salsi, M.S.; Tiburzi, M.C.; Rafaghelli, R.C.; Tessi, M.A.; Coutaz, V.R. Spoilage microflora in fresh chicken breast stored at 4 degrees C: influence of packaging methods. J. Appl. Microbiol. 1997, 83, 613–618. [Google Scholar] [CrossRef] [PubMed]
  40. Balamatsia, C.C.; Paleologos, E.K.; Kontominas, M.G.; Savvaidis, I.N. Correlation between microbial flora, sensory changes and biogenic amines formation in fresh chicken meat stored aerobically or under modified atmosphere packaging at 4 degrees C: possible role of biogenic amines as spoilage indicators. Antonie Van Leeuwenhoek 2006, 89, 9–17. [Google Scholar] [CrossRef]
  41. Mellor, G.E.; Bentley, J.A.; Dykes, G.A. Evidence for a role of biosurfactants produced by Pseudomonas fluorescens in the spoilage of fresh aerobically stored chicken meat. Food Microbiol. 2011, 28, 1101–1104. [Google Scholar] [CrossRef] [PubMed]
  42. Charles, N.; Williams, S.K.; Rodrick, G.E. Effects of packaging systems on the natural microflora and acceptability of chicken breast meat. Poult. Sci. 2006, 85, 1798–1801. [Google Scholar] [CrossRef] [PubMed]
  43. Rossaint, S.; Klausmann, S.; Kreyenschmidt, J. Effect of high-oxygen and oxygen-free modified atmosphere packaging on the spoilage process of poultry breast fillets. Poult. Sci. 2015, 94, 96–103. [Google Scholar] [CrossRef] [PubMed]
  44. Higgs, P.G.; Ran, W. Coevolution of Codon Usage and tRNA Genes Leads to Alternative Stable States of Biased Codon Usage. Mol. Biol. Evol. 2008, 25, 2279–2291. [Google Scholar] [CrossRef] [Green Version]
  45. Rocha, E.P.C. Codon usage bias from tRNA’s point of view: Redundancy, specialization, and efficient decoding for translation optimization. Genome. Res. 2004, 14, 2279–2286. [Google Scholar] [CrossRef] [Green Version]
  46. Dai, X.; Zhu, M.; Warren, M.; Balakrishnan, R.; Patsalo, V.; Okano, H.; Williamson, J.R.; Fredrick, K.; Wang, Y.-P.; Hwa, T. Reduction of translating ribosomes enables Escherichia coli to maintain elongation rates during slow growth. Nat. Microbiol. 2016, 2, 16231. [Google Scholar] [CrossRef] [Green Version]
  47. Goordial, J.; Raymond-Bouchard, I.; Zolotarov, Y.; de Bethencourt, L.; Ronholm, J.; Shapiro, N.; Woyke, T.; Stromvik, M.; Greer, C.W.; Bakermans, C.; et al. Cold adaptive traits revealed by comparative genomic analysis of the eurypsychrophile Rhodococcus sp. JG3 isolated from high elevation McMurdo Dry Valley permafrost, Antarctica. FEMS Microbiol. Ecol. 2016, 92. [Google Scholar] [CrossRef] [Green Version]
  48. Tang, J.; Du, L.-M.; Liang, Y.-M.; Daroch, M. Complete Genome Sequence and Comparative Analysis of Synechococcus sp. CS-601 (SynAce01), a Cold-Adapted Cyanobacterium from an Oligotrophic Antarctic Habitat. Int. J. Mol. Sci. 2019, 20, 152. [Google Scholar] [CrossRef] [Green Version]
  49. Klappenbach, J.A.; Dunbar, J.M.; Schmidt, T.M. rRNA operon copy number reflects ecological strategies of bacteria. Appl. Environ. Microbiol. 2000, 66, 1328–1333. [Google Scholar] [CrossRef] [Green Version]
  50. Zhu, M.; Dai, X. On the intrinsic constraint of bacterial growth rate: M. tuberculosis’s view of the protein translation capacity. Crit. Rev. Microbiol. 2018, 44, 455–464. [Google Scholar] [CrossRef]
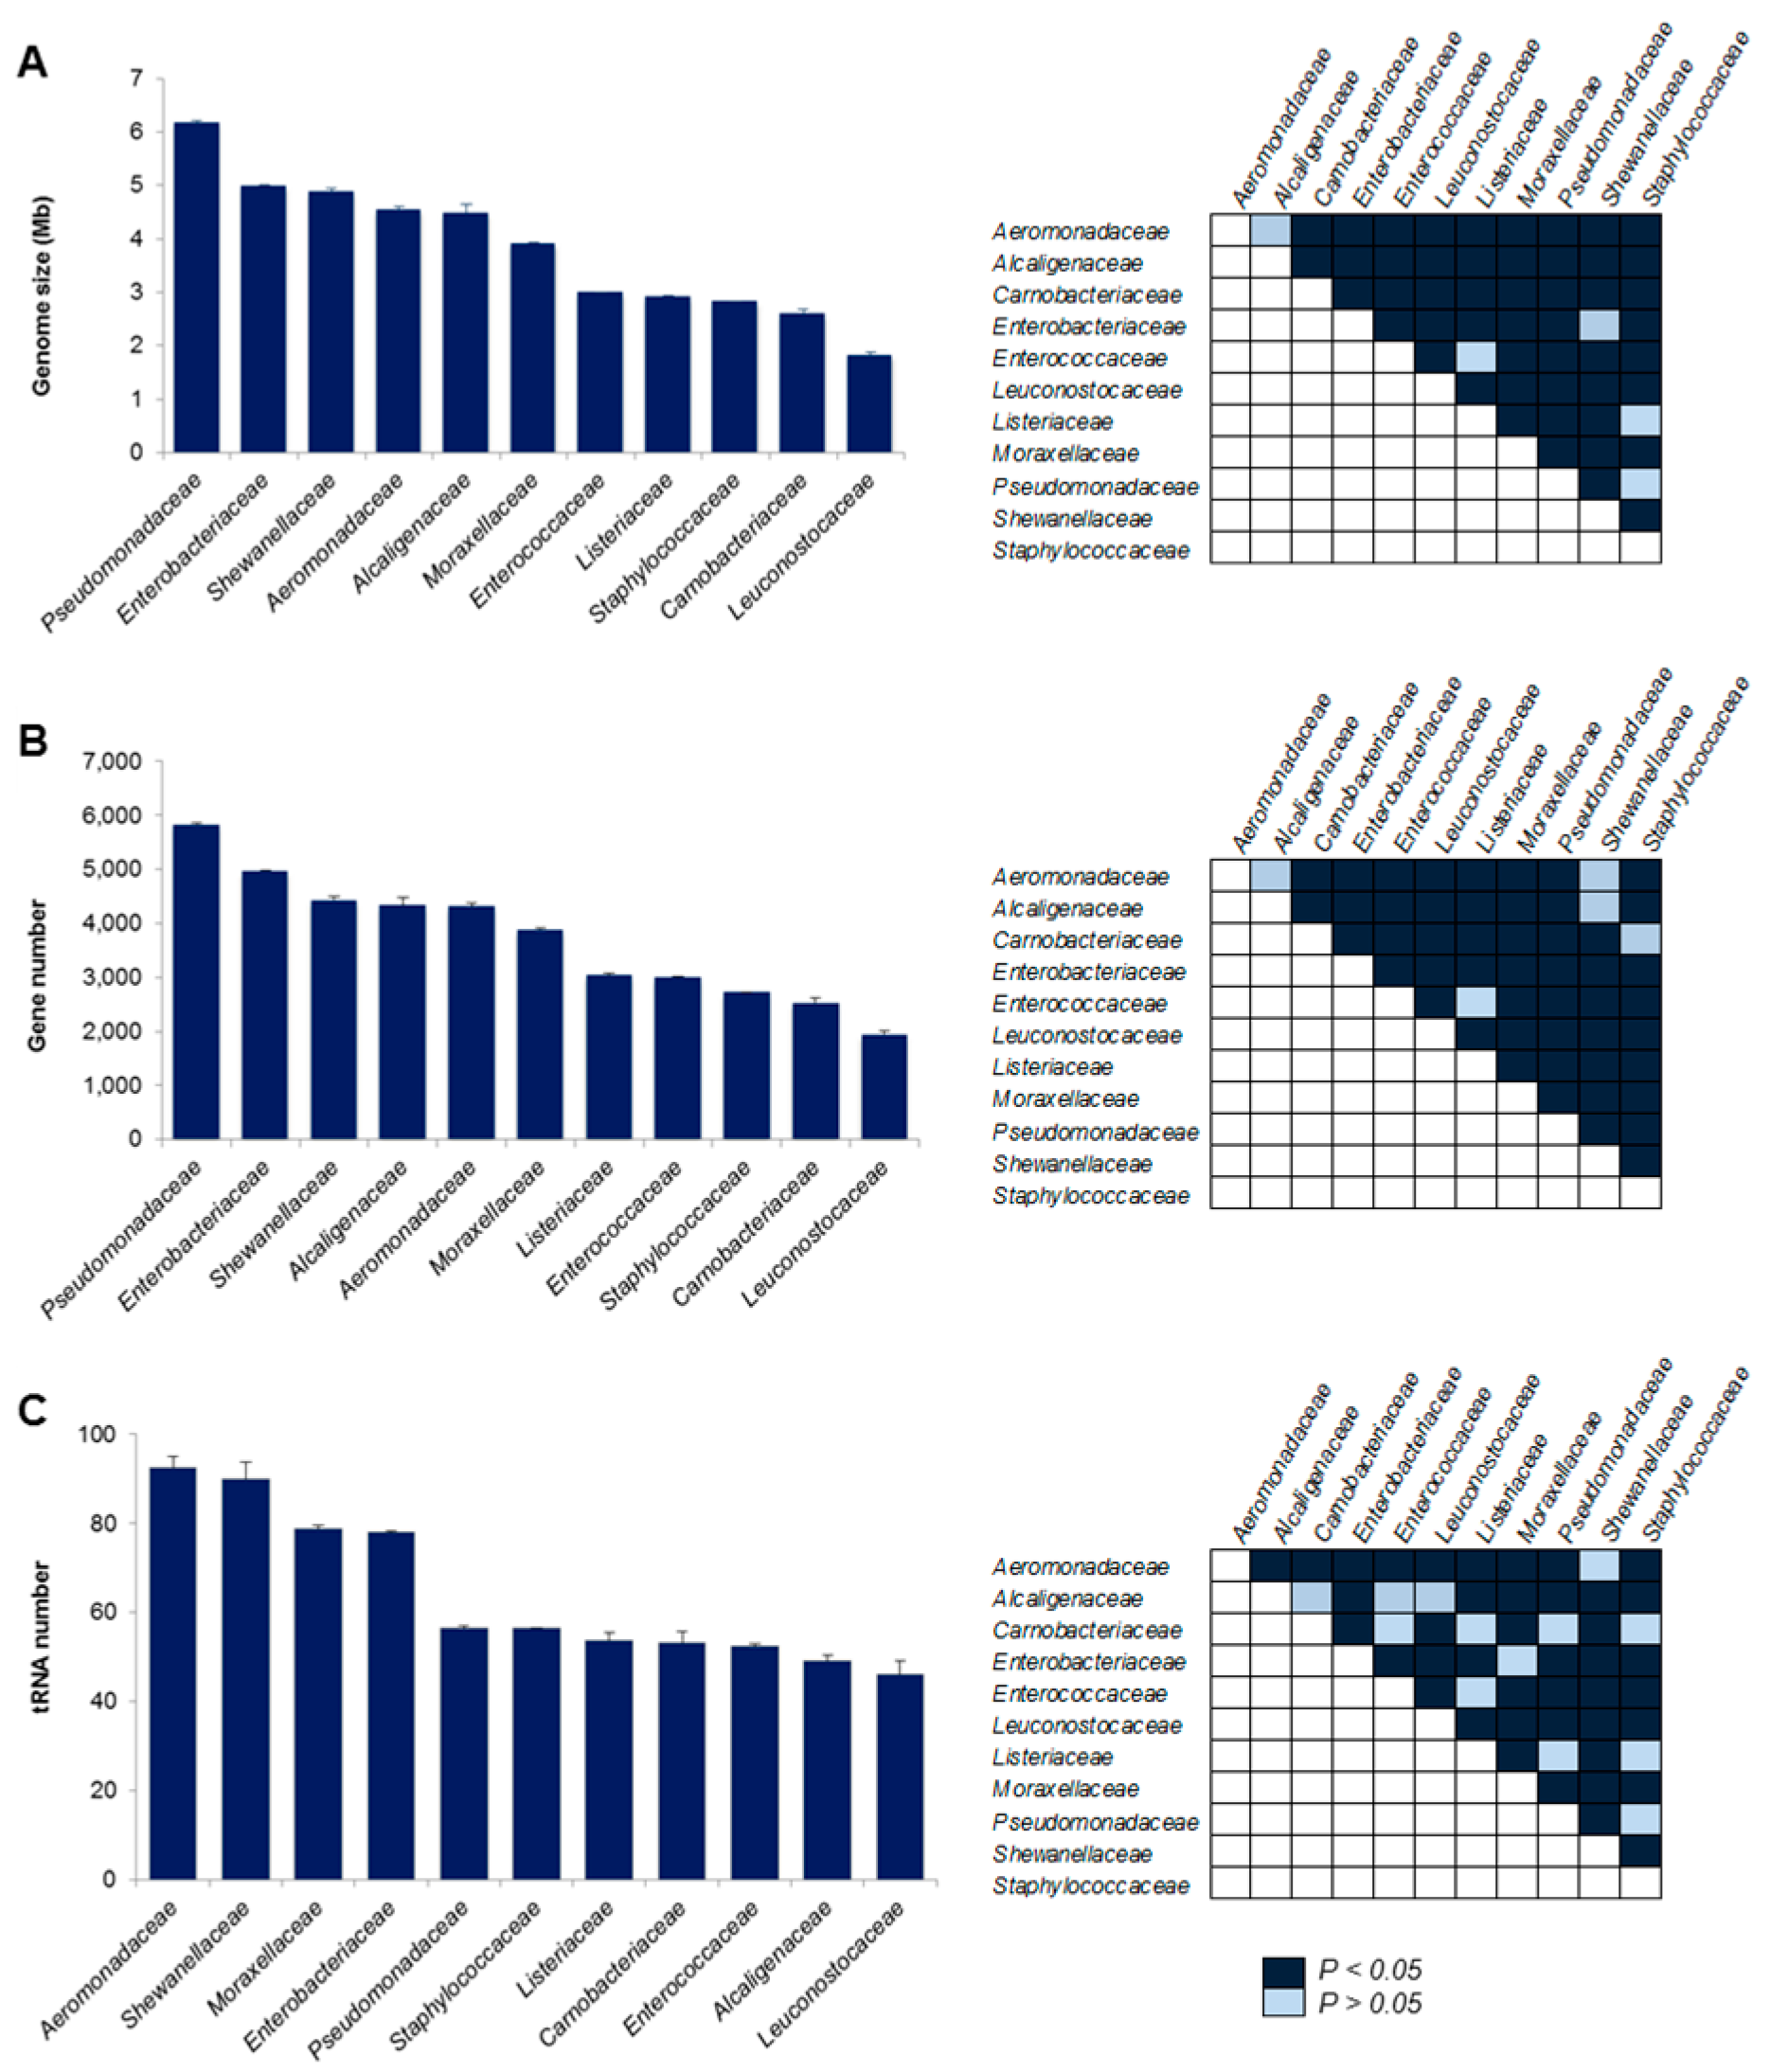
Figure 1. Genomic analyses of bacterial groups associated with spoilage in chicken meat. A total of 11,412 bacterial genomes comprising 11 bacterial families were analyzed to estimate (A) genome size, (B) number of genes, and (C) number of tRNA genes. (Left) Graphs depict mean values and its standard errors. (Right) Pairwise matrix showing p values estimated by means of ANOVA Fisher’s protected least significant difference test.
Foods 09 00225 g001
Figure 2. Growth phenotype and genotype of candidate Specific Spoilage Organism (SSO) obtained from spoiled chicken meat. (A) Maximum growth rates estimated with DMFit software and Baranyi and Roberts model. Two independent experiments were performed, each carried out in triplicate. Statistical assessment was performed only for bacterial families with >3 isolates. (B) Pearson correlation coefficient (R2) between genome size and maximum growth rate. Circle color coding as in panels A and C. OD: optical density. (C) 16S rRNA copy number. Graphs depict mean values and its standard errors. Different letters are significantly different (p < 0.05). Statistical analysis was performed by means of ANOVA Fisher’s protected least significant difference test.
Foods 09 00225 g002
Figure 3. Spoilage potential of SSO candidates obtained from spoiled chicken meat. Fresh decontaminated meat samples were inoculated (~4.0 log CFU/g) with either Pseudomonas sp., Brochothrix sp., Hafnia sp., Acinetobacter sp., or sterile saline solution (negative control) and stored at 4 °C across 8 days. Total volatile basic nitrogen (TVB-N) >20 mg/100 g (pointed gray line) was used as an indicator of meat spoilage. Graph depicts mean values and their standard errors from three independent experiments. Different letters are significantly different (p < 0.05). Statistical analysis was performed by means of ANOVA Fisher’s protected least significant difference test.
Foods 09 00225 g003
Table 1. List of bacterial groups associated to chicken meat spoilage.
GenusFamilyReference *
AeromonasAeromonadaceae[1,5,30]
AlcaligenesAlcaligenaceae[1,5,31]
CarnobacteriumCarnobacteriaceae[5,31,32]
LeclerciaHafniaEnterobacteriaceae[1,5,33,34]
EnterococcusEnterococcaceae[1,5,31,34,35,36]
BrochothrixListeriaceae[1,5,32,37]
LeuconostocWeisellaLeuconostocaceae[1,5]
PsychrobacterAcinetobacterMoraxellaceae[1,5,31,35]
PseudomonasPseudomonadaceae[1,5,9,27,30,31,32,37,38,39,40,41]
ShewanellaShewanellaceae[1,5,32,42,43]
StaphylococcusStaphylococcaceae[5,9,33,42]
* A comprehensive revision of literature was performed using three renowned databases (PubMed, Google Scholar, and Science Direct), covering a time period from 1996 to 2018.
Table 2. Number of genomes analyzed for each bacterial family associated to chicken meat spoilage.
FamilyNumber of Genomes
Aeromonadaceae58
Alcaligenaceae91
Carnobacteriaceae42
Enterobacteriaceae3962
Enterococcaceae714
Leuconostocaceae67
Listeriaceae116
Moraxellaceae1044
Pseudomonadaceae855
Shewanellaceae44
Staphylococcaceae4419
Total11,412