Nutritional, Antioxidant, Antimicrobial, and Toxicological Profile of Two Innovative Types of Vegan, Sugar-Free Chocolate

 ,
, 
 ,
, 
 , ,
, ,  ,
,  and
and 
Abstract
1. Introduction
2. Materials and Methods
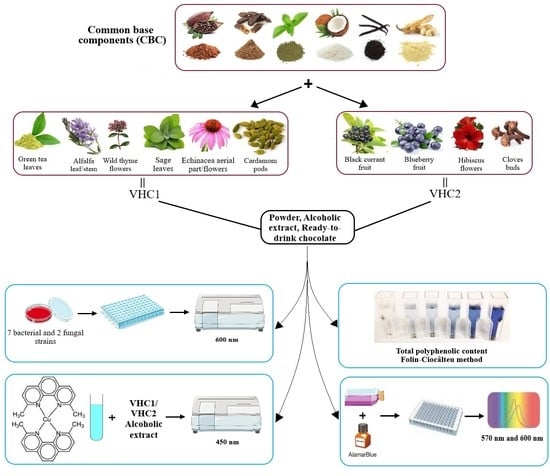
2.1. Preparation of the Hot Chocolate Products
2.2. Assessment of the Total Polyphenolic Content by the Folin-Ciocâlteu Method
2.3. Assessment of Individual Polyphenols by Liquid Chromatography
2.4. Assessment of the Antioxidant Capacity (AC) by Cupric Reducing Antioxidant Capacity Assay (CUPRAC)
2.5. Assessment of Proximate Composition, Nutritional Profile, and Energy Value
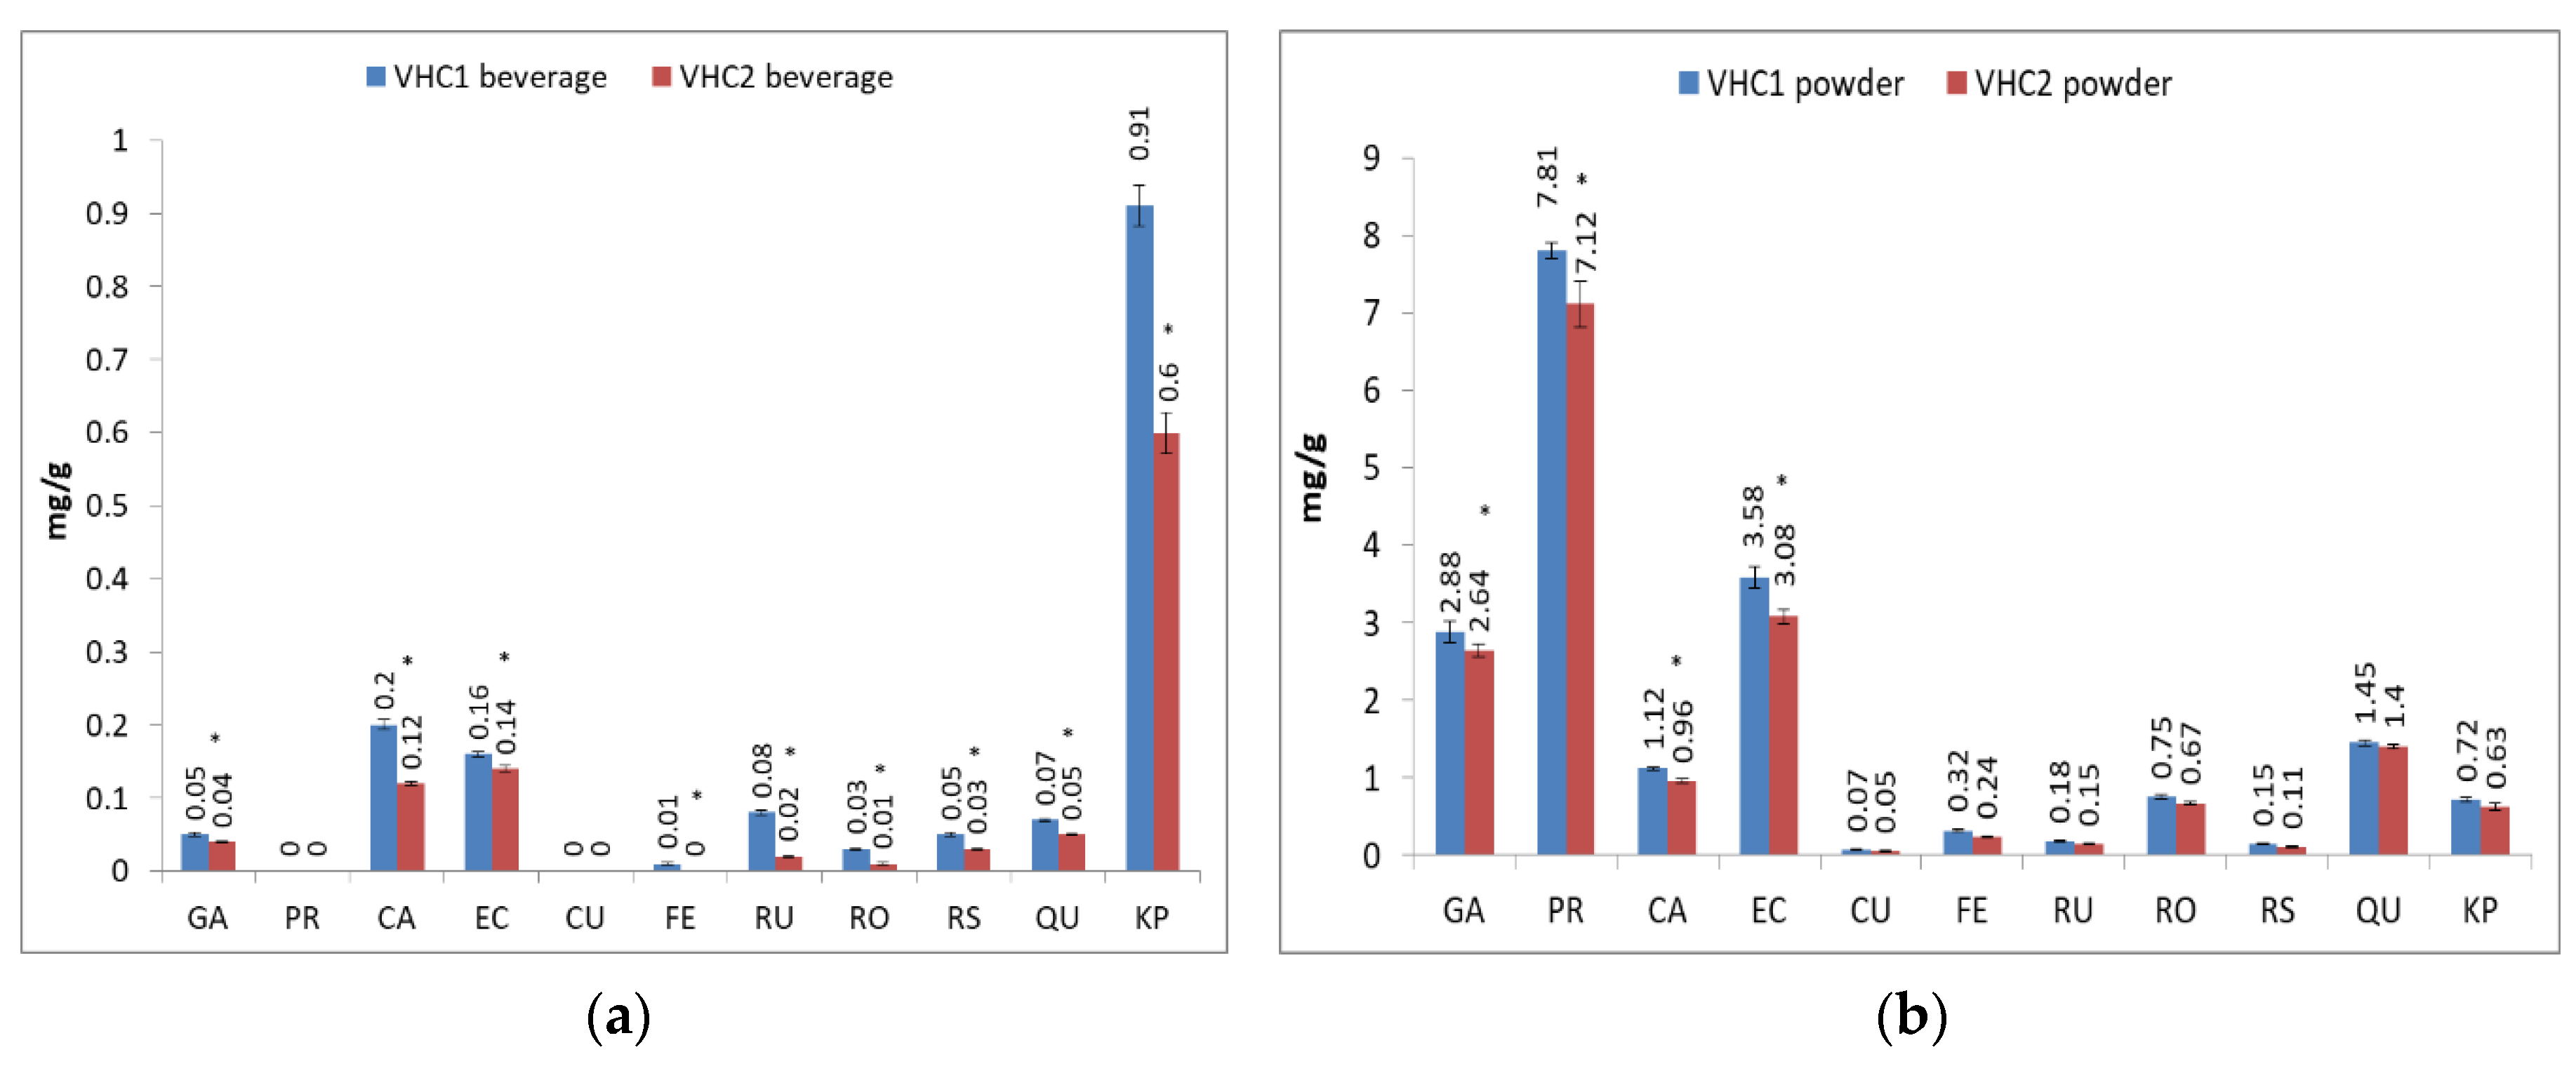
2.6. Assessment of Antimicrobial Activity
2.7. In Vitro Toxicity Assay
2.7.1. Cultivation of Cell Lines
2.7.2. Alamar Blue Assay for Cellular Viability
2.8. Sensory Evaluation
2.9. Statistical Analysis
3. Results and Discussion
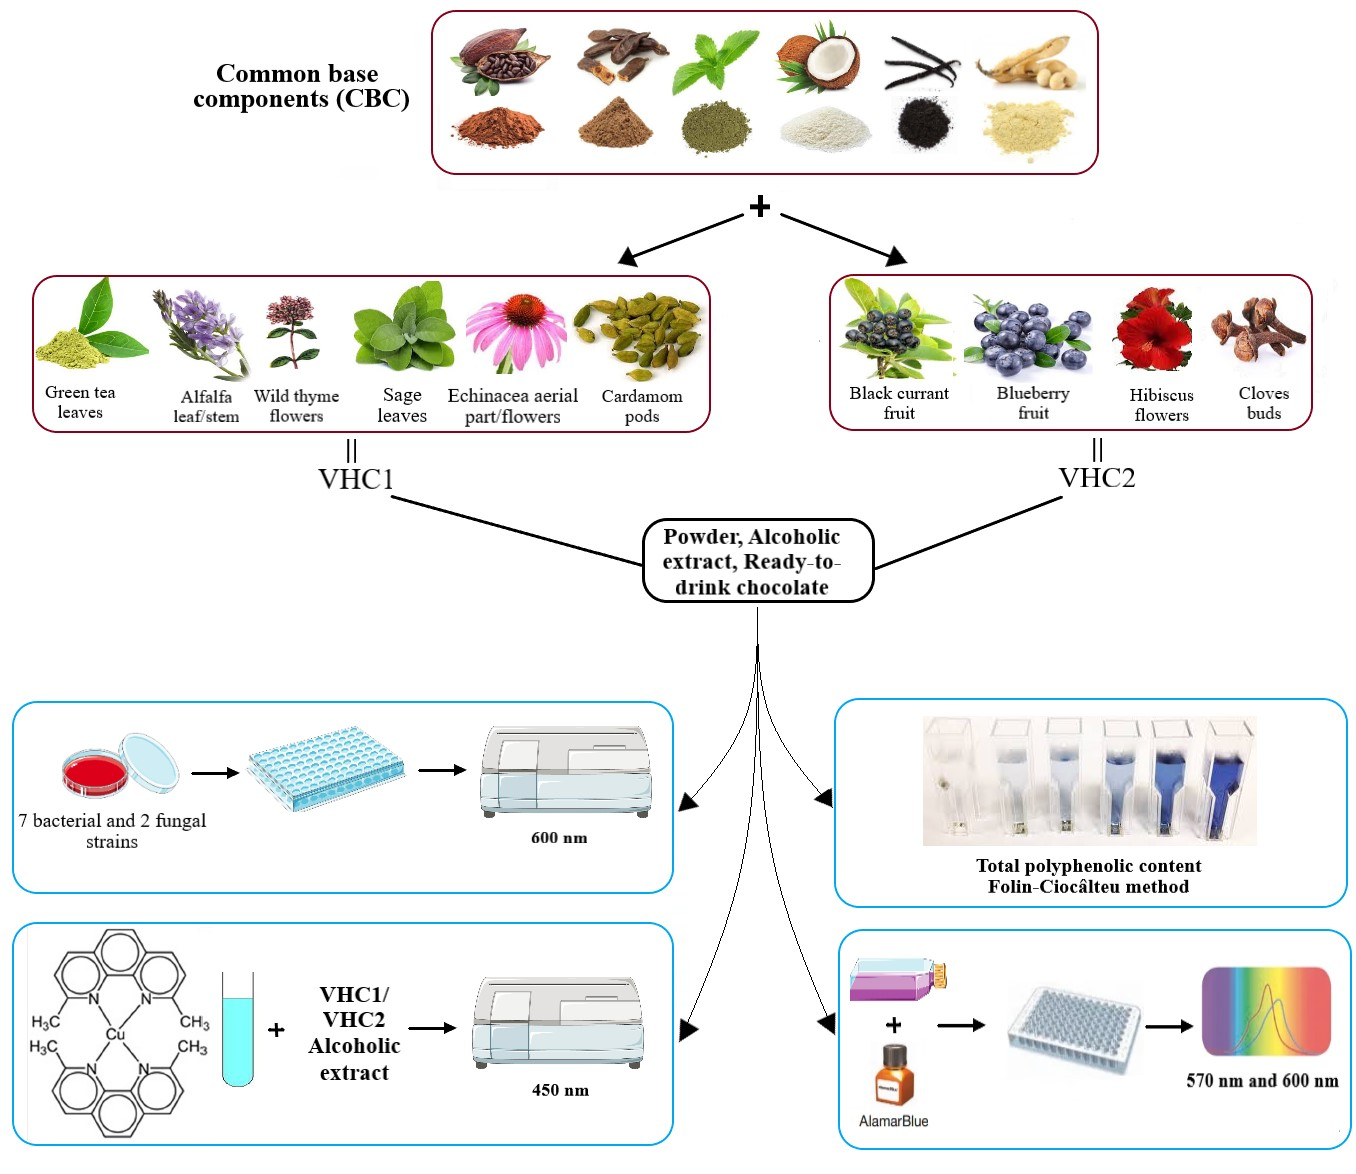
3.1. Total Polyphenols (TP) and Individual Polyphenols Content
3.2. Antimicrobial Activity
3.3. Antioxidant Activity Assessed by CUPRAC Method
3.4. Nutritional Profile of the Finished Products
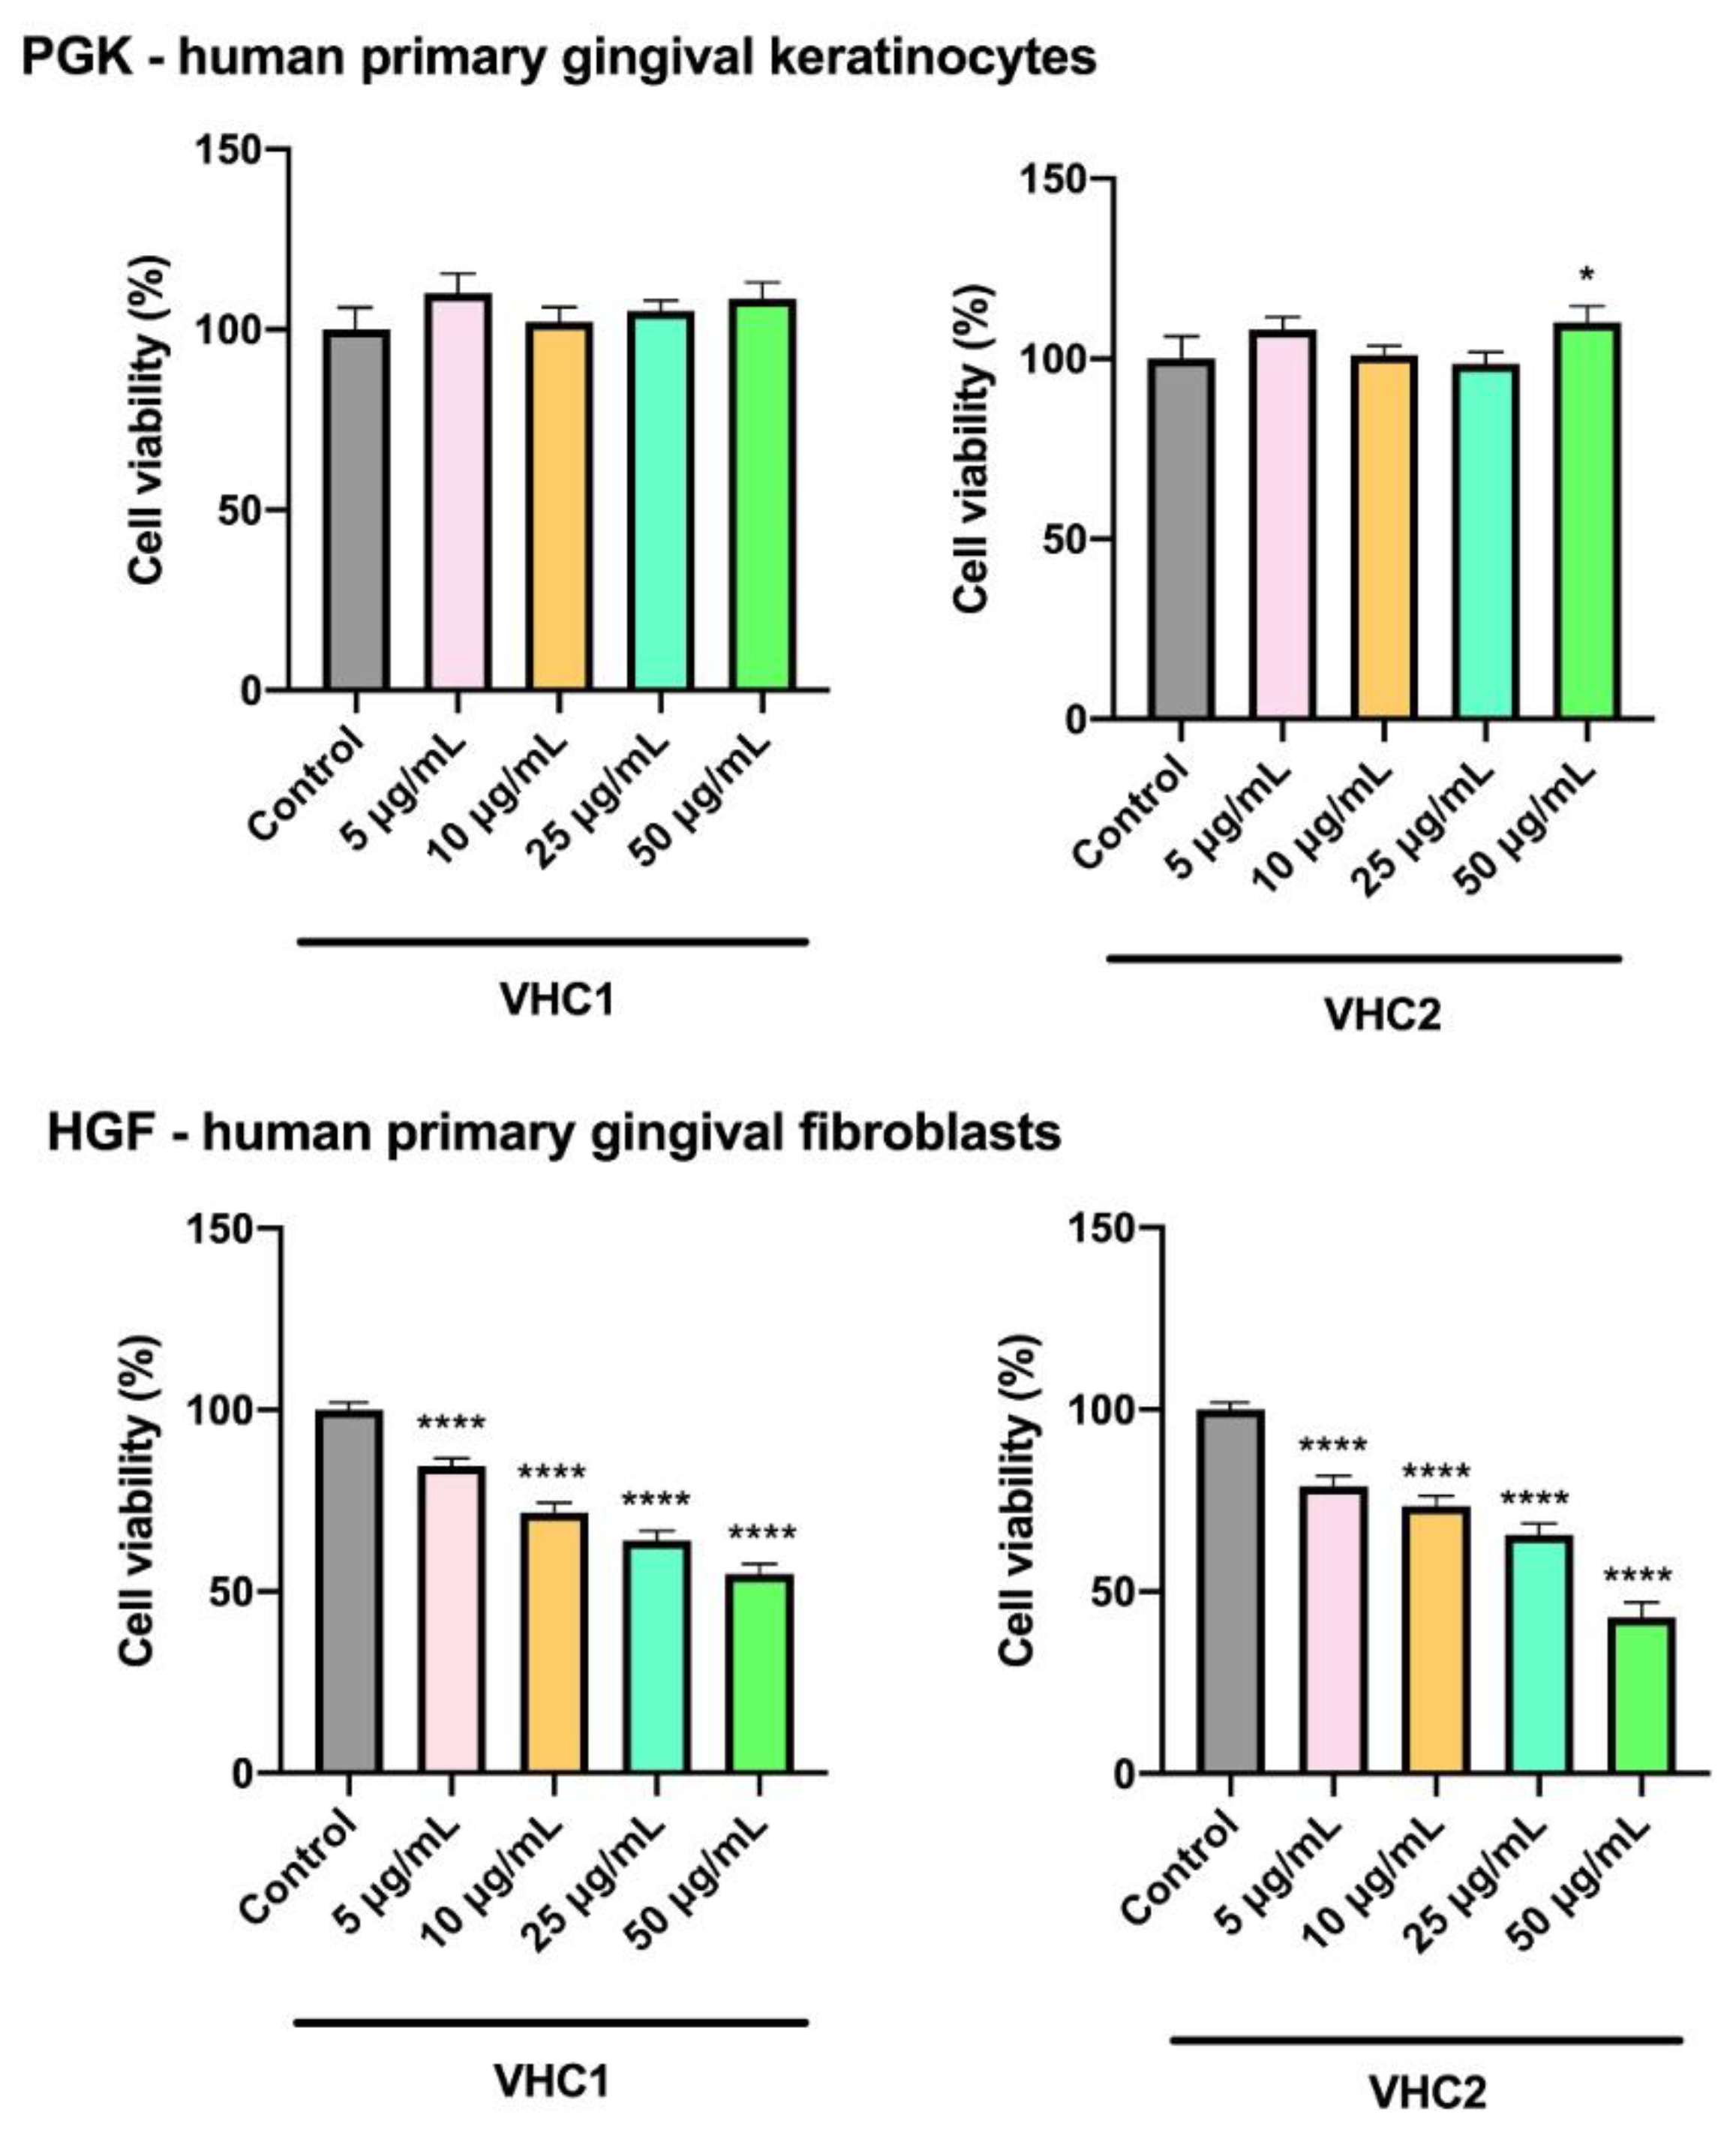
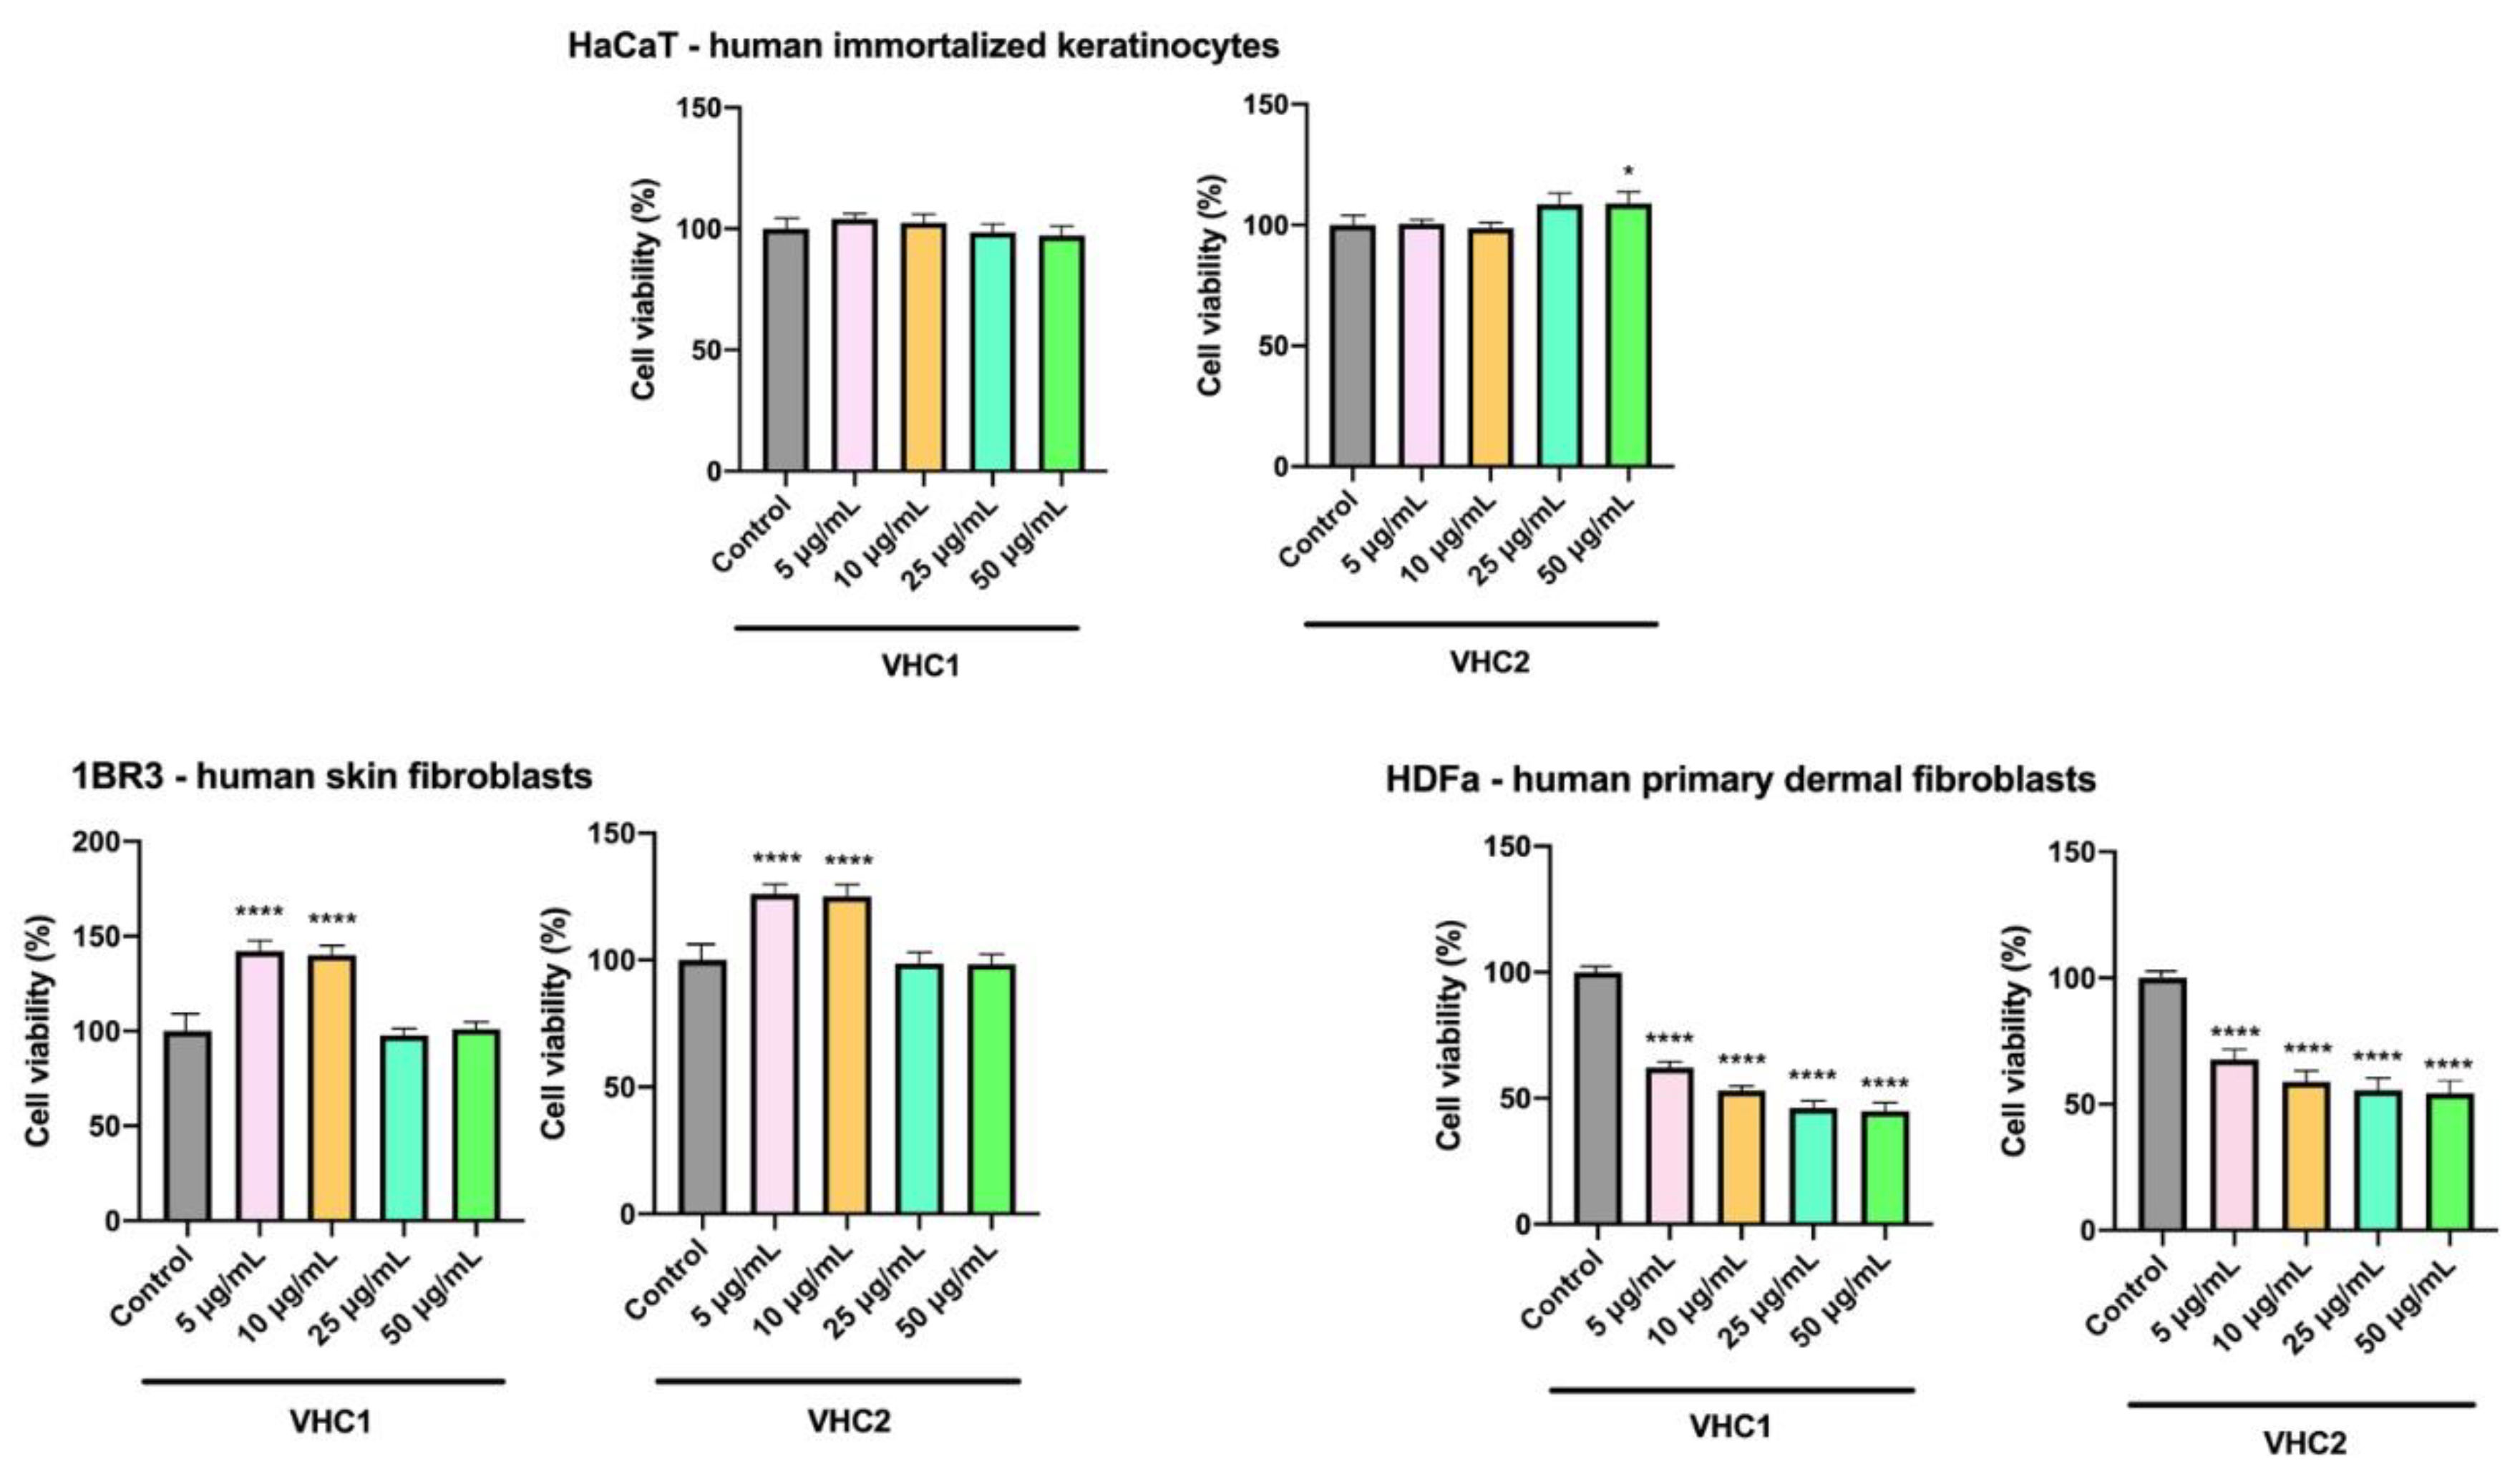
3.5. In Vitro Toxicological Evaluation of Finished Products
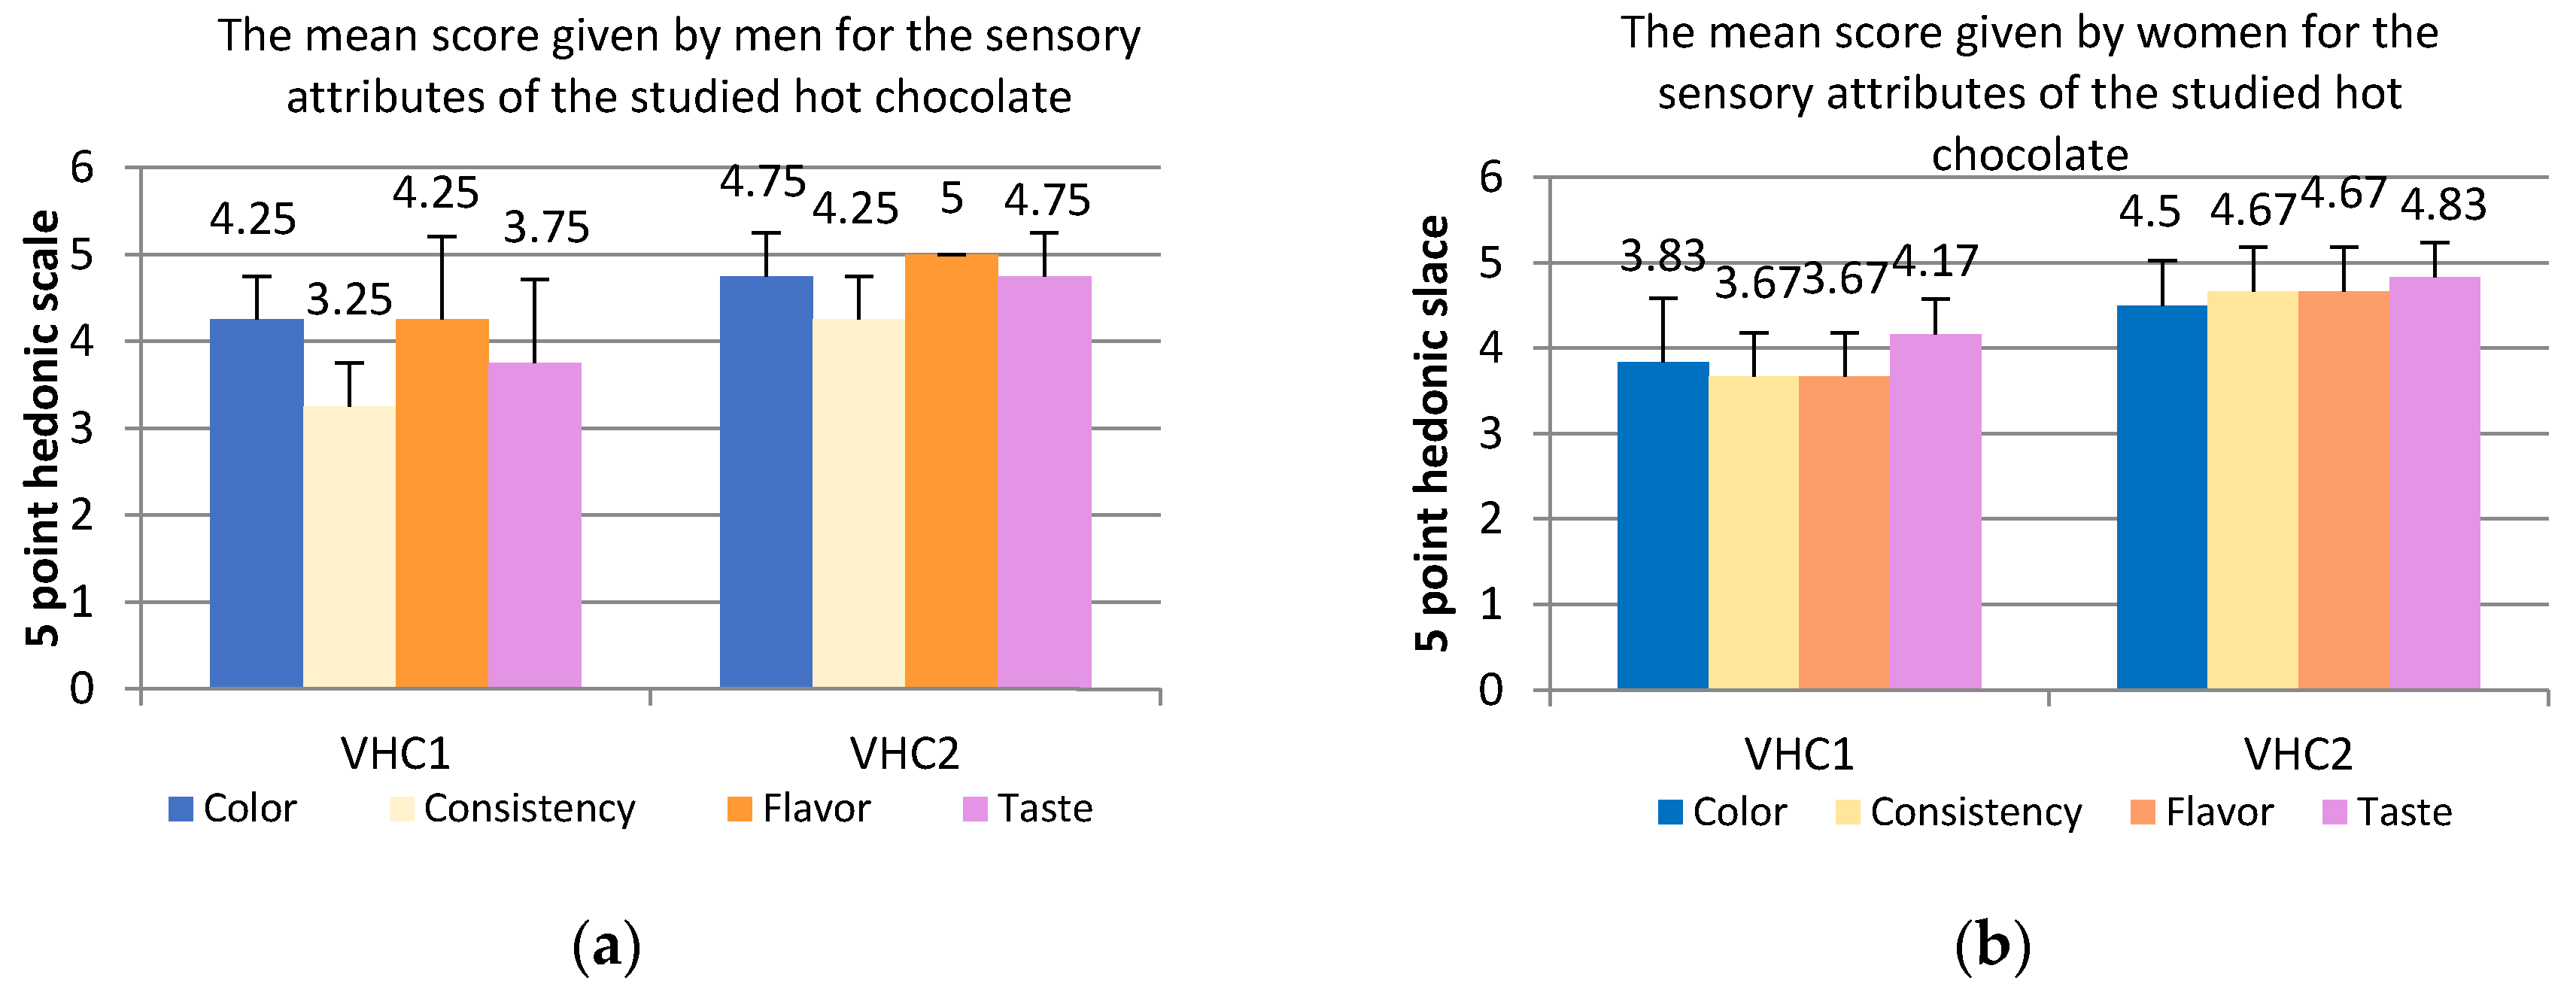
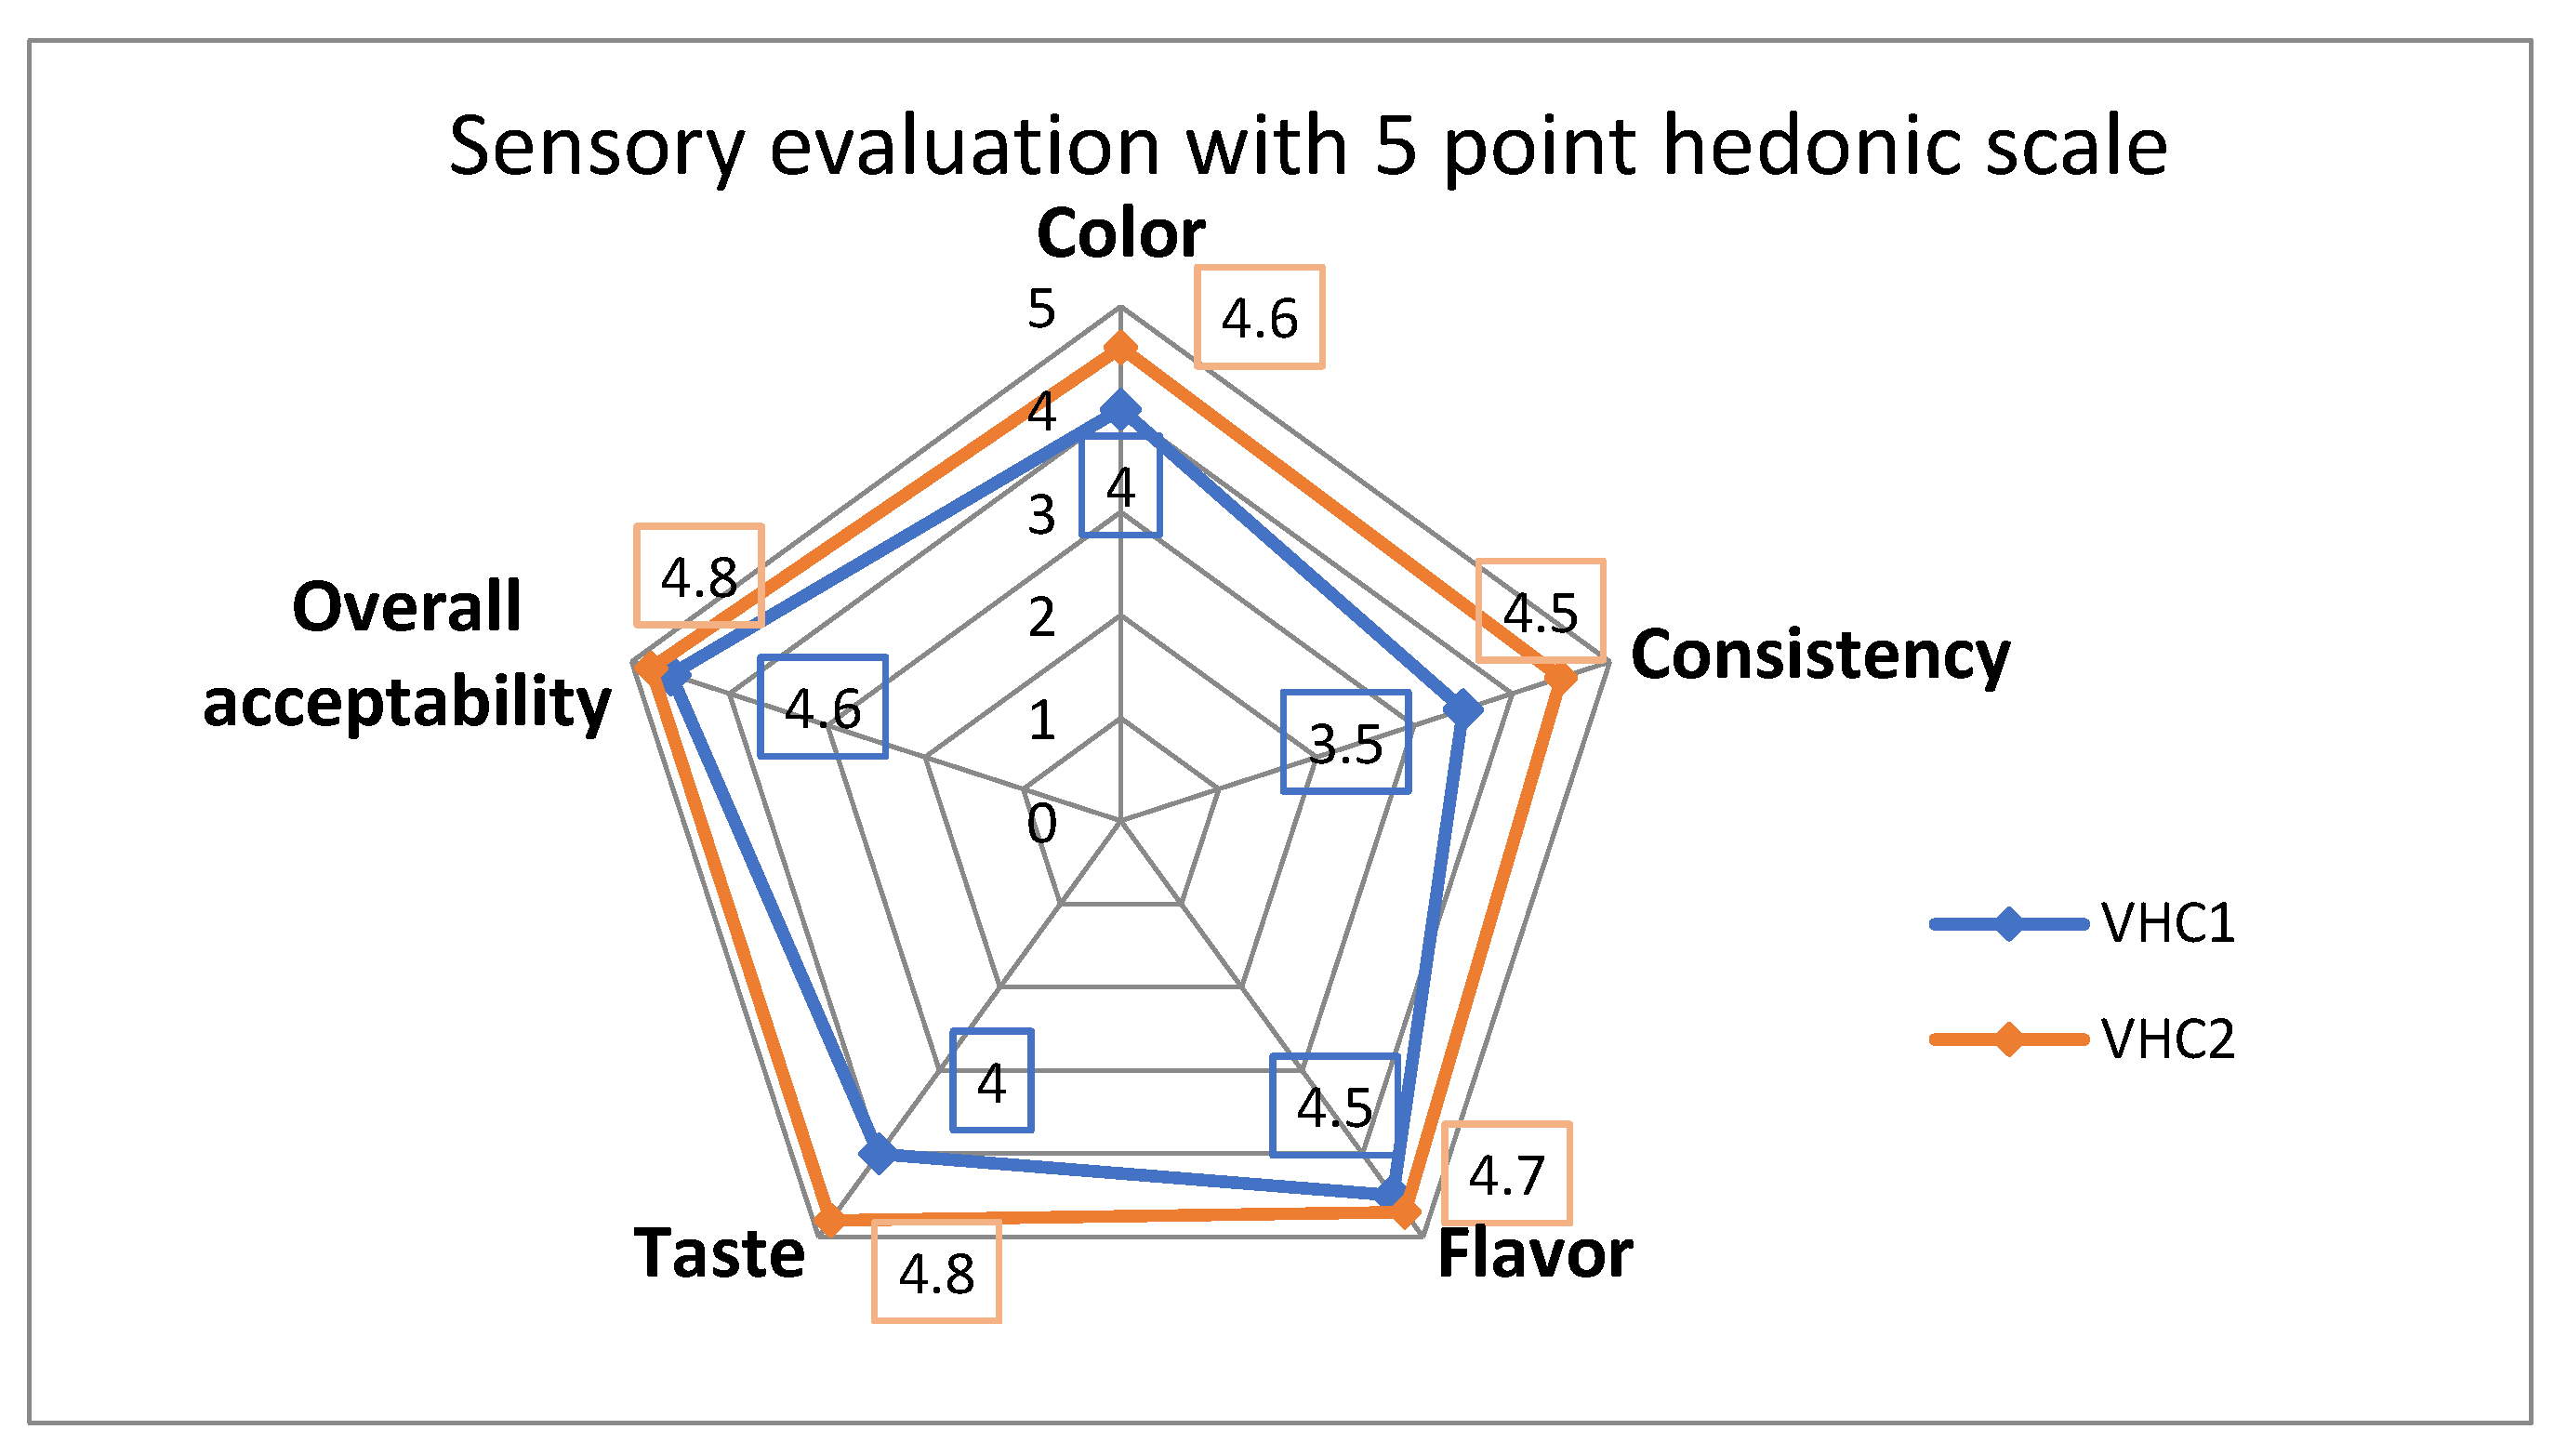
3.6. Sensory Analysis
4. Conclusions
Author Contributions
Funding
Conflicts of Interest
References
- Smith, J. Functional Food Product Development; Blackwell Publishing Ltd.: Chichester, West Sussex, UK, 2010; ISBN 9781405178761. [Google Scholar]
- Navarro, V.; Serrano, G.; Lasa, D.; Luis Aduriz, A.; Ayo, J. Cooking and nutritional science: Gastronomy goes further. Int. J. Gastron. Food Sci. 2012, 1, 37–45. [Google Scholar] [CrossRef]
- Moynihan, P. Sugars and Dental Caries: Evidence for Setting a Recommended Threshold for Intake. Adv. Nutr. 2016, 7, 149–156. [Google Scholar] [CrossRef] [PubMed]
- World Health Organization. Incentives and Disincentives for Reducing Sugar in Manufactured Foods; WHO Regional Office for Europe: Marmorvej, Denmark, 2017. [Google Scholar]
- Tandel, K.R. Sugar substitutes: Health controversy over perceived benefits. J. Pharmacol. Pharmacother. 2011, 2, 236–243. [Google Scholar] [CrossRef] [PubMed]
- Panghal, A.; Kumar, V. Natural sweeteners: Health benefits of stevia. Foods Raw Mater. 2018, 6. [Google Scholar] [CrossRef]
- Dillinger, T.L.; Barriga, P.; Escárcega, S.; Jimenez, M.; Salazar Lowe, D.; Grivetti, L.E. Food of the gods: Cure for humanity? A cultural history of the medicinal and ritual use of chocolate. J. Nutr. 2000, 130, 2057S–2072S. [Google Scholar] [CrossRef] [PubMed]
- Ferrazzano, G.F.; Amato, I.; Ingenito, A.; De Natale, A.; Pollio, A. Anti-cariogenic effects of polyphenols from plant stimulant beverages (cocoa, coffee, tea). Fitoterapia 2009, 80, 255–262. [Google Scholar] [CrossRef] [PubMed]
- Scapagnini, G.; Davinelli, S.; Di Renzo, L.; De Lorenzo, A.; Olarte, H.H.; Micali, G.; Cicero, A.F.; Gonzalez, S. Cocoa bioactive compounds: Significance and potential for the maintenance of skin health. Nutrients 2014, 6, 3202–3213. [Google Scholar] [CrossRef]
- Petyaev, I.M.; Bashmakov, Y.K. Dark Chocolate: Opportunity for an Alliance between Medical Science and the Food Industry? Front. Nutr. 2017, 4, 43. [Google Scholar] [CrossRef]
- Azila, A.K.; Azlan, A.; Ismail, A.; Hashim, P.; Abd Gani, S.S.; Zainudin, B.H.; Abdullah, N.A. Efficacy of cocoa pod extract as antiwrinkle gel on human skin surface. J. Cosmet. Dermatol. 2016, 15, 283–295. [Google Scholar] [CrossRef]
- Kshitiz, P.; Shipra, Z.; Rani, S.; Jayanti, S. Anti-cariogenic effects of polyphenol plant products—A review. Int. J. Res. Ayurveda Pharm. 2011, 2, 736–742. [Google Scholar]
- Ferrazzano, G.F.; Amato, I.; Ingenito, A.; Zarrelli, A.; Pinto, G.; Pollio, A. Plant polyphenols and their anti-cariogenic properties: A review. Molecules 2011, 16, 1486–1507. [Google Scholar] [CrossRef] [PubMed]
- Philip, N.; Walsh, L.J. Cranberry Polyphenols: Natural Weapons against Dental Caries. Dent. J. 2019, 7, 20. [Google Scholar] [CrossRef] [PubMed]
- Corsi, L.; Avallone, R.; Cosenza, F.; Farina, F.; Baraldi, C.; Baraldi, M. Antiproliferative effects of Ceratonia siliqua L. on mouse hepatocellular carcinoma cell line. Fitoterapia 2002, 73, 674–684. [Google Scholar] [CrossRef]
- Ferrazzano, G.F.; Cantile, T.; Alcidi, B.; Coda, M.; Ingenito, A.; Zarrelli, A.; Di Fabio, G.; Pollio, A. Is Stevia rebaudiana Bertoni a Non Cariogenic Sweetener? A Review. Molecules 2015, 21, 38. [Google Scholar] [CrossRef]
- Contreras, M.S. Anticariogenic properties and effects on periodontal structures of Stevia rebaudiana Bertoni. Narrative review. J. Oral Res. 2013, 2, 158–166. [Google Scholar] [CrossRef]
- Awadalla, H.I.; Ragab, M.H.; Fayed, M.T.; Abbas, M.O.; Bassuoni, M.W. Evaluation of the Effect of Green Tea on Dental Caries and Composite Restorations. TAF Prev. Med. Bull 2011, 10. [Google Scholar] [CrossRef]
- Jazaeri, M.; Pakdek, F.; Rezaei-Soufi, L.; Abdolsamadi, H.; Rafieian, N. Cariostatic effect of green tea in comparison with common anticariogenic agents: An in vitro study. J. Dent. Res. Dent. Clin. Dent. Prospect. 2015, 9, 44–48. [Google Scholar] [CrossRef]
- Reygaert, W.C. Green Tea Catechins: Their Use in Treating and Preventing Infectious Diseases. Biomed Res. Int. 2018, 2018, 9105261. [Google Scholar] [CrossRef]
- Prior, R.L.; Wu, X.; Schaich, K. Standardized methods for the determination of antioxidant capacity and phenolics in foods and dietary supplements. J. Agric. Food Chem. 2005, 53, 4290–4302. [Google Scholar] [CrossRef]
- Singleton, V.L.; Orthofer, R.; Lamuela-Raventós, R.M. Analysis of total phenols and other oxidation substrates and antioxidants by means of folin-ciocalteu reagent. In Oxidants and Antioxidants Part A; Methods in Enzymology; Academic Press: Cambridge, MA, USA, 1999; Volume 299, pp. 152–178. [Google Scholar]
- Folin, O.; Ciocalteu, V. Tyrosine and tryptophane detrmination proteins. J. Biol. Chem. 1927, 73, 627–650. [Google Scholar]
- Apak, R.; Güçlü, K.; Ozyürek, M.; Karademir, S.E. Novel total antioxidant capacity index for dietary polyphenols and vitamins C and E, using their cupric ion reducing capability in the presence of neocuproine: CUPRAC method. J. Agric. Food Chem. 2004, 52, 7970–7981. [Google Scholar] [CrossRef] [PubMed]
- Bouarab-Chibane, L.; Forquet, V.; Lantéri, P.; Clément, Y.; Léonard-Akkari, L.; Oulahal, N.; Degraeve, P.; Bordes, C. Antibacterial Properties of Polyphenols: Characterization and QSAR (Quantitative Structure-Activity Relationship) Models. Front. Microbiol. 2019, 10, 829. [Google Scholar] [CrossRef] [PubMed]
- Soica, C.; Oprean, C.; Borcan, F.; Danciu, C.; Trandafirescu, C.; Coricovac, D.; Crăiniceanu, Z.; Dehelean, C.A.; Munteanu, M. The synergistic biologic activity of oleanolic and ursolic acids in complex with hydroxypropyl-γ-cyclodextrin. Molecules 2014, 19, 4924–4940. [Google Scholar] [CrossRef] [PubMed]
- Lim, J. Hedonic scaling: A review of methods and theory. Food Qual. Prefer. 2011, 22, 733–747. [Google Scholar] [CrossRef]
- Effa Onomo, P.; Niemenak, N.; Pierre, F.; Ondobo, M.; Denis, O. Heritability of polyphenols, anthocyanins and antioxidant capacity of Cameroonian cocoa (Theobroma cacao L.) beans. Afr. J. Biotechnol. 2015, 14, 2672–2682. [Google Scholar] [CrossRef]
- Othman, A.; Ismail, A.; Ghani, N.; Adenan, I. Antioxidant capacity and phenolic content of cocoa beans. Food Chem. 2007, 100, 1523–1530. [Google Scholar] [CrossRef]
- Butleska-Gjoroska, V.; Krstik, M.; Klincarska, I.J.; Cvetanovska, A.; Cvetanovska, L.; Gudeva, L.K. Evaluation of total phenols in alfalfa (Medicago sativa L.) collected from different localities in Republic of Macedonia. J. Agric. Plant Sci. 2018, 16, 45–54. [Google Scholar]
- Karimi, E.; Oskoueian, E.; Armin, O.; Vahid, O.; Rudi, H.; Nazeran, H. Insight into the functional and medicinal properties of Medicago sativa (Alfalfa) leaves extract. J. Med. Plants Res. 2013, 7, 290–297. [Google Scholar] [CrossRef]
- Jing, C.-L.; Dong, X.-F.; Tong, J.-M. Optimization of Ultrasonic-Assisted Extraction of Flavonoid Compounds and Antioxidants from Alfalfa Using Response Surface Method. Molecules 2015, 20, 5550. [Google Scholar] [CrossRef]
- Nadiah, N.I.; Uthumporn, U. Determination of phenolic and antioxidant properties in tea and spent tea under various extraction method and determination of catechins, caffeine and gallic acid by HPLC. Int. J. Adv. Sci. Eng. Inf. Technol. 2015, 5, 158–164. [Google Scholar] [CrossRef]
- Rodrigues, M.J.; Neves, V.; Martins, A.; Rauter, A.P.; Neng, N.R.; Nogueira, J.M.F.; Varela, J.; Barreira, L.; Custódio, L. In vitro antioxidant and anti-inflammatory properties of Limonium algarvense flowers’ infusions and decoctions: A comparison with green tea (Camellia sinensis). Food Chem. 2016, 200, 322–329. [Google Scholar] [CrossRef] [PubMed]
- Cleverdon, R.; Elhalaby, Y.; McAlpine, M.; Gittings, W.; Ward, W. Total Polyphenol Content and Antioxidant Capacity of Tea Bags: Comparison of Black, Green, Red Rooibos, Chamomile and Peppermint over Different Steep Times. Beverages 2018, 4, 15. [Google Scholar] [CrossRef]
- Cocan, I.; Alexa, E.; Danciu, C.; Radulov, I.; Galuscan, A.; Obistioiu, D.; Morvay, A.A.; Sumalan, R.M.; Poiana, M.-A.; Pop, G.; et al. Phytochemical screening and biological activity of Lamiaceae family plant extracts. Exp. Ther. Med. 2018, 15, 1863–1870. [Google Scholar] [CrossRef] [PubMed]
- Ulewicz-Magulska, B.; Wesolowski, M. Total Phenolic Contents and Antioxidant Potential of Herbs Used for Medical and Culinary Purposes. Plant Foods Hum. Nutr. 2019, 74, 61–67. [Google Scholar] [CrossRef]
- Jasicka-Misiak, I.; Poliwoda, A.; Petecka, M.; Buslovych, O.; Shlyapnikov, V.A.; Wieczorek, P.P. Antioxidant Phenolic Compounds in Salvia officinalis L. and Salvia sclarea L. Ecol. Chem. Eng. S 2018, 25, 133–142. [Google Scholar] [CrossRef]
- Ydjedd, S.; Chaalal, M.; Richard, G.; Kati, D.; López-Nicolás, R.; Fauconnier, M.-L.; Louaileche, H. Assessment of antioxidant potential of phenolic compounds fractions of Algerian Ceratonia siliqua L. pods during ripening stages. Int. Food Res. J. 2017, 24, 2041–2049. [Google Scholar]
- Sellappan, S.; Akoh, C.C.; Krewer, G. Phenolic compounds and antioxidant capacity of Georgia-grown blueberries and blackberries. J. Agric. Food Chem. 2002, 50, 2432–2438. [Google Scholar] [CrossRef]
- Li, C.; Feng, J.; Huang, W.-Y.; An, X.-T. Composition of polyphenols and antioxidant activity of rabbiteye blueberry (Vaccinium ashei) in Nanjing. J. Agric. Food Chem. 2013, 61, 523–531. [Google Scholar] [CrossRef]
- Bakowska-Barczak, A.M.; Kolodziejczyk, P.P. Black currant polyphenols: Their storage stability and microencapsulation. Ind. Crops Prod. 2011, 34, 1301–1309. [Google Scholar] [CrossRef]
- Ahmed, W. Monitoring antioxidant and antityrosinase activity of clove aromatic flower buds. J. Med. Plants Stud. 2016, 4, 163–169. [Google Scholar]
- Słowianek, M.; Leszczyńska, J. Antioxidant properties of selected culinary spices. Herba Pol. 2016, 62, 29–41. [Google Scholar] [CrossRef]
- Zade, K.; Gulkari, V.; Ingole, S.; Yadav, M.; Dubey, D. Antiradical and nitric oxide inhibition activities of soy lecithin. Int. J. Pharmacother. 2013, 3, 80–85. [Google Scholar]
- Khiraoui, A.; Faiz, C.A.; Hasib, A.; Bakha, M.; Benhmimou, A.; Amchra, F.Z.; Boulli, A. Antioxidant Ability, Total phenolic and Flavonoid contents of Leaf extract of Stevia rebaudiana Bertoni Cultivated in Morocco. Int. J. Sci. Eng. Res. 2018, 9, 1585–1589. [Google Scholar]
- Shukla, S.; Mehta, A.; Mehta, P.; Bajpai, V.K. Antioxidant ability and total phenolic content of aqueous leaf extract of Stevia rebaudiana Bert. Exp. Toxicol. Pathol. 2012, 64, 807–811. [Google Scholar] [CrossRef]
- Muanda, F.; Soulimani, R.; Diop, B.; Dicko, A. Study on chemical composition and biological activities of essential oil and extracts from Stevia rebaudiana Bertoni leaves. LWT-Food Sci. Technol. 2011, 44, 1865–1872. [Google Scholar] [CrossRef]
- Myint, K.Z.; Wu, K.; Xia, Y.; Fan, Y.; Shen, J.; Zhang, P.; Gu, J. Polyphenols from Stevia rebaudiana (Bertoni) leaves and their functional properties. J. Food Sci. 2020, 85, 240–248. [Google Scholar] [CrossRef]
- Ana, C.-C.; Martinez-Castillo, J.; Medina-Torres, N.; Ayora, T.; Andrews, H.; García-Cruz, N.; Pacheco López, N. Antioxidant Capacity and UPLC-PDA ESI-MS Phenolic Profile of Stevia rebaudiana Dry Powder Extracts Obtained by Ultrasound Assisted Extraction. Agronomy 2018, 8, 170. [Google Scholar] [CrossRef]
- Brahim, E.B.; Najlae, A.; Joly, N.; Martin, P.; Saidi, R.; Nejjar El Ansari, Z.; Mounia, B.; Alain, B.; Ahmed, L. Total Polyphenols and Gallic Acid Contents in Domesticated Carob (Ceratonia siliqua L.) Pods and Leaves. Int. J. Pure Appl. Biosci. 2017, 5. [Google Scholar] [CrossRef]
- Ayaz, F.A.; Torun, H.; Ayaz, S.; Correlia, P.J.; Alaiz, M.; Sanz, C.; Gruz, J.; Strand, M. Determination of chemical composition of Anatolia Carob pod (Ceratonia Siliqua L.): Sugars, amino and organic acids, minerals and phenolic compounds. J. Food Qual. 2007, 30, 1040–1055. [Google Scholar] [CrossRef]
- Ersoy, N.; Kupe, M.; Gundogdu, M.; Ilhan, G.; Ercisli, S. Phytochemical and Antioxidant Diversity in Fruits of Currant (Ribes spp.). Not. Bot. Horti Agrobot. Cluj-Napoca 2018, 46, 381–387. [Google Scholar] [CrossRef]
- Ali, F.; Ranneh, Y.; Ismail, A.; Esa, N.M. Identification of phenolic compounds in polyphenols-rich extract of Malaysian cocoa powder using the HPLC-UV-ESI-MS/MS and probing their antioxidant properties. J. Food Sci. Technol. 2015, 52, 2103–2111. [Google Scholar] [CrossRef] [PubMed]
- Irondi, E.; Olawuyi, A.D.; Lawal, B.S.; Boligon, A.A.; Olasupo, F.; Olasupo, O. Comparative inhibitory effects of cocoa bean and cocoa pod husk extracts on enzymes associated with hyperuricemia and hypertension in vitro. Int. Food Res. J. 2019, 26, 557–564. [Google Scholar]
- Stanciu, G.; Lupsor, S.; Aonofriesei, F.; Calota, N.; Popescu, A. Quantitative Analysis of Polyphenols and Biological Activity of Sage Macerates. Rev. Chim. Bucharest Orig. Ed. 2019, 70, 3865–3871. [Google Scholar] [CrossRef]
- Gaweł-Bęben, K.; Bujak, T.; Nizioł-Łukaszewska, Z.; Antosiewicz, B.; Jakubczyk, A.; Karaś, M.; Rybczyńska, K. Stevia rebaudiana Bert. leaf extracts as a multifunctional source of natural antioxidants. Molecules 2015, 20, 5468–5486. [Google Scholar] [CrossRef] [PubMed]
- Kim, I.-S.; Yang, M.; Lee, O.-H.; Kang, S.N. The antioxidant activity and the bioactive compound content of Stevia rebaudiana water extracts. Lwt-Food Sci. Technol. 2011, 44, 1328–1332. [Google Scholar] [CrossRef]
- Panche, A.N.; Diwan, A.D.; Chandra, S.R. Flavonoids: An overview. J. Nutr. Sci. 2016, 5, e47. [Google Scholar] [CrossRef]
- Sarhan, M.; Selim, K.; Ibrihem, K.; Roby, M. Evaluation of antioxidant activity, total phenols and phenolic compounds in thyme (Thymus vulgaris L.), sage (Salvia officinalis L.), and marjoram (Origanum majorana L.) extracts. Ind. Crops Prod. 2013, 43, 827–831. [Google Scholar] [CrossRef]
- Gonçalves, A.; Bento, C.; Jesus, F.; Simões, M.; Mergulhão, F.; Silva, L. Epicatechin: Sources and Health Benefits. In Epicatechin: Sources, Effects and Research; Collins, M., Ed.; Nova Science Publishers: Hauppauge, NY, USA, 2017; ISBN 978-1-53611-794-3. [Google Scholar]
- Gu, L.; House, S.E.; Wu, X.; Ou, B.; Prior, R.L. Procyanidin and catechin contents and antioxidant capacity of cocoa and chocolate products. J. Agric. Food Chem. 2006, 54, 4057–4061. [Google Scholar] [CrossRef]
- Zhao, Y.; Chen, P.; Lin, L.; Harnly, J.M.; Yu, L.L.; Li, Z. Tentative identification, quantitation, and principal component analysis of green pu-erh, green, and white teas using UPLC/DAD/MS. Food Chem. 2011, 126, 1269–1277. [Google Scholar] [CrossRef]
- Paunović, S.M.; Mašković, P.; Nikolić, M.; Miletić, R. Bioactive compounds and antimicrobial activity of black currant (Ribes nigrum L.) berries and leaves extract obtained by different soil management system. Sci. Hortic. 2017, 222, 69–75. [Google Scholar] [CrossRef]
- Nzeako, B.C.; Al-Kharousi, Z.S.N.; Al-Mahrooqui, Z. Antimicrobial activities of clove and thyme extracts. Sultan Qaboos Univ. Med. J. 2006, 6, 33–39. [Google Scholar] [PubMed]
- Shen, X.; Sun, X.; Xie, Q.; Liu, H.; Zhao, Y.; Pan, Y.; Hwang, C.-A.; Wu, V.C.H. Antimicrobial effect of blueberry (Vaccinium corymbosum L.) extracts against the growth of Listeria monocytogenes and Salmonella Enteritidis. Food Control 2014, 35, 159–165. [Google Scholar] [CrossRef]
- Mak, Y.W.; Chuah, L.O.; Ahmad, R.; Bhat, R. Antioxidant and antibacterial activities of hibiscus (Hibiscus rosa-sinensis L.) and Cassia (Senna bicapsularis L.) flower extracts. J. King Saud Univ. Sci. 2013, 25, 275–282. [Google Scholar] [CrossRef]
- Gopal, J.; Muthu, M.; Paul, D.; Kim, D.-H.; Chun, S. Bactericidal activity of green tea extracts: The importance of catechin containing nano particles. Sci. Rep. 2016, 6, 19710. [Google Scholar] [CrossRef] [PubMed]
- Asghar, A.; Butt, M.S.; Shahid, M.; Huang, Q. Evaluating the antimicrobial potential of green cardamom essential oil focusing on quorum sensing inhibition of Chromobacterium violaceum. J. Food Sci. Technol. 2017, 54, 2306–2315. [Google Scholar] [CrossRef]
- Chegini, H.; Oshaghi, M.; Boshagh, M.A.; Foroutan, P.; Jahangiri, A.H. Antibacterial effect of Medicago sativa extract on the common bacterial in sinusitis infection. Int. J. Biomed. Public Health 2018, 1, 1–5. [Google Scholar] [CrossRef][Green Version]
- Salević, A.; Prieto, C.; Cabedo, L.; Nedović, V.; Lagaron, J.M. Physicochemical, Antioxidant and Antimicrobial Properties of Electrospun Poly(ε-caprolactone) Films Containing a Solid Dispersion of Sage (Salvia officinalis L.) Extract. Nanomaterials 2019, 9, 270. [Google Scholar] [CrossRef]
- Chiellini, C.; Maida, I.; Maggini, V.; Bosi, E.; Mocali, S.; Emiliani, G.; Perrin, E.; Firenzuoli, F.; Mengoni, A.; Fani, R. Preliminary data on antibacterial activity of Echinacea purpurea-associated bacterial communities against Burkholderia cepacia complex strains, opportunistic pathogens of Cystic Fibrosis patients. Microbiol. Res. 2017, 196, 34–43. [Google Scholar] [CrossRef]
- Njimoh, D.L.; Assob, J.C.N.; Mokake, S.E.; Nyhalah, D.J.; Yinda, C.K.; Sandjon, B. Antimicrobial Activities of a Plethora of Medicinal Plant Extracts and Hydrolates against Human Pathogens and Their Potential to Reverse Antibiotic Resistance. Int. J. Microbiol. 2015, 2015, 547156. [Google Scholar] [CrossRef]
- Moussaoui, F.; Alaoui, T. Evaluation of antibacterial activity and synergistic effect between antibiotic and the essential oils of some medicinal plants. Asian Pac. J. Trop. Biomed. 2016, 6, 32–37. [Google Scholar] [CrossRef]
- Toroglu, S. In-vitro antimicrobial activity and synergistic/antagonistic effect of interactions between antibiotics and some spice essential oils. J. Environ. Biol. 2011, 32, 23–29. [Google Scholar] [PubMed]
- Nweze, E.; Onyishi, M. In vitro antimicrobial activity of ethanolic and methanolic fruit extracts of Xylopia aethiopica and its combination with disc antibiotics against clinical isolates of bacteria and fungi. J. Rural Trop. Public Health 2010, 9, 1–6. [Google Scholar]
- de Freitas Araújo, M.G.; Hilário, F.; Vilegas, W.; Dos Santos, L.C.; Brunetti, I.L.; Sotomayor, C.E.; Bauab, T.M. Correlation among antioxidant, antimicrobial, hemolytic, and antiproliferative properties of Leiothrix spiralis leaves extract. Int. J. Mol. Sci. 2012, 13, 9260–9277. [Google Scholar] [CrossRef]
- Benz, R.; Bauer, K. Permeation of hydrophilic molecules through the outer membrane of gram-negative bacteria. Review on bacterial porins. Eur. J. Biochem. 1988, 176, 1–19. [Google Scholar] [CrossRef]
- Khameneh, B.; Iranshahy, M.; Soheili, V.; Fazly Bazzaz, B.S. Review on plant antimicrobials: A mechanistic viewpoint. Antimicrob. Resist. Infect. Control 2019, 8, 118. [Google Scholar] [CrossRef] [PubMed]
- Veloz, J.J.; Alvear, M.; Salazar, L.A. Antimicrobial and Antibiofilm Activity against Streptococcus mutans of Individual and Mixtures of the Main Polyphenolic Compounds Found in Chilean Propolis. Biomed Res. Int. 2019, 2019, 7602343. [Google Scholar] [CrossRef] [PubMed]
- Apak, R.; Özyürek, M.; Güçlü, K.; Bekdeşer, B.; Bener, M. Chapter 24—The CUPRAC Methods of Antioxidant Measurement for Beverages. In Processing and Impact on Antioxidants in Beverages; Preedy, V., Ed.; Academic Press: San Diego, CA, USA, 2014; pp. 235–244. ISBN 978-0-12-404738-9. [Google Scholar]
- Apak, R.; Güçlü, K.; Demirata, B.; Ozyürek, M.; Celik, S.E.; Bektaşoğlu, B.; Berker, K.I.; Ozyurt, D. Comparative evaluation of various total antioxidant capacity assays applied to phenolic compounds with the CUPRAC assay. Molecules 2007, 12, 1496–1547. [Google Scholar] [CrossRef]
- Fernandes, R.P.P.; Trindade, M.A.; Tonin, F.G.; Lima, C.G.; Pugine, S.M.P.; Munekata, P.E.S.; Lorenzo, J.M.; de Melo, M.P. Evaluation of antioxidant capacity of 13 plant extracts by three different methods: Cluster analyses applied for selection of the natural extracts with higher antioxidant capacity to replace synthetic antioxidant in lamb burgers. J. Food Sci. Technol. 2016, 53, 451–460. [Google Scholar] [CrossRef]
- Gröger, S.; Michel, J.; Meyle, J. Establishment and characterization of immortalized human gingival keratinocyte cell lines. J. Periodontal Res. 2008, 43, 604–614. [Google Scholar] [CrossRef]
- Abdel-Rahman, A.; Anyangwe, N.; Carlacci, L.; Casper, S.; Danam, R.P.; Enongene, E.; Erives, G.; Fabricant, D.; Gudi, R.; Hilmas, C.J.; et al. The safety and regulation of natural products used as foods and food ingredients. Toxicol. Sci. 2011, 123, 333–348. [Google Scholar] [CrossRef]
- Wanichpakorn, S.; Kedjarune-Laggat, U. Primary cell culture from human oral tissue: Gingival keratinocytes, gingival fibroblasts and periodontal ligament fibroblasts. Songklanakarin J. Sci. Technol. 2010, 32, 327–331. [Google Scholar]
- Soares, A.S.L.S.; Scelza, M.Z.; Spoladore, J.; Gallito, M.A.; Oliveira, F.; Moraes, R.D.C.M.; Alves, G.G. Comparison of primary human gingival fibroblasts from an older and a young donor on the evaluation of cytotoxicity of denture adhesives. J. Appl. Oral Sci. 2018, 26. [Google Scholar] [CrossRef] [PubMed]
- Olschläger, V.; Schrader, A.; Hockertz, S. Comparison of primary human fibroblasts and keratinocytes with immortalized cell lines regarding their sensitivity to sodium dodecyl sulfate in a neutral red uptake cytotoxicity assay. Arzneimittelforschung 2009, 59, 146–152. [Google Scholar] [CrossRef] [PubMed]
- Bullock, G.; Miller, C.; McKechnie, A.; Hearnden, V. Synthetic Hydroxyapatite Inhibits Bisphosphonate Toxicity to the Oral Mucosa In Vitro. Materials 2020, 13, 2086. [Google Scholar] [CrossRef]
- Zorzi, M.; Gai, F.; Medana, C.; Aigotti, R.; Morello, S.; Peiretti, P.G. Bioactive Compounds and Antioxidant Capacity of Small Berries. Foods 2020, 9, 623. [Google Scholar] [CrossRef]
- Iserliyska, D.; Resurreccion, A.V.A.; Paraskova, P.; Chinnan, M.; Ruinova, M.; Petrova, T. Attributes Critical to Product Acceptance of Chocolate Peanut Cream by Bulgarian Consumers. Peanut Sci. 2007, 34, 53–58. [Google Scholar] [CrossRef]
- Norhayati, H.; Mohd, A. Sensory Quality of Pilot-Scale Prebiotic Chocolates in Malaysia. Sains Malays. 2014, 43, 1333–1344. [Google Scholar]


| Common Base Components (CBC) | Cocoa Powder with Max 12% Fat | Carob Powder | Stevia Leaf Powder | Coconut Milk Powder | Soy Lecithin Powder | Vanilla Pods Powder |
|---|---|---|---|---|---|---|
| Commercial brand | “Solaris” | “Solaris” | “Dragon Superfoods” | “Vegis” | “Ecomil” | “Biovegan” |
| % * | 38 | 11.5 | 6.5 | 38 | 1.9 | 0.1 |
| VHC1 specific components | Green tea leaves | Alfalfa leaf and steams | Wild thyme aerial parts with flowers | Sage leaves | Echinacea aerial part with flowers | Cardamom pods |
| Commercial brand | “Sonnentor” | “Phyto Biocare” | “Fares” | “Sonnentor” | “Fares” | “Carmita Classic” |
| % * | 1 | 1 | 0.5 | 0.5 | 0.5 | 0.5 |
| VHC2 specific components | Black currant fruit | Blueberry fruit | Hibiscus flowers | Cloves buds | ||
| Commercial brand | “Obio” | “Lyolife” | “Dacia Plant” | “Solaris” | ||
| % * | 1 | 1 | 1 | 1 |
| Sample | Total Polyphenols (mg GAE/g) | |
|---|---|---|
| The basis for both VHC1 and VHC2 recipes | Cocoa powder | 109.70 ± 1.93 |
| Carob powder | 102.78 ± 1.79 | |
| Coconut milk powder | 17.98 ± 0.90 | |
| Stevia rebaudiana leaf powder | 103.36 ± 2.74 | |
| Soy lecithin powder | 11.04 ± 0.45 | |
| Vanilla pods powder | 101.64 ± 1.69 | |
| Specific components in VHC1 recipe | Cardamom powder | 44.72 ± 1.33 |
| Wild thyme powder | 108.49 ± 1.88 | |
| Green tea powder | 104.89 ± 3.22 | |
| Alfalfa powder | 17.14 ± 0.41 | |
| Sage powder | 59.14 ± 1.47 | |
| Echinacea powder | 21.07 ± 0.54 | |
| Specific components in VHC2 recipe | Black currant powder | 40.19 ± 0.76 |
| Blueberry powder | 47.09 ± 1.52 | |
| Hibiscus powder | 25.78 ± 1.10 | |
| Cloves powder | 130.19 ± 2.71 | |
| Final products | VHC1 powder | 127.81 ± 2.33 |
| VHC2 powder | 137.70 ± 2.23 | |
| VHC1 beverage | 17.14 ± 0.55 | |
| VHC2 beverage | 18.50 ± 0.52 |
| Polyphenol Concentration (mg/g) | ||||||||||||||||
|---|---|---|---|---|---|---|---|---|---|---|---|---|---|---|---|---|
| Polyphenol | Cocoa | Coconut Milk | Carob | Stevia Rebaudiana | Cardamom | Vanilla | Thyme | Green Tea | Lecithin | Black Currant | Alfalfa | Blueberry | Sage | Clove | Hibiscus | Echinacea |
| Gallic acid (GA) | 0.79 ± 0.028 | - | 23.98 ± 0.764 | 1.52 ± 0.071 | 0.22 ± 0.007 | - | - | 1.02 ± 0.028 | - | 0.14 ± 0.007 | 0.42 ± 0.014 | - | - | 3.80 ± 0.184 | - | - |
| Protocatechuic acid (PR) | 18.21 ± 0.467 | - | 23.06 ± 0.580 | - | 0.39 ± 0.014 | 3.36 ± 0.141 | - | - | - | 1.12 ± 0.042 | - | - | - | 6.21 ± 0.240 | - | - |
| Caffeic acid (CA) | 1.63 ± 0.085 | 0.03 ± 0.007 | 1.66 ± 0.057 | 1.39 ± 0.042 | 0.18 ± 0.014 | 2.37 ± 0.113 | 0.36 ± 0.028 | 24.88 ± 0.566 | 0.04 ± 0.003 | 0.49 ± 0.028 | 0.25 ± 0.014 | 4.84 ± 0.141 | 0.73 ± 0.028 | 3.83 ± 0.085 | 0.26 ± 0.007 | 0.15 ± 0.007 |
| Epicatechin (EC) | 1.33 ± 0.042 | 0.05 ± 0.001 | 29.40 ± 0.933 | 0.17 ± 0.007 | - | 35.57 ± 0.594 | 10.01 ± 0.368 | 13.05 ± 0.424 | - | 2.43 ± 0.071 | 8.55 ± 0.283 | 6.66 ± 0.255 | 3.85 ± 0.184 | 18.33 ± 0.495 | 8.75 ± 0.283 | 18.27 ± 0.368 |
| p-Coumaric acid (CU) | - | - | 0.50 ± 0.028 | 0.47 ± 0.014 | 0.34 ± 0.014 | 4.65 ± 0.099 | 0.75 ± 0.042 | 3.04 ± 0.099 | - | 0.06 ± 0.004 | 0.15 ± 0.004 | 0.07 ± 0.003 | 0.05 ± 0.001 | 0.74 ± 0.028 | 0.13 ± 0.007 | 0.08 ± 0.004 |
| Ferulic acid (FE) | 0.82 ± 0.028 | - | 0.30 ± 0.014 | 0.29 ± 0.007 | 0.65 ± 0.014 | 0.20 ± 0.001 | 0.44 ± 0.014 | 2.20 ± 0.071 | - | 0.08 ± 0.002 | 0.06 ± 0.002 | 0.04 ± 0.001 | 0.10 ± 0.002 | 0.28 ± 0.014 | - | - |
| Rutin (RU) | 0.05 ± 0.001 | - | 1.55 ± 0.071 | - | - | 4.15 ± 0.071 | 3.32 ± 0.113 | 8.41 ± 0.226 | - | 0.47 ± 0.028 | 0.48 ± 0.028 | 1.86 ± 0.057 | 1.99 ± 0.057 | 16.13 ± 0.325 | 1.96 ± 0.057 | 1.13 ± 0.04 |
| Rosmarinic acid (RO) | - | 0.05 ± 0.001 | 6.35 ± 0.141 | 0.86 ± 0.028 | - | 2.22 ± 0.057 | 0.09 ± 0.003 | 0.25 ± 0.014 | - | 0.46 ± 0.021 | 0.19 ± 0.014 | 0.22 ± 0.006 | 0.79 ± 0.028 | 4.34 ± 0.099 | 0.51 ± 0.014 | 0.61 ± 0.028 |
| Resveratrol (RS) | - | - | 0.86 ± 0.0028 | 1.94 ± 0.056 | - | 1.90 ± 0.07 | 6.06 ± 0.198 | 0.08 ± 0.002 | - | 0.03 ± 0.001 | 0.11 ± 0.004 | 0.22 ± 0.007 | 16.08 ± 0.467 | 4.54 ± 0.099 | 0.20 ± 0.007 | 5.35 ± 0.141 |
| Quercitin (QU) | 2.47 ± 0.099 | 0.01 ± 0.001 | 1.90 ± 0.071 | 4.87 ± 0.099 | 0.01 ± 0.001 | 2.52 ± 0.099 | 2.34 ± 0.057 | 0.15 ± 0.007 | - | 0.02 ± 0.001 | 0.14 ± 0.004 | 0.04 ± 0.001 | 2.04 ± 0.042 | 3.50 ± 0.071 | 0.11 ± 0.003 | 2.05 ± 0.057 |
| Kaempherol (KP) | 0.56 ± 0.028 | 0.07 ± 0.003 | 1.70 ± 0.071 | 4.36 ± 0.085 | 0.06 ± 0.002 | 3.72 ± 0.099 | 4.57 ± 0.141 | 0.04 ± 0.001 | 0.04 ± 0.001 | 0.31 ± 0.007 | 0.31 ± 0.011 | 0.05 ± 0.003 | 1.25 ± 0.057 | 14.45 ± 0.566 | 0.86 ± 0.028 | 2.10 ± 0.071 |
| Parameters | VHC1 Beverage | VHC2 Beverage |
|---|---|---|
| Antioxidant activity (mg Trolox/g) | 38.608 ± 1.609 | 37.258 ± 1.826 |
| Parameters | VHC1 Powder | VHC2 Powder |
|---|---|---|
| Moisture (g/100 g) | 4.08 ± 0.1 | 3.85 ± 0.05 * |
| Mineral substances (g/100 g) | 5.86 ± 0.174 | 5.03 ± 0.101 * |
| Proteins (g/100 g) | 11.11 ± 0.245 | 11.45 ± 0.390 |
| Lipids (g/100 g): | 9.56 ± 0.181 | 9.04 ± 0.165 |
| - saturated fatty acids (g/100 g) | 6.42 ± 0.121 | 6.13 ± 0.106 * |
| Carbohydrates (g/100 g): | 69.36 | 71.63 |
| - sugar (g/100 g) | 15.35 ± 0.176 | 15.85 ± 0.165 * |
| - dietary fiber (g/100 g) | 28.37 ± 1.068 | 29.3 ± 1.005 |
| Nutritional value (kcal/100 g) | 408.04 | 404.68 |
Publisher’s Note: MDPI stays neutral with regard to jurisdictional claims in published maps and institutional affiliations. |
© 2020 by the authors. Licensee MDPI, Basel, Switzerland. This article is an open access article distributed under the terms and conditions of the Creative Commons Attribution (CC BY) license (http://creativecommons.org/licenses/by/4.0/).
Share and Cite
Dumbrava, D.; Popescu, L.A.; Soica, C.M.; Nicolin, A.; Cocan, I.; Negrea, M.; Alexa, E.; Obistioiu, D.; Radulov, I.; Popescu, S.; et al. Nutritional, Antioxidant, Antimicrobial, and Toxicological Profile of Two Innovative Types of Vegan, Sugar-Free Chocolate. Foods 2020, 9, 1844. https://doi.org/10.3390/foods9121844
Dumbrava D, Popescu LA, Soica CM, Nicolin A, Cocan I, Negrea M, Alexa E, Obistioiu D, Radulov I, Popescu S, et al. Nutritional, Antioxidant, Antimicrobial, and Toxicological Profile of Two Innovative Types of Vegan, Sugar-Free Chocolate. Foods. 2020; 9(12):1844. https://doi.org/10.3390/foods9121844
Chicago/Turabian StyleDumbrava, Delia, Liviana Alexandra Popescu, Codruța Marinela Soica, Alma Nicolin, Ileana Cocan, Monica Negrea, Ersilia Alexa, Diana Obistioiu, Isidora Radulov, Sofia Popescu, and et al. 2020. "Nutritional, Antioxidant, Antimicrobial, and Toxicological Profile of Two Innovative Types of Vegan, Sugar-Free Chocolate" Foods 9, no. 12: 1844. https://doi.org/10.3390/foods9121844
APA StyleDumbrava, D., Popescu, L. A., Soica, C. M., Nicolin, A., Cocan, I., Negrea, M., Alexa, E., Obistioiu, D., Radulov, I., Popescu, S., Watz, C., Ghiulai, R., Mioc, A., Szuhanek, C., Sinescu, C., & Dehelean, C. (2020). Nutritional, Antioxidant, Antimicrobial, and Toxicological Profile of Two Innovative Types of Vegan, Sugar-Free Chocolate. Foods, 9(12), 1844. https://doi.org/10.3390/foods9121844