Prediction of the Limiting Flux and Its Correlation with the Reynolds Number during the Microfiltration of Skim Milk Using an Improved Model

 ,
,  ,
,  , ,
, ,  ,
,
Abstract
1. Introduction
2. Materials and Methods
2.1. Materials
2.2. Experimental Runs
2.3. Mathematical Modeling and JL Prediction
2.4. Chemical Analysis
2.5. Statistical Analyses
3. Results
3.1. Flux Versus ΔPT Curves: Effect of the Processing Conditions
3.2. Effect of the Processing Conditions on the Protein Stability and Rejection
3.3. Modified Exponential Model for JL Prediction
3.4. Effect of the dh on the JL
3.5. Effect of the dh on the Relationship between JL and Re
4. Conclusions
Supplementary Materials
Author Contributions
Funding
Acknowledgments
Conflicts of Interest
References
- Brans, G.; Schroën, C.G.P.H.; van der Sman, R.G.M.; Boom, R.M. Membrane fractionation of milk: State of the art and challenges. J. Memb. Sci. 2004, 243, 263–272. [Google Scholar] [CrossRef]
- Skrzypek, M.; Burger, M. Isoflux® ceramic membranes-Practical experiences in dairy industry. Desalination 2010, 250, 1095–1100. [Google Scholar] [CrossRef]
- Heino, A.T.; Uusi-Rauva, J.; Rantamäki, P.R.; Tossavainen, O. Functional properties of native and cheese whey protein concentrate powders. Int. J. Dairy Technol. 2007, 60, 277–285. [Google Scholar] [CrossRef]
- Jørgensen, C.E.; Abrahamsen, R.K.; Rukke, E.-O.; Johansen, A.-G.; Schüller, R.B.; Skeie, S.B. Optimization of protein fractionation by skim milk microfiltration: Choice of ceramic membrane pore size and filtration temperature. J. Dairy Sci. 2016, 99, 6164–6179. [Google Scholar] [CrossRef] [PubMed]
- Green, G.; Belfort, G. Fouling of ultrafiltration membranes: Lateral migration and the particle trajectory model. Desalination 1980, 35, 129–147. [Google Scholar] [CrossRef]
- Baruah, G.L.; Couto, D.; Belfort, G. A predictive aggregate transport model for microfiltration of combined macromolecular solutions and poly-disperse suspensions: Testing model with transgenic goat milk. Biotechnol. Prog. 2003, 19, 1533–1540. [Google Scholar] [CrossRef] [PubMed]
- Zydney, A.L.; Colton, C.K. A concentration polarization model for the filtrate flux in cross-flow microfiltration of particulate suspensions. Chem. Eng. Commun. 1986, 47, 1–21. [Google Scholar] [CrossRef]
- Ould-Dris, A.; Jaffrin, M.Y.; Si-Hassen, D.; Neggaz, Y. Effect of cake thickness and particle polydispersity on prediction of permeate flux in microfiltration of particulate suspensions by a hydrodynamic diffusion model. J. Memb. Sci. 2000, 164, 211–227. [Google Scholar] [CrossRef]
- Hurt, E.E.; Adams, M.C.; Barbano, D.M. Microfiltration: Effect of retentate protein concentration on limiting flux and serum protein removal with 4-mm-channel ceramic microfiltration membranes1. J. Dairy Sci. 2015, 98, 2234–2244. [Google Scholar] [CrossRef]
- Baruah, G.L.; Belfort, G. A predictive aggregate transport model for microfiltration of combined macromolecular solutions and poly-disperse suspensions: Model development. Biotechnol. Prog. 2003, 19, 1524–1532. [Google Scholar] [CrossRef]
- Bacchin, P.; Aimar, P.; Field, R. Critical and sustainable fluxes: Theory, experiments and applications. J. Memb. Sci. 2006, 281, 42–69. [Google Scholar] [CrossRef]
- Field, R.W.; Wu, D.; Howell, J.A.; Gupta, B.B. Critical flux concept for microfiltration fouling. J. Memb. Sci. 1995, 100, 259–272. [Google Scholar] [CrossRef]
- Astudillo-Castro, C.L. Limiting flux and critical transmembrane pressure determination using an exponential model: The effect of concentration factor, temperature, and cross-flow velocity during casein micelle concentration by microfiltration. Ind. Eng. Chem. Res. 2015, 54, 414–425. [Google Scholar] [CrossRef]
- Córdova, A.; Astudillo, C.; Santibañez, L.; Cassano, A.; Ruby-Figueroa, R.; Illanes, A. Purification of galacto-oligosaccharides (GOS) by three-stage serial nanofiltration units under critical transmembrane pressure conditions. Chem. Eng. Res. Des. 2017, 117, 488–499. [Google Scholar] [CrossRef]
- Córdova, A.; Astudillo, C.; Giorno, L.; Guerrero, C.; Conidi, C.; Illanes, A.; Cassano, A. Nanofiltration potential for the purification of highly concentrated enzymatically produced oligosaccharides. Food Bioprod. Process. 2016, 98, 50–61. [Google Scholar] [CrossRef]
- Guerra, A.; Jonsson, G.; Rasmussen, A.; Nielsena, E.W.; Edelsten, D. Low cross-flow velocity microfiltration of skim milk for removal of bacterial spores. Int. Dairy J. 1997, 7, 849–861. [Google Scholar] [CrossRef]
- Springer, F.; Carretier, E.; Veyret, D.; Dhaler, D.; Moulin, P. Numerical and experimental methodology for the development of a new membrane prototype intended to microfiltration bioprocesses. Application to milk filtration. Chem. Eng. Process. Process Intensif. 2011, 50, 904–915. [Google Scholar] [CrossRef]
- Jaffrin, M.Y.; Ding, L.-H.; Akoum, O.; Brou, A. A hydrodynamic comparison between rotating disk and vibratory dynamic filtration systems. J. Memb. Sci. 2004, 242, 155–167. [Google Scholar] [CrossRef]
- Adams, M.C.; Hurt, E.E.; Barbano, D.M. Effect of ceramic membrane channel geometry and uniform transmembrane pressure on limiting flux and serum protein removal during skim milk microfiltration. J. Dairy Sci. 2015, 98, 7527–7543. [Google Scholar] [CrossRef]
- Hurt, E.E.; Adams, M.C.; Barbano, D.M. Microfiltration: Effect of channel diameter on limiting flux and serum protein removal. J. Dairy Sci. 2015, 98, 3599–3612. [Google Scholar] [CrossRef] [PubMed]
- Piry, A.; Heino, A.; Kühnl, W.; Grein, T.; Ripperger, S.; Kulozik, U. Effect of membrane length, membrane resistance, and filtration conditions on the fractionation of milk proteins by microfiltration. J. Dairy Sci. 2012, 95, 1590–1602. [Google Scholar] [CrossRef]
- Fontes, S.R. Mass transfer in microfiltration with laminar and turbulent flow of macromolecular solutions. J. Memb. Sci. 2005, 249, 207–211. [Google Scholar] [CrossRef]
- Adams, M.C.; Barbano, D.M. Effect of ceramic membrane channel diameter on limiting retentate protein concentration during skim milk microfiltration. J. Dairy Sci. 2016, 99, 167–182. [Google Scholar] [CrossRef]
- Samuelsson, G.; Huisman, I.; Trägårdh, G.; Paulsson, M. Predicting limiting flux of skim milk in crossflow microfiltration. J. Memb. Sci. 1997, 129, 277–281. [Google Scholar] [CrossRef]
- Samuelsson, G.; Dejmek, P.; Trägårdh, G.; Paulsson, M. Minimizing whey protein retention in cross-flow microfiltration of skim milk. Int. Dairy J. 1997, 7, 237–242. [Google Scholar] [CrossRef]
- Cheryan, M. Ultrafiltration and Microfiltration Handbook; CRC Press: Boca Raton, FL, USA, 1998; ISBN 1566765986. [Google Scholar]
- Astudillo, C.; Parra, J.; González, S.; Cancino, B. A new parameter for membrane cleaning evaluation. Sep. Purif. Technol. 2010, 73, 286–293. [Google Scholar] [CrossRef]
- Koontz, L. TCA precipitation. Methods Enzymol. 2014, 541, 3–10. [Google Scholar] [CrossRef]
- Church, F.; Swaisgood, H.; Porter, D.; Catignani, G. Spectrophotometric assay using o-phthaldialdehyde for determination of proteolysis in milk and isolated milk proteins. J. Dairy Sci. 1983, 66, 1219–1227. [Google Scholar] [CrossRef]
- Suárez, E.; Lobo, A.; Álvarez, S.; Riera, F.A.; Álvarez, R. Partial demineralization of whey and milk ultrafiltration permeate by nanofiltration at pilot-plant scale. Desalination 2006, 198, 274–281. [Google Scholar] [CrossRef]
- Montgomery, D. Analysis and Experimental Design, 5th ed.; John Wiley & Sons: New Jersey, NJ, USA, 2001. [Google Scholar]
- Ryan, T.P. Modern Engineering Statistics; Wiley-Interscience: Hoboken, NJ, USA, 2007. [Google Scholar]
- Wu, D.; Howell, J.; Field, R. Critical flux measurement for model colloids. J. Memb. Sci. 1999, 152, 89–98. [Google Scholar] [CrossRef]
- Carić, M.; Milanović, S.; Krstić, D.; Tekić, M. Fouling of inorganic membranes by adsorption of whey proteins. J. Memb. Sci. 2000, 165, 83–88. [Google Scholar] [CrossRef]
- Nordin, A.-K.; Jönsson, A.-S. Flux decline along the flow channel in tubular ultrafiltration modules. Chem. Eng. Res. Des. 2009, 87, 1551–1561. [Google Scholar] [CrossRef]
- Bouchoux, A.; Cayemitte, P.-E.; Jardin, J.; Gésan-Guiziou, G.; Cabane, B. Casein micelle dispersions under osmotic stress. Biophys. J. 2009, 96, 693–706. [Google Scholar] [CrossRef]
- Bouchoux, A.; Qu, P.; Bacchin, P.; Gésan-Guiziou, G. A general approach for predicting the filtration of soft and permeable colloids: The milk example. Langmuir 2014, 30, 22–34. [Google Scholar] [CrossRef]
- Alexiadis, A.; Bao, J.; Fletcher, D.F.; Wiley, D.E.; Clements, D.J. Analysis of the dynamic response of a reverse osmosis membrane to time-dependent transmembrane pressure variation. Ind. Eng. Chem. Res. 2005, 44, 7823–7834. [Google Scholar] [CrossRef]
- Zhang, W.; Zhu, Z.; Jaffrin, M.; Ding, L. Hydraulic conditions on effluent quality, flux behavior, and energy consumption in a shear-enhanced membrane filtration using Box-Behnken response surface. Ind. Eng. Chem. Res. 2014, 53, 7176–7185. [Google Scholar] [CrossRef]
- Krstić, D.M.; Koris, A.K.; Tekić, M.N. Do static turbulence promoters have potential in cross-flow membrane filtration applications? Desalination 2006, 191, 371–375. [Google Scholar] [CrossRef]
- Lawrence, N.D.; Kentish, S.E.; O’Connor, A.J.; Barber, A.R.; Stevens, G.W. Microfiltration of skim milk using polymeric membranes for casein concentrate manufacture. Sep. Purif. Technol. 2008, 60, 237–244. [Google Scholar] [CrossRef]
- Hurt, E.; Zulewska, J.; Newbold, M.; Barbano, D.M. Micellar casein concentrate production with a 3X, 3-stage, uniform transmembrane pressure ceramic membrane process at 50 °C. J. Dairy Sci. 2010, 93, 5588–5600. [Google Scholar] [CrossRef]
- Gésan-Guiziou, G.; Daufin, G.; Boyaval, E.; Le Berre, O. Wall shear stress: Effective parameter for the characterisation of the cross-flow transport in turbulent regime during skimmed milk microfiltration. Lait 1999, 79, 347–354. [Google Scholar] [CrossRef]
- Le Berre, O.; Daufin, G. Skimmilk crossflow microfiltration performance versus permeation flux to wall shear stress ratio. J. Memb. Sci. 1996, 117, 261–270. [Google Scholar] [CrossRef]
- Zhen, X.; Yu, S.; Wang, B.; Zheng, H. Flux enhancement during ultrafiltration of produced water using turbulence promoter. J. Environ. Sci. 2006, 18, 1077–1081. [Google Scholar] [CrossRef]
- Krstić, D.M.; Tekić, M.N.; Carić, M.D.; Milanović, S.D. The effect of turbulence promoter on cross-flow microfiltration of skim milk. J. Memb. Sci. 2002, 208, 303–314. [Google Scholar] [CrossRef]
- Krstic, D.M.; Tekic, M.N.; Caric, M.D.; Milanovic, S.D. Static turbulence promoter in cross-flow microfiltration of skim milk. Desalination 2004, 163, 297–309. [Google Scholar] [CrossRef]
- Pafylias, I.; Cheryan, M.; Mehaia, M.; Saglam, N. Microfiltration of milk with ceramic membranes. Food Res. Int. 1996, 29, 141–146. [Google Scholar] [CrossRef]
- Mulder, M. Basic Principles of Membrane Technology; Springer: Amsterdam, The Netherlands, 1996; ISBN 978-0-7923-4248-9. [Google Scholar]


| Pump | ΔPT Working Range (bar) | Average Flow, Q (L/min) | Average Cross Flow CFV (m/s) | ||
|---|---|---|---|---|---|
| dh = 2 mm (7 Channels) | dh = 3.6 mm (3 Channels) | dh = 6 mm (1 Channel) | |||
| 0711 | 0.02–0.7 | 2.01 * | 1.52 | 1.10 | 1.18 |
| 2511 | 0.1–1.5 | 5.31 * | 4.02 | 2.90 | 3.13 |
| 411 | 0.1–1.8 | 7.85 * | 5.95 | 4.28 | 4.63 |
| Total Protein (% w/w) | 1.5 | 3 | 4.5 | 9 | Temperature (°C) |
|---|---|---|---|---|---|
| Concentration Factor | 0.5 | 1 | 1.5 | 3 | |
| Density (kg/m3) | 994.8 ± 3.5 | 1011.8 ± 6.1 | 1023.4 ± 1.5 | 1075.7 ± 4.4 | 40 |
| 990.7 ± 5.7 | 1007.7 ± 3.7 | 1021.8 ± 3.1 | 50 | ||
| 986.0 ± 6.3 | 1002.9 ± 2.8 | 1015.4 ± 0.7 | 1073.2 ± 3.2 | 60 | |
| Viscosity (cP) | 0.912 ± 0.010 | 1.231 ± 0.014 | 1.525 ± 0.009 | 3.904 ± 0.022 | 40 |
| 0.861 ± 0.010 | 1.108 ± 0.013 | 1.288 ± 0.008 | 50 | ||
| 0.809 ± 0.013 | 0.986 ± 0.009 | 1.051 ± 0.011 | 2.490 ± 0.018 | 60 |
| T (°C) | CF | Q (L/min) | dh (mm) | JL (L/m2/h) | (ΔPT)C (bar) | (ΔPT)Min(bar) | R2 | RMSE | Figure |
|---|---|---|---|---|---|---|---|---|---|
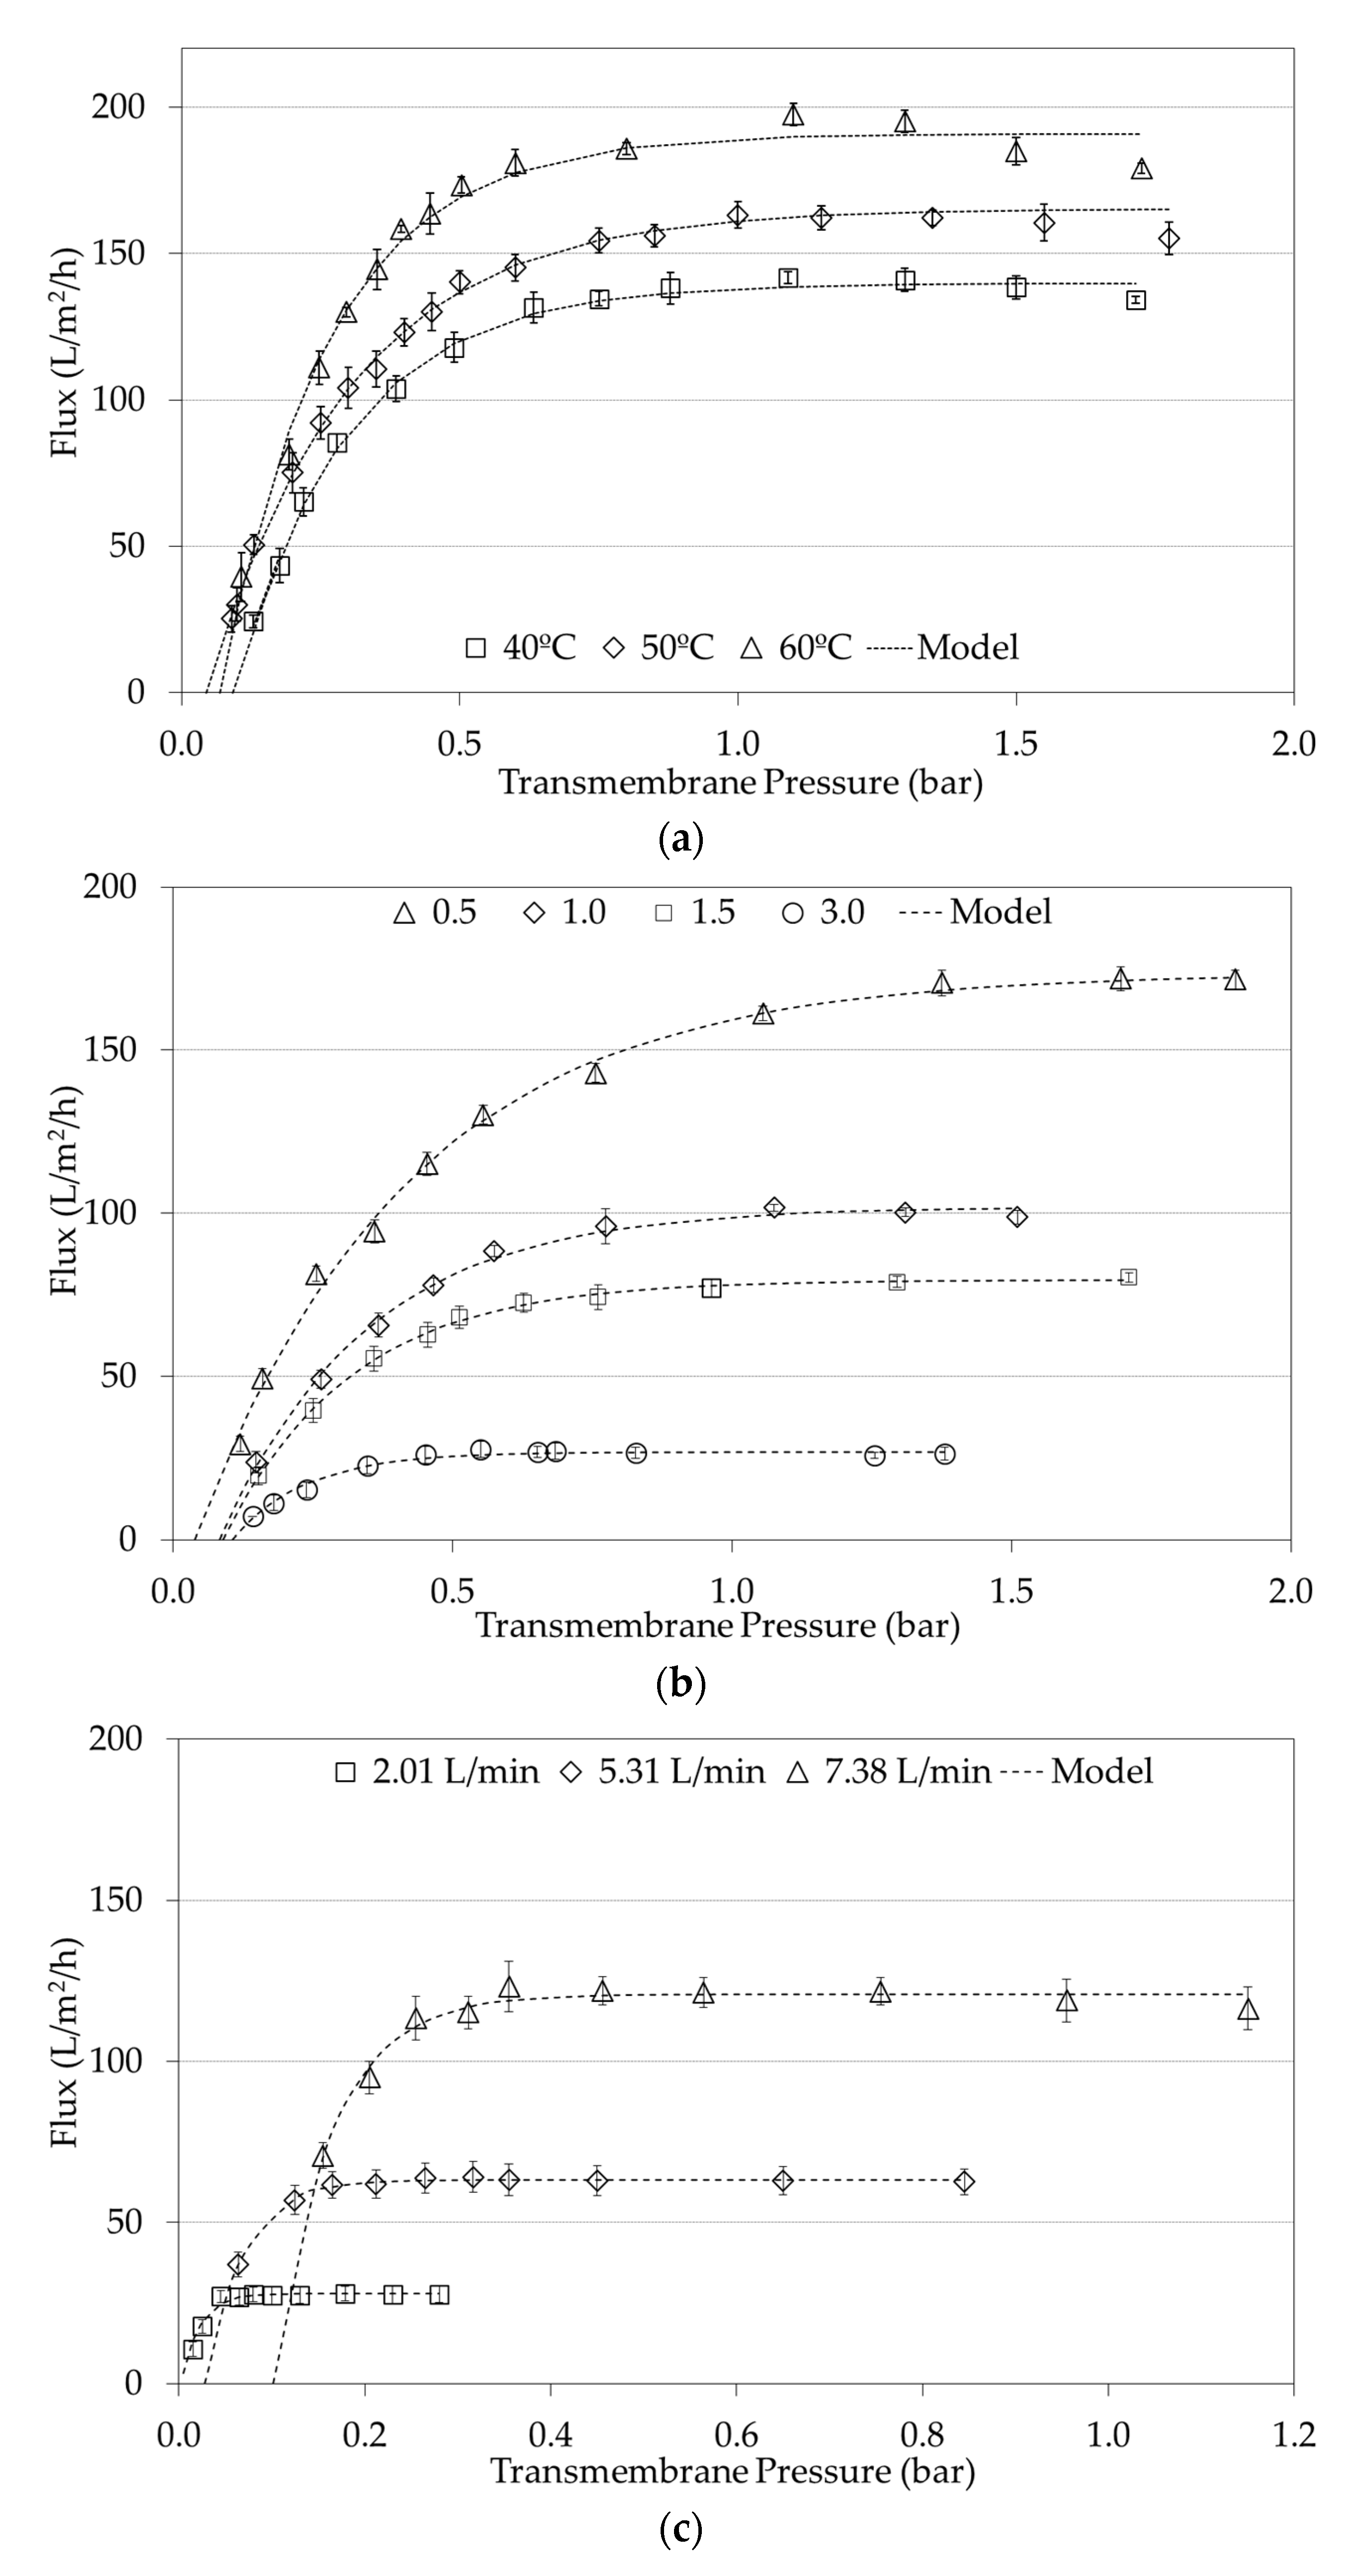
| 40 | 0.5 | 7.38 | 6 | 139.7 | 0.299 | 0.092 | 99.95 | 2.44 | 3a |
| 50 | 0.5 | 7.38 | 6 | 165.3 | 0.303 | 0.045 | 99.51 | 1.83 | 3a |
| 60 | 0.5 | 7.38 | 6 | 190.8 | 0.266 | 0.068 | 98.61 | 5.3 | 3a |
| 60 | 0.5 | 7.38 | 3.6 | 173.7 | 0.383 | 0.039 | 99.95 | 3.04 | 3b |
| 60 | 1.0 | 7.38 | 3.6 | 101.8 | 0.264 | 0.083 | 99.96 | 1.61 | 3b |
| 60 | 1.5 | 7.38 | 3.6 | 79.5 | 0.230 | 0.089 | 99.87 | 0.71 | 3b |
| 60 | 3.0 | 7.38 | 3.6 | 26.7 | 0.131 | 0.106 | 97.52 | 1.01 | 3b |
| 60 | 1.5 | 2.01 | 2 | 27.90 | 0.022 | 0.003 | 98.67 | 0.83 | 3c |
| 60 | 1.5 | 5.31 | 2 | 63.31 | 0.069 | 0.028 | 99.99 | 0.54 | 3c |
| 60 | 1.5 | 7.38 | 2 | 120.8 | 0.163 | 0.102 | 97.34 | 2.70 | 3c |
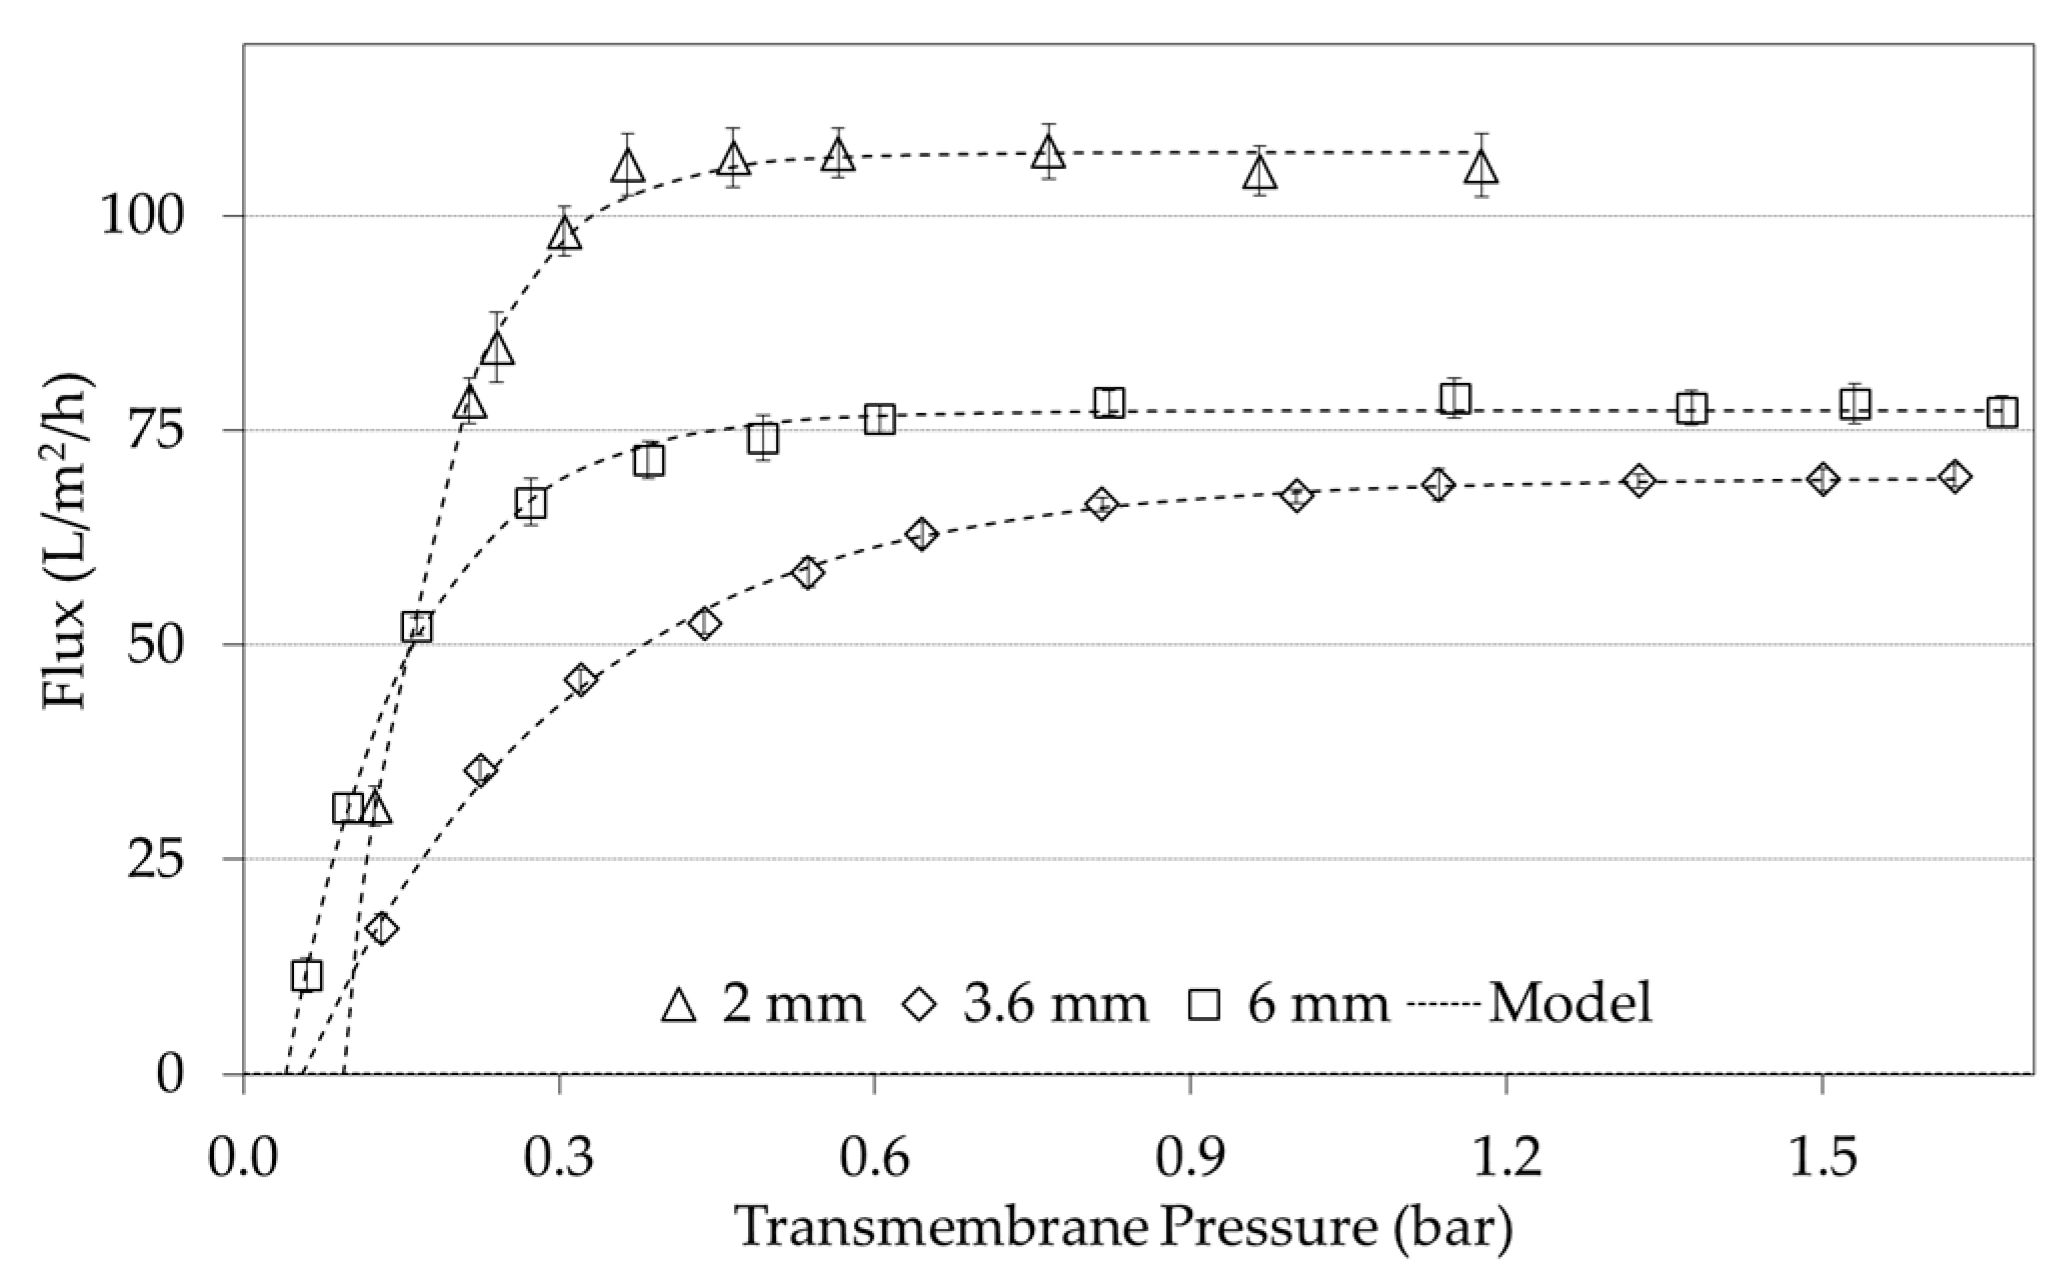
| 50 | 1.5 | 7.38 | 2 | 107.4 | 0.184 | 0.095 | 99.47 | 1.66 | 5 |
| 50 | 1.5 | 7.38 | 3.6 | 69.5 | 0.309 | 0.056 | 99.70 | 1.00 | 5 |
| 50 | 1.5 | 7.38 | 6 | 77.4 | 0.157 | 0.040 | 99.77 | 1.01 | 5 |
| Membrane and Experimental Conditions | Equation | Reference | ||
|---|---|---|---|---|
| Ceramic 0.14 μm; dh = 6 mm; L = 138 mm, Skim milk MF. Data (n = 8) was adjusted to an empirical relation. | JL (m/s) = 6.94·10−10·Re | [24] | ||
| Ceramic 0.14 μm; dh = 6 mm; v = 1.5–8 m/s; T = 15 and 55 °C, Skim milk MF. (Length no reported, but the filtration area was 26 cm2, implying L = 138 mm). Data (n = 8) was adjusted to an empirical relation. | JL (L/(m2·h)) = 0.0025 Re | [25] | ||
| Ceramics (0.05, 0.1 and 0.2 µm); T = 50 °C, Skim milk MF; v ≥ 0.45 m/s, with and without turbulence promoters; ΔPT = 65 kPa. L = 250 mm and dh = 6.8 mm. Data was adjusted to an empirical relation. | J α Re0.15 | Re < 2700 | Without turbulence promoter | [46] |
| J α Re0.80 | Re > 2700 | |||
| J α Re0.85 | Re > 2000 | With turbulence promoter | ||
| Ceramics 0.1 µm (3 mm dh ceramic graded permeability and 4 mm dh); T = 50 °C. Milk with different total protein concentrations (8–9–10%). L = 1.02 m. Data was adjusted to an empirical relation. | JL (kg/m2/h) = 0.00764·Re Only for the 4 mm dh membrane using n = 9. | [20] | ||
|
JL (kg/m2/h) = 3.07·10−5 ReLength based where ReLength based is a modified Re as follows: where L is the membrane length, which is 1.02 m for both membranes. In this case n = 18. | ||||
| Hydraulic Diameter | Range | Equation | Determination Coefficient (R2) | RSME |
|---|---|---|---|---|
| dh = 2 mm | 2653 < Re < 12234 | JL = (5.81·10−7·Re + 6.20·10−3) Re | 81.73% | 19.72 |
| JL = 0.01204·Re | 77.46% | 21.91 | ||
| dh = 3.6 mm | 2658 < Re < 18773 | JL = (3.17·10−7·Re + 2.38·10−3)·Re | 95.23% | 9.77 |
| JL = 0.00681·Re | 86.10% | 16.69 | ||
| dh = 6 mm | 4752 < Re < 33846 | JL = (8.95·10−8·Re + 2.23·10−3)·Re | 95.33% | 11.10 |
| JL = 0.00451·Re | 89.46% | 16.68 |
Publisher’s Note: MDPI stays neutral with regard to jurisdictional claims in published maps and institutional affiliations. |
© 2020 by the authors. Licensee MDPI, Basel, Switzerland. This article is an open access article distributed under the terms and conditions of the Creative Commons Attribution (CC BY) license (http://creativecommons.org/licenses/by/4.0/).
Share and Cite
Astudillo-Castro, C.; Cordova, A.; Oyanedel-Craver, V.; Soto-Maldonado, C.; Valencia, P.; Henriquez, P.; Jimenez-Flores, R. Prediction of the Limiting Flux and Its Correlation with the Reynolds Number during the Microfiltration of Skim Milk Using an Improved Model. Foods 2020, 9, 1621. https://doi.org/10.3390/foods9111621
Astudillo-Castro C, Cordova A, Oyanedel-Craver V, Soto-Maldonado C, Valencia P, Henriquez P, Jimenez-Flores R. Prediction of the Limiting Flux and Its Correlation with the Reynolds Number during the Microfiltration of Skim Milk Using an Improved Model. Foods. 2020; 9(11):1621. https://doi.org/10.3390/foods9111621
Chicago/Turabian StyleAstudillo-Castro, Carolina, Andrés Cordova, Vinka Oyanedel-Craver, Carmen Soto-Maldonado, Pedro Valencia, Paola Henriquez, and Rafael Jimenez-Flores. 2020. "Prediction of the Limiting Flux and Its Correlation with the Reynolds Number during the Microfiltration of Skim Milk Using an Improved Model" Foods 9, no. 11: 1621. https://doi.org/10.3390/foods9111621
APA StyleAstudillo-Castro, C., Cordova, A., Oyanedel-Craver, V., Soto-Maldonado, C., Valencia, P., Henriquez, P., & Jimenez-Flores, R. (2020). Prediction of the Limiting Flux and Its Correlation with the Reynolds Number during the Microfiltration of Skim Milk Using an Improved Model. Foods, 9(11), 1621. https://doi.org/10.3390/foods9111621