The Effect of Protein Source on the Physicochemical, Nutritional Properties and Microstructure of High-Protein Bars Intended for Physically Active People


Abstract
1. Introduction
2. Materials and Methods
2.1. Materials
2.2. Preparation of High-Protein Bars
2.3. Texture Profile Analysis (TPA)
2.4. Cutting Test
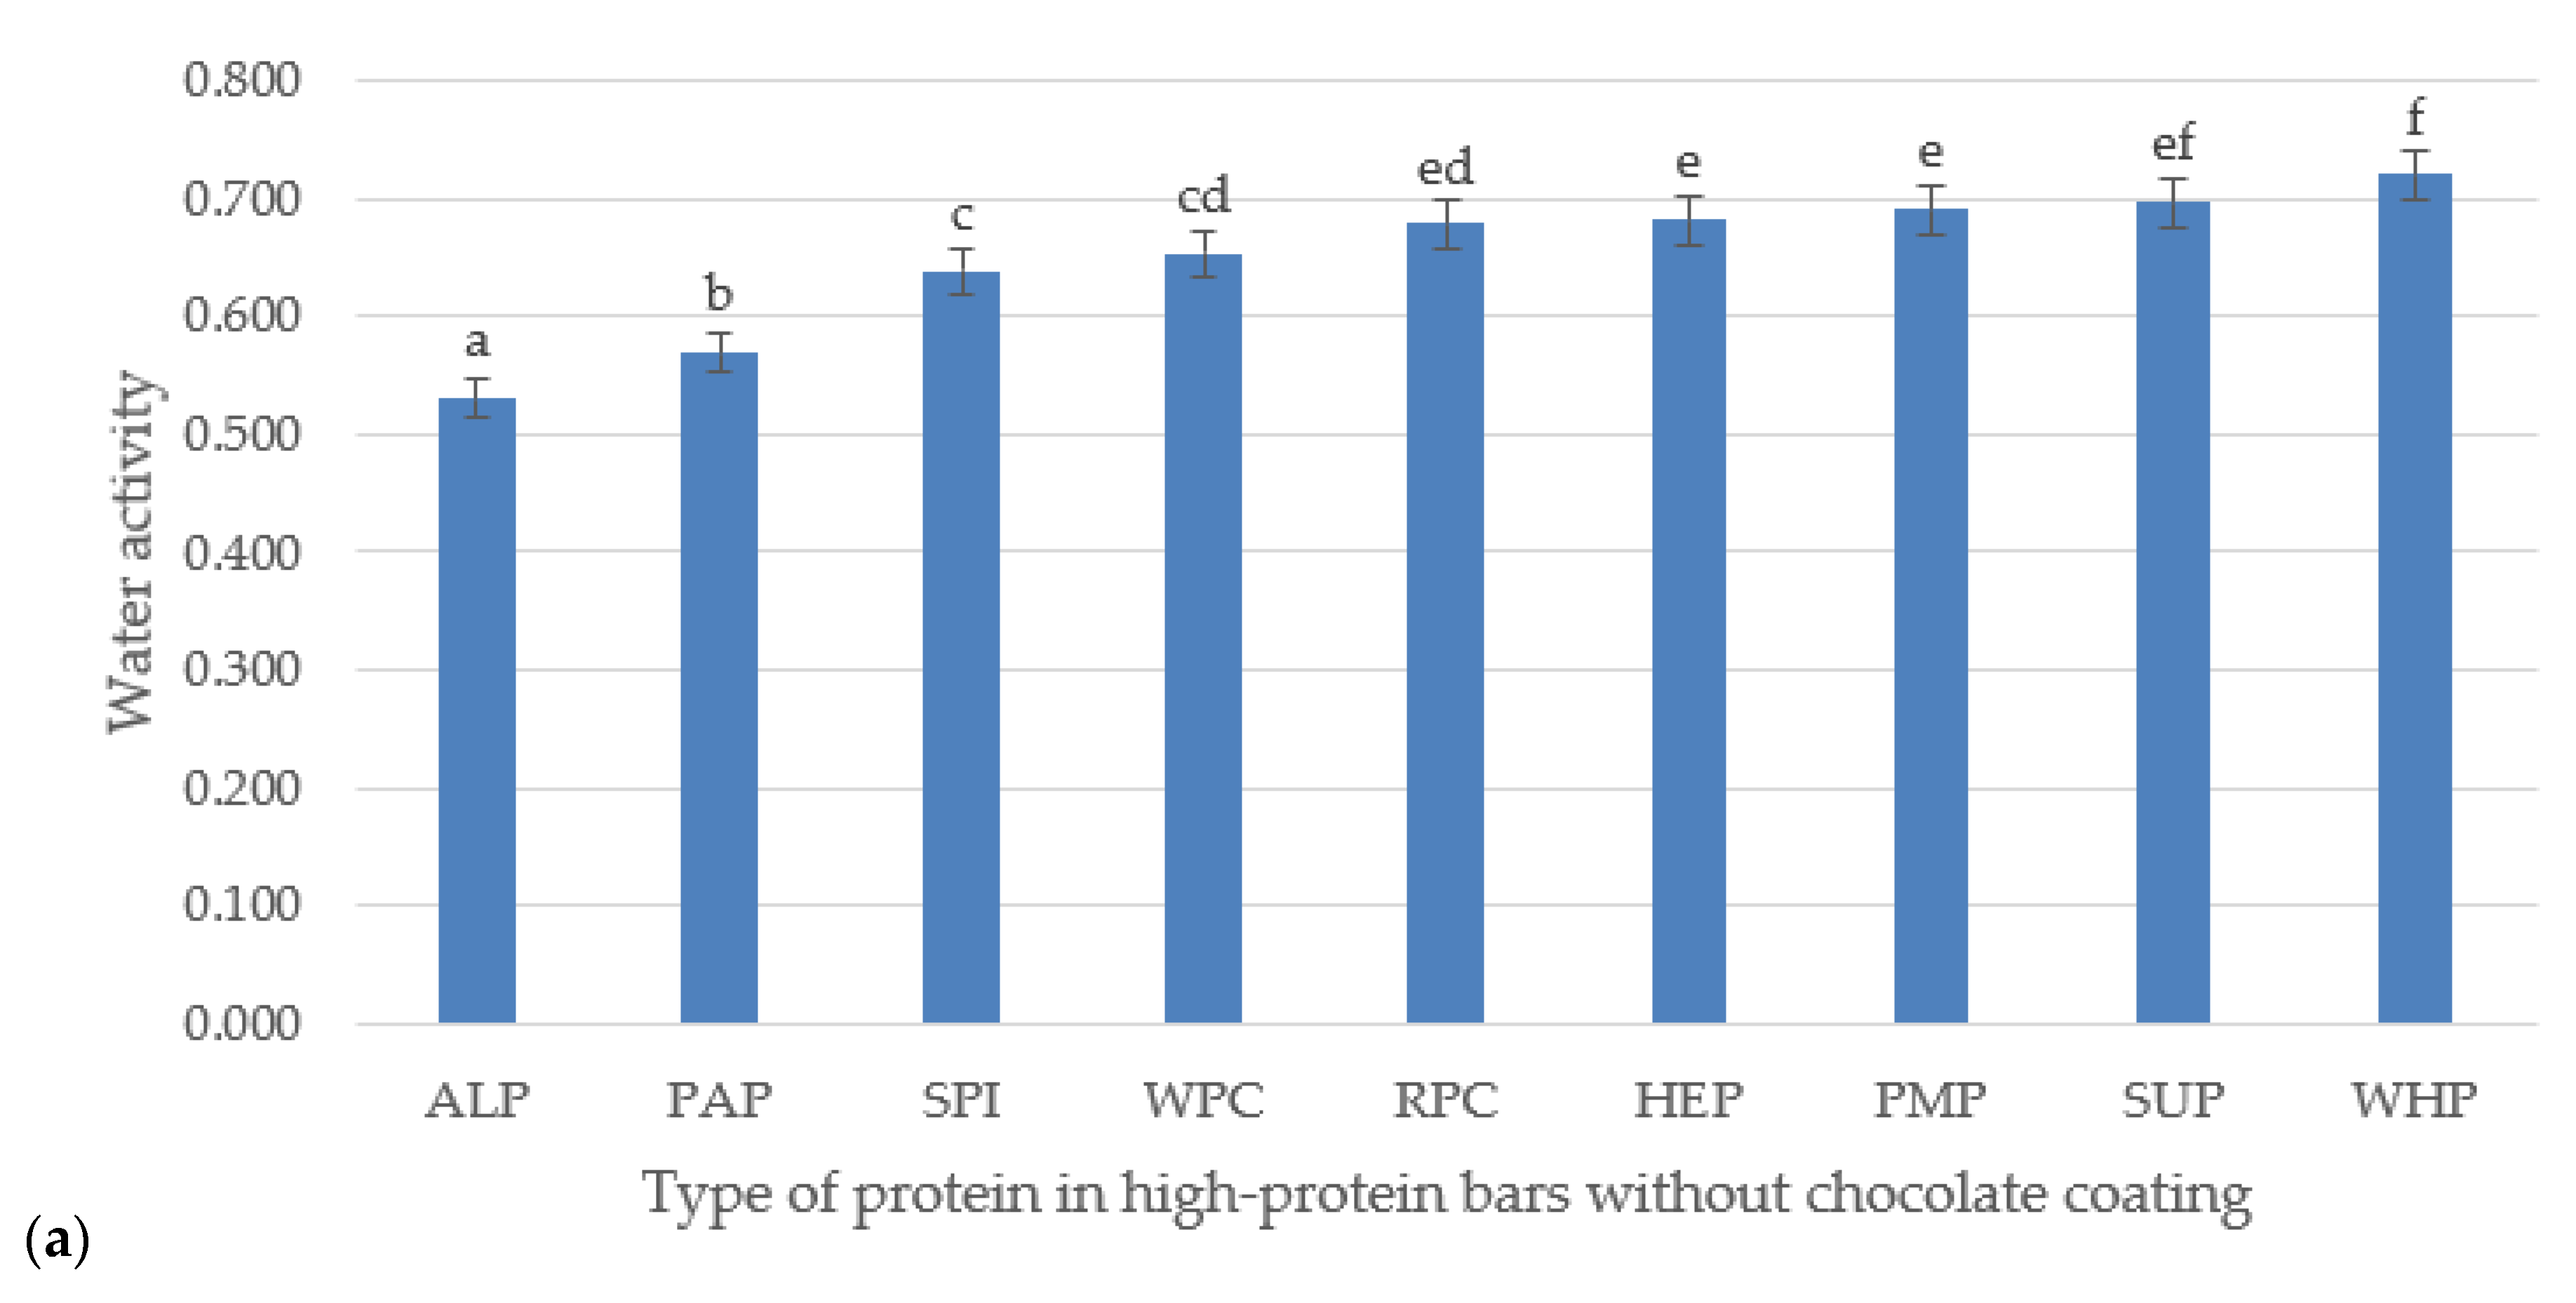
2.5. Water Activity
2.6. Computer Vision System (CVS) and Determining Color Differences
2.7. Ultrasonic Viscosity
2.8. Nutritional Value
2.9. Sensory Evaluation
2.10. Heavy Metals Analysis
2.11. Amino Acids Determination
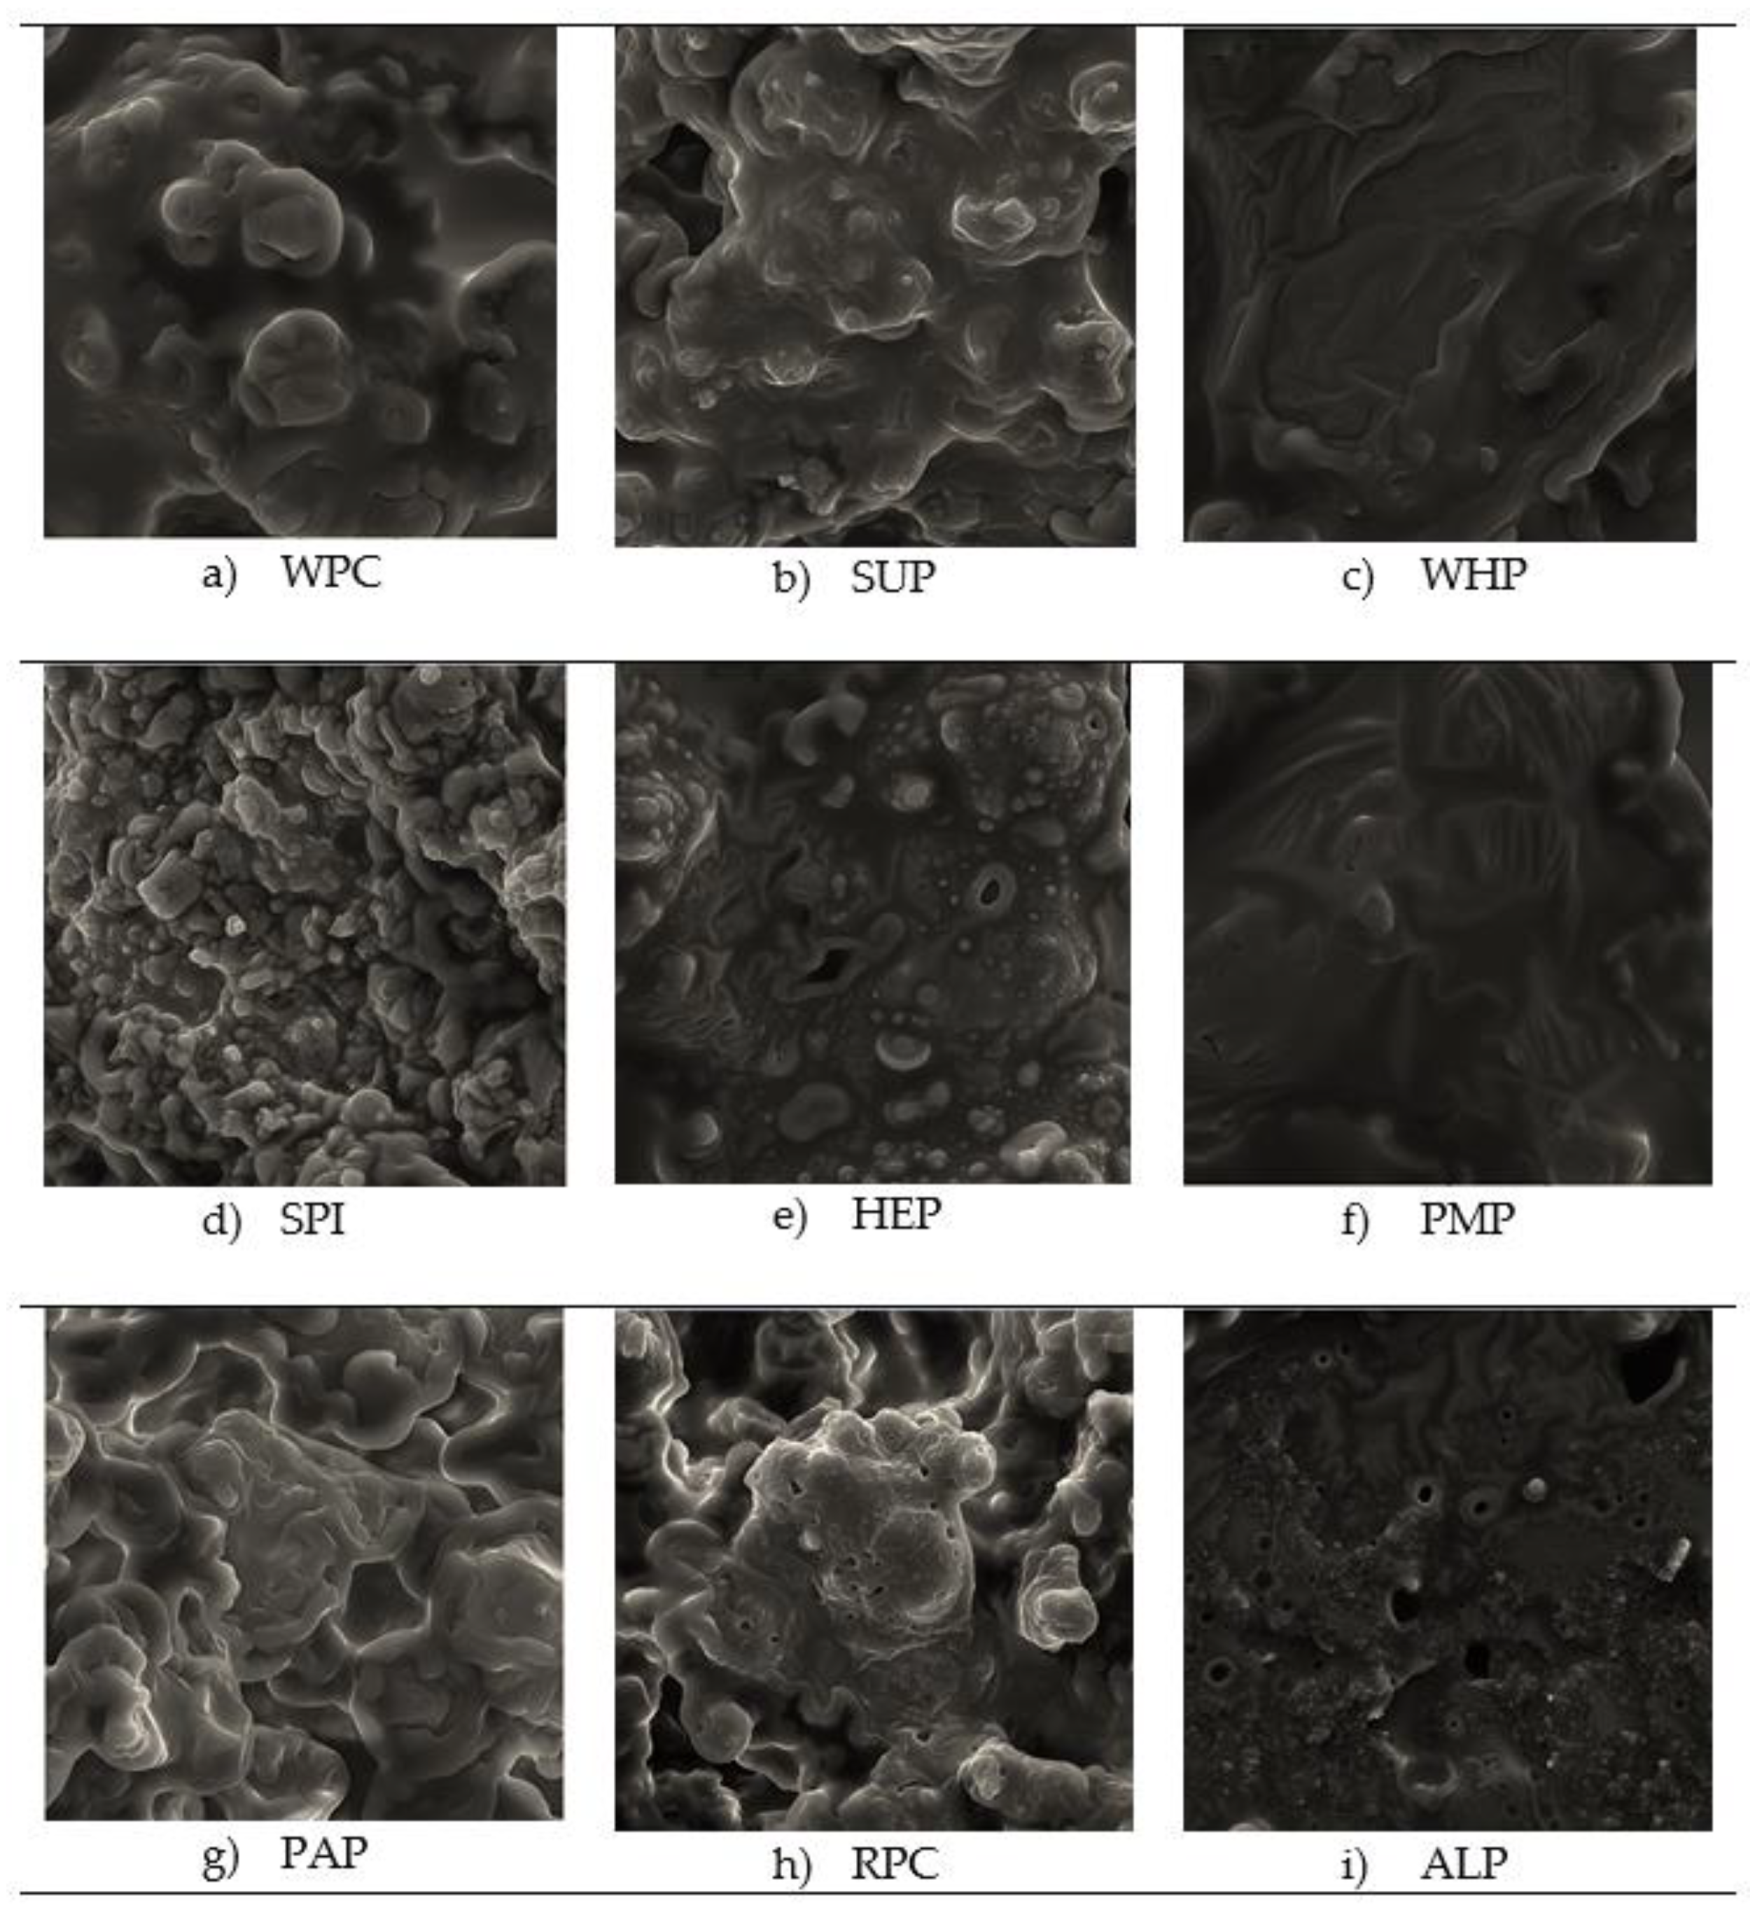
2.12. Scanning Electron Microscopy (SEM)
2.13. Statistical Analysis
3. Results and Discussion
3.1. Texture Profile Analysis (TPA), Cutting Test and Scanning Electron Microscopy (SEM)
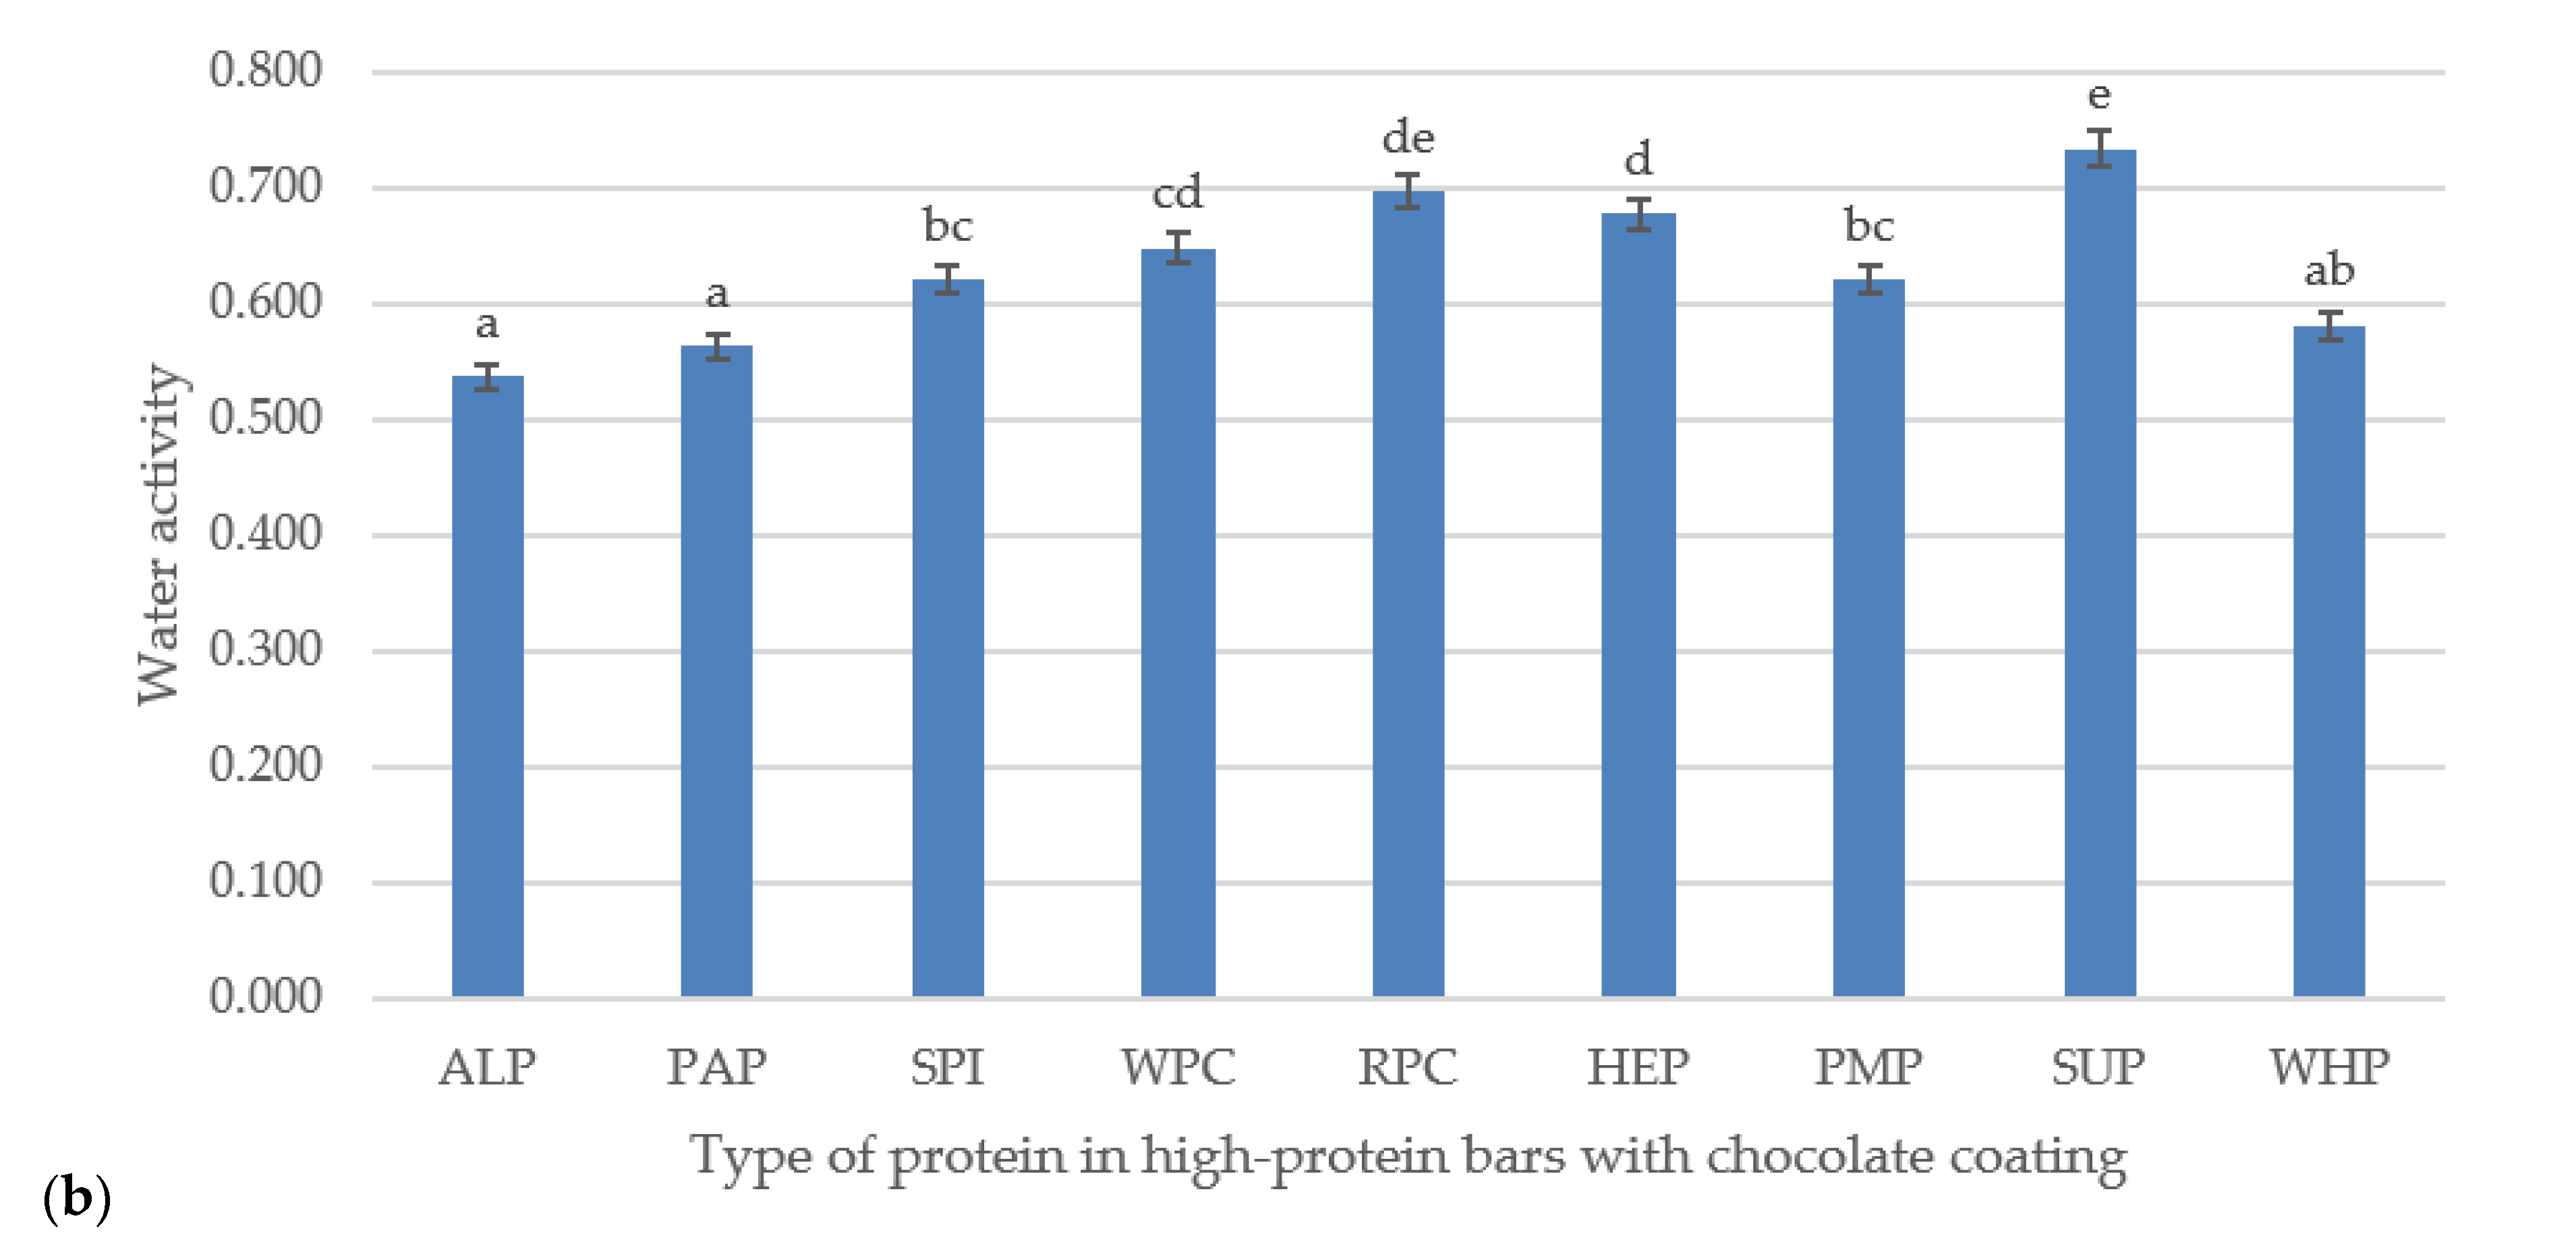
3.2. Water Activity
3.3. Color Differences Measured with Computer Vision System (CVS)
3.4. Ultrasonic Viscosity
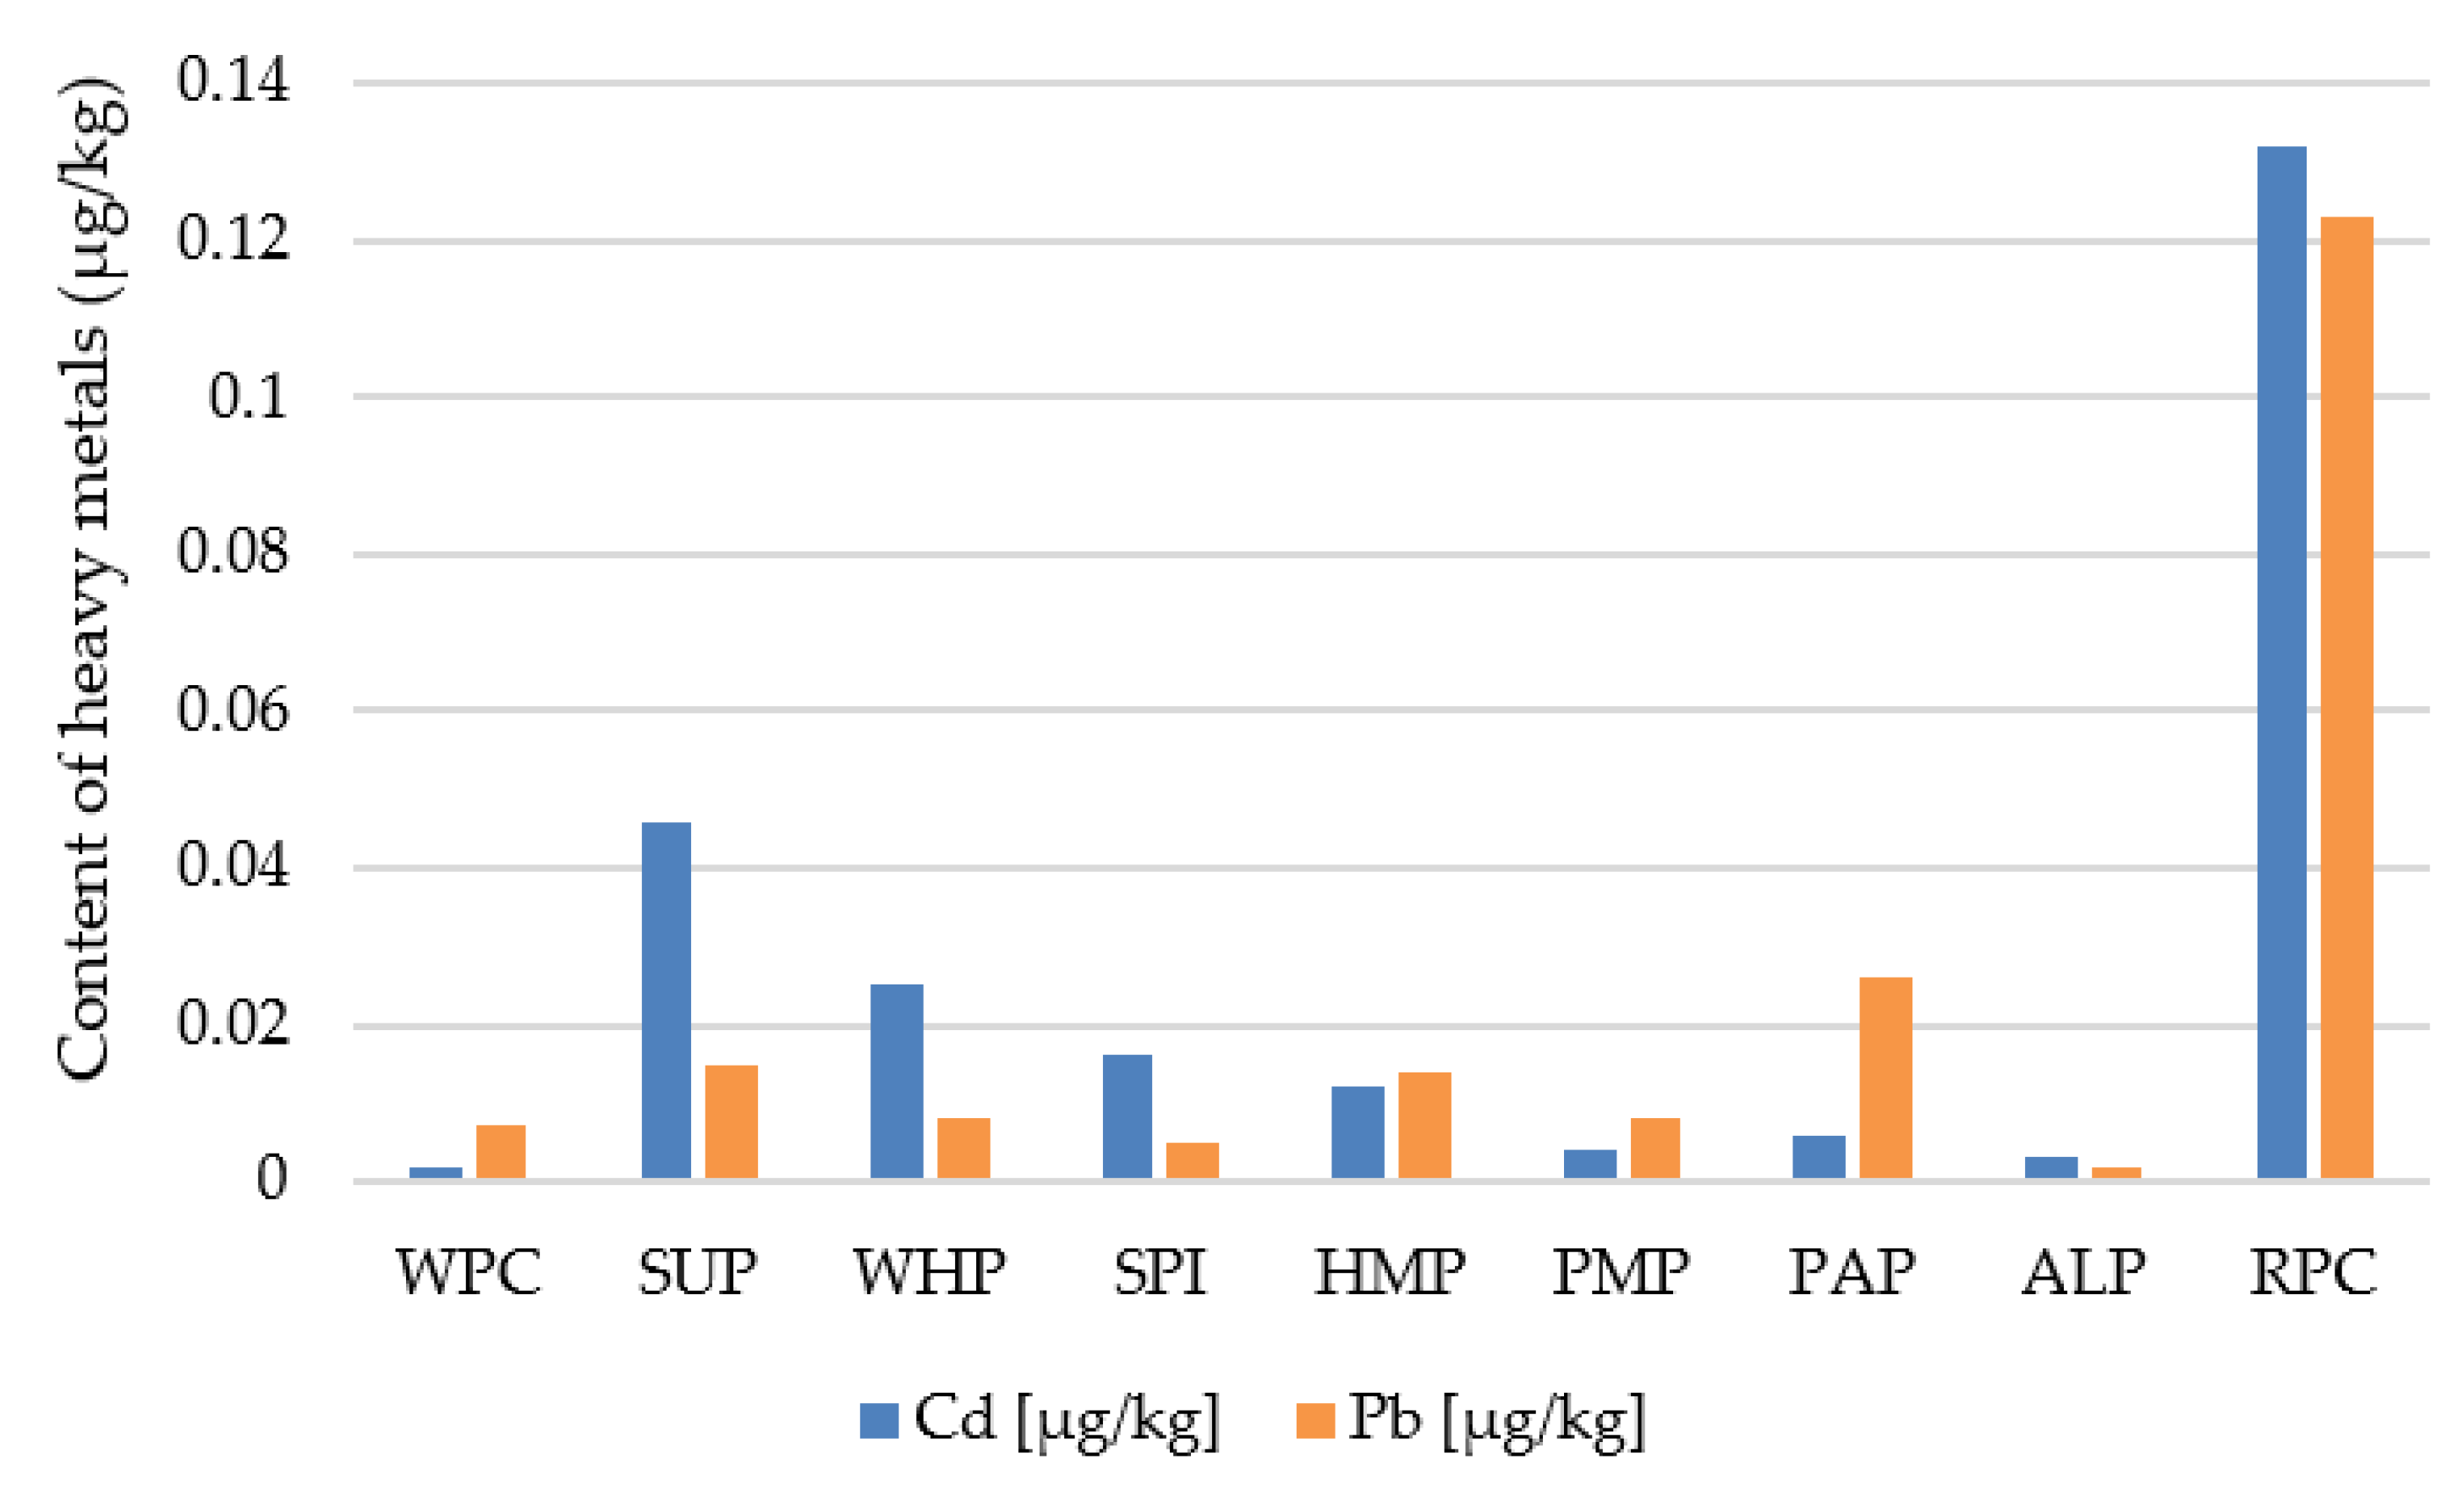
3.5. Heavy Metals Analysis
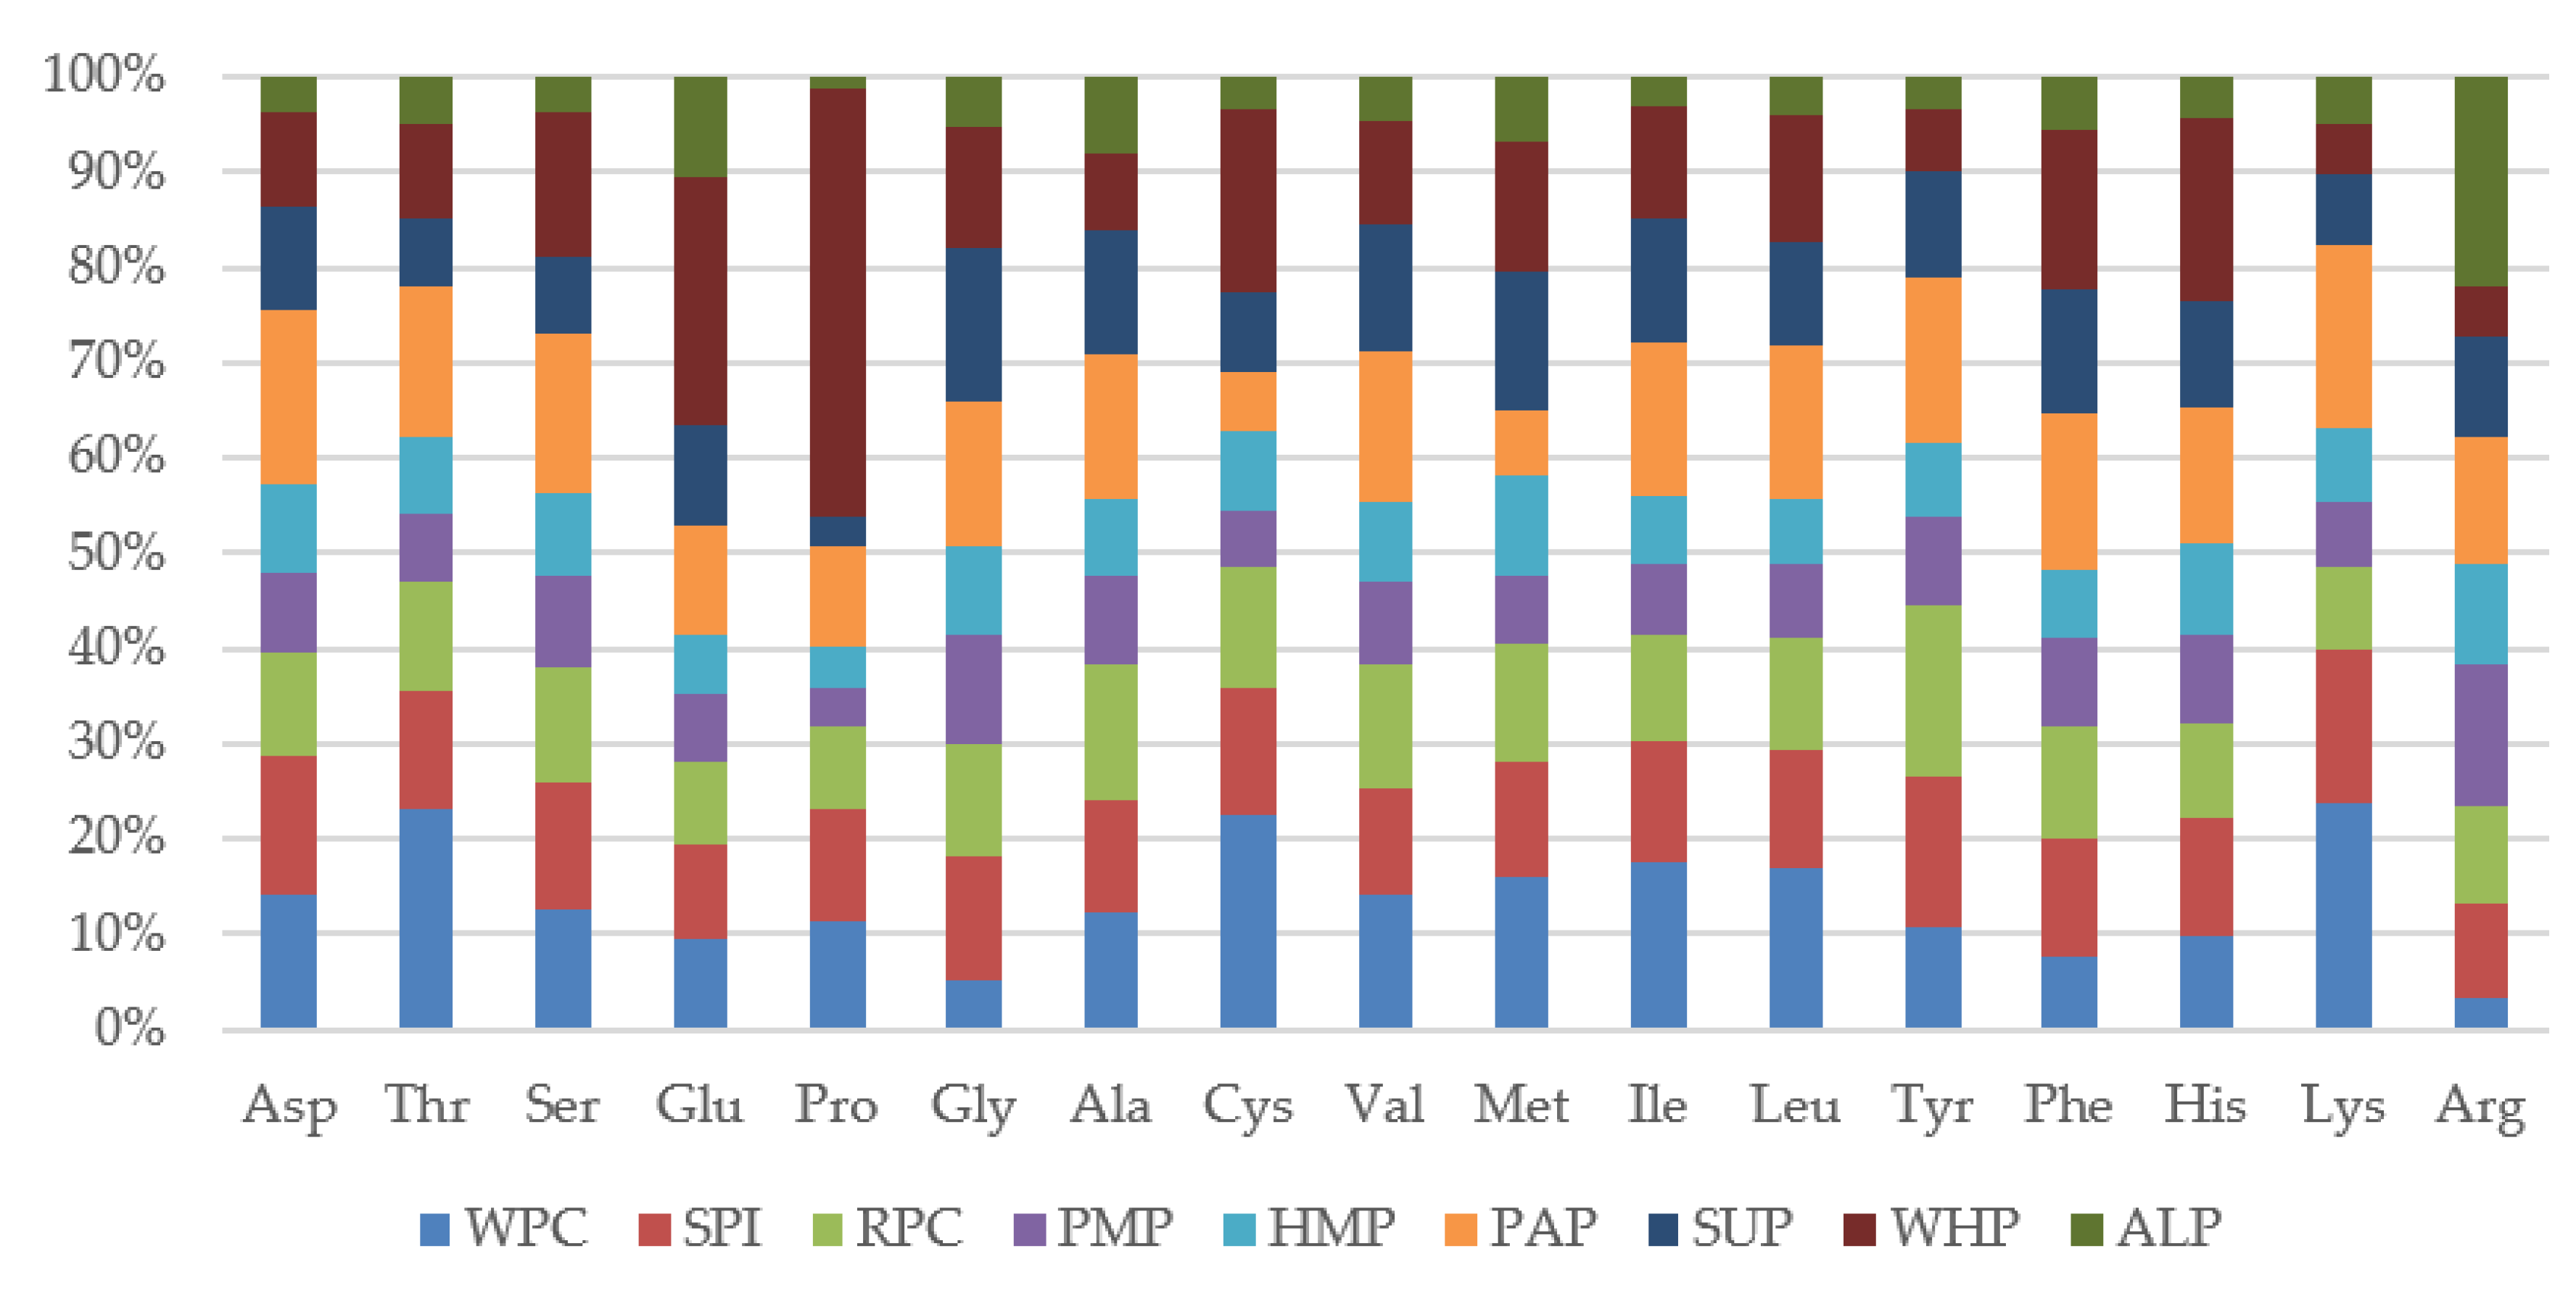
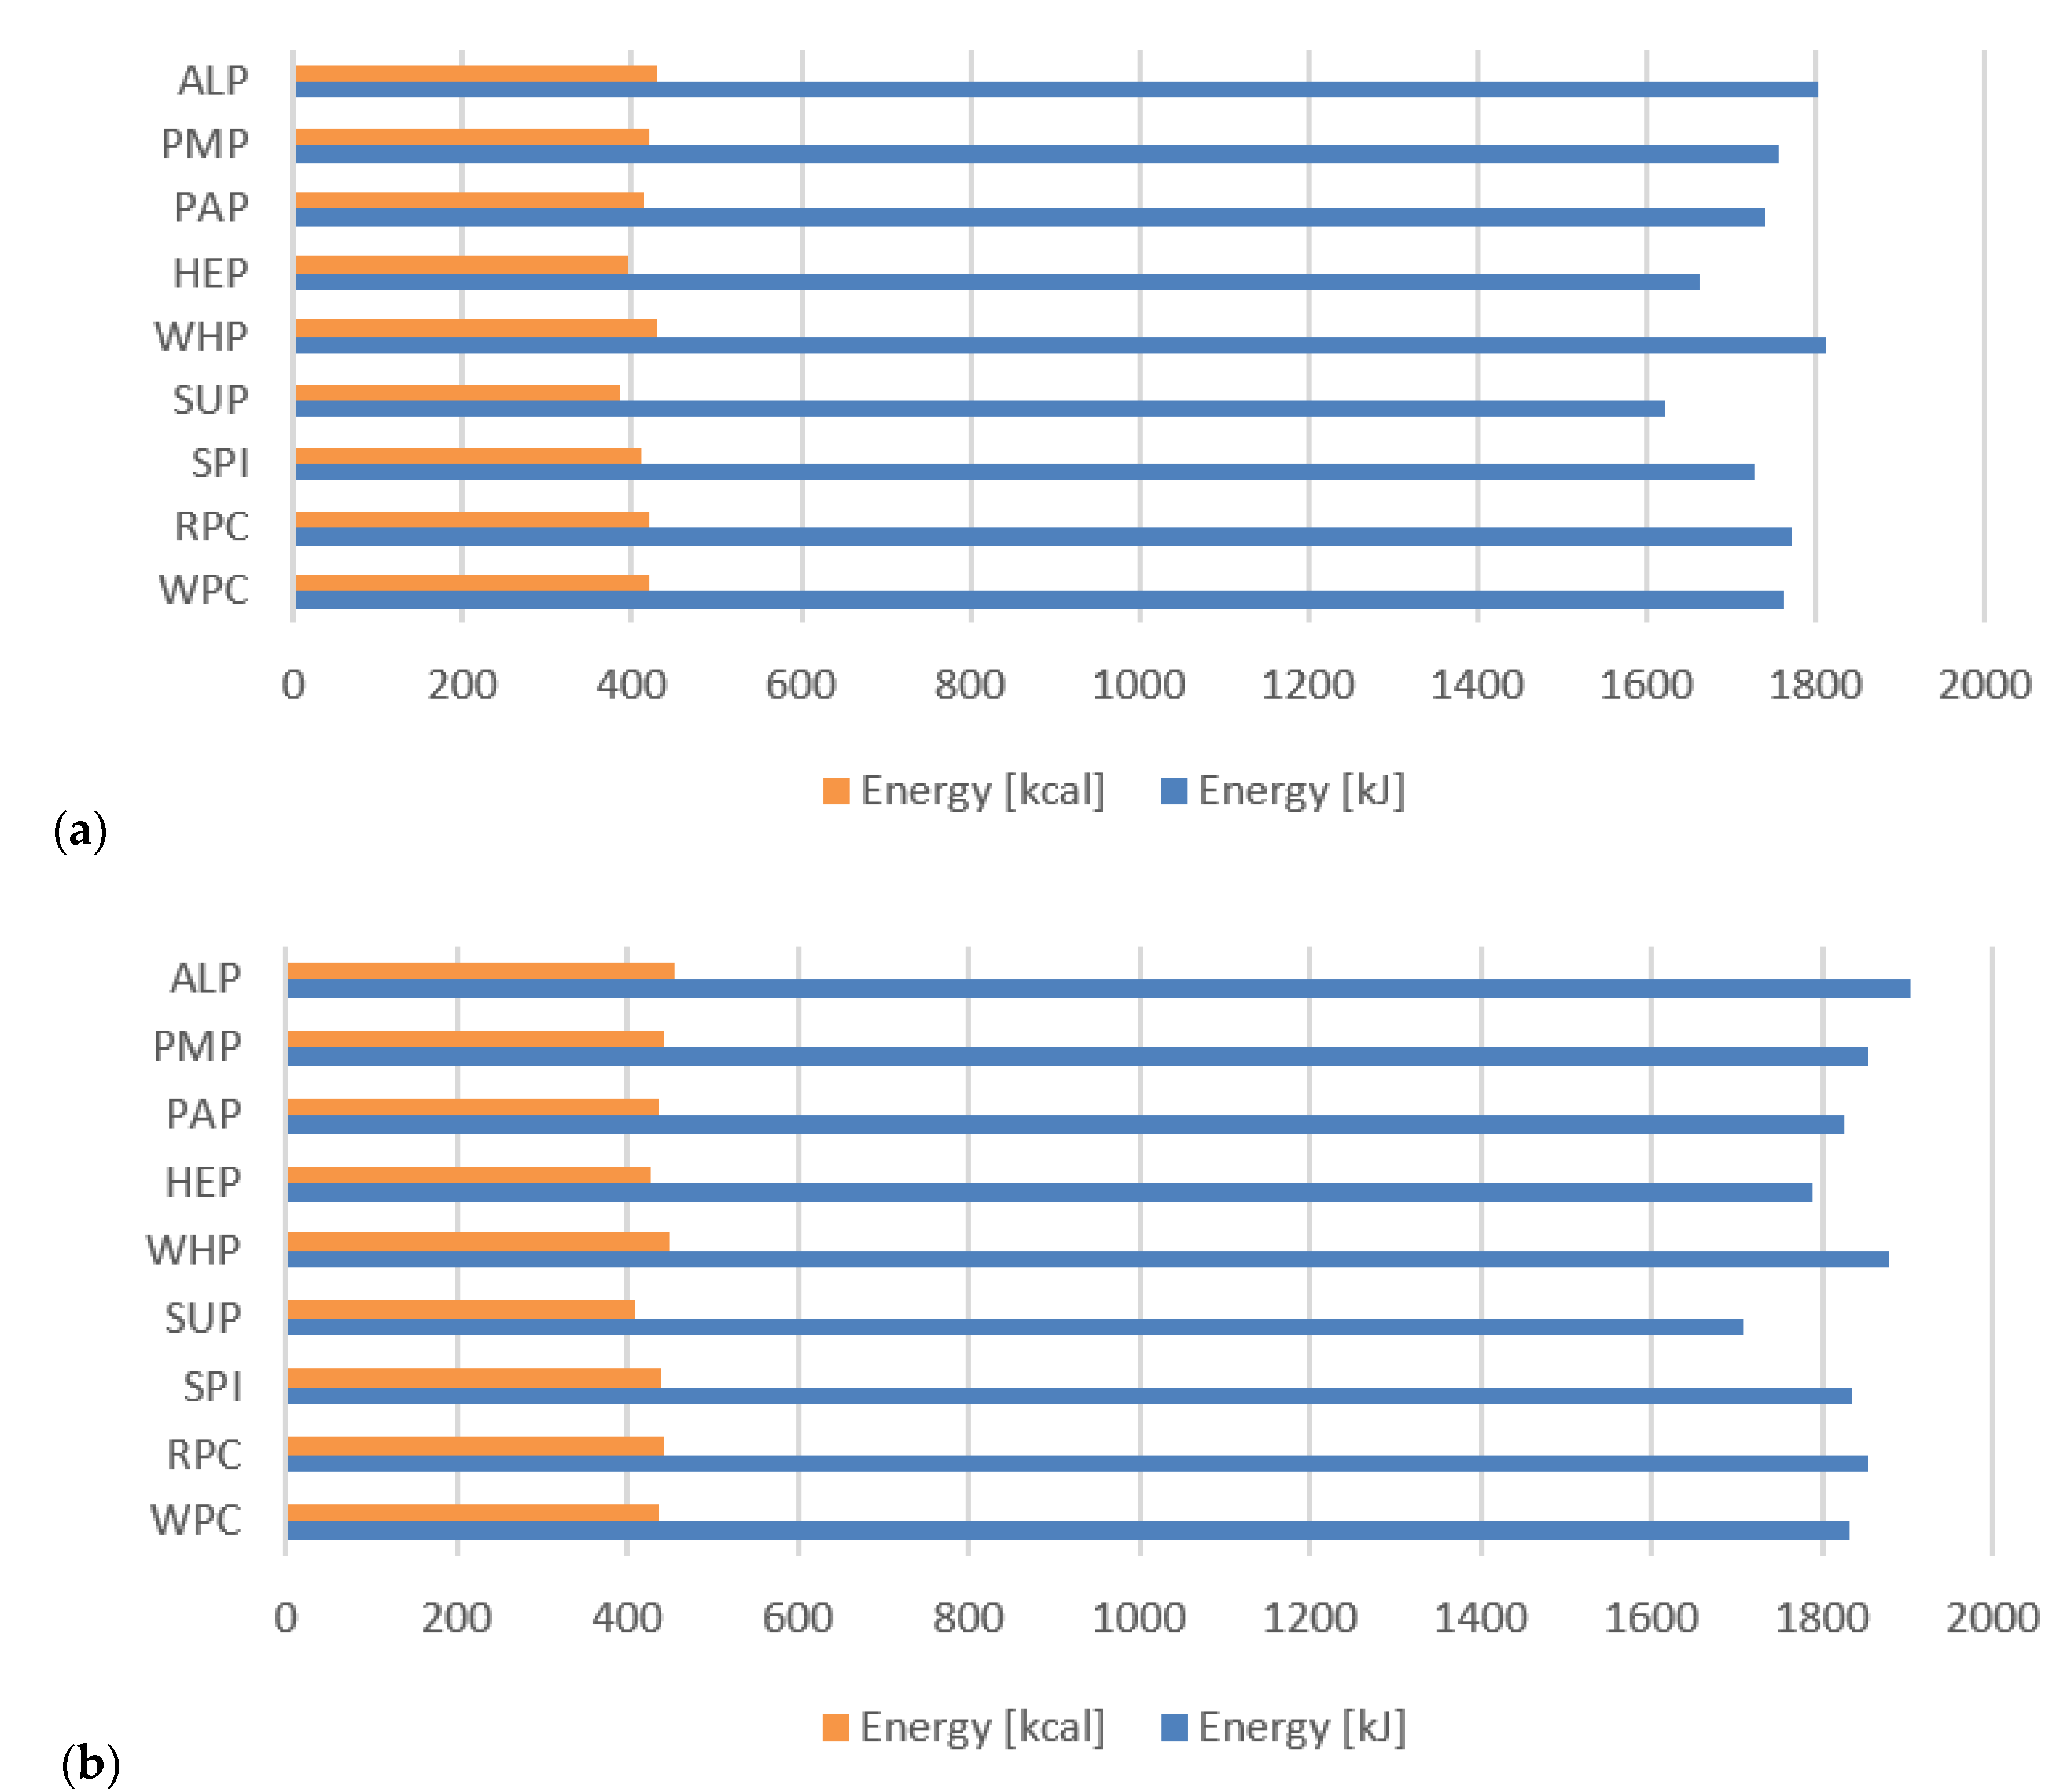
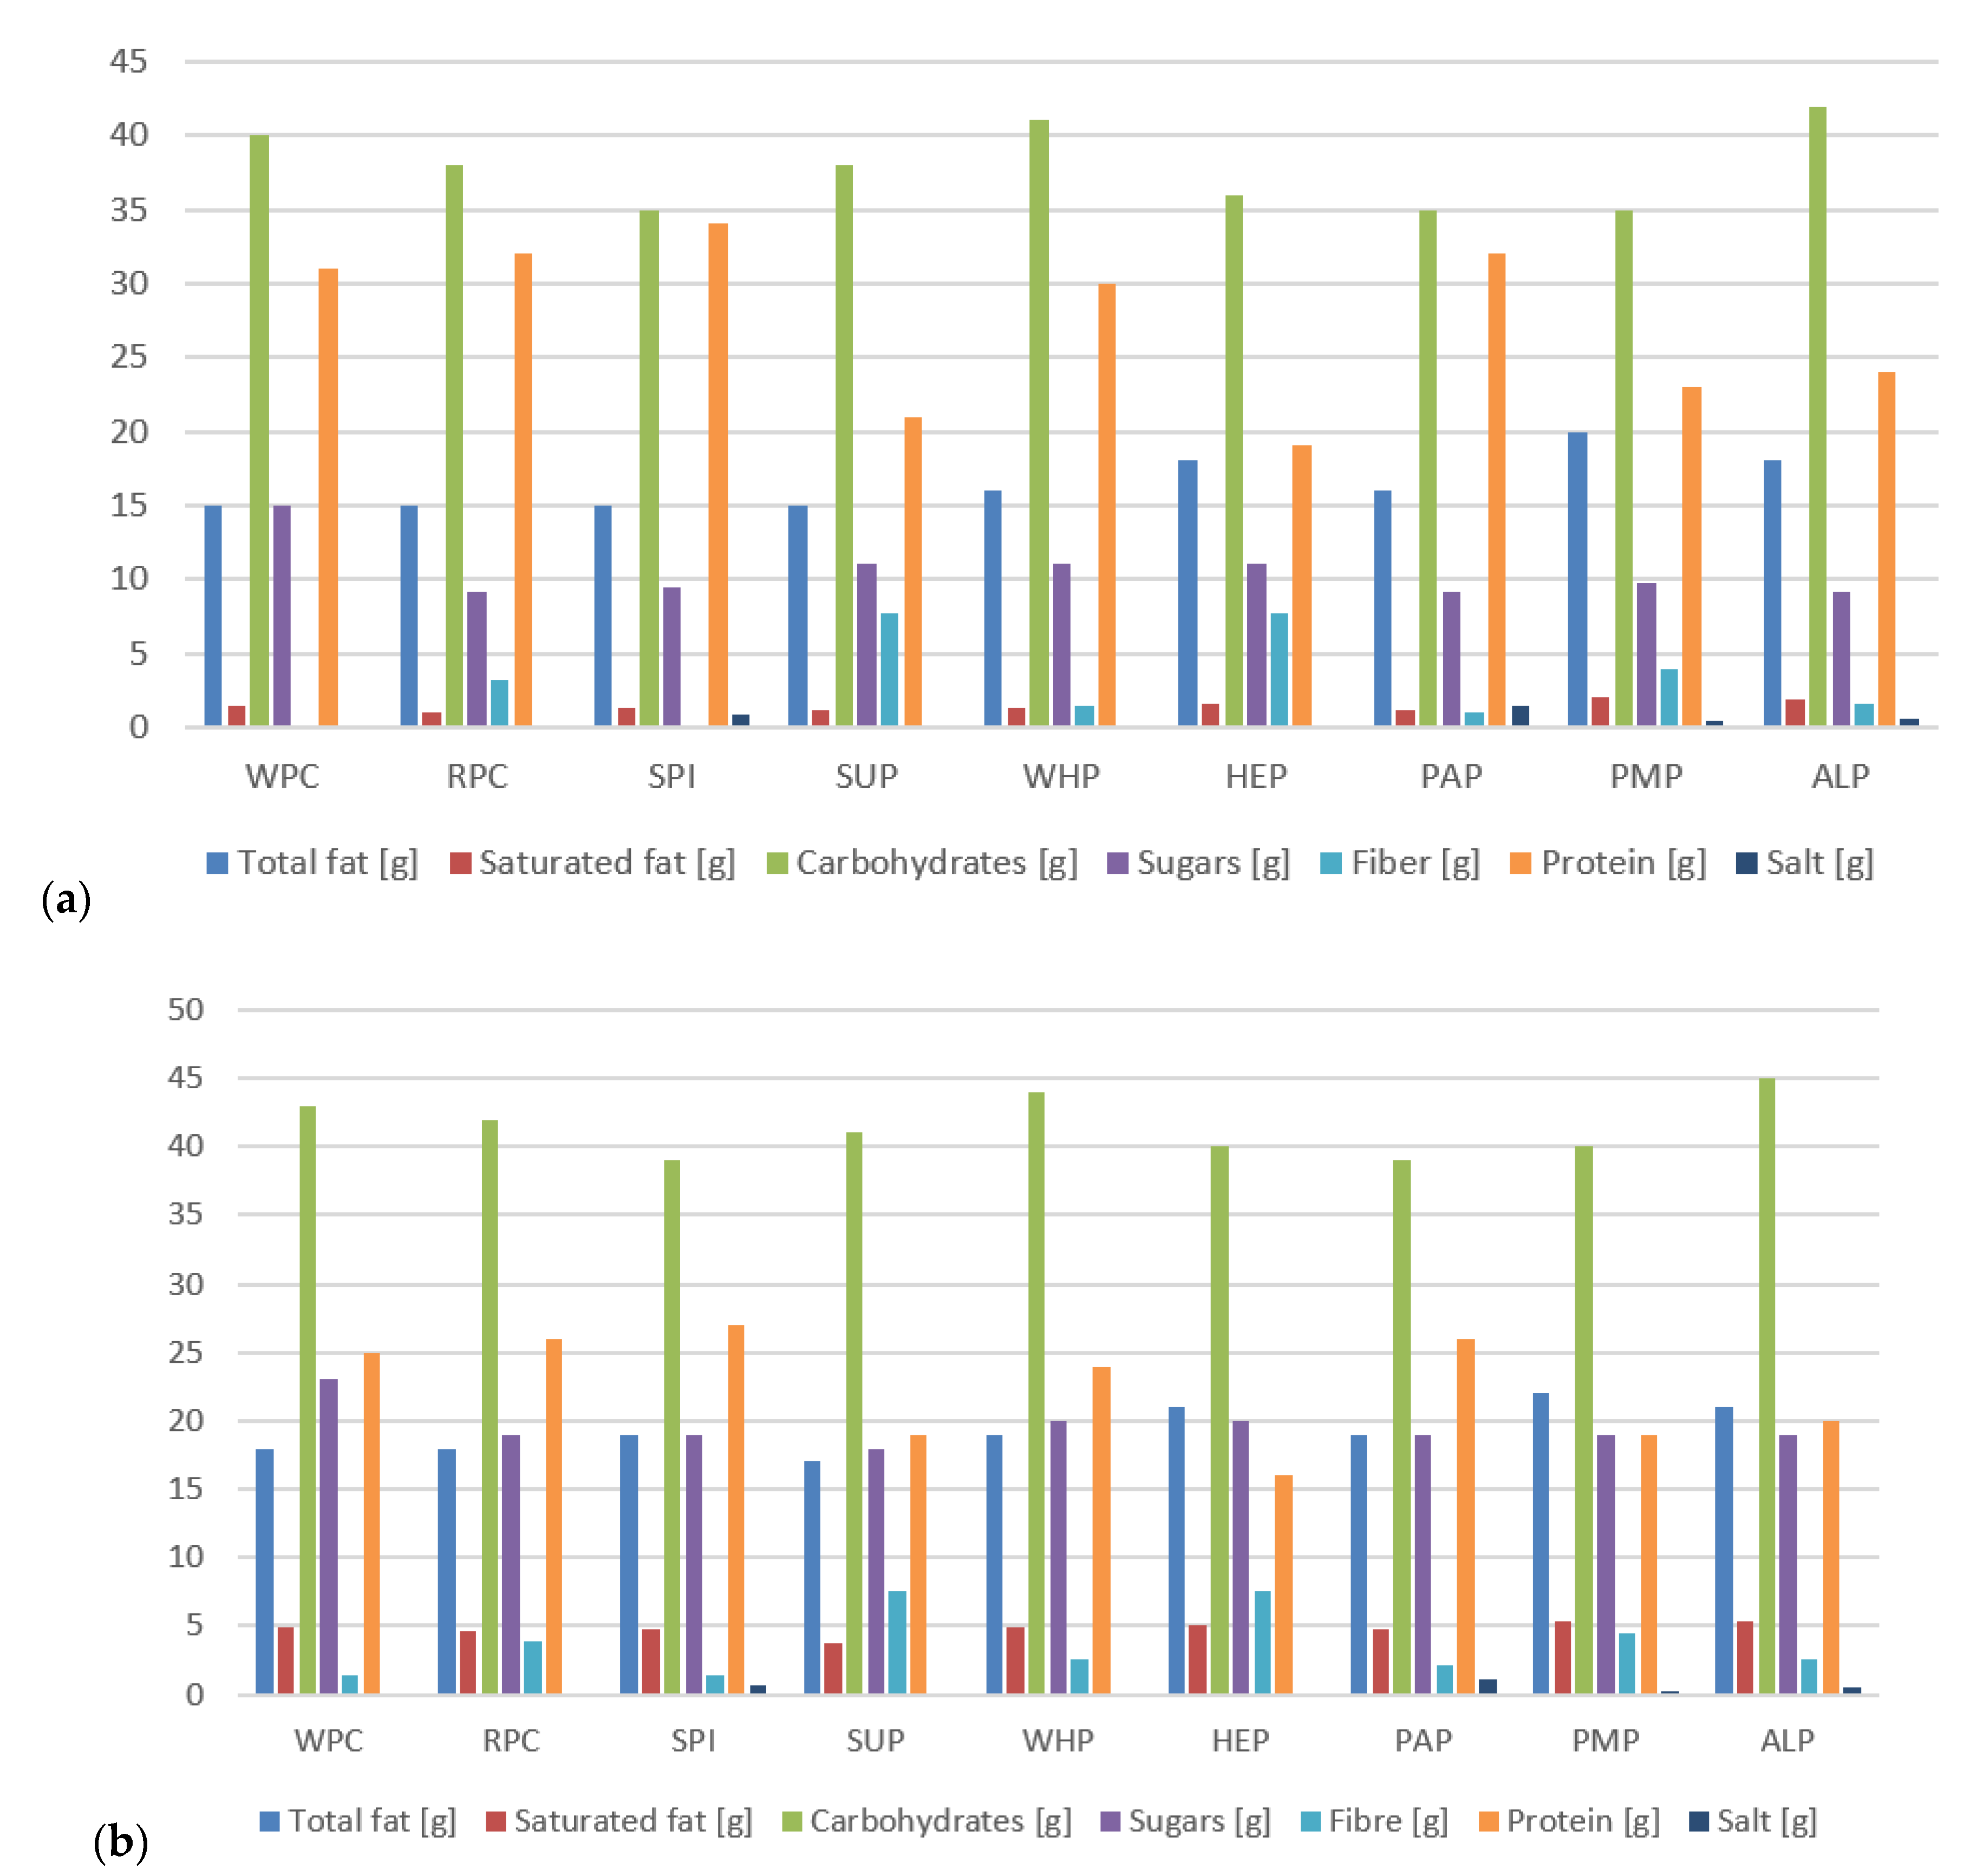
3.6. Amino Acids and Nutritional Value
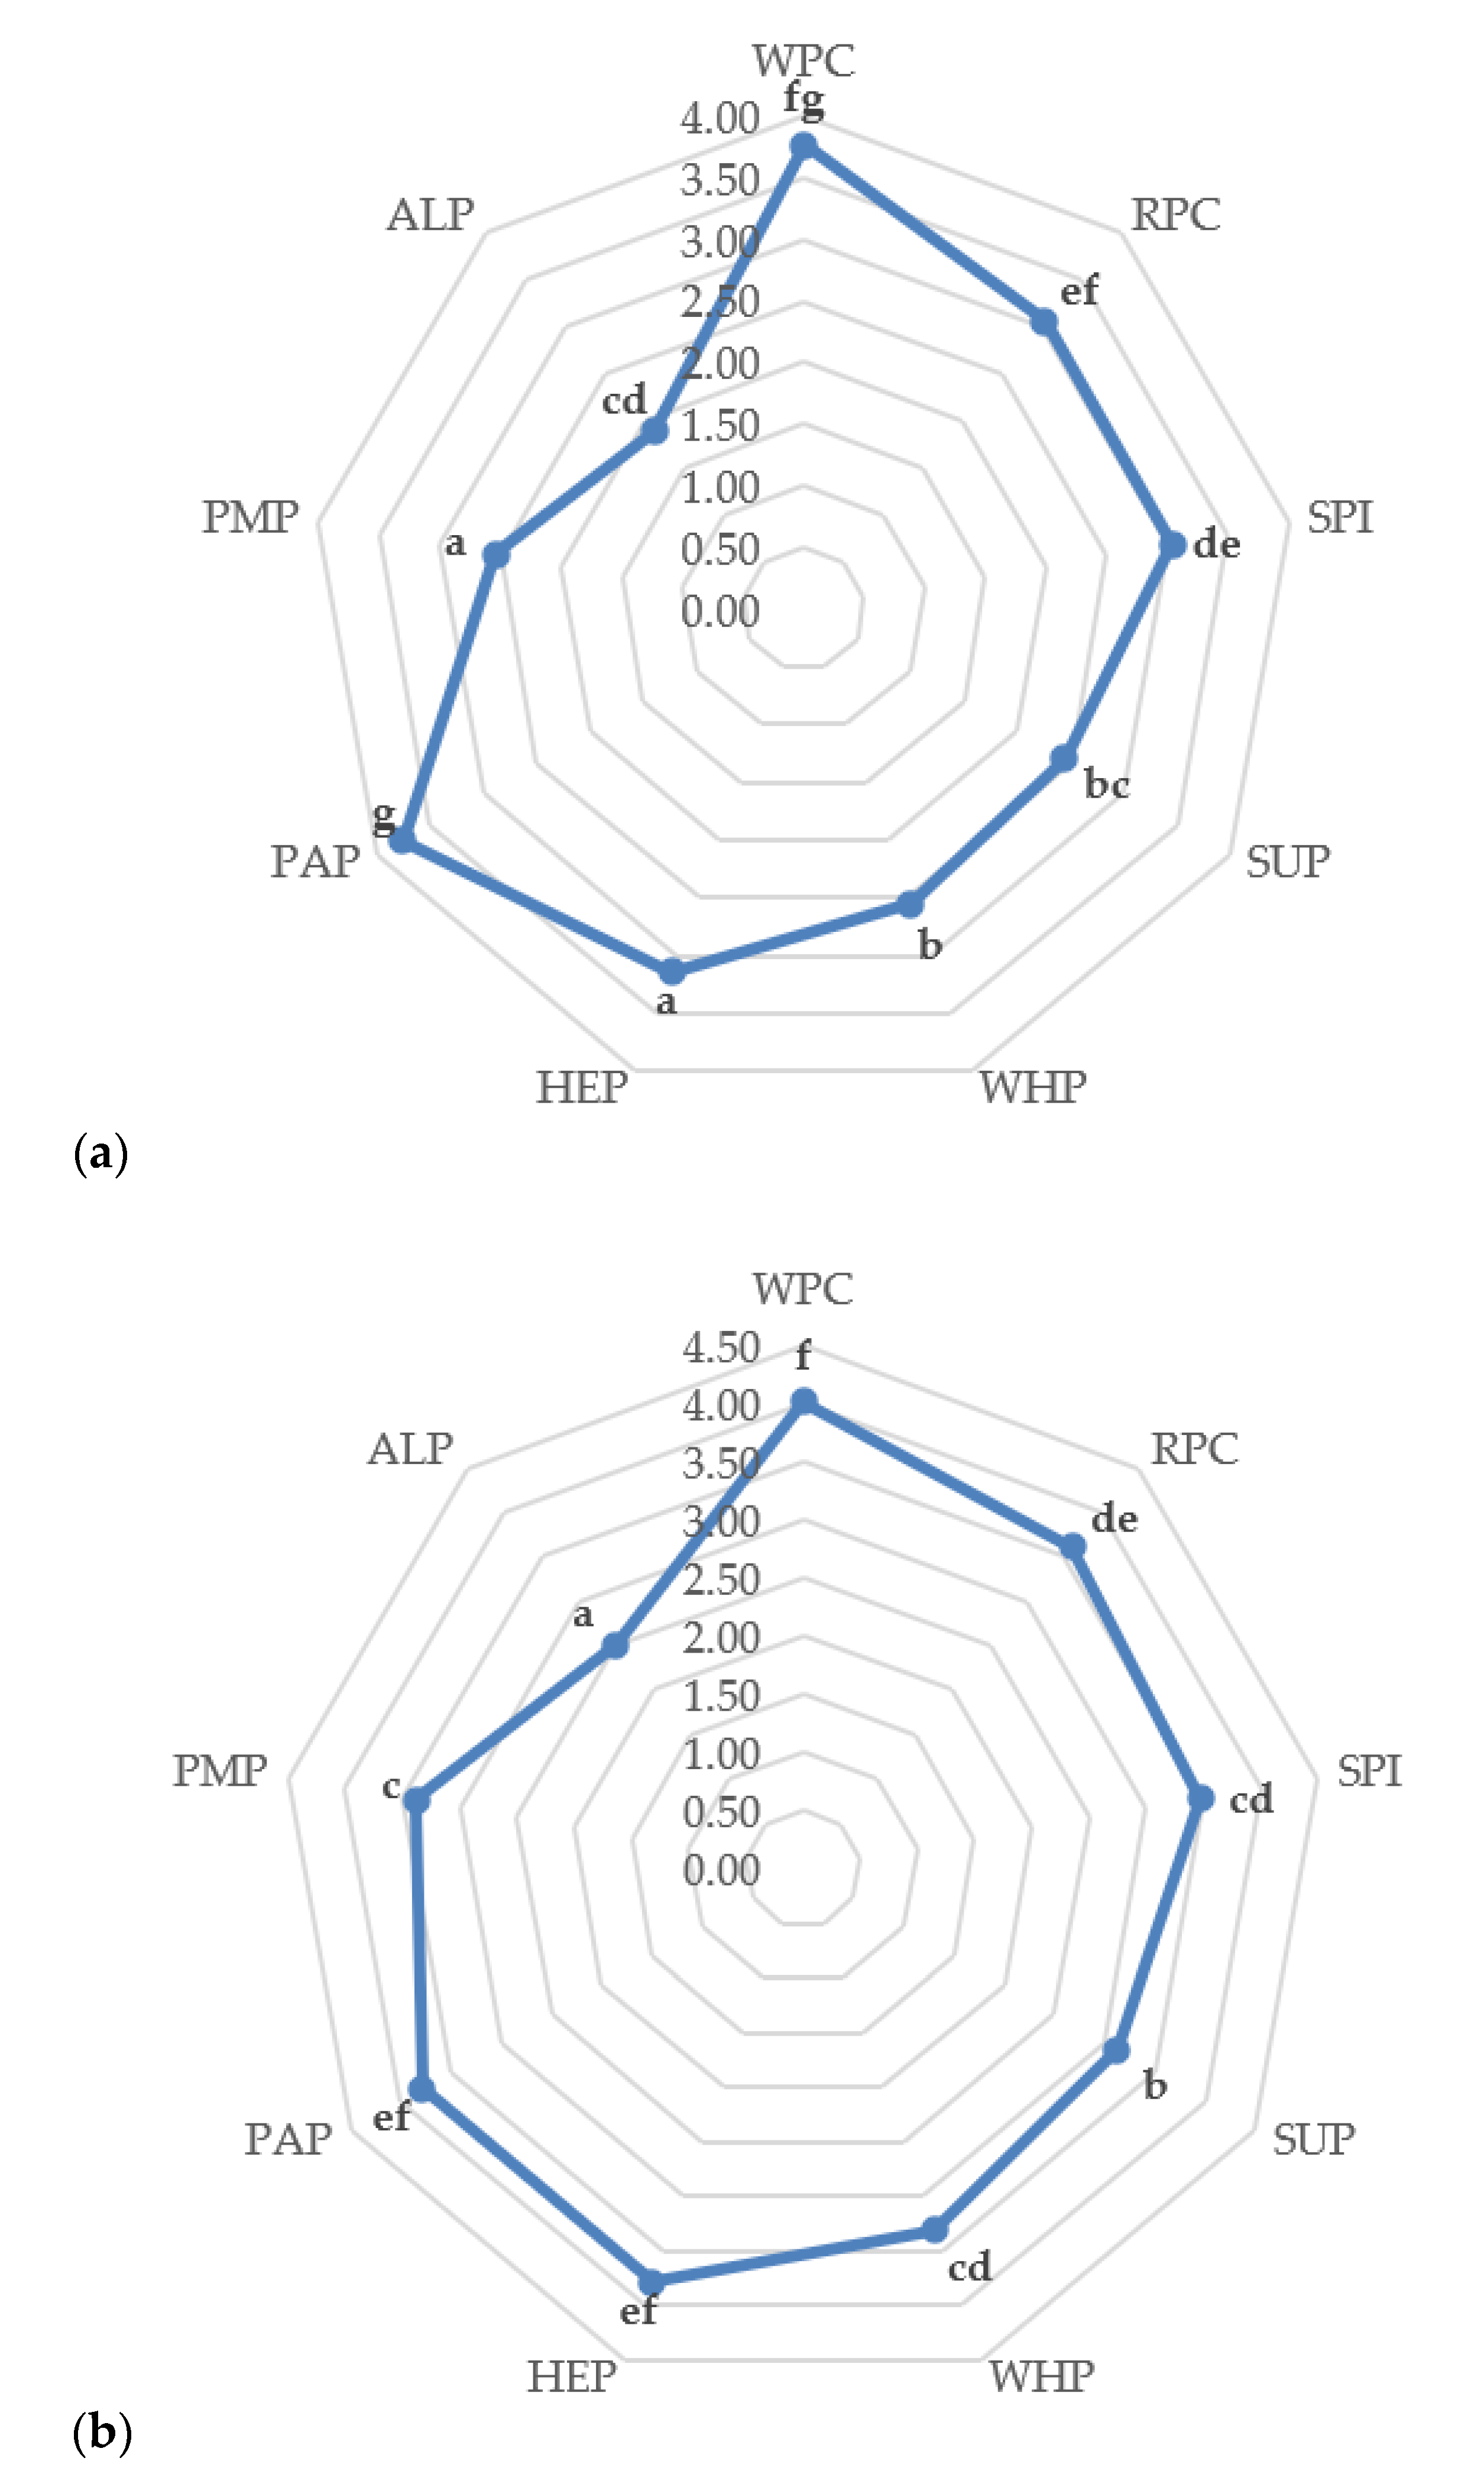
3.7. Sensory Evaluation
4. Conclusions
Author Contributions
Funding
Acknowledgments
Conflicts of Interest
References
- Goodbody, A. Raise the bar. Min. Mag. 2013, 73–78. [Google Scholar] [CrossRef]
- Clary, D.; Van de Bussche, T.; Janis, M.; Gossip, M.; Sloan, A.E. The top 10 functional food trends. The next generation. Food Technol. 2002, 56, 32–57. [Google Scholar] [CrossRef]
- Riaz, M.N. Soy Applications in Food; CRC Press: Boca Raton, FL, USA, 2005. [Google Scholar]
- Walia, A.; Gupta, A.K.; Sharma, V. Role of Bioactive Compounds in Human Health. Acta Sci. Med. Sci. 2019, 3, 25–33. [Google Scholar]
- Potes, N.; Kerry, J.P.; Roos, Y.H. Protein Modifications in High Protein-Oil and Protein-Oil-Sugar Systems at Low Water Activity. Food Biophys. 2014, 9, 49–60. [Google Scholar] [CrossRef]
- Hogan, S.A.; Chaurin, V.; O’Kennedy, B.T.; Kelly, P.M. Influence of dairy proteins on textural changes in high-protein bars. Int. Dairy J. 2012, 26, 58–65. [Google Scholar] [CrossRef]
- Weeks, E.R. Soft jammed materials. Stat. Phys. Complex Fluids 2007, 2, 87. [Google Scholar]
- Wang, Q.; Xiong, Y.L. Processing, Nutrition, and Functionality of Hempseed Protein: A Review. Compr. Rev. Food Sci. Food Saf. 2019, 18, 936–952. [Google Scholar] [CrossRef]
- Sá, A.G.A.; Moreno, Y.M.F.; Carciofi, B.A.M. Plant proteins as high-quality nutritional source for human diet. Trends Food Sci. Technol. 2020, 97, 170–184. [Google Scholar] [CrossRef]
- Ermiş, E.; Karasu, E.N. Püskürtmeli Kurutucu Ile Yaği Alinmiş Ayçiçeği Protein Ekstrakti Tozu Üretimi: Fonksiyonel Özellikleri Ve Toz Karakterizasyonu. Gida/J. Food 2020, 45, 39–49. [Google Scholar] [CrossRef]
- Pihlanto, A.; Mattila, P.; Mäkinen, S.; Pajari, A.M. Bioactivities of alternative protein sources and their potential health benefits. Food Funct. 2017, 8, 3443–3458. [Google Scholar] [CrossRef]
- Hassan, H.M.M.; Afify, A.S.; Basyiony, A.E.; Ahmed, G.T. Nutritional and functional properties of defatted wheat protein isolates. Aust. J. Basic Appl. Sci. 2010, 4, 348–358. [Google Scholar]
- Wells, M.L.; Potin, P.; Craigie, J.S.; Raven, J.A.; Merchant, S.S.; Helliwell, K.E.; Smith, A.G.; Camire, M.E.; Brawley, S.H. Algae as nutritional and functional food sources: Revisiting our understanding. J. Appl. Phycol. 2017, 29, 949–982. [Google Scholar] [CrossRef] [PubMed]
- Phongthai, S.; Homthawornchoo, W.; Rawdkuen, S. Preparation, properties and application of rice bran protein: A review. Int. Food Res. J. 2017, 24, 25–34. [Google Scholar]
- Vinayashree, S.; Vasu, P. Biochemical, nutritional and functional properties of protein isolate and fractions from pumpkin (Cucurbita moschata var. Kashi Harit) seeds. Food Chem. 2020, 340, 128177. [Google Scholar] [CrossRef] [PubMed]
- Rezig, L.; Riaublanc, A.; Chouaibi, M.; Guéguen, J.; Hamdi, S. Functional Properties of Protein Fractions Obtained from Pumpkin (Cucurbita Maxima) Seed. Int. J. Food Prop. 2016, 19, 172–186. [Google Scholar] [CrossRef]
- Xu, Y.T.; Liu, L.L. Structural and Functional Properties of Soy Protein Isolates Modified by Soy Soluble Polysaccharides. J. Agric. Food Chem. 2016, 64, 7275–7284. [Google Scholar] [CrossRef]
- Lam, A.C.Y.; Can Karaca, A.; Tyler, R.T.; Nickerson, M.T. Pea protein isolates: Structure, extraction, and functionality. Food Rev. Int. 2018, 34, 126–147. [Google Scholar] [CrossRef]
- Hogenkamp, P.S.; Stafleu, A.; Mars, M.; Brunstrom, J.M.; de Graaf, C. Texture, not flavor, determines expected satiation of dairy products. Appetite 2011, 57, 635–641. [Google Scholar] [CrossRef]
- De la Fuente, M.A.; Singh, H.; Hemar, Y. Recent advances in the characterisation of heat-induced aggregates and intermediates of whey proteins. Trends Food Sci. Technol. 2002, 13, 262–274. [Google Scholar] [CrossRef]
- Tomasevic, I.; Tomovic, V.; Milovanovic, B.; Lorenzo, J.; Đorđević, V.; Karabasil, N.; Djekic, I. Comparison of a computer vision system vs. traditional colorimeter for color evaluation of meat products with various physical properties. Meat Sci. 2019, 148, 5–12. [Google Scholar] [CrossRef]
- Milovanovic, B.; Djekic, I.; Djordjevic, V.; Tomovic, V.; Barba, F.; Tomasevic, I.; Lorenzo, J.M. Pros and cons of using a computer vision system for color evaluation of meat and meat products. IOP Conf. Ser. Earth Environ. Sci. 2019, 333, 012008. [Google Scholar] [CrossRef]
- Inami, T.; Tanimoto, Y.; Minami, N.; Yamaguchi, M.; Kasai, K. Color stability of laboratory glass-fiber-reinforced plastics for esthetic orthodontic wires. Korean J. Orthod. 2015. [Google Scholar] [CrossRef]
- Balter, A.; Szubiakowski, J. Fluorescence probes of viscosity: A comparative study of the fluorescence anisotropy decay of perylene and 3,9-dibromoperylene in glycerol. J. Fluoresc. 1993, 3, 247–249. [Google Scholar] [CrossRef]
- Galant, S. Formation of collagen-like structure of gel after radiation modification of gelatin. Colloid Polym. Sci. 1983, 261, 445–451. [Google Scholar] [CrossRef]
- Sheen, S.H.; Chien, H.-T.; Raptis, A.C. An in-Line Ultrasonic Viscometer. In Review of Progress in Quantitative Nondestructive Evaluation; Springer Science & Business Media: Berlin, Germany, 1995. [Google Scholar]
- Stone, H. Sensory Evaluation Practices; Academic Press: Cambridge, MA, USA, 2012; ISBN 9780123820860. [Google Scholar]
- Kowalski, S.; Lukasiewicz, M.; Juszczak, L.; Sikora, M. Charakterystyka teksturalna i sensoryczna mas cukierniczych otrzymanych na bazie miodu naturalnego i wybranych hydrokoloidów polisacharydowych. Żywność Nauk. Technol. Jakość 2011, 18, 3. [Google Scholar]
- Le Roux, L.; Ménard, O.; Chacon, R.; Dupont, D.; Jeantet, R.; Deglaire, A.; Nau, F. Are faba bean and pea proteins potential whey protein substitutes in infant formulas? An in vitro dynamic digestion approach. Foods 2020, 9, 362. [Google Scholar] [CrossRef]
- Badzian, B. Poziom aminokwasów egzogennych w ścianie jelita cienkiego, wątrobie i osoczu krwi kurcząt po zastosowaniu witamin rozpuszczalnych w wodzie. Acta Sci. Pol. Med. Vet. 2007, 6, 3–14. [Google Scholar]
- Novaković, S.; Tomašević, I. A comparison between Warner-Bratzler shear force measurement and texture profile analysis of meat and meat products: A review. In Proceedings of the 59th International Meat Industry Conference MEATCON2017, Zlatibor, Serbia, 1–4 October 2017; Volume 85. [Google Scholar] [CrossRef]
- Li, Y.; Szlachetka, K.; Chen, P.; Lin, X.; Ruan, R. Ingredient characterization and hardening of high-protein food bars: An NMR state diagram approach. Cereal Chem. 2008, 85, 780–786. [Google Scholar] [CrossRef]
- Banach, J.C.; Clark, S.; Lamsal, B.P. Particle size of milk protein concentrate powder affects the texture of high-protein nutrition bars during storage. J. Food Sci. 2017, 82, 913–921. [Google Scholar] [CrossRef]
- Trinh, T.; Glasgow, S. On the texture profile analysis test. In Proceedings of the Chemeca 2012: Quality of life through chemical engineering, Wellington, New Zealand, 23–26 September 2012; Available online: https://www.researchgate.net/publication/316093466_On_the_texture_profile_analysis_test (accessed on 9 October 2020).
- Banach, J.C.; Clark, S.; Lamsal, B.P. Instrumental and Sensory Texture Attributes of High-Protein Nutrition Bars Formulated with Extruded Milk Protein Concentrate. J. Food Sci. 2016, 81, S1254–S1262. [Google Scholar] [CrossRef]
- Cho, M.J. Soy Protein Functionality and Food Bar Texture. In Chemistry, Texture, and Flavor of Soy; American Chemical Society: Washington, DC, USA, 2010; ISBN 9780841225619. [Google Scholar]
- Debaste, F.; Kegelaers, Y.; Liégeois, S.; Amor, H.B.; Halloin, V. Contribution to the modelling of chocolate tempering process. J. Food Eng. 2008, 88, 568–575. [Google Scholar] [CrossRef]
- Quiñones-Muñoz, T.; Gallegos-Infante, J.A.; Rocha-Guzmán, N.E.; Ochoa-Martinez, L.A.; Morales-Castro, J.; González-Laredo, R.F.; Medina-Torres, L. Mixing and tempering effect on the rheological and particle size properties of dark chocolate coatings. CYTA J. Food 2011, 9, 109–113. [Google Scholar] [CrossRef]
- Labuza, T.P.; Hyman, C.R. Moisture migration and control in multi-domain foods. Trends Food Sci. Technol. 1998, 9, 47–55. [Google Scholar] [CrossRef]
- Hogan, S.A.; Famelart, M.H.; O’Callaghan, D.J.; Schuck, P. A novel technique for determining glass-rubber transition in dairy powders. J. Food Eng. 2010, 99, 76–82. [Google Scholar] [CrossRef]
- Bleakley, S.; Hayes, M. Algal Proteins: Extraction, Application, and Challenges Concerning Production. Foods 2017, 6, 33. [Google Scholar] [CrossRef]
- Purwanti, N.; van der Goot, A.J.; Boom, R.; Vereijken, J. New directions towards structure formation and stability of protein-rich foods from globular proteins. Trends Food Sci. Technol. 2010, 21, 85–94. [Google Scholar] [CrossRef]
- Banach, J.C.; Clark, S.; Lamsal, B.P. Texture and other changes during storage in model high-protein nutrition bars formulated with modified milk protein concentrates. LWT Food Sci. Technol. 2014, 56, 77–86. [Google Scholar] [CrossRef]
- Loveday, S.M.; Hindmarsh, J.P.; Creamer, L.K.; Singh, H. Physicochemical changes in a model protein bar during storage. Food Res. Int. 2009, 42, 798–806. [Google Scholar] [CrossRef]
- Zhou, P.; Liu, X.; Labuza, T.P. Moisture-induced aggregation of whey proteins in a protein/buffer model system. J. Agric. Food Chem. 2008, 56, 2048–2054. [Google Scholar] [CrossRef]
- Zhou, P.; Liu, X.; Labuza, T.P. Effects of moisture-induced whey protein aggregation on protein conformation, the state of water molecules, and the microstructure and texture of high-protein-containing matrix. J. Agric. Food Chem. 2008, 56, 4534–4540. [Google Scholar] [CrossRef]
- Ren, J.; Sun, X.H.; Lin, G.P.; Zheng, X.Q.; Liu, X.L. Isolation and Characterization of Sunflower Protein Isolates and Sunflower Globulins. In Information Technology and Agricultural Engineering; Springer: Berlin/Heidelberg, Germany, 2012. [Google Scholar]
- Tomasevic, I.; Tomovic, V.; Ikonic, P.; Lorenzo Rodriguez, J.M.; Barba, F.J.; Djekic, I.; Nastasijevic, I.; Stajic, S.; Zivkovic, D. Evaluation of poultry meat colour using computer vision system and colourimeter: Is there a difference? Br. Food J. 2019, 121, 1078–1087. [Google Scholar] [CrossRef]
- Tomasevic, I.; Tomovic, V.; Barba, F.J.; Vasilev, D.; Jokanovic, M.; Sojic, B.; Manuel Lorenzo, J.; Djekic, I. How the color of game meat should be measured. Fleischwirtschaft 2019, 99, 85–89. [Google Scholar]
- Hassan, S.K. Quantitative and qualitative effects of proteins and natural sugars on hardening and color of high-protein nutrition bars during storage. EurAsian J. Biosci. 2020, 14, 915–932. [Google Scholar]
- Mcmahon, D.J.; Adams, S.L.; Mcmanus, W.R. Hardening of high-protein nutrition bars and sugar/polyol-protein phase separation. J. Food Sci. 2009, 74, E312–E321. [Google Scholar] [CrossRef]
- Tomczyńska-Mleko, M.; Ozimek, L. Ultrasound viscosity measurements allow determination of gas volume fraction in foamed gels. J. Food Process Eng. 2013, 36, 572–578. [Google Scholar] [CrossRef]
- The Commission of the European. EU Commision Regulation (EC) No 1881/2006. Setting maximum levels for certain contaminants in foodstuffs. Off. J. Eur. Union 2006, 364, 5–24. [Google Scholar]
- Huang, D.; Liu, L.; Zeng, G.; Xu, P.; Huang, C.; Deng, L.; Wang, R.; Wan, J. The effects of rice straw biochar on indigenous microbial community and enzymes activity in heavy metal-contaminated sediment. Chemosphere 2017, 174, 545–553. [Google Scholar] [CrossRef]
- Kaneta, M.; Hikichi, H.; Endo, S.; Sugiyama, N. Chemical form of cadmium (and other heavy metals) in rice and wheat plants. Environ. Health Perspect. 1986, 65, 33–37. [Google Scholar] [CrossRef][Green Version]
- Kowieska, A.; Lubowicki, R.; Jaskowska, I. Chemical composition and nutritional characteristics of several cereal grain. Acta Sci. Pol. Zootech. 2011, 10, 2. [Google Scholar]
- Szpak, P. Fish bone chemistry and ultrastructure: Implications for taphonomy and stable isotope analysis. J. Archaeol. Sci. 2011, 38, 3358–3372. [Google Scholar] [CrossRef]
- Jennifer, J.O.; Jennifer Pitzi Hellwig, L.D.M. Dietary Reference Intakes: The Essential Guide to Nutrient Requirements; National Academies Press: Washington, DC, USA, 2006; ISBN 9780309100915. [Google Scholar]
- Strozyk, A.K.; Pachocka, L. The role of nuts consumption in the primary and secondary prevention of type 2 diabetes. Clin. Diabetol. 2017, 6, 26–33. [Google Scholar] [CrossRef]
- Kalman, D. Amino Acid Composition of an Organic Brown Rice Protein Concentrate and Isolate Compared to Soy and Whey Concentrates and Isolates. Foods 2014, 3, 394–402. [Google Scholar] [CrossRef] [PubMed]
- The European Parliment and the Council of the European Union Regulation (EC) No 1924/2006. Off. J. Eur. Union 2011. Available online: https://esinvesticijos.lt/uploads/main/documents/files/20111018_general_proposal_en.pdf (accessed on 9 October 2020).
- Li, Y.O.; Komarek, A.R. Dietary fibre basics: Health, nutrition, analysis, and applications. Food Qual. Saf. 2017, 1, 47–59. [Google Scholar] [CrossRef]
- Gershuni, V.M. Saturated Fat: Part of a Healthy Diet. Curr. Nutr. Rep. 2018, 7, 85–96. [Google Scholar] [CrossRef]
- Hall, A.C.; Fairclough, A.C.; Mahadevan, K.; Paxman, J.R. Ascophyllum nodosum enriched bread reduces subsequent energy intake with no effect on post-prandial glucose and cholesterol in healthy, overweight males. A pilot study. Appetite 2012, 58, 379–386. [Google Scholar] [CrossRef]
- Prabhasankar, P.; Ganesan, P.; Bhaskar, N.; Hirose, A.; Stephen, N.; Gowda, L.R.; Hosokawa, M.; Miyashita, K. Edible Japanese seaweed, wakame (Undaria pinnatifida) as an ingredient in pasta: Chemical, functional and structural evaluation. Food Chem. 2009, 115, 501–508. [Google Scholar] [CrossRef]
- Usha, R.; Lakshmi, M.; Ranjani, M. Nutritional, sensory and physical analysis of pumpkin flour incorporated into weaning mix. Malays. J. Nutr. 2010, 16, 379–387. [Google Scholar]


| Composition of High-Protein Bars without Chocolate Coating | |
| Ingredient | Percentage Content in Final Product (% w/w) |
| Protein ingredient (WPC, SPI, PAP, RPC, WHP, ALP, SUP, HMP or PMP) | 38.18 |
| Glucose syrup | 31.82 |
| Rapeseed oil | 13.64 |
| Maltodextrin | 5.45 |
| Water | 5.45 |
| Barley malt extract | 3.64 |
| Soy lecithin | 0.91 |
| Vanilla flavor (aroma) | 0.91 |
| Composition of High-Protein Bars with Chocolate Coating | |
| Ingredient | Percentage Content in Final Product (% w/w) |
| Protein ingredient (WPC, SPI, PAP, RPC, WHP, ALP, SUP, HMP or PMP) | 30.2 |
| Glucose syrup | 25.0 |
| Rapeseed oil | 10.8 |
| Maltodextrin | 4.3 |
| Water | 4.3 |
| Barley malt extract | 2.9 |
| Soy lecithin | 0.7 |
| Vanilla flavor (aroma) | 0.7 |
| Chocolate | 21.1 |
| (a) | ||||
| Type of Protein Used in Bars with Chocolate Coating | Texture Attributes | |||
| Hardness (N) | Fracturability (N) | Adhesiveness (J) | Cohesiveness | |
| WPC | 54.66 e ± 0.303 | 0.06 a ± 0.005 | 382.87 g ± 4.977 | 0.14 f ± 0.001 |
| RPC | 20.95 a ± 0.164 | 0.06 a ± 0.004 | 57.54 c ± 2.588 | 0.07 c ± 0.001 |
| SPI | 25.25 c ± 0.358 | 20.85 b ± 0.152 | 66.85 c ± 1.773 | 0.04 a ± 0.004 |
| SUP | 136.61 g ± 0.406 | 115.56 f ± 0.255 | 225.61 f ± 4.861 | 0.10 de ± 0.001 |
| WHP | 88.33 f ± 0.092 | 55.38e ± 0.288 | 123.42 d ± 3.724 | 0.11 e ± 0.004 |
| HEP | 27.74 d ± 0.152 | 0.03 a ± 0.005 | 27.15 b ± 2.528 | 0.13 f ± 0.003 |
| PAP | 27.44 d ± 0.302 | 25.86 d ± 0.461 | 145.78 e ± 4.853 | 0.06 b ± 0.002 |
| PMP | 23.52 b ± 0.338 | 23.27 c ± 0.215 | 7.34 a ± 0.392 | 0.09 d ± 0.004 |
| ALP | 276.43 h ± 0.286 | 0.13 a ± 0.012 | 129.67 d ± 0.577 | 0.19 g ± 0.008 |
| (b) | ||||
| Type of Protein Used in Bars without Chocolate Coating | Texture Attributes | |||
| Hardness (N) | Fracturability (N) | Adhesiveness (J) | Cohesiveness | |
| WPC | 34.53 f ± 0.277 | 0.30 a ± 0.024 | 56.23 d ± 4.336 | 0.12 d ± 0.001 |
| RPC | 18.64 c ± 0.327 | 0.11 a ± 0.018 | 34.16 c ± 2.166 | 0.05 b ± 0.001 |
| SPI | 16.38 b ± 0.201 | 16.39 b ± 0.306 | 5.88 a ± 0.681 | 0.03 a ± 0.002 |
| SUP | 149.19 h ± 0.198 | 122.52 e ± 0.439 | 16.23 b ± 2.171 | 0.15 e ± 0.001 |
| WHP | 81.31 g ± 0.172 | 0.08 a ± 0.004 | 130.15 e ± 2.157 | 0.22 g ± 0.010 |
| HEP | 21.50 e ± 0.170 | 35.59 c ± 0.450 | 3.37 a ± 0.479 | 0.09 c ± 0.006 |
| PAP | 13.62 a ± 0.246 | 36.81 d ± 0.217 | 1.69 a ± 0.246 | 0.06 b ± 0.004 |
| PMP | 19.67 d ± 0.167 | 0.03 a ± 0.004 | 322.85 f ± 2.695 | 0.21 g ± 0.006 |
| ALP | 288.50 i ± 0.326 | 0.07 a ± 0.004 | 27.79 c ± 2.947 | 0.17 f ± 0.002 |
| Type of Protein Used in Bars with Chocolate Coating | Cutting Resistance | Type of Protein Used in Bars without Chocolate Coating | Cutting Resistance |
|---|---|---|---|
| Force (N) | Force (N) | ||
| WPC | 79.31 f ± 0.298 | WPC | 128.39 h ± 0.393 |
| RPC | 25.75 d ± 0.198 | RPC | 25.36 e ± 0.084 |
| SPI | 109.69 g ± 0.112 | SPI | 98.21 g ± 0.162 |
| SUP | 22.35 c ± 0.298 | SUP | 14.38 d ± 0.149 |
| WHP | 10.54 a ± 0.073 | WHP | 8.43 b ± 0.020 |
| HEP | 15.59 b ± 0.271 | HEP | 10.58 c ± 0.126 |
| PAP | 75.34 e ± 0.222 | PAP | 81.45 f ± 0.194 |
| PMP | 22.70 c ± 0.143 | PMP | 7.69 a ± 0.148 |
| ALP | 235.45 h ± 0.366 | ALP | 166.82 i ± 0.138 |
| (a) | ||||
 WPC |  RPC |  SPI | ||
 SUP |  PAP |  HEP | ||
 PMP |  ALP |  WHP | ||
| (b) | ||||
| Type of Protein Used in Bars without Chocolate Coating | Attributes | |||
| L* | a* | b* | NBS Units | |
| WPC | 63.86 f ± 1.069 | 17.29 d ± 0.488 | 44.43 f ± 0.976 | - |
| RPC | 43.71 c ± 0.488 | 10.00 c ± 0.000 | 21.14 b ± 0.690 | 29.12 |
| SPI | 79.43 h ± 0.787 | 5.29 a ± 0.488 | 19.43 a ± 0.976 | 29.26 |
| SUP | 34.14 a ± 0.378 | 11.00 c ± 0.000 | 22.29 b ± 0.756 | 34.58 |
| WHP | 40.57 b ± 0.976 | 10.00 c ± 0.000 | 31.71 c ± 1.113 | 25.32 |
| HEP | 50.57 e ± 0.976 | 47.43 f ± 1.272 | 50.29 g ± 1.704 | 30.78 |
| PAP | 78.00 g ± 0.000 | 8.00 b ± 0.000 | 23.00 b ± 0.000 | 25.12 |
| PMP | 49.43 e ± 1.134 | 40.71 e ± 1.113 | 34.14 d ± 2.116 | 27.02 |
| ALP | 47.71 d ± 0.488 | 10.86 c ± 0.378 | 39.71 e ± 0.488 | 16.57 |
Publisher’s Note: MDPI stays neutral with regard to jurisdictional claims in published maps and institutional affiliations. |
© 2020 by the authors. Licensee MDPI, Basel, Switzerland. This article is an open access article distributed under the terms and conditions of the Creative Commons Attribution (CC BY) license (http://creativecommons.org/licenses/by/4.0/).
Share and Cite
Małecki, J.; Tomasevic, I.; Djekic, I.; Sołowiej, B.G. The Effect of Protein Source on the Physicochemical, Nutritional Properties and Microstructure of High-Protein Bars Intended for Physically Active People. Foods 2020, 9, 1467. https://doi.org/10.3390/foods9101467
Małecki J, Tomasevic I, Djekic I, Sołowiej BG. The Effect of Protein Source on the Physicochemical, Nutritional Properties and Microstructure of High-Protein Bars Intended for Physically Active People. Foods. 2020; 9(10):1467. https://doi.org/10.3390/foods9101467
Chicago/Turabian StyleMałecki, Jan, Igor Tomasevic, Ilija Djekic, and Bartosz G. Sołowiej. 2020. "The Effect of Protein Source on the Physicochemical, Nutritional Properties and Microstructure of High-Protein Bars Intended for Physically Active People" Foods 9, no. 10: 1467. https://doi.org/10.3390/foods9101467
APA StyleMałecki, J., Tomasevic, I., Djekic, I., & Sołowiej, B. G. (2020). The Effect of Protein Source on the Physicochemical, Nutritional Properties and Microstructure of High-Protein Bars Intended for Physically Active People. Foods, 9(10), 1467. https://doi.org/10.3390/foods9101467