Cross-Cultural Consumer Acceptability for Ethnic Fermented Sauce Products: Comparisons among Korean, UAE, and US Consumers


Abstract
1. Introduction
2. Materials and Methods
2.1. Subjects
2.2. Food Samples
2.3. Sample Preparation and Presentation
2.4. Consumer Taste-Test Procedure
2.5. Statistical Analysis
3. Results
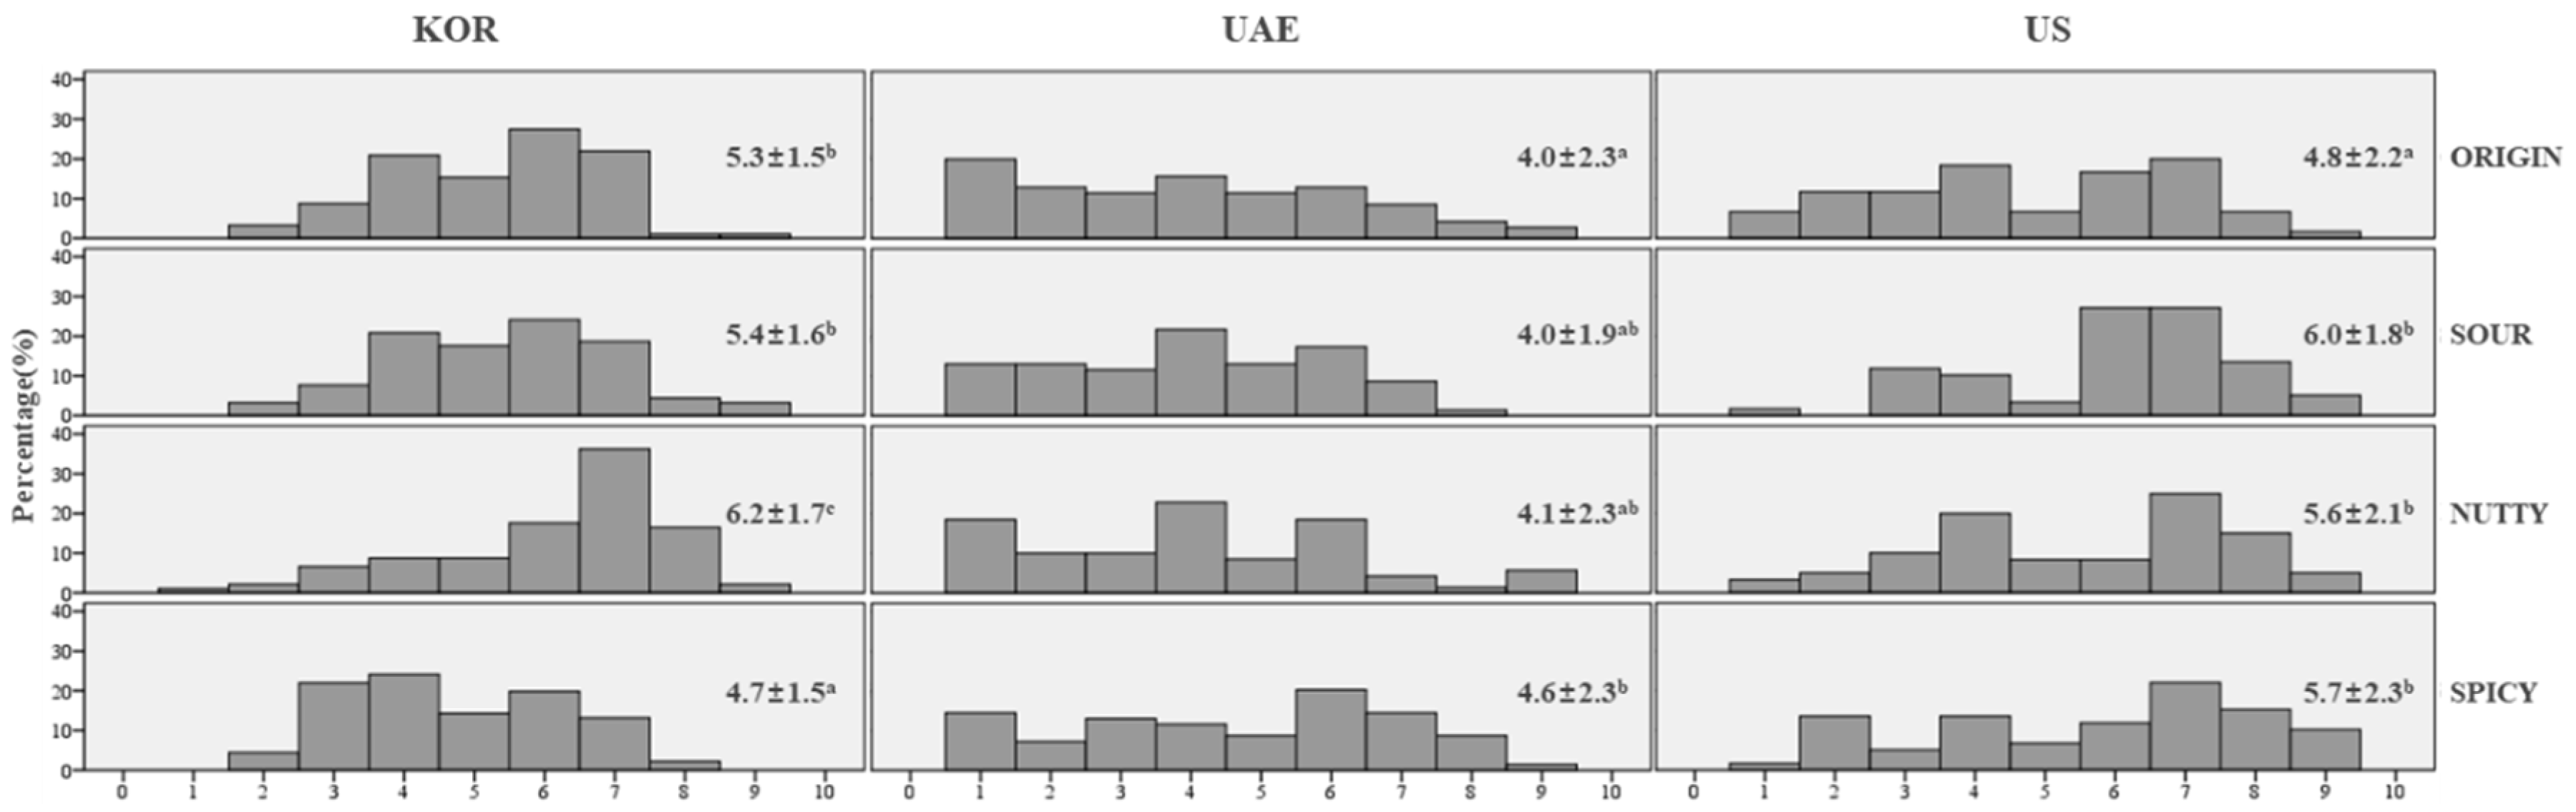
3.1. Salad Dressing
3.1.1. Effect of Product and Country of Origin on Consumers’ Acceptance and Perception Ratings
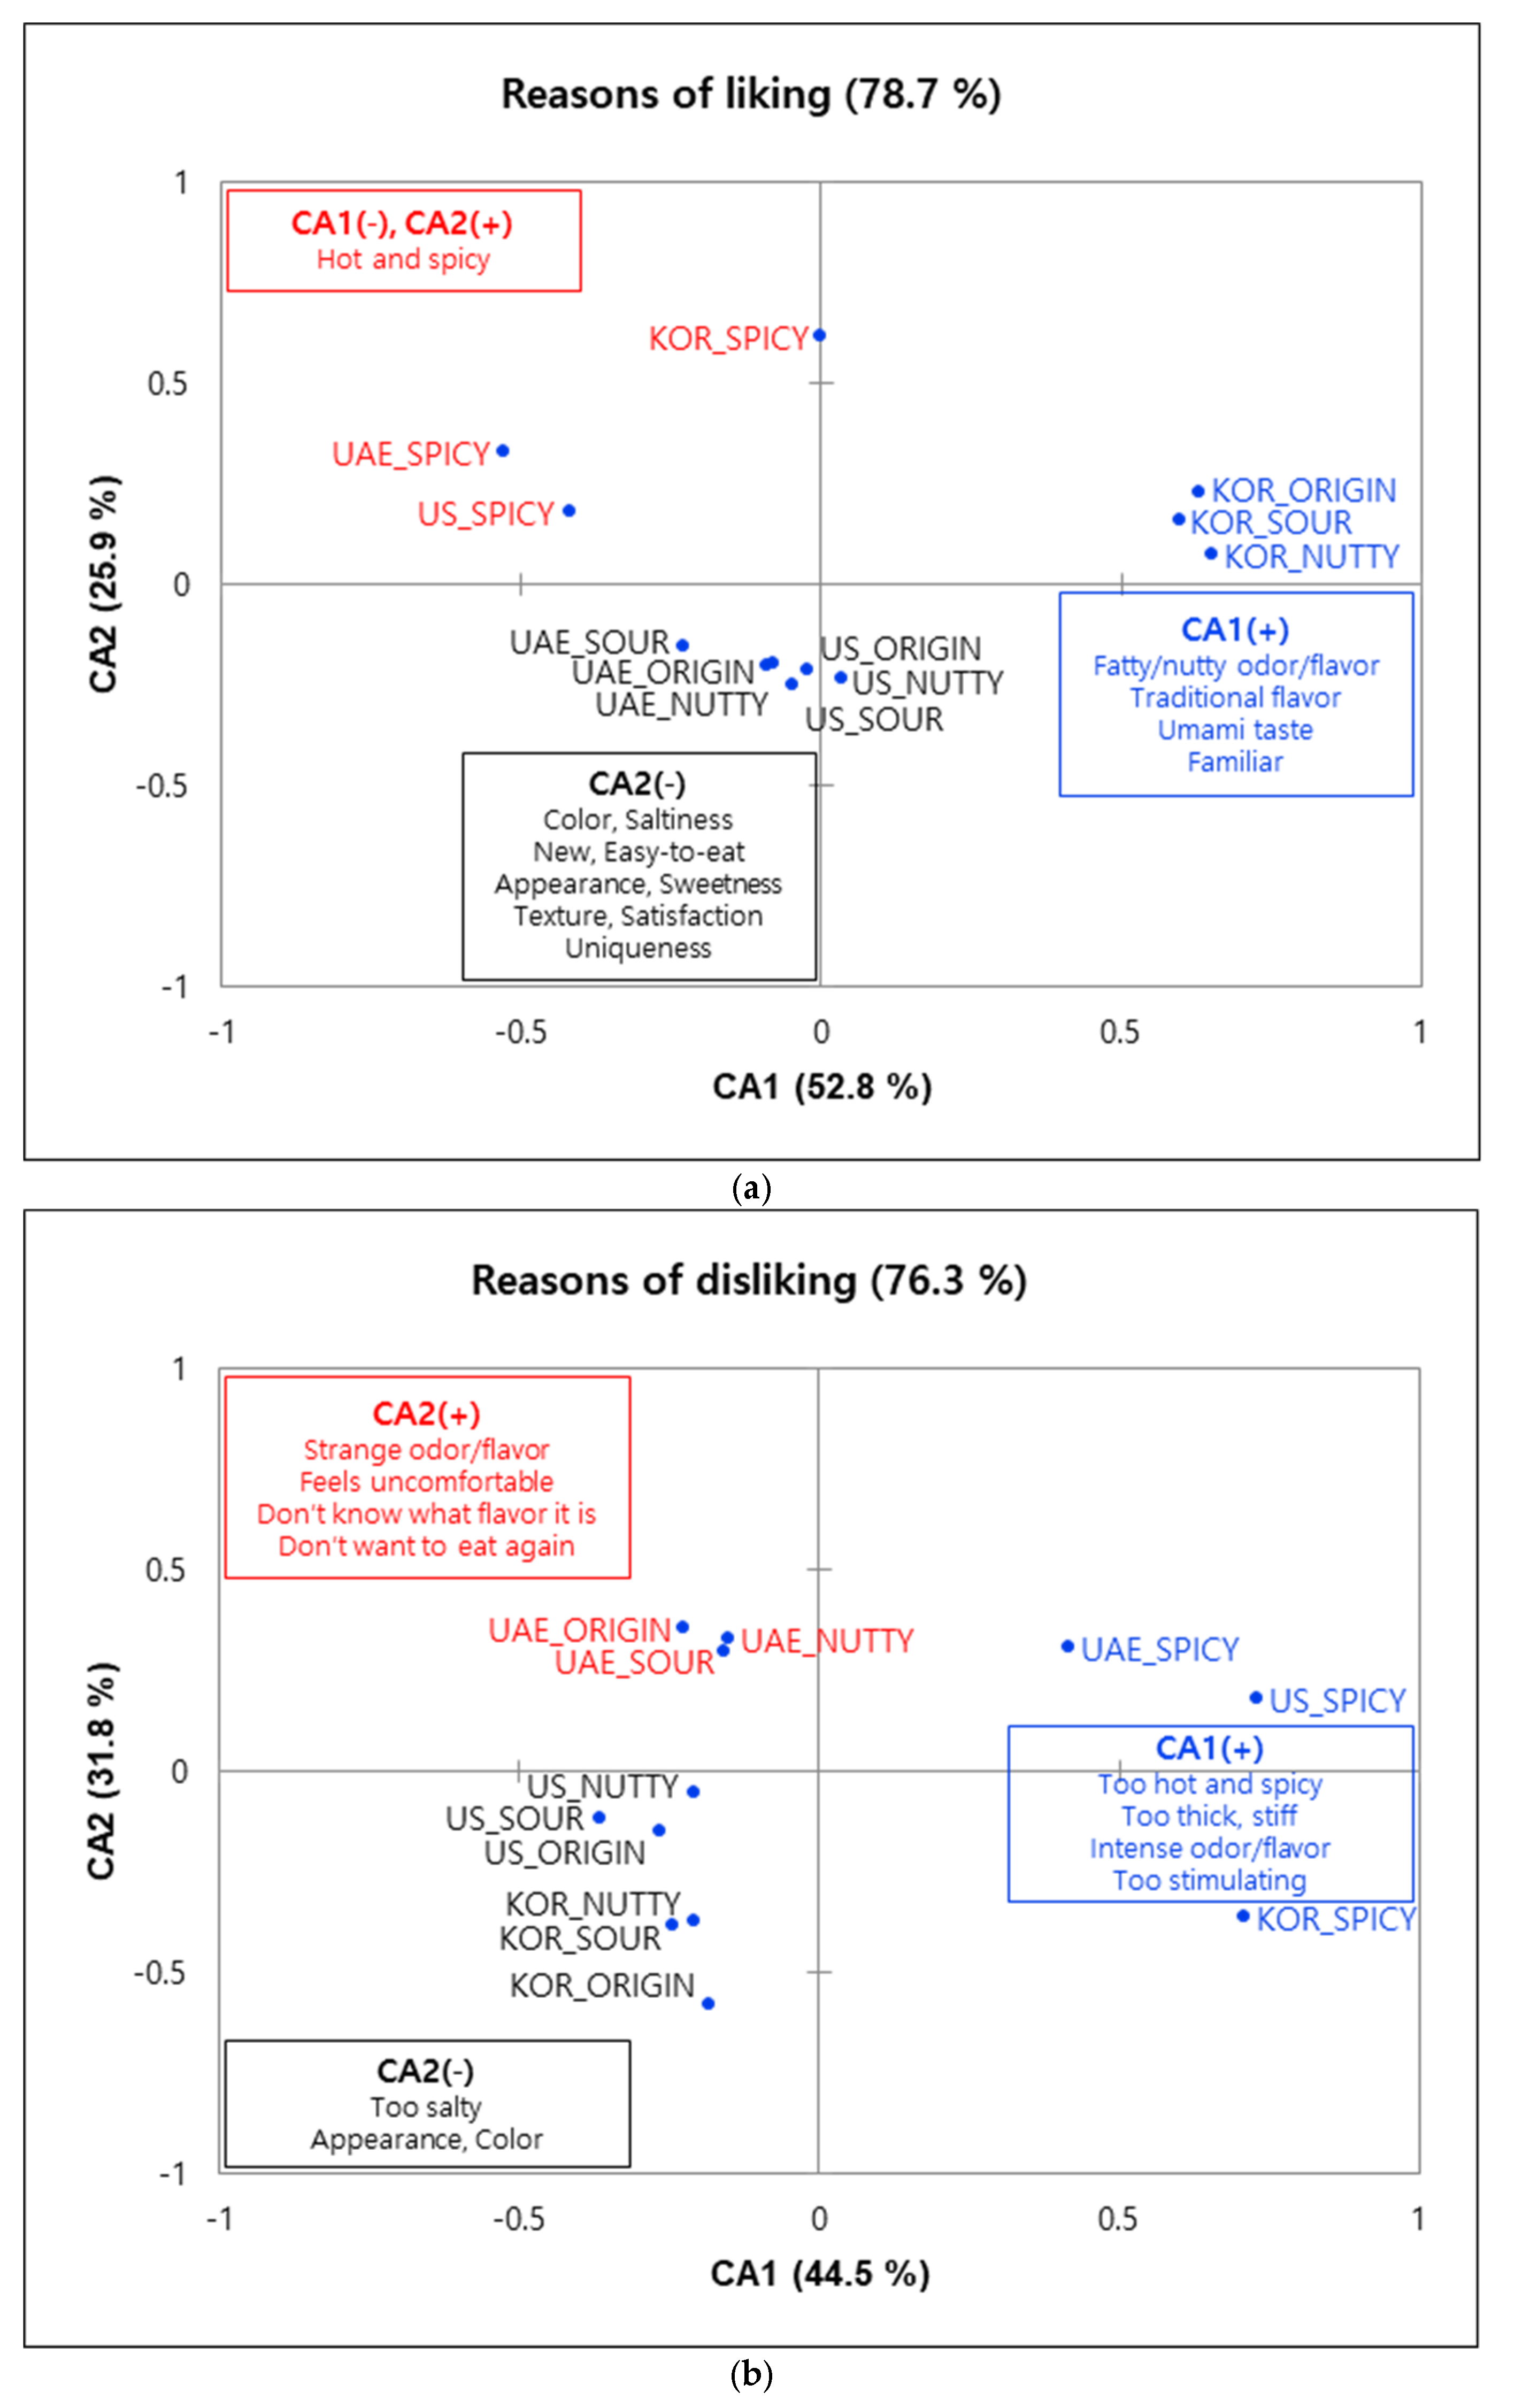
3.1.2. Reasons for Liking and Disliking the Samples
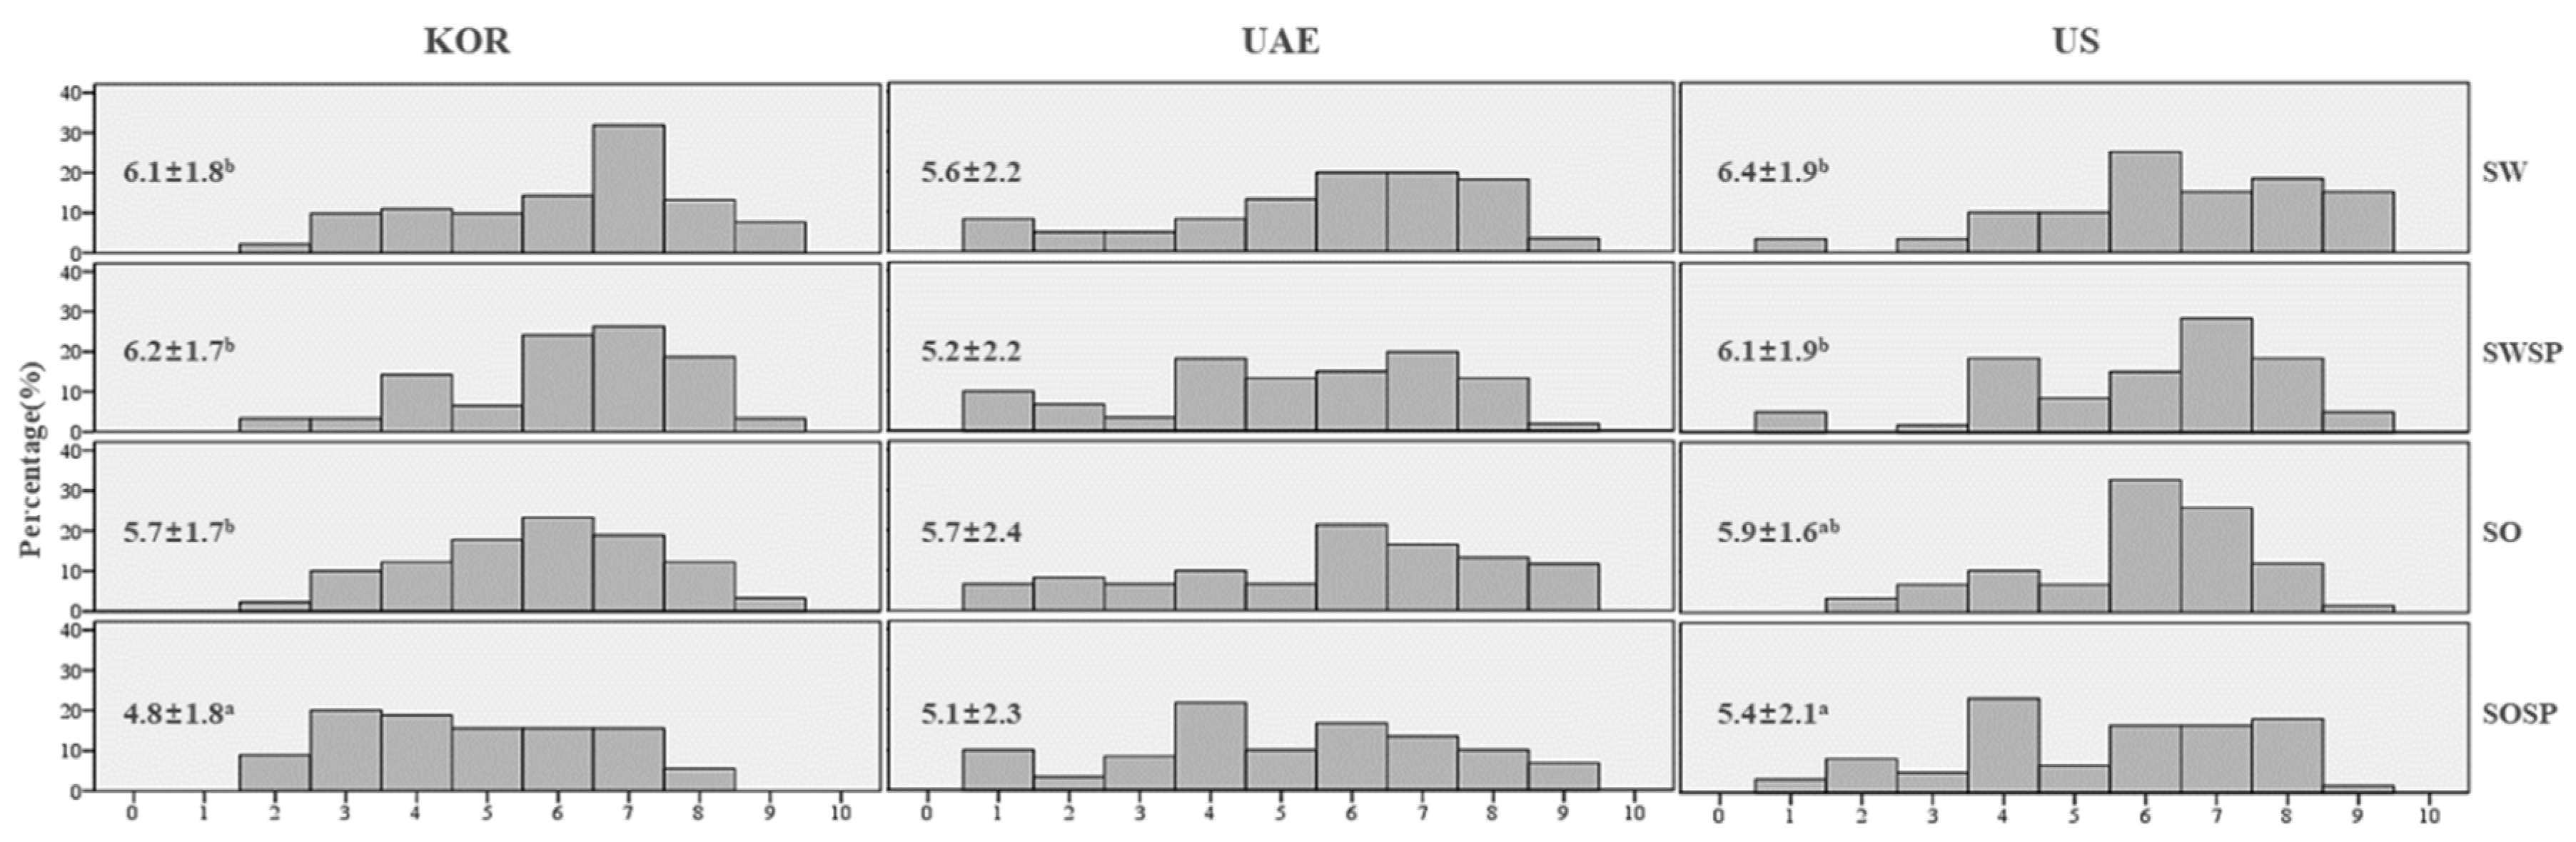
3.2. Dipping Sauce
3.2.1. Effect of Product and Country of Origin on Consumer Acceptance and Perception Ratings
3.2.2. Carrier Food
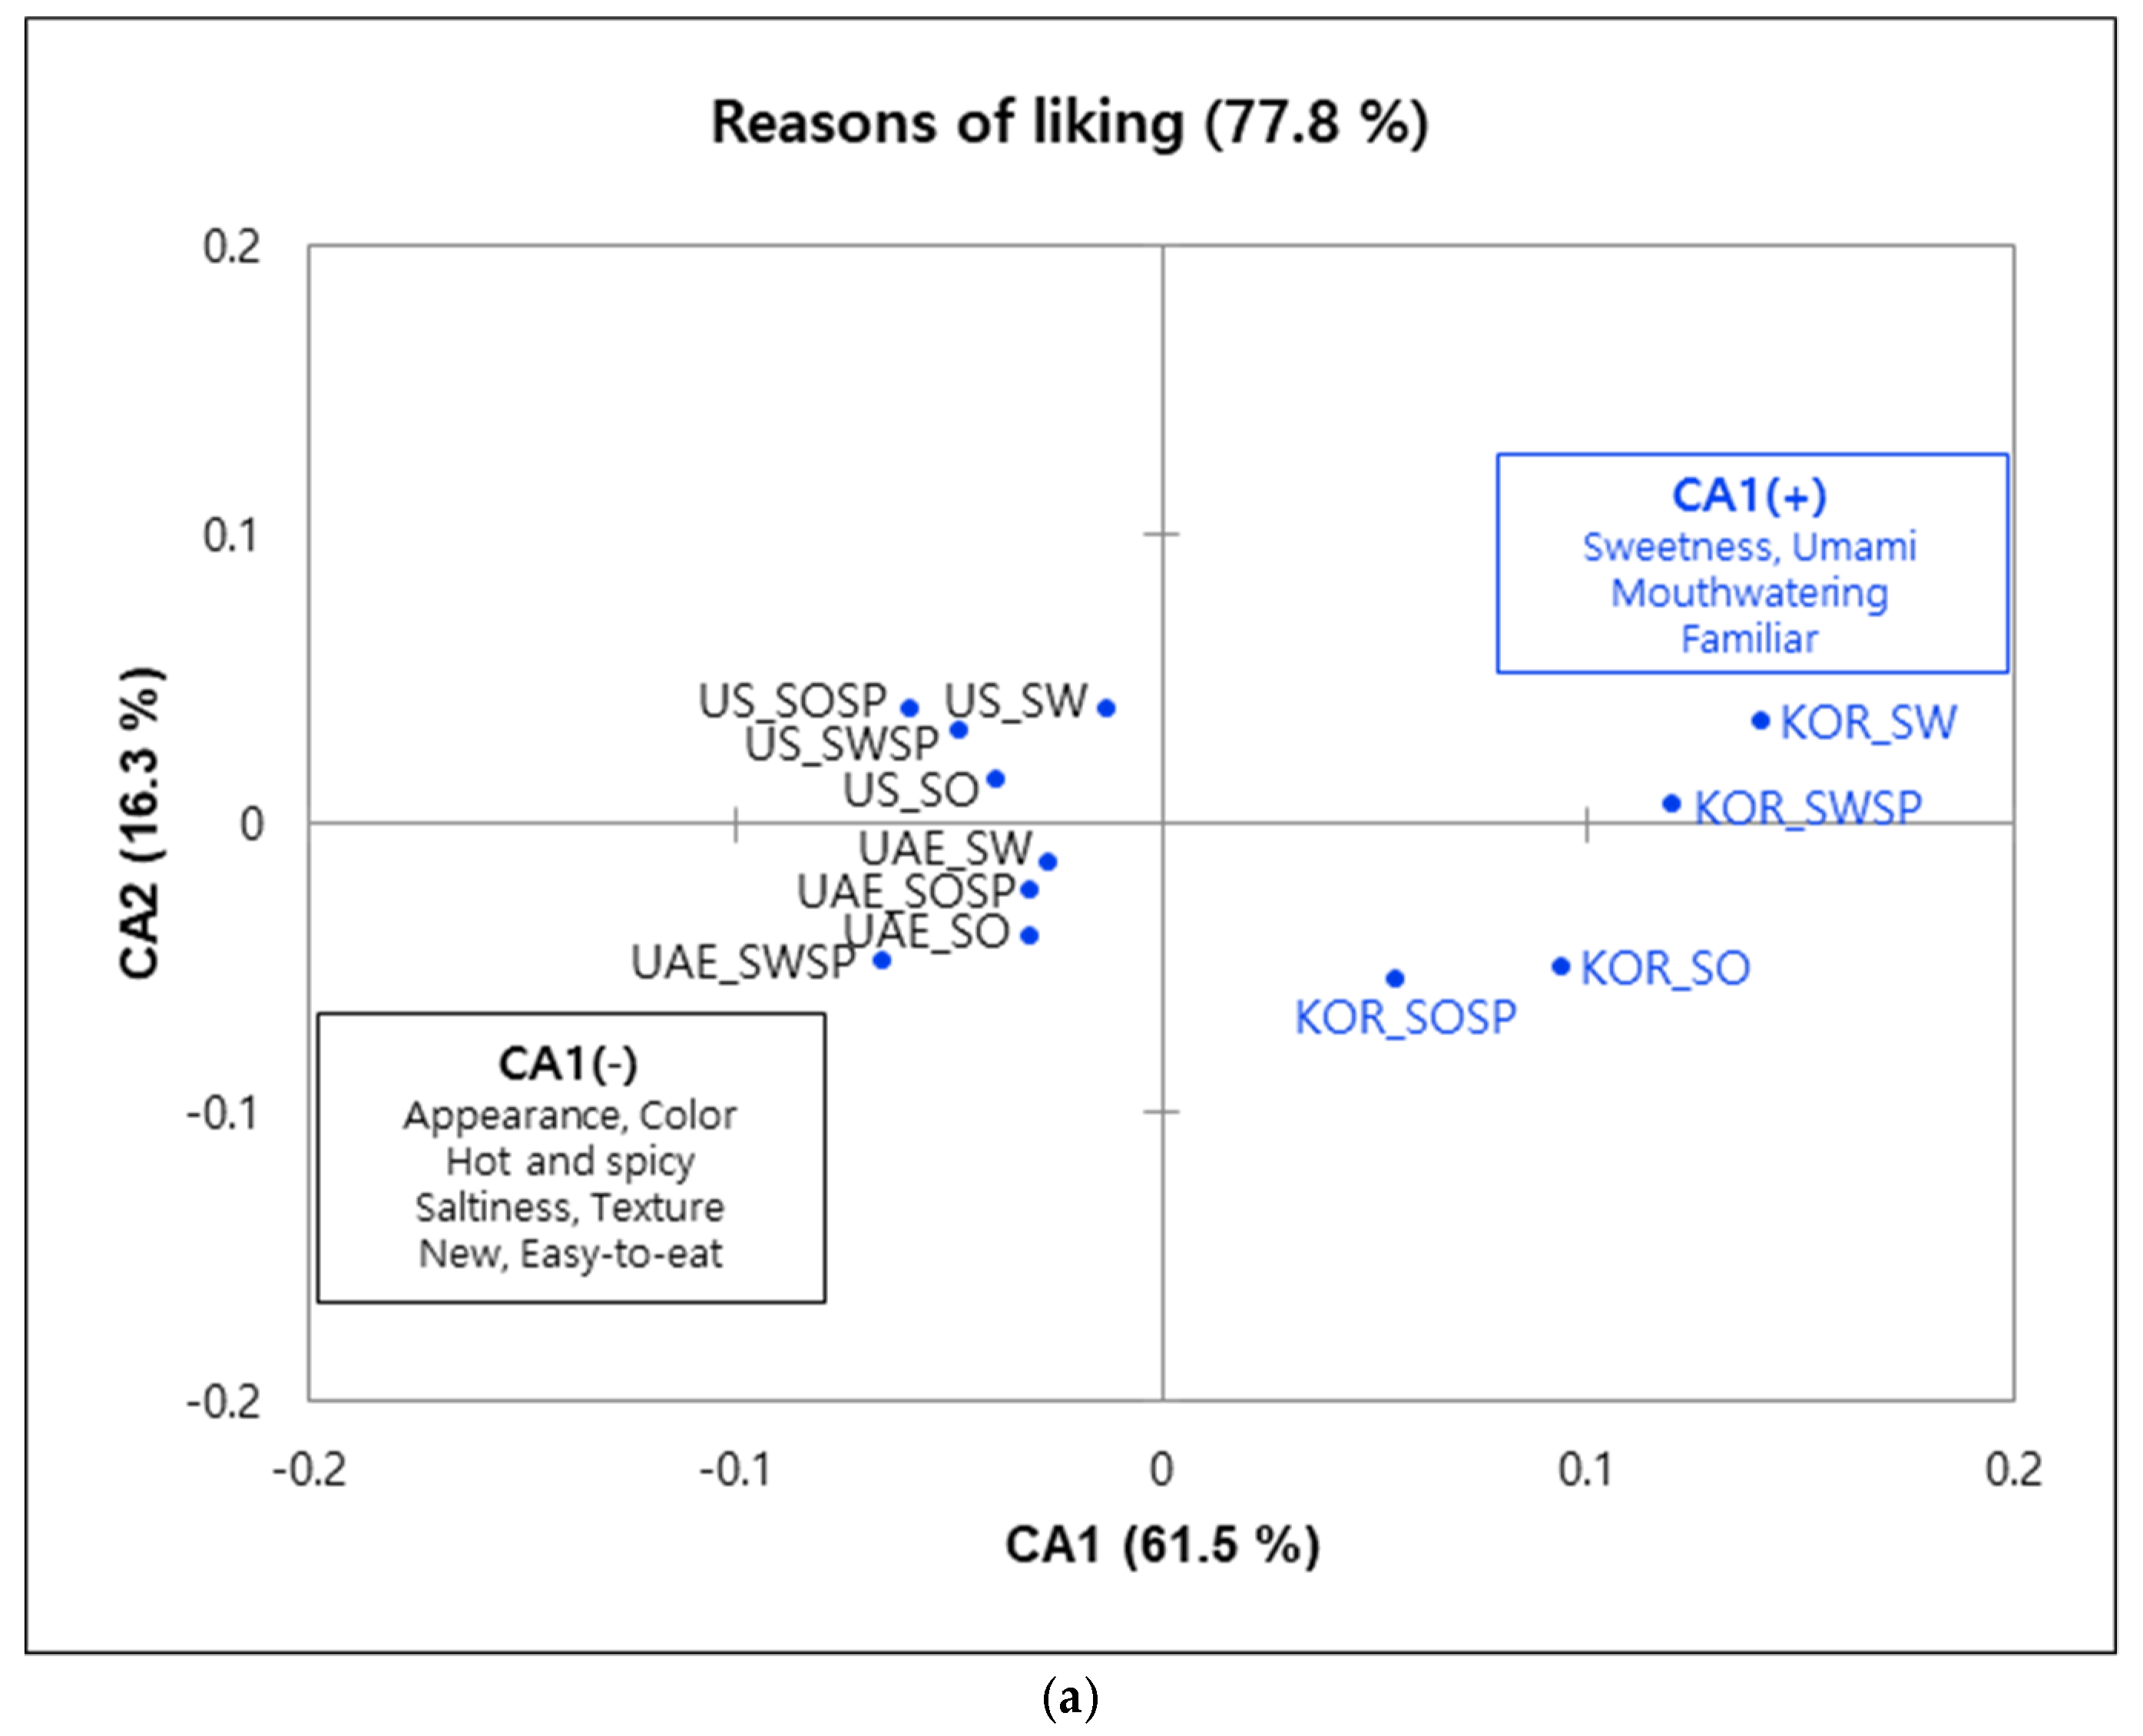
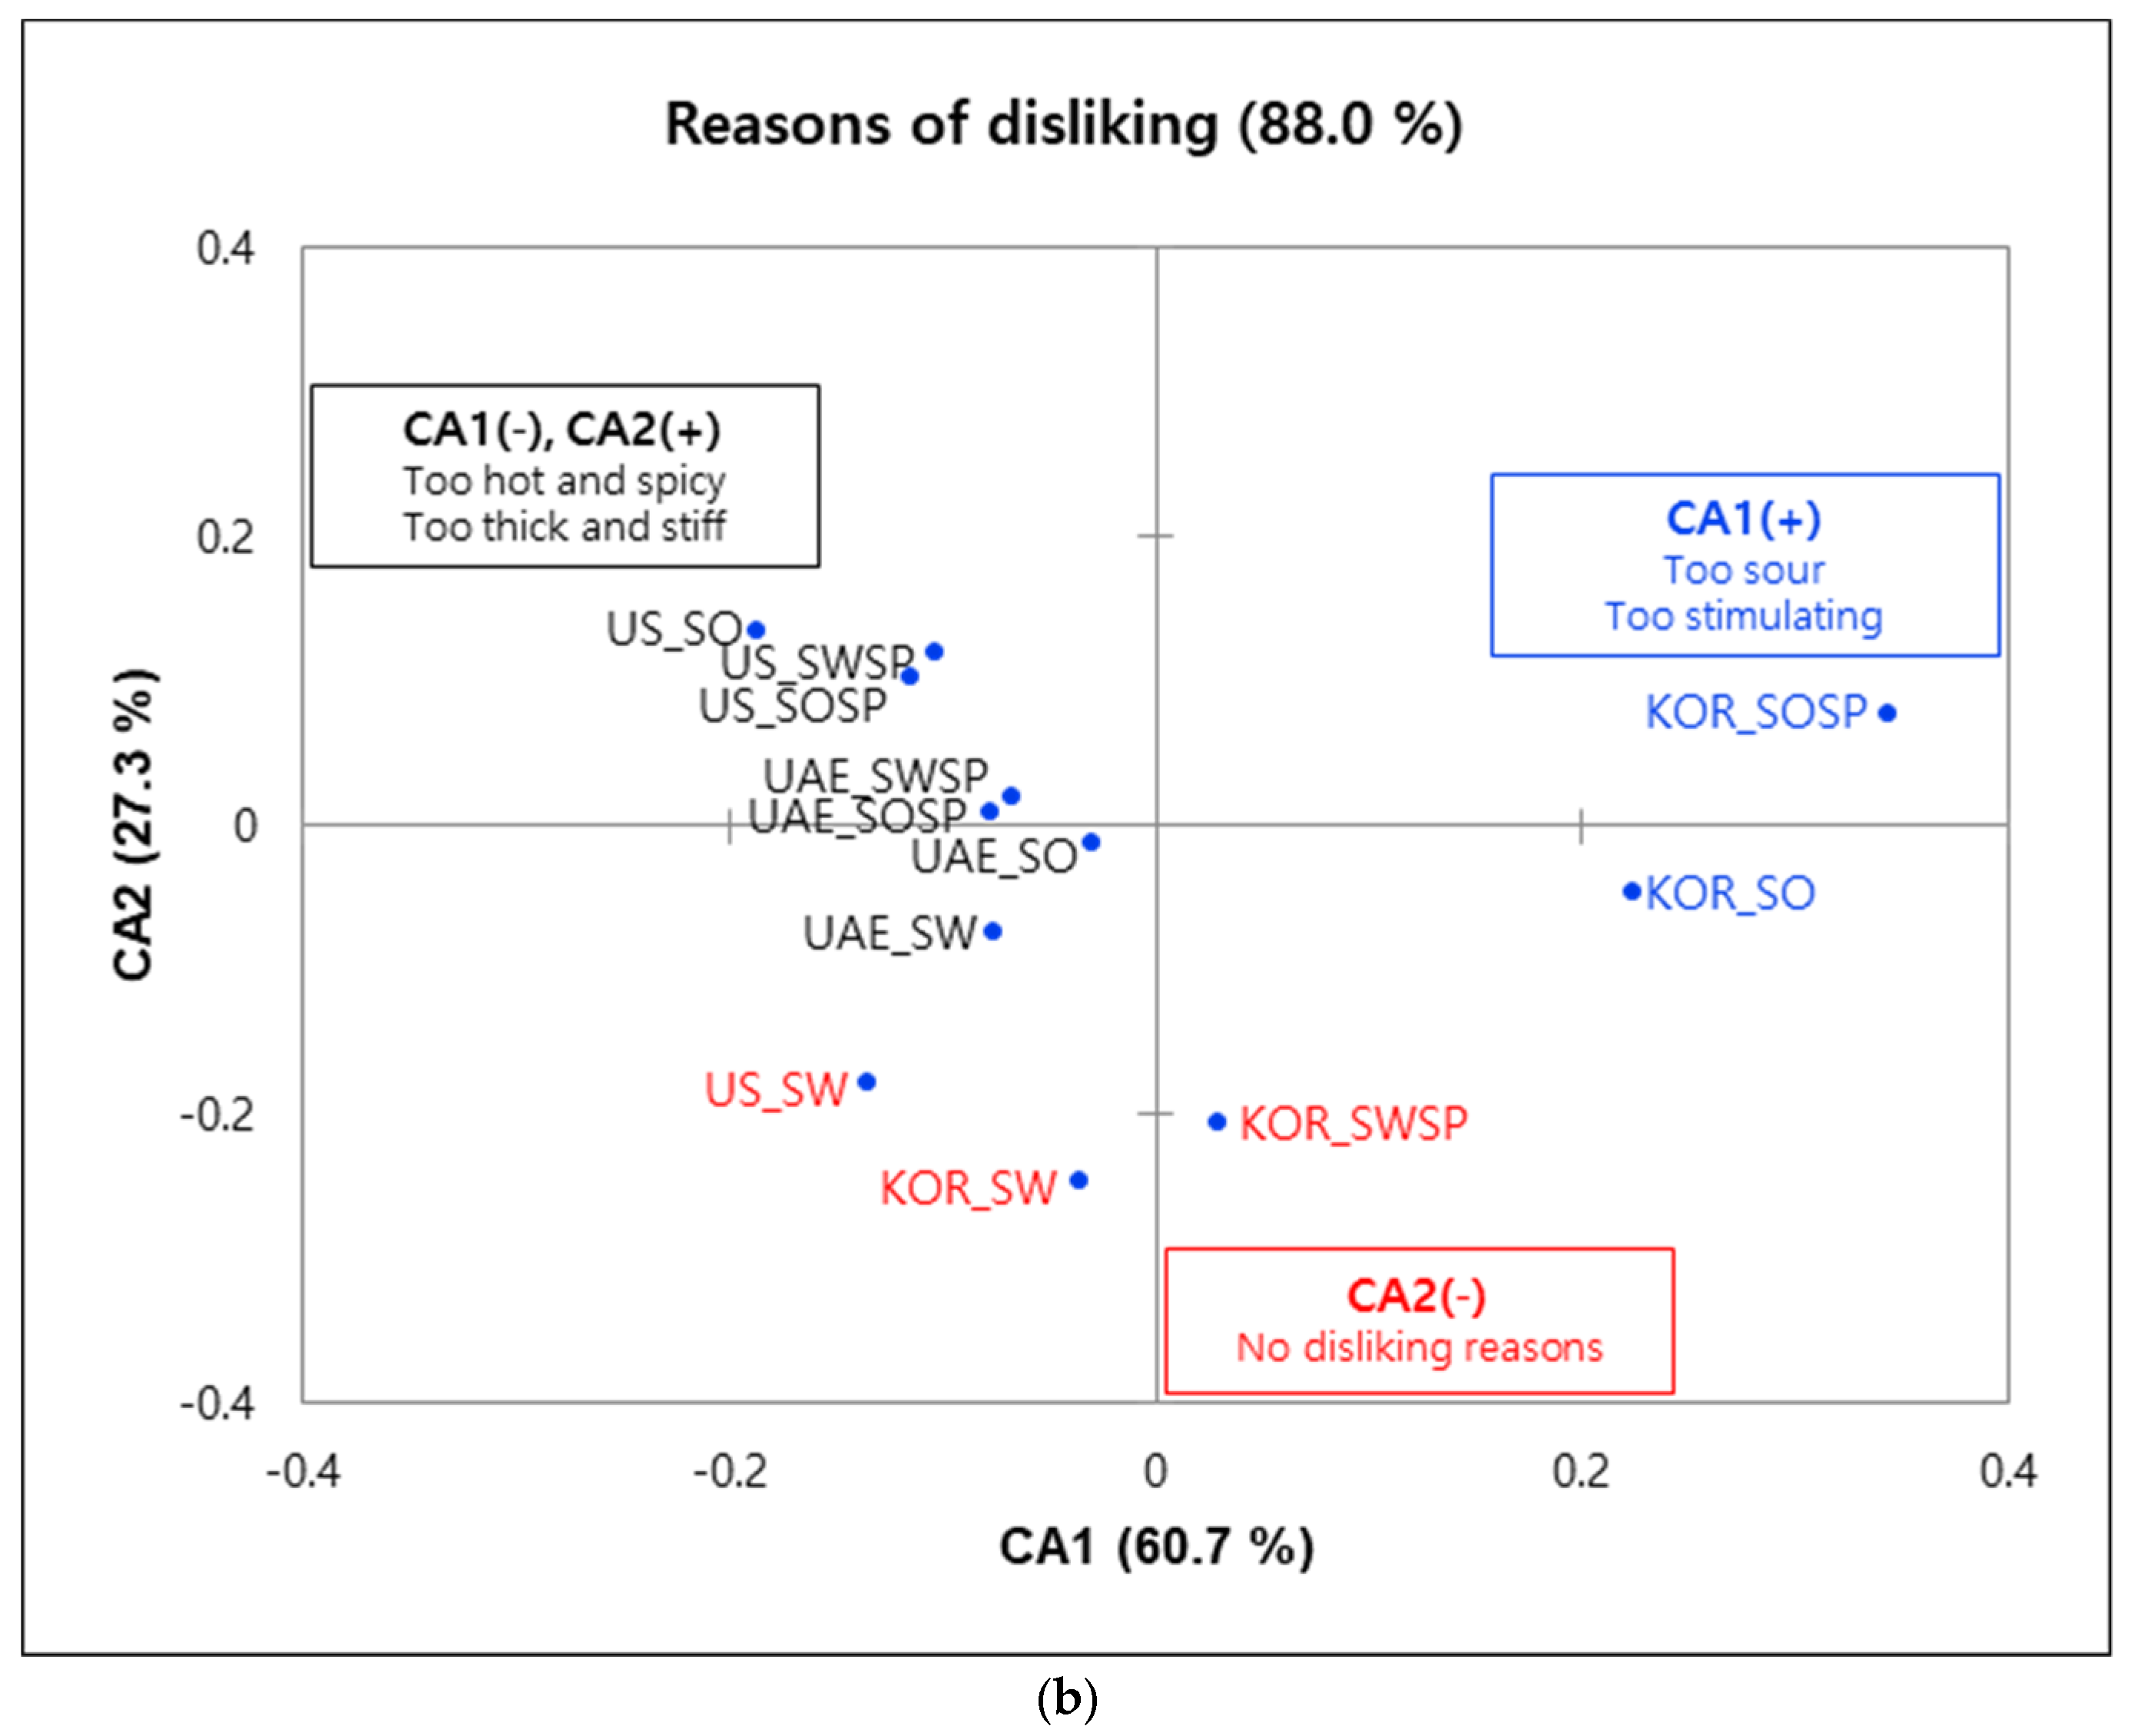
3.2.3. Reasons for Liking and Disliking the Samples
4. Discussion
5. Conclusions
Author Contributions
Funding
Acknowledgments
Conflicts of Interest
References
- Sasaki, M.; Nunomura, N. Fermented foods/soy(soya) sauce. In Encyclopedia of Food Sciences and Nutrition, 2nd ed.; Caballero, B., Trugo, L., Finglas, P.M., Eds.; Academic Press: Cambridge, MA, USA, 2007; pp. 2359–2369. [Google Scholar]
- Hong, J.H.; Park, H.S.; Chung, S.J.; Chung, L.; Cha, S.M.; Lê, S.; Kim, K.O. Effect of familiarity on a cross-cultural acceptance of a sweet ethnic food: A case study with Korean traditional cookie (Yackwa). J. Sens. Stud. 2014, 29, 110–125. [Google Scholar] [CrossRef]
- Burgess, P.J. Modification of a traditional Korean food product (Gochujang) to enhance its consumer acceptability as an ethnic food. J. Ethn. Foods 2014, 1, 13–18. [Google Scholar] [CrossRef][Green Version]
- Camarena, D.M.; Sanjuán, A.I.; Philippidis, G. Influence of ethnocentrism and neo-phobia on ethnic food consumption in Spain. Appetite 2011, 57, 121–130. [Google Scholar] [CrossRef]
- Verbeke, W.; López, G.P. Ethnic food attitudes and behaviour among Belgians and Hispanics living in Belgium. Brit. Food J. 2005, 107, 823–840. [Google Scholar] [CrossRef]
- Bell, B.; Adhikari, K.; Chambers, E.; Cherdchu, P.; Suwonsichon, T. Ethnic food awareness and perceptions of consumers in Thailand and the United States. Food Sci. Nutr. 2011, 41, 268–277. [Google Scholar] [CrossRef]
- Chung, L.; Chung, S.J.; Kim, J.Y.; Kim, K.O.; O’Mahony, M.; Vickers, Z.; Cha, S.M.; Ishii, R.; Baures, K.; Kim, H.R. Comparing the liking for Korean style salad dressings and beverages between US and Korean consumers: Effects of sensory and non-sensory factors. Food Qual. Prefer. 2012, 26, 105–108. [Google Scholar] [CrossRef]
- Hong, J.H.; Lee, K.W.; Chung, S.J.; Chung, L.; Kim, H.R.; Kim, K.O. Sensory characteristics and cross-cultural comparisons of consumer acceptability for Gochujang dressing. Food Sci. Biotechnol. 2012, 21, 829–837. [Google Scholar] [CrossRef]
- López-Guzmán, T.; Sánchez-Cañizares, S. Culinary tourism in Córdoba (Spain). Br. Food J. 2012, 114, 168–179. [Google Scholar] [CrossRef]
- Ottenbacher, M.C.; Harrington, R.J. A case study of a culinary tourism campaign in Germany: Implications for strategy making and successful implementation. J. Hosp. Tour. Res. 2013, 37, 3–28. [Google Scholar] [CrossRef]
- Wijaya, S. Indonesian food culture mapping: A starter contribution to promote Indonesian culinary tourism. J. Ethn. Food 2019, 6, 9. [Google Scholar] [CrossRef]
- Grand View Research. Sauces, Dressings & Condiments Market Size, Share & Trends Analysis Report by Product (Cooking Sauces, Dips), by Distribution Channel, by Region, and Segment Forecasts, 2019—2025. 2018. Available online: https://www.grandviewresearch.com/industry-analysis/sauces-dressings-condiments-market (accessed on 14 August 2020).
- Kim, S.; Choe, J.; Lee, A. Efforts to globalize a national food: Market segmentation by reasons for ethnic food preferences. Int. J. Contemp. Hosp. Manag. 2016, 28, 2010–2030. [Google Scholar] [CrossRef]
- Park, S.; Jang, H. Strategies to Expand Export in Halal Market: Focusing on the Cases of Small and Medium Enterprises; Trade Focus; Institute for International Trade: Peterborough, UK, 2017. [Google Scholar]
- Im, P.; Han, J.H.; Kim, Y.C.; Lee, B.; Kim, M.Y.; Chang, Y.; Yu, S.; Lee, Y. Effects of guar gum on quality of soft tofu stew sauce. J. Korean Soc. Food Sci. Nutr. 2015, 44, 442–448. [Google Scholar] [CrossRef][Green Version]
- Kim, H.J.; Chung, S.J.; Kim, K.O.; Nielsen, B.; Ishii, R.; O’Mahony, M. A cross-cultural study of acceptability and food pairing for hot sauces. Appetite 2018, 123, 306–316. [Google Scholar] [CrossRef]
- Hong, J.H.; Yoon, E.K.; Chung, S.J.; Chung, L.; Cha, S.M.; O’mahony, M.; Vickers, Z.; Kim, K.O. Sensory characteristics and cross-cultural consumer acceptability of Bulgogi (Korean traditional barbecued beef). J. Food Sci. 2011, 76, 306–313. [Google Scholar] [CrossRef]
- Jo, S.G.; Lee, S.M.; Sohn, K.H.; Kim, K.O. Sensory characteristics and cross-cultural acceptability of Chinese and Korean consumers for ready-to-heat (RTH) type bulgogi (Korean traditional barbecued beef). Food Sci. Biotechnol. 2015, 24, 921–930. [Google Scholar] [CrossRef]
- Kang, N.E.; Jo, S.K.; Lee, S.M.; Kim, K.O. Cross-cultural investigation on Chinese and Korean consumers’ reasons for liking and disliking for bulgogi using check-all-that-apply questionnaire. J. Korean Soc. Food Cult. 2014, 29, 567–576. [Google Scholar] [CrossRef]
- Choi, J.H.; Gwak, M.J.; Chung, S.J.; Kim, K.O.; O’Mahony, M.; Ishii, R.; Bae, Y.W. Identifying the drivers of liking by investigating the reasons for (dis) liking using CATA in cross-cultural context: A case study on barbecue sauce. J. Sci. Food Agric. 2015, 95, 1613–1625. [Google Scholar] [CrossRef]
- Moskowitz, H.W.; Kumaraiah, V.; Sharma, K.N.; Jacobs, H.L.; Sharma, S.D. Cross-cultural differences in simple taste preferences. Science 1975, 19, 1217–1218. [Google Scholar] [CrossRef]
- Druz, L.L.; Baldwin, R.E. Taste thresholds and hedonic responses of panels representing three nationalities. J. Food Sci. 1982, 47, 561–563. [Google Scholar] [CrossRef]
- Prescott, J.; Young, O.; Zhang, S.; Cummings, T. Effects of added “flavour principles” on liking and familiarity of a sheepmeat product: A comparison of Singaporean and New Zealand consumers. Food Qual. Prefer. 2004, 15, 187–194. [Google Scholar] [CrossRef]
- Dolgopolova, I.; Teuber, R.; Bruschi, V. Consumers’ perceptions of functional foods: Trust and food-neophobia in a cross-cultural context. Int. J. Consum. Stud. 2015, 39, 708–715. [Google Scholar] [CrossRef]
- Jang, S.H.; Kim, M.J.; Lim, J.; Hong, J.H. Cross-cultural comparison of consumer acceptability of kimchi with different degree of fermentation. J. Sens. Stud. 2016, 31, 124–134. [Google Scholar] [CrossRef]
- Mialon, V.S.; Clark, M.R.; Leppard, P.I.; Cox, D.N. The effect of dietary fibre information on consumer responses to breads and “English” muffins: A cross-cultural study. Food Qual. Prefer. 2002, 13, 1–12. [Google Scholar] [CrossRef]
- Varela, P.; Ares, G. Sensory profiling, the blurred line between sensory and consumer science. A review of novel methods for product characterization. Food Res. Int. 2012, 48, 893–908. [Google Scholar] [CrossRef]
- Rasinski, K.A.; Mingay, D.; Bradburn, N.M. Do respondents really mark all that apply on self-administered questions? Public Opin. Quart. 1994, 58, 400–408. [Google Scholar] [CrossRef]
- Adams, J.; Williams, A.; Lancaster, B.; Foley, M. Advantages and uses of check-all-that-apply response compared to traditional scaling of attributes for salty snacks. In Proceedings of the 7th Pangborn Sensory Science Symposium, Minneapolis, MN, USA, 12–16 August 2007. [Google Scholar]
- Gunaratne, T.M.; Viejo, C.G.; Fuentes, S.; Torrico, D.D.; Gunaratne, N.M.; Ashman, H.; Dunshea, F.R. Development of emotion lexicons to describe chocolate using the Check-All-That-Apply (CATA) methodology across Asian and Western groups. Food Res. Int. 2019, 115, 526–553. [Google Scholar] [CrossRef]
- Jaeger, S.R.; Chheang, S.L.; Jin, Y.; Bava, C.M.; Gimenez, A.; Vidal, L. Check-all-that-apply (CATA) responses elicited by consumers: Within-assessor reproducibility and stability of sensory product characterizations. Food Qual. Prefer. 2013, 30, 56–67. [Google Scholar] [CrossRef]
- Peryam, D.R.; Pilgrim, F.J. Hedonic scale method of measuring food preferences. Food Technol. 1957, 11, 9–14. [Google Scholar]
- Pitts, S. Mean versus scale mid-point, Appendix, F. In Just-About-Right (JAR) Scales: Design, Usage, Benefits and Risks; ASTM manual 63; Rotham, L., Parker, M.J., Eds.; ASTM Intl.: West Conshohoken, PA, USA, 2009; pp. 27–28. [Google Scholar]
- Zhang, X.Y.; Guo, H.Y.; Zhao, L.; Sun, W.F.; Zeng, S.S.; Lu, X.M.; Cao, X.; Ren, F.Z. Sensory profile and Beijing youth preference of seven cheese varieties. Food Qual. Prefer. 2011, 22, 101–109. [Google Scholar] [CrossRef]
- Akissoé, N.H.; Sacca, C.; Declemy, A.L.; Bechoff, A.; Anihouvi, V.B.; Dalodé, G.; Pallet, D.; Fliedel, G.; Mestres, C.; Hounhouigan, J.D.; et al. Cross-cultural acceptance of a traditional yoghurt-like product made from fermented cereal. J. Sci. Food Agric. 2015, 95, 1876–1884. [Google Scholar] [CrossRef]
- Go, J.E.; Kim, M.R.; Chung, S.J. Acquired (dis)liking of natural cheese in different repeated exposure environment. Food Res. Int. 2017, 99, 403–412. [Google Scholar] [CrossRef]
- Hwang, S.H.; Hong, J.H. Sensory drivers of goso flavour in soymilk: Understanding a complex traditional sensory attribute. Food Qual Prefer. 2013, 29, 113–125. [Google Scholar] [CrossRef]
- Kim, S.H.; Petard, N.; Hong, J.H. What is lost in translation: A cross-cultural study to compare the concept of nuttiness and its perception in soymilk among Korean, Chinese, and Western groups. Food Res. Int. 2018, 105, 970–981. [Google Scholar] [CrossRef]
- Spence, C. Why is piquant/spicy food so popular? Int. J. Gastron. Food Sci. 2018, 12, 16–21. [Google Scholar] [CrossRef]
- Park, H.-J.; Ko, J.-M.; Lim, J.; Hong, J.-H. American consumers’ perception and acceptance of an ethnic food with strong flavor: A case study of Kimchi with varying levels of red pepper and fish sauce. J. Sci. Food Agric. 2020, 100, 2348–2357. [Google Scholar] [CrossRef]
- Lawless, H.; Rozin, P.; Shenker, J. Effects of oral capsaicin on gustatory, olfactory and irritant sensations and flavor identification in humans who regularly or rarely consume chili pepper. Chem. Senses 1985, 10, 579–589. [Google Scholar] [CrossRef]
- Reinbach, H.C.; Meinert, L.; Ballabio, D.; Aaslyng, M.D.; Bredie, W.L.P.; Olsena, K.; Møller, P. Interactions between oral burn, meat flavor and texture in chili spiced pork patties evaluated by time-intensity. Food Qual. Prefer. 2007, 18, 909–919. [Google Scholar] [CrossRef]
- Kapaun, C.L.; Dando, R. Deconvoluting physical and chemical heat: Temperature and spiciness influence flavor differently. Physiol. Behav. 2017, 170, 54–61. [Google Scholar] [CrossRef]
- Torrico, D.D.; Fuentes, S.; Viejo, C.G.; Ashman, H.; Dunshea, F.R. Cross-cultural effects of food product familiarity on sensory acceptability and non-invasive physiological responses of consumers. Food Res. Int. 2019, 115, 439–450. [Google Scholar] [CrossRef]
- De Graaf, C.; Cardello, A.V.; Kramer, F.M.; Lesher, L.L.; Meiselman, H.L.; Schutz, H.G. A comparison between liking ratings obtained under laboratory and field conditions: The role of choice. Appetite 2005, 44, 15–22. [Google Scholar] [CrossRef]
- Chung, S.J.; Vickers, Z. Long-term acceptability and choice of teas differing in sweetness. Food Qual. Prefer. 2007, 18, 963–974. [Google Scholar] [CrossRef]
- Spinelli, S.; De Toffoli, A.; Dinnella, C.; Laureati, M.; Pagliarini, E.; Bendini, A. Personality traits and gender influence liking and choice of food pungency. Food Qual. Prefer. 2018, 66, 113–126. [Google Scholar] [CrossRef]
- Trachootham, D.; Sato-Kuriwada, S.; Lam-Ubol, A.; Promkam, C.; Chotechuang, N.; Sasano, T.; Shoji, N. Differences in taste perception and spicy preference: A Thai—Japanese cross-cultural study. Chem. Senses 2017, 43, 65–74. [Google Scholar] [CrossRef]
- Scott, N.O.; Burgess, B.; Tepper, B.J. Perception and liking of soups flavored with chipotle chili and ginger extracts: Effects of PROP taster status, personality traits and emotions. Food Qual. Prefer. 2019, 73, 192–201. [Google Scholar] [CrossRef]
- Rozin, E. Ethnic Cuisine: The Flavor-Principle Cookbook; The Stephen Greene Press: Brattleboro, VT, USA, 1983. [Google Scholar]
- Rozin, P.; Schiller, D. The nature and acquisition of a preference for chili pepper by humans. Motiv. Emot. 1980, 4, 77–101. [Google Scholar] [CrossRef]
- Rozin, P. Getting to like the burn of chili pepper. Biological, psychological and cultural perspectives. In Chemical Senses, Irritation; Green, B.G., Mason, J.R., Kare, M.R., Eds.; Dekker: New York, NY, USA, 1990; Volume 3, pp. 231–269. [Google Scholar]
- Carstens, E.; Carstens, M.I.; Dessirier, J.M.; O’Mahony, M.; Simons, C.T.; Sudo, M.; Sudo, S. It hurts so good: Oral irritation by spices and carbonated drinks and the underlying neural mechanisms. Food Qual. Prefer. 2002, 13, 431–443. [Google Scholar] [CrossRef]
- Cowart, B.J. Oral chemical irritation: Does it reduce perceived taste intensity? Chem. Senses 1987, 12, 467–479. [Google Scholar] [CrossRef]
- Stevenson, R.J.; Prescott, J. The effects of prior experience with capsaicin on ratings of its burn. Chem. Senses 1994, 19, 651–656. [Google Scholar] [CrossRef]
- Nolden, A.A.; Hayes, J.E. Perceptual and affective responses to sampled capsaicin differ by reported intake. Food Qual. Prefer. 2017, 55, 26–34. [Google Scholar] [CrossRef]
- Pliner, P.; Hobden, K. Development of a scale to measure the trait of food neophobia in humans. Appetite 1992, 19, 105–120. [Google Scholar] [CrossRef]


| Group | Category | KOR † | UAE | US |
|---|---|---|---|---|
| Number of Subjects | 91 | 70 | 60 | |
| Age | Average ± S.D. | 27.6 ± 10.0 | 23.4 ± 8.8 | 39.4 ± 13.5 |
| Sex | Male | 30 (33%) | 9 (12.9%) | 27 (45%) |
| Female | 61 (67%) | 44 (62.9%) | 33 (55%) | |
| No response | - | 17 (24.2%) | - | |
| Ethnicity | Caucasian | - | 1 (1.4%) | 34 (56.7%) |
| African American | - | 1 (1.4%) | 8 (13.3%) | |
| Arab | - | 51 (72.9%) | - | |
| Asian | 91 (100%) | 2 (2.9%) | 18 (30%) | |
| Multi-racial | - | 2 (2.9%) | - | |
| No response | - | 13 (18.6%) |
| Type | Sample | Main Ingredients |
|---|---|---|
| Salad dressing | Original | Conventional-type doenjang (soybean, wheat flour, wheat grain, salt, flavor enhancers IMP and GMP †) |
| Sour | Original + Apple vinegar | |
| Nutty | Original + Peanut paste | |
| Spicy | Original + Chili pepper powder | |
| Spicy dipping sauce | Sweet | Wheat grain, wheat, starch syrup, high-fructose corn syrup, tomato ketchup, onion, garlic |
| Sour | Wheat grain, wheat, high-fructose corn syrup, vinegar, citric acid | |
| Spicy + Sweet | Sweet sample + Chili pepper powder | |
| Spicy + Sour | Sour sample + Chili pepper powder |
| Source of Variation | Sample | Country | Sample × Country |
|---|---|---|---|
| Overall liking | 0.002 † | 0.000 | 0.000 |
| Appearance liking | 0.002 | 0.000 | 0.000 |
| Smell/Odor liking | 0.001 | 0.000 | 0.000 |
| Taste/Flavor liking | 0.003 | 0.000 | 0.000 |
| Texture liking | 0.514 | 0.000 | 0.000 |
| Saltiness intensity | 0.152 | 0.000 | 0.002 |
| Thickness/viscosity intensity | 0.000 | 0.055 | 0.000 |
| Familiarity | 0.210 | 0.000 | 0.001 |
| Country | Sample | Saltiness | Thickness/Viscosity | Familiarity |
|---|---|---|---|---|
| KOR | Original | 6.8 ± 1.4 b,‡,*,§ | 5.1 ± 1.1 b | 5.5 ± 1.8 b,c |
| Sour | 6.5 ± 1.4 a,* | 4.1 ± 1.3 a,* | 5.1 ± 1.8 a,b | |
| Nutty | 6.3 ± 1.3 a,* | 5.7 ± 1.3 c,* | 5.7 ± 1.8 c | |
| Spicy | 6.9 ± 1.3 b,* | 6.4 ± 1.6 d,* | 4.9 ± 2.2 a | |
| UAE | Original | 5 ± 2.2 | 5.3 ± 1.9 a,b | 3.1 ± 2.2 a |
| Sour | 4.8 ± 2.1 | 4.8 ± 2.1 a | 3.1 ± 2.1 a | |
| Nutty | 5.2 ± 2.1 | 5.7 ± 2.2 b,c,* | 3.7 ± 2.2 b | |
| Spicy | 4.9 ± 2.1 | 6 ± 1.9 c, * | 3.8 ± 2.2 b | |
| US | Original | 6.1 ± 2.2 b,* | 6.2 ± 1.5 b,* | 3.7 ± 2.4 |
| Sour | 5.9 ± 1.7 b,* | 4.9 ± 1.5 a | 4.1 ± 2.4 | |
| Nutty | 6.0 ± 1.8 b,* | 6.2 ± 1.6b * | 4 ± 2.4 | |
| Spicy | 5.3 ± 1.7 a | 5.8 ± 1.4b * | 3.9 ± 2.3 |
| Source of Variation | Sample | Country | Carrier | Sample × Country | Sample × Carrier | Country × Carrier | Sample × Country × Carrier |
|---|---|---|---|---|---|---|---|
| Overall liking | 0.000 † | 0.691 | 0.282 | 0.453 | 0.856 | 0.017 | 0.456 |
| Appearance | 0.163 | 0.151 | 0.528 | 0.215 | 0.664 | 0.182 | 0.355 |
| Smell/Odor | 0.005 | 0.914 | 0.230 | 0.510 | 0.458 | 0.192 | 0.873 |
| Taste/Flavor | 0.000 | 0.792 | 0.341 | 0.273 | 0.836 | 0.055 | 0.793 |
| Texture | 0.052 | 0.314 | 0.211 | 0.229 | 0.752 | 0.315 | 0.481 |
| Hot and spicy intensity | 0.000 | 0.648 | 0.000 | 0.004 | 0.818 | 0.457 | 0.121 |
| Thickness/Viscosity intensity | 0.059 | 0.063 | 0.164 | 0.000 | 0.007 | 0.431 | 0.056 |
| Familiarity | 0.935 | 0.000 | 0.658 | 0.075 | 0.554 | 0.684 | 0.843 |
| Country | Sample | Hot and Spicy | Thickness | Familiarity |
|---|---|---|---|---|
| KOR | SW | 5.1 ± 1.3 a,‡,*,§ | 5.5 ± 1.0,b,* | 5.8 ± 1.7 a |
| SWSP | 5.1 ± 1.2 a | 5.3 ± 0.8 b,* | 5.9 ± 1.7 a,b | |
| SO | 5.7 ± 1.4 b,* | 5.3 ± 1.0 b,* | 6.3 ± 1.7 b | |
| SOSP | 6.4 ± 1.4 c,* | 4.9 ± 0.9 a | 5.8 ± 2.1 a | |
| UAE | SW | 5.6 ± 2.1 * | 5.8 ± 1.9 * | 4.7 ± 2.2 |
| SWSP | 6.5 ± 2.3 * | 5.5 ± 1.7 * | 4.4 ± 2.2 | |
| SO | 6.1 ± 2.0 * | 5.5 ± 1.9 | 4.8 ± 2.3 | |
| SOSP | 6.6 ± 2.2 * | 5.9 ± 1.8 * | 5 ± 2.4 | |
| US | SW | 5.3 ± 1.7 a | 5.2 ± 1.3 a | 4.4 ± 2.2 |
| SWSP | 6.4 ± 1.8 b,* | 5.2 ± 1.3 a | 4.3 ± 2.2 | |
| SO | 5.8 ± 1.9 a,b,* | 6.3 ± 1.7 b,* | 3.9 ± 2.1 | |
| SOSP | 6.2 ± 2.1 b,* | 5.8 ± 1.6 b,* | 4.2 ± 2.2 |
Publisher’s Note: MDPI stays neutral with regard to jurisdictional claims in published maps and institutional affiliations. |
© 2020 by the authors. Licensee MDPI, Basel, Switzerland. This article is an open access article distributed under the terms and conditions of the Creative Commons Attribution (CC BY) license (http://creativecommons.org/licenses/by/4.0/).
Share and Cite
Kim, M.-R.; Chung, S.-J.; Adhikari, K.; Shin, H.; Cho, H.; Nam, Y. Cross-Cultural Consumer Acceptability for Ethnic Fermented Sauce Products: Comparisons among Korean, UAE, and US Consumers. Foods 2020, 9, 1463. https://doi.org/10.3390/foods9101463
Kim M-R, Chung S-J, Adhikari K, Shin H, Cho H, Nam Y. Cross-Cultural Consumer Acceptability for Ethnic Fermented Sauce Products: Comparisons among Korean, UAE, and US Consumers. Foods. 2020; 9(10):1463. https://doi.org/10.3390/foods9101463
Chicago/Turabian StyleKim, Mi-Ran, Seo-Jin Chung, Koushik Adhikari, HyeWon Shin, Hana Cho, and Yerim Nam. 2020. "Cross-Cultural Consumer Acceptability for Ethnic Fermented Sauce Products: Comparisons among Korean, UAE, and US Consumers" Foods 9, no. 10: 1463. https://doi.org/10.3390/foods9101463
APA StyleKim, M.-R., Chung, S.-J., Adhikari, K., Shin, H., Cho, H., & Nam, Y. (2020). Cross-Cultural Consumer Acceptability for Ethnic Fermented Sauce Products: Comparisons among Korean, UAE, and US Consumers. Foods, 9(10), 1463. https://doi.org/10.3390/foods9101463