Article

In Vitro Starch Digestibility and Glycaemic Index of Fried Dough and Batter Enriched with Wheat and Oat Bran

by
Oluwatoyin O. Onipe
1,
Daniso Beswa
2 and
Afam I. O. Jideani
1,*
1
Department of Food Science and Technology, School of Agriculture, University of Venda, Thohoyandou 0950, South Africa
2
Department of Biotechnology and Food Technology, Faculty of Science, University of Johannesburg, Doornfontein 2028, South Africa
*
Author to whom correspondence should be addressed.
Foods 2020, 9(10), 1374; https://doi.org/10.3390/foods9101374
Submission received: 28 July 2020 / Revised: 1 September 2020 / Accepted: 3 September 2020 / Published: 27 September 2020

Abstract

:
A deep-fried dough/batter food (magwinya) consumed across different age groups and social strata in South Africa was investigated in this study for digestibility and estimated glycaemic index (eGI). In this research, we investigated the influence of bran type—wheat bran (WB) and oat bran (OB), and concentration (0–20% w/w) on the starch digestibility and eGI of magwinya. Rapidly available glucose (RAG) of control fried dough (60.31 g/100 g) was 33% less than fried batter (90.07 g/100 g). There was a significant reduction in RAG and an increase in slowly available (SAG) and unavailable glucose (UG) content of the fried products with OB and WB addition. The highest SAG content was observed in WB fried dough. Control fried batter had the highest eGI value (80.02) and control fried dough had medium eGI value (58.11). WB fried dough, fried batter, and OB fried dough were categorised as medium GI foods at eGI range of 56.46–58.39, 65.93–68.84 and 56.34–57.27, respectively. The eGI values of OB fried batter ranged from 73.57 to 80.03 and were thus classified as high GI foods. UG showed significant correlation with eGI (r = −0.892, −0.973, p < 0.01) and fat content (r = −0.590, −0.661, p < 0.01) for WB and OB fried products. These results reveal that ingredient modification through bran enrichment is effective for the regulation of starch digestion and reduction of eGI of deep-fried dough/batter foods.

Graphical Abstract

1. Introduction

Starch is the major carbohydrate found in food commodities such as maize, wheat, potato and rice [1]. It is a good source of energy for humans, however, its excessive consumption is of health concern, as it is a predisposing factor to other metabolic-related diseases like obesity, and diabetes—A projected leading cause of death by the year 2030 according to the World Health Organisation [2,3]. Moreover, the ability to predict and regulate postprandial glucose absorption of starchy food is vital to the global epidemic called diabesity [4,5]. Starch digestion (SD) is characterised by the rate and the duration of postprandial glycaemic response. Starch can be undigested, rapidly or slowly digested. Starch granule characteristics, state, size, processing methods and presence of other ingredients all influence SD [6].
Understanding the relationship between the physicochemical and physiological properties of food is a vital way to explain the value of carbohydrate in human nutrition. The glycaemic glucose fraction of food, excluding lactose, is a summation of glucose in its glycaemic carbohydrate fraction [7]. The glucose content of a carbohydrate-rich food is categorised as either rapidly (RAG) or slowly available (SAG) to signify its potential rate of release and absorption or non-absorption for unavailable glucose (UG) [6]. The rate of postprandial glucose release can be described by its in vitro RAG and SAG values which are the main determinants of the glycaemic index of cereal-based foods [6,7]. Glycaemic index (GI) classifies carbohydrate foods based on how they influence postprandial plasma glucose response [8]. GI is expressed as the percentage increase in the glucose area under the curve of a test food against a standard food such as glucose or white bread [7,9]. GI is usually measured in vivo, however, because of the time and resources required, in vitro methods have been adopted over the years as a relevant nutromic analysis tool to measure the rate of hydrolysis and assess the glycaemic index of foods [9,10].
Factors that affect starch digestibility include starch characteristics, enzyme inhibitors, amylose/amylopectin ratio, particle size of starch granule, processing method, starch gelatinisation, retrogradation and presence of other ingredients such as lipids, proteins and fibre [4,6,11,12]. Previous studies present persuasive evidence that certain dietary fibres noticeably reduced GI of foods, although the magnitude of GI reduction is dependent on the food type and processing involved [13,14]. Wheat (WB) and oat bran (OB) are cheap, easily accessible, fibre-rich food additives which, when incorporated into starchy foods, may reduce their GI. The in vitro hypoglycaemic effects of WB and OB include an increase in slowly digestible starch (SDS) and resistant starch (RS) contents of foods [15,16,17,18]. The resistance of dietary fibres to amylolytic enzymes in the small intestine results in their transformation to short-chain fatty acids in the colon. These processes result in physiological benefits such as blood glucose regulation, laxative and prebiotic properties [14,19].
Magwinya is a deep-fried product made from wheat flour, sugar, salt and water. It can be categorised as fried dough or batter based on the preferences of the consumers [20]. It is popularly consumed by people of various age groups in sub-Saharan Africa [20] and can be categorised as a high-carbohydrate and food because of its major ingredient–refined wheat flour. Owing to its prevalent consumption as the main meal amongst low-income population [20], it is essential to improve its nutritional quality. To the best of our knowledge, in vitro starch digestion and GI of magwinya has not been reported. Therefore, the objectives of this paper are: (i) to quantify available glucose and digestible starch fractions of magwinya via in vitro assay; (ii) to assess the effect of bran concentration and initial moisture content on available glucose and digestible starch content of magwinya; and (iii) to calculate the estimated glycaemic index of magwinya.

2. Materials and Methods

2.1. Materials

Wheat flour (carbohydrates—71%, protein—10%, moisture—12%, fibre—4%, fat—1%) wheat bran (carbohydrates—22%, protein—16%, moisture—11%, fibre—43%, fat—5%), oat bran (carbohydrate—50%, protein—13%, moisture—7% fibre—20%, fat—5%,), sucrose (Selati, RCL Foods), salt, instant yeast (Anchor Yeast), sunflower oil (Spar) sourced locally in South Africa were used for the production of fried products. Wheat and oat bran were milled to 200 µm particle size using an ultra-centrifugal mill (Retsch ZM 200, Haan Germany) and were stored at –20 °C until used for magwinya production. Guar gum (G4129), amyloglucosidase (A7095–260 U/mL), pepsin (P7000–250 U/mL), invertase (I4504–300 U/mg) and pancreatin (P7545–8 x USP specification), sulfuric acid (25810-5), glucose oxidase peroxidase kit (GAGO 20) for in-vitro digestion assays were sourced from Sigma–Aldrich, (St Louis, MO, USA). Potassium hydroxide, acetic acid, hydrochloric acid and other chemicals used were of analytical grade.

2.2. Production of Fried Products (Magwinya)

Fried products were processed using the method of Onipe et al. [21]. Wheat flour was partially substituted with 1, 5, 8, 10, 15 and 20% (w/w), respectively, of wheat and oat bran. All dry ingredients were weighed as follows: composite flour (100 g), sugar (15 g), salt (1 g), yeast (1 g), into a mixing bowl at ambient temperature (24 °C). Lukewarm water (65 mL and 100 mL) was added gradually until all ingredients were homogenously mixed to form a dough and batter, respectively. The dough was kneaded for 10 min in a mixer (Russell Hobbs RHSB237, Failsworth, UK) and cut into a 50-g mass and formed into a ball. The dough and batter were proofed at 30 °C in a T7 bread proofer (with temperature control limit of 46 °C and 95% humidity) and fried at 180 °C for 5 min in a deep fryer (Russell Hobbs RDF300, Failsworth, UK) with built-in automatic temperature and time control system. Oil was pre-heated for 1 h before frying.

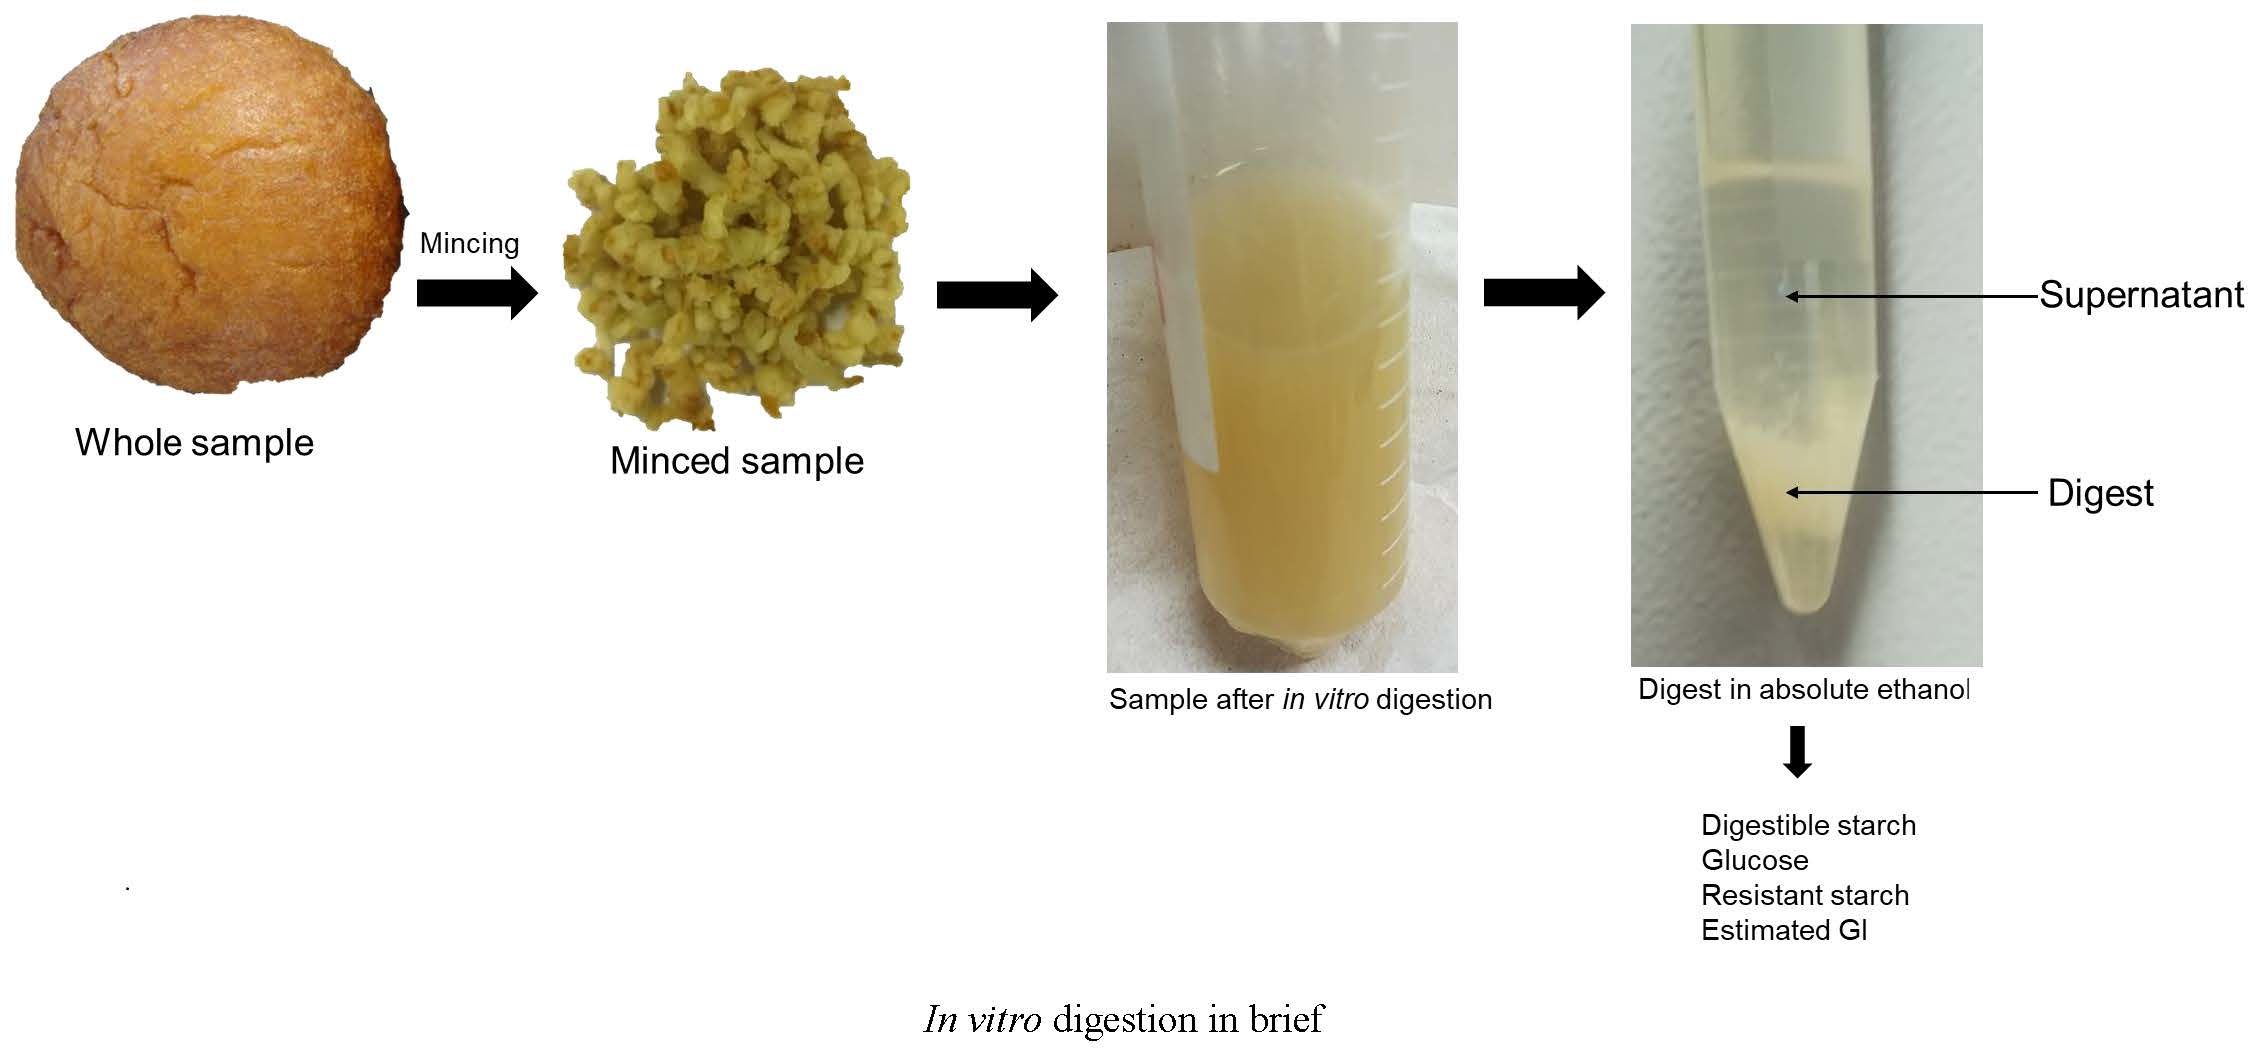
2.3. Sample Preparation for Starch Digestion

Various sample crushing methods have been reported such as milling/grinding, mincing and chewing. Mincing was selected because it gave consistent results close to chewing in cereal foods [22]. To keep analysis as close as possible to real human experience, samples were analysed fresh as opposed to some analysis where samples were dried before digestion. For each sample, one whole freshly fried magwinya was minced (Figure 1) using an electronic meat grinder (Brabantia BBEK1092V, Brabant, Netherlands) equipped with a 0.9-cm diameter hole [23].

2.4. Starch Digestibility Protocol

In vitro starch digestibility of magwinya was determined using the method described by Englyst et al. [23,24] and Cortado et al. [1] with modifications in the following three steps:
Step 1: Incubation of fried products with pepsin for proteolysis
Approximately 1.5 g of minced sample was transferred to 50 mL centrifuge tubes. Then, 5 mL of 50% saturated benzoic acid solution and 10 mL of pepsin guar-gum solution (5 g each per litre of 0.05 M HCl) was added. Guar gum was added to standardise the viscosity of the solution. To initiate proteolysis, each tube was covered, vortex-mixed, and transferred to a water bath for 30 min at 37 °C. To each tube, 5 mL sodium acetate buffer solution (0.5 M) at pH 5.2 and 15 glass beads of 5 mm diameter were added, shaken gently and equilibrated for 3 min in the water bath.
Step 2: Starch hydrolysis of fried products
Fresh enzyme cocktail was made from amyloglucosidase (260 U/mL), invertase (300 U/mg) and pancreatin (8 × USP) at 4:6:18 ratio per 100 mL enzyme mixture. Five millilitres of enzyme cocktail was added to each tube and agitated at 137 rpm in a shaking water bath set at 37 °C. Each tube was timed and removed from the water bath at exactly 20 and 120 min after the addition of the enzyme cocktail. Approximately 0.2 mL of the digest was pipetted into 4 mL absolute ethanol and vortex-mixed to end enzymatic hydrolysis. These were G20 and G120 fractions (glucose concentration at 20 min and 120 min).
Step 3: Digestion for hydrolysis of starch to glucose
The tubes were covered, mixed vigorously on a vortex mixer, and cooled for 5 min in an ice water bath. Subsequently, 7 M KOH solution (10 mL) was added and mixed. The tubes were agitated horizontally for 30 min in an ice water bath. A 0.2-mL portion of the content was pipetted into 1 mL acetic acid 1 M solution after which 40 µl of amyloglucosidase solution was added. The tubes were vortex mixed and transferred to a water bath for 30 min at 70 °C. The tubes were cooled for 15 min in an ice bath and subsequently allowed to reach ambient temperature before adding 12 mL of absolute ethanol. This tube corresponded to the TG (total glucose) portion. Glucose oxidase and peroxidase assay kit were used to estimate glucose concentration of G20, G120, and TG portions using glucose oxidase and peroxidase assay kit GAGO-20 (Sigma–Aldrich, St Louis, MO). The RAG, SAG and UG fractions were estimated using equations 1–3 as described by Contardo et al. [1].
Rapidly   available   glucose   ( g / 100   g )   =   G 20 / TG ×   100
  Slowly   available   glucose   ( g / 100   g )   =   ( G 120     G 20 ) / TG   ×   100  
  Unavailable   glucose   ( g / 100   g )   =   ( TG     G 120 ) / TG   ×   100  

2.5. Glycaemic Index Estimation of Fried Products

The kinetics of starch hydrolysis was described by the non-linear first-order Equation (4) established by Goñi et al. [25]. The estimated glycaemic index of magwinya was calculated from Equation (5).
C   =   C   ( 1   e kt )
Estimated   glycaemic   index   =   39 . 71   +   0 . 548   ×   Hydrolysis   index
The hydrolysis index (HI) was obtained from a division of area under the hydrolysis curve (AUC) of magwinya sample and AUC of the reference sample (white bread) as presented in the Equations (6) and (7) [25,26].
Hydrolysis   index   =   Area   Under   Curve magwinya Area   Under   Curve white   bread    
Area   under   curve   =   C ( t f   t 0 ) ( C / k )   [ 1   e k   ( t f   t 0 ) ]
where C is the equilibrium concentration at the final time (120 min) and k is the kinetic constant. tf is final time t0 is the initial time, C is the starch hydrolysed at a chosen time t.

2.6. Statistical Analysis

Results were presented as the mean of triplicate determinations. Analysis of variance was carried out to determine the effect of bran concentration on glucose fractions. Means were separated using Duncan’s multiple range test where the effect of the independent variable was significant at P < 0.05. Multivariate linear regression was carried out to determine the test of between-subject effect, that is, linear and interaction effect of bran addition, initial moisture content and bran type on dependent variables. The association between independent and dependent variables was tested using Pearson’s correlation. All statistical tests were performed using SPSS software (SPSS statistics version 26, IBM Co., Armonk, NY, USA).

3. Results and Discussion

3.1. Rapidly and Slowly Available Glucose Content of Fried Products

The glucose fractions of magwinya have their source linked to starch and sugar components of magwinya. The RAG and content of starchy food are significant determinants of its glycaemic response [27]. The magnitude of the in vivo GI of most carbohydrate-rich foods is almost certainly determined by the RAG content [23,26]. This is backed up in literature with a strong correlation of GI and RAG content for several starchy foods [27]. RAG values of WB of fried dough ranged from 47.11 to 60.31 g/100 g while that fried batter ranged from 72.33 to 90.07 g/100 g (Table 1) and decreased with an increase in WB content for fried dough and batter. These values were close to the RAG values of the deep-fried dough matrix reported by Contardo et al. [1]. RAG content was highest in control samples followed by a significant decrease was noted up to 10% WB substitution, followed by an increase thereafter in WB fried dough and batter. As initial moisture content increased, RAG values also increased (r = 0.931, p < 0.01) implying that the consumption of WB fried batter will likely cause the rapid release of glucose in the bloodstream. The SAG content of WB fried dough ranged from 2.62 to 12.56 g/100 g and 6.88 to 18.76 g/100 g in fried batter (Table 1). SAG was lower in WB fried dough compared to the fried batter. The SAG content in both sets of samples was below 20 g/100 g and increased significantly with increments of WB up to 10%.
The RAG of OB fried dough ranged from 41.47 to 60.31 g/100 g while that of fried batter ranged from 71.84 to 90.07 g/100 g (Table 1). A significant reduction was observed up to 10% OB in fried batter. In OB fried dough, there was a significant reduction of RAG values with an increase in bran concentration. Initial moisture content and bran concentration were positively correlated to RAG content of OB (0.942) and WB magwinya (0.931) at p < 0.01. Higher RAG values in fried batter may be indicative of a higher degree of gelatinisation of fried batter compared to fried dough. Gelatinised starch is easily hydrolysed because of the loss of amylopectin crystallinity which makes the granules porous and accessible to digestive enzymes [1,13]. Control samples had the highest RAG values (fried batter—90.07 g/100 g, fried dough—60.31 g/100 g); which implies that the inclusion of OB reduced RAG values in both fried products. Human/animal subjects were not used for the study. However, this result implies that the incorporation of OB in magwinya formulation may delay the release of glucose in the bloodstream within 20 min of digestion. The SAG content of OB fried dough ranged from 2.62 to 10.18 g/100 g and 6.88 to 14.07 g/100 g in fried batter (Table 1). A significant increase in SAG content was noted at 5% OB in the fried dough and 1% OB in fried batter, respectively. Pearson’s correlation showed that the increase in initial moisture content increased SAG of WB (r = 0.596) and OB magwinya (r = 0.557) at p < 0.01.

3.2. Unavailable Glucose Content of Fried Products

The UG fraction corresponds to the amount of glucose not released within 120 min of starch digestion and it is mainly from resistant starch content of the food [1]. The UG values of WB fried dough and batter ranged from 35.27 to 45.44 g/100g and 3.05 to 9.57 g/100 g, respectively. These results showed that UG values were higher in the fried dough than in fried batter. In WB fried dough, a significant increase in UG was observed from 8% WB while that of fried batter showed an increase from 1% WB. The UG values of OB fried dough and batter ranged from 37.07 to 54.74 g/100 g and 3.05 to 16.68 g/100 g, respectively. The UG values in OB magwinya are higher than those for WB magwinya. This may be associated with the difference in fibre solubility of WB and OB. The rate of UG increase is like those observed in WB fried dough and batter. An increase in UG in fried batter may be attributed to the interaction of WB fibres with water at a molecular level [28]; thus, reducing the water available for starch gelatinisation, and as such, digestive enzymes could not hydrolyse the starch at final digestion time. The mean UG values reported in this study were close to those of Contardo et al. [1] where UG of dough matrix fried under atmospheric conditions was 46 g/100 g. A negative correlation was established for initial moisture content and UG of WB magwinya (r = −0.985) and OB magwinya (r = −0.935) at p < 0.01. The UG values of OB fried batter increased significantly (p < 0.05) at higher substitution levels of OB.
High UG values in fried dough samples may also be accounted for by incomplete gelatinisation as a result of competition for water by fibre, salt, and sugar molecules causing less water for starch granules to attain full gelatinisation upon heating [1,6]. Multivariate linear regression revealed that linear and interaction effect of the independent variables (bran type, initial moisture content and bran concentration) all showed significance (p < 0.05) on RAG, SAG and UG contents of magwinya except for interaction effect of bran type and initial moisture content which showed no significance (p > 0.05) on SAG

3.3. Estimated Glycaemic Index of Fried Products

3.3.1. Estimated Glycaemic Index of Fried Dough

The eGI values of WB fried dough were in the range of 56.46–58.39 and were significantly lower than control (58.11) except WB1 (Table 2). The eGI of OB fried dough ranged from 56.34 to 57.27 and was significantly lower than control (58.11), but no statistical difference was observed among the samples. This implies that magwinya with low initial moisture content (fried dough) are medium GI food. This reduction in eGI of fried dough samples may be attributed to the combined effect of dietary fibre and limited water in the food matrix, which would have caused incomplete starch gelatinisation, and of a consequence resistance to amylolytic enzymes in the digestion time frame [3]. In a food matrix such as magwinya, which has other components such as sugar (sucrose), salt, protein (gluten) and fibre, coupled with low initial water in the dough, these components compete with the starch granules for water. For complete gelatinisation to occur, heat and water are two crucial factors viz: water must enter the crystalline region (amylopectin) where swelling occurs (upon heating) and the cell ruptures, causing the amylose to leach out. It is easier for digestive enzymes to hydrolyse the exposed amylopectin and amylose into glucose monomers for absorption in the body. When there is incomplete gelatinisation, the foregoing does not occur, and this reduces the GI of the food [29].

3.3.2. Estimated Glycaemic Index of Fried Batter

Fried batter exhibited high eGI values viz: 65.93–80.62 in WB samples and 73.75–80.62 in OB samples (Table 2). The linear effect of initial moisture content and its interaction effect with other independent variables showed significance (p < 0.05) on eGI of OB and WB magwinya. There was a significant reduction in eGI of magwinya with increments to OB and WB concentrations in magwinya formulation. In the control sample, eGI of 80.62 revealed fried batter to be a high GI food, while that of fried dough at 58.11 can be classified as intermediate GI food.
Carbohydrate-rich foods can either be labelled low GI (<55), medium (55–70) and/or high GI (> 80) [30]. The eGI of OB fried batter samples were all above 70 indicating that fried batter samples, despite OB addition are high GI foods. WB fried batter samples, on the other hand, were in the 65–68 range and were significantly (p < 0.05) lower than their OB counterpart. In the glycaemic index table collated by Foster-Powell et al. [31], GI of doughnut from an in vivo study was reported as 76 and 108 when glucose and white bread were used as the reference food, respectively. Fried dough samples exhibited lower GI than fried batter samples.
The GI-lowering effect of bran types used in this study can be linked to their dietary fibre content which is composed mostly of non-starch polysaccharides such as β glucans (soluble fibre) in OB and arabinoxylan in WB [19,32]. The soluble fibre of OB acts through alteration of the food microstructure via restriction of starch gelatinisation because of its high-water absorption capacity which in turn limits water available to starch granules in the food matrix [3,15]. Wheat bran is composed of up to 58% insoluble dietary fibre which increases faecal bulk, reduces transit time in the small intestine and is resistant to enzymatic hydrolysis due to its heterogeneous structure [19]. This resistance to digestive enzymes may have contributed to lowering the eGI of our fried products. The eGI of WB samples was lower than OB samples for both fried batter and dough; thus, deducing that WB is a better choice at lowering the GI of magwinya made from either dough/or batter. Despite the similarity between both types of products, their eGI shows high disparity which was affected by the difference in ingredient (bran type used) and initial moisture content of the products which resulted in different degrees of starch gelatinisation and rates of carbohydrate digestion and their respective eGI values.

3.4. Relationship Between Estimated Glycaemic Index, and Other Variables in the Study

The relationship between GI, glucose, and total oil content of magwinya was estimated using Pearson’s correlation to observe and report linear trends amongst these properties. The fat content of the fried products in this study was reported in a recent publication [21].

3.4.1. Wheat Bran Fried Products

The relationship between glucose (RAG, SAG, UG), fat content and eGI of WB and OB magwinya is presented in Table 3. There was a positive correlation between eGI and RAG (r = 0.916, p < 0.01) and SAG (r = 0.338, p < 0.01) of WB magwinya, implying that increase in SAG and RAG may have led to an increase in eGI. The RAG of foods has been established as a potential predictor of in vitro glycaemic response of starchy foods [27]. Initial moisture content (r = 0.931, p < 0.01) correlated positively to RAG (r = 0.931, p < 0.01) and SAG (r = 0.596, p < 0.05). This supports the effect of high water in fried batter samples that caused complete gelatinisation for fried batter. For complete gelatinisation during heat treatment, water is essential to hydrate starch molecules and cause a disruption of the crystalline structure of amylopectin. When there is not enough water, gelatinisation becomes incomplete which affects starch digestion [33]. The WB concentration correlated negatively to RAG (r = −0.310, p < 0.05) and positively to SAG (r = 0.488, p < 0.01). Fat content correlated positively to RAG and SAG of WB magwinya and negatively to UG (r = −0.590, p < 0.01). Individually in fried dough, a negative correlation was established between FC and UG (r = −0.749, p < 0.01), while no significant correlation existed in WB fried batter. A positive correlation between fat and eGI (r = 0.495, p < 0.01) showed that an increase in fat content may increase eGI. This may be accounted for by fried batter samples which had higher eGI values. A possible explanation could be the enzyme used which catalysed fried batter samples thus increasing the eGI content. The fat content of fried products was inversely related to UG and directly proportional to eGI–indicative of amylose–lipid complex formation in the fried dough and starch gelatinisation in fried batter products [34].

3.4.2. Oat bran Fried Products

Correlation among independent variables, available glucose (RAG, SAG, UG), and eGI of OB magwinya is presented in Table 3. Like WB products, RAG and SAG contributed strongly to eGI of OB magwinya as indicated by positive correlations (r = 0.962, 0.518, P < 0.01). Initial moisture content positively correlated to RAG, SAG and eGI of OB magwinya as shown (Table 3), and negatively correlated to UG (r = −0.963, p < 0.01). In a low-moisture system like fried dough in this study, an increase in UG may be as a result of incomplete starch gelatinisation. Abundant water and heat are two important factors that aid starch gelatinisation and in turn the extent of starch digestion during hydrolysis. Exposure of starch molecules to heat in excess water leads to disruption of the crystalline structure thereby linking the hydroxyl group of starch and water molecules via hydrogen bonding [12]. This, in turn, solubilises the starch granule, leading to increased swelling and subsequent leaching of amylose which is easily accessible to amylolytic enzymes during digestion [6]. Correlation of fat content to glucose and starch contents revealed similar results as WB magwinya. There is a dearth of research on starch digestion of deep-fried dough/batter foods, hence the comparison of the results in this study with other deep-fried starchy foods. Fat content negatively correlated to UG (r = −0.661, p < 0.01). Opposing results on the effect of deep-frying on RS content of potato products have been reported. Deep-frying significantly increased RS because deep-frying increases fat available for amylose–lipid complex formation in the food [34,35]. Starch–lipid complexes in food matrices are characterised by reduction of starch solubility, swelling power, gelatinisation and retrogradation which in turn delays enzymic digestion [11]. Conversely, Yadav [36] observed that deep-frying had a prominent effect on RS reduction. In this study, however, the percentage of fat content was compared to the starch contents and an inverse relationship existed between RS and fat content for OB and WB fried products. The negative correlation can be linked to starch gelatinisation which was more pronounced in batter samples (having higher fat content) because of higher initial water content. The inclusion of bran in magwinya formulation also contributed to fat reduction and consequential increase in RS [21].

4. Conclusions

Incorporation of WB and OB in magwinya fried products caused a reduction in RAG values as well as an increase in SAG and UG values. This points to a delay in glucose release due to the presence of bran fibres during enzymatic hydrolysis. OB and WB had a similar effect on the reduction of RAG of fried dough while WB had improved an effect in fried batter products. There was a reduction of eGI of all samples with addition of WB and OB. This reduction effect on the eGI of magwinya can be attributed to the dietary fibre constituents of OB and WB. Overall, this study shows how bran enrichment can be used to control the glucose contents and reduce eGI of magwinya, thereby improving its nutritional properties. The outcomes of this study can serve as baseline information for magwinya (or fried food) processors, nutritionists, and consumers. In vitro studies only cater to an estimation of starch digestion and glycaemic index. To obtain magwinya GI, in vivo study using human or animal subjects is recommended. Extraction and purification of bran dietary fibres and evaluation of their constituents on their molecular mechanism in starch digestion are also suggested for future studies. The results of this study indicated that WB and OB are suitable additives for the reduction of RAG and eGI of magwinya.

Author Contributions

Research conceptualisation and funding were achieved by O.O.O. and A.I.O.J., O.O.O. performed the experiments, conducted data analysis, designed and wrote the manuscript. D.B. and A.I.O.J. reviewed and edited the manuscript. All authors have read and agreed to the published version of the manuscript.

Funding

This research was funded by the Technology Innovation Agency, South Africa (SARDF/16/FST/03) the Directorate of Research and Innovation, Univen (SARDF/17/FST/03), and DST-NRF Centre of Excellence in Food Security SMART Foods Project (Project ID: 160201).

Conflicts of Interest

The authors declare no conflict of interest.

References

  1. Contardo, I.; Parada, J.; Leiva, A.; Bouchon, P. The effect of vacuum frying on starch gelatinization and its in vitro digestibility in starch–gluten matrices. Food Chem. 2016, 197, 353–358. [Google Scholar] [CrossRef] [PubMed]
  2. Gourineni, V.; Stewart, M.L.; Skorge, R.; Sekula, B.C. Slowly Digestible Carbohydrate for Balanced Energy: In Vitro and In Vivo Evidence. Nutrients 2017, 9, 1230. [Google Scholar] [CrossRef] [PubMed] [Green Version]
  3. Torres, J.D.; Dueik, V.; Carré, D.; Bouchon, P. Effect of the addition of soluble dietary fibre and green tea polyphenols on acrylamide formation and in vitro starch digestibility in baked starchy matrices. Molecules 2019, 24, 3674. [Google Scholar] [CrossRef] [PubMed] [Green Version]
  4. Parada, J.; Santos, J.L. Interactions between Starch, Lipids, and Proteins in Foods: Microstructure Control for Glycemic Response Modulation. Crit. Rev. Food Sci. Nutr. 2015, 56, 2362–2369. [Google Scholar] [CrossRef]
  5. Kumar, N.; Puri, N.; Marotta, F.; Dhewa, T.; Calabrò, S.; Puniya, A.K.; Carter, J. Diabesity: An epidemic with its causes, prevention and control with special focus on dietary regime. Funct. Foods Health Dis. 2017, 7, 1–16. [Google Scholar] [CrossRef] [Green Version]
  6. Singh, J.; Dartois, A.; Kaur, L. Starch digestibility in food matrix: A review. Trends Food Sci. Technol. 2010, 21, 168–180. [Google Scholar] [CrossRef]
  7. Englyst, K.; Vinoy, S.; Englyst, H.N.; Lang, V. Glycaemic index of cereal products explained by their content of rapidly and slowly available glucose. Br. J. Nutr. 2003, 89, 329–339. [Google Scholar] [CrossRef]
  8. Borczak, B.; Sikora, M.; Sikora, E.; Dobosz, A.; Kapusta-Duch, J. Glycaemic index of wheat bread. Starch Stärke 2017, 70, 1700022. [Google Scholar] [CrossRef]
  9. Wolever, T.; Vorster, H.H.; Björck, I.; Brand-Miller, J.; Brighenti, F.; Mann, J.I.; Ramdath, D.D.; Granfeldt, Y.; Holt, S.; Perry, T.L.; et al. Determination of the glycaemic index of foods: Interlaboratory study. Eur. J. Clin. Nutr. 2003, 57, 475–482. [Google Scholar] [CrossRef] [Green Version]
  10. Odenigbo, A.; Rahimi, J.; Ngadi, M.; Amer, S.; Mustafa, A. Starch digestibility and predicted glycemic index of fried sweet potato cultivars. Funct. Foods Health Dis. 2012, 2, 280. [Google Scholar] [CrossRef]
  11. Wang, S.; Chao, C.; Cai, J.; Niu, B.; Copeland, L.; Wang, S. Starch–lipid and starch–lipid–protein complexes: A comprehensive review. Compr. Rev. Food Sci. Food Saf. 2020, 19, 1056–1079. [Google Scholar] [CrossRef] [Green Version]
  12. Magallanes-Cruz, P.A.; Flores-Silva, P.C.; Bello-Pérez, L.A. Starch Structure Influences Its Digestibility: A Review. J. Food Sci. 2017, 82, 2016–2023. [Google Scholar] [CrossRef] [Green Version]
  13. Brennan, C.S. Dietary fibre, glycaemic response, and diabetes. Mol. Nutr. Food Res. 2005, 49, 560–570. [Google Scholar] [CrossRef] [PubMed]
  14. Taye, A.; Engidawork, E.; Urga, K. An in vitro estimation of glycemic index of white bread and improvement of the dietary fibre. Adv. Food Technol. Nutr. Sci. 2016, 2, 83–87. [Google Scholar]
  15. Sozer, N.; Cicerelli, L.; Heiniö, R.-L.; Poutanen, K. Effect of wheat bran addition on in vitro starch digestibility, physico-mechanical and sensory properties of biscuits. J. Cereal Sci. 2014, 60, 105–113. [Google Scholar] [CrossRef]
  16. Aravind, N.; Sissons, M.; Egan, N.; Fellows, C.M. Effect of insoluble dietary fibre addition on technological, sensory, and structural properties of durum wheat spaghetti. Food Chem. 2012, 130, 299–309. [Google Scholar] [CrossRef]
  17. Ahmed, F.; Sairam, S.; Urooj, A. In vitro hypoglycemic effects of selected dietary fibre sources. J. Food Sci. Technol. 2011, 48, 285–289. [Google Scholar] [CrossRef] [Green Version]
  18. Reyes-Pérez, F.; Salazar-García, M.G.; Romero-Baranzini, A.L.; Islas-Rubio, A.R.; Ramírez-Wong, B. Estimated glycemic index and dietary fibre content of cookies elaborated with extruded wheat bran. Plant Food Hum. Nutr. 2013, 68, 52–56. [Google Scholar] [CrossRef]
  19. Onipe, O.O.; Jideani, A.I.O.; Beswa, D. Composition and functionality of wheat bran and its application in some cereal food products. Int. J. Food Sci. Technol. 2015, 50, 2509–2518. [Google Scholar] [CrossRef]
  20. Onipe, O.O.; Beswa, D.; Jideani, A.I.O. The socioeconomic benefits, production and consumption statistics of magwinya in Limpopo province, South Africa. Afr. J. Food Agric. Nutr. Dev. 2019, 19, 15007–15028. [Google Scholar] [CrossRef]
  21. Onipe, O.O.; Beswa, D.; Jideani, A.I.O. Confocal laser scanning microscopy and image analysis for elucidating crumb and crust microstructure of bran-enriched South African fried dough and batter. Foods 2020, 9, 605. [Google Scholar] [CrossRef] [PubMed]
  22. Germaine, K.A.; Samman, S.; Fryirs, C.G.; Griffiths, P.J.; Johnson, S.K.; Quail, K.J. Comparison of in vitro starch digestibility methods for predicting the glycaemic index of grain foods. J. Sci. Food Agric. 2008, 88, 652–658. [Google Scholar] [CrossRef]
  23. Englyst, K.N.; Englyst, H.N.; Hudson, G.J.; Cole, T.J.; Cummings, J.H. Rapidly available glucose in foods: An in vitro measurement that reflects the glycemic response. Am. J. Clin. Nutr. 1999, 69, 448–454. [Google Scholar] [CrossRef] [PubMed]
  24. Englyst, K.; Goux, A.; Meynier, A.; Quigley, M.; Englyst, H.; Brack, O.; Vinoy, S. Inter-laboratory validation of the starch digestibility method for determination of rapidly digestible and slowly digestible starch. Food Chem. 2018, 245, 1183–1189. [Google Scholar] [CrossRef] [PubMed]
  25. Goñi, I.; Garcia-Alonso, A.; Saura-Calixto, F. A starch hydrolysis procedure to estimate glycemic index. Nutr. Res. 1997, 17, 427–437. [Google Scholar] [CrossRef]
  26. Annor, G.A.; Marcone, M.; Corredig, M.; Bertoft, E.; Seetharaman, K. Effects of the amount and type of fatty acids present in millets on their in vitro starch digestibility and expected glycemic index (eGI). J. Cereal Sci. 2015, 64, 76–81. [Google Scholar] [CrossRef]
  27. Englyst, H.N.; Veenstra, J.; Hudson, G.J. Measurement of rapidly available glucose (RAG) in plant foods: A potential in vitro predictor of the glycaemic response. Br. J. Nutr. 1996, 75, 327–337. [Google Scholar] [CrossRef] [PubMed] [Green Version]
  28. Noort, M.W.; van Haaster, D.; Hemery, Y.; Schols, H.A.; Hamer, R.J. The effect of particle size of wheat bran fractions on bread quality—Evidence for fibre–protein interactions. J. Cereal Sci. 2010, 52, 59–64. [Google Scholar] [CrossRef]
  29. Parada, J.; Aguilera, J. Review: Starch Matrices and the Glycemic Response. Food Sci. Technol. Int. 2011, 17, 187–204. [Google Scholar] [CrossRef]
  30. Lanzerstorfer, P.; Rechenmacher, E.; Lugmayr, O.; Stadlbauer, V.; Höglinger, O.; Vollmar, A. Effects of various commercial whole-grain breads on postprandial blood glucose response and glycemic index in healthy subjects. Austin J. Clin. Med. 2018, 5, 1031–1037. [Google Scholar]
  31. Foster-Powell, K.; A Holt, S.H.; Brand-Miller, J. International table of glycemic index and glycemic load values: 2002. Am. J. Clin. Nutr. 2002, 76, 5–56. [Google Scholar] [CrossRef] [PubMed] [Green Version]
  32. Kumar, S.B.; Prabhasankar, P. Shelf stability of low glycemic index noodles: Its physicochemical evaluation. J. Food Sci. Technol. 2018, 55, 4811–4822. [Google Scholar] [CrossRef] [PubMed]
  33. Dona, A.C.; Pages, G.; Gilbert, R.G.; Kuchel, P. Digestion of starch: In vivo and in vitro kinetic models used to characterise oligosaccharide or glucose release. Carbohydr. Polym. 2010, 80, 599–617. [Google Scholar] [CrossRef]
  34. Ghidurus, M.; Turtoi, M.; Boskou, G.; Niculita, P.; Stan, V. Nutritional and health aspects related to frying (I). Rom. Biotechnol. Lett. 2010, 15, 5675–5682. [Google Scholar]
  35. Mangala, S.; Udayasankar, K.; Tharanathan, R. Resistant starch from processed cereals: The influence of amylopectin and non-carbohydrate constituents in its formation. Food Chem. 1999, 64, 391–396. [Google Scholar] [CrossRef]
  36. Yadav, B.S. Effect of frying, baking and storage conditions on resistant starch content of foods. Br. Food J. 2011, 113, 710–719. [Google Scholar] [CrossRef]
Figure 1. Whole (A) and minced (B) fried batter.
Foods 09 01374 g001
Table 1. Glucose content (g/100 g) of fried products enriched with wheat and oat bran.
Bran Concentration (g)Fried DoughFried Batter
RAGSAGUGRAGSAGUG
Control60.31 e ± 1.512.62 a ± 0.0337.07 ab ± 0.2490.07 e ± 1.806.88 a ± 0.783.05 a ± 0.61
WB156.81 d ± 0.124.69 b ± 0.2038.50 b ± 1.0883.17 d ± 1.139.45 b ± 0.437.39 c ± 0.30
WB553.67 c ± 1.3111.06 de ± 0.4235.27 a ± 0.1180.14 c ± 0.2510.93 b ± 0.628.93 d ± 0.36
WB848.10 a ± 0.2010.45 d ± 0.0541.46 c ± 0.1576.09 b ± 0.0518.76 d ± 0.055.15 b ± 0.01
WB1049.18 ab ± 0.8512.56 e ± 0.1238.26 b ± 0.2773.38 a ± 0.5817.99 d ± 0.768.63 d ± 0.18
WB1551.12 b ± 0.335.67 bc ± 0.1743.21 c ± 1.6378.58 c ± 0.1814.77 c ± 0.686.65 c ± 0.51
WB2047.11 a ± 0.257.45 c ± 0.5045.44 d ± 1.2572.33 a ± 1.7818.11 d ± 0.859.57 d ± 0.07
Control60.31 c ± 1.512.62 a ± 0.0337.07 a ± 0.2490.07 d ± 1.806.88 ab ± 0.783.05 a ± 0.61
OB145.70 b ± 1.772.48 a ± 0.4851.82 c ± 1.3082.25 c ± 0.2814.07 c ± 0.783.68 a ± 0.59
OB544.27 b ± 0.114.35 ab ± 0.2151.38 c ± 0.1176.46 ab ± 0.729.72 c ± 0.5913.82 c ± 0.13
OB843.71 ab ± 1.038.45 c ± 0.9847.84 b ± 0.2175.41 ab ± 0.9113.49 c ± 0.7611.10 b ± 0.15
OB1041.47 a ± 0.253.79 a ± 0.1054.74 d ± 1.1571.84 a ± 0.7511.30 bc ± 0.7116.86 d ± 0.96
OB1543.25 ab ± 0.4010.18 c ± 0.4146.57 b ± 0.2179.82 bc ± 0.574.62 a ± 0.5715.57 cd ± 0.14
OB2043.58 ab ± 0.225.00 b ± 0.8551.43 c ± 0.3780.31 bc ± 0.878.98 abc ± 0.1710.71 b ± 0.70
Values are presented as mean ± standard deviation (n = 3). Superscripts with different alphabets in the same column show significance (p < 0.05) using Duncan’s multiple range test. RAG—rapidly available glucose, SAG—slowly available glucose, UG—unavailable glucose. OB—oat bran, WB—wheat bran. Control denotes fried dough/batter with 0 g bran, while 1–20 represents concentration (g) of bran in product formulation.
Table 2. The estimated glycaemic index of magwinya samples.
Magwinya samplesWheat bran magwinya
Fried doughFried batter
Control58.11 f ± 0.5580.62 f ± 0.07
Wheat bran 158.39 ef ± 0.1365.93 a ± 0.19
Wheat bran 557.97 cde ± 0.2166.95 b ± 0.18
Wheat bran 856.46 a ± 0.0568.21 e ± 0.53
Wheat bran 1057.43 bc ± 0.1167.59 cd ± 0.07
Wheat bran 1557.11 b ± 0.6567.22 bc ± 0.04
Wheat bran 2057.62 bcd ± 0.1567.84 de ± 0.33
Oat bran magwinya
Fried doughFried batter
Control58.11 b ± 0.5580.62 f ± 0.07
Oat bran 156.96 a ± 0.5780.03 ef ± 0.42
Oat bran 556.34 a ± 0.6678.36 cd ± 0.42
Oat bran 856.64 a ± 0.5273.57 a ± 0.10
Oat bran 1056.65 a ± 0.4774.69 b ± 0.27
Oat bran 1556.98 a ± 0.0577.58 c ± 0.72
Oat bran 2057.27 ab ± 0.3279.13 de ± 0.29
Results are presented as mean ± standard deviation (n = 3). Mean values with different superscripts in the same column for each type of product (batter/dough) show significance (p < 0.05) using Duncan’s multiple range test. RDS—rapidly digestible starch, SDS—slowly digestible starch, RS—resistant starch, TS—total starch, K—constant (dimensionless), HI—hydrolysis index, OB—oat bran. Control denotes fried dough/batter with 0 g bran, while 1–20 represents concentration (g) of bran in product formulation.
Table 3. Correlation coefficients of independent variables, glucose, and estimated glycaemic index of wheat and oat bran magwinya.
Dependent VariablesInitial Moisture ContentBran ConcentrationRAGSAGUGeGI
Wheat bran magwinya
RAG0.931 **−0.310 *
SAG0.596 **0.488 **0.313 *
UG−0.985 **0.118−0.957 **−0.574 **
eGI0.865 **−0.2110.916 **0.338 *−0.892 **
Fat0.561 **−0.0870.542 **0.403 **−0.590 **0.495 **
Oat bran magwinya
RAG0.942 **−0.195
SAG0.557 **0.0950.397 **
UG−0.963 **0.155−0.981 **−0.565 **
eGI0.985 **−0.0520.962 **0.518 **−0.973 **
Fat0.636 **−0.361 *0.702 **0.148−0.661 **0.655 **
RAG, SAG and UG represent rapidly available, slowly available and unavailable glucose; eGI—estimated glycaemic index; * correlation significance at the 0.05 level, ** correlation significance at the 0.01 level.

