Validation of a Quantitative Proton Nuclear Magnetic Resonance Spectroscopic Screening Method for Coffee Quality and Authenticity (NMR Coffee Screener)

 , , and
Abstract

1. Introduction
2. Materials and Methods
2.1. Chemicals
Reference Standards and Preparation of Working Standard Solutions
2.2. Methodology
2.2.1. Samples and Sample Preparation
2.2.2. NMR Analysis
2.2.3. Experimental Design
2.2.4. Preparation of Working and Test Solutions
2.3. Validation Studies
2.3.1. Selectivity
2.3.2. Detection and Quantification Limits
2.3.3. Precision and Recovery
2.4. Data Analysis and Quality Control
2.5. Method Performance
3. Results and Discussion
3.1. Validation
3.1.1. Specificity and Selectivity
3.1.2. Analytical Limits
3.1.3. Precision
3.1.4. Linearity of Detector Response
3.1.5. Effect of Matrix
3.1.6. Applicability
4. Conclusions
Supplementary Materials
Author Contributions
Funding
Acknowledgments
Conflicts of Interest
References
- Nuhu, A.A. Bioactive micronutrients in coffee: Recent analytical approaches for characterization and quantification. ISRN Nutr. 2014, 2014, 384230. [Google Scholar] [CrossRef] [PubMed]
- Samoggia, A.; Riedel, B. Consumers’ perceptions of coffee health benefits and motives for coffee consumption and purchasing. Nutrients 2019, 11, 635. [Google Scholar] [CrossRef] [PubMed]
- Higdon, J.V.; Frei, B. Coffee and health: A review of recent human research. Crit. Rev. Food Sci. Nutr. 2006, 46, 101–123. [Google Scholar] [CrossRef] [PubMed]
- Hameed, A.; Hussain, S.A.; Suleria, H.A.R. “Coffee bean-related” agroecological factors affecting the coffee. In Co-Evolution of Secondary Metabolites; Merillon, J.M., Ramawat, K., Eds.; Reference Series in Phytochemistry; Springer: Cham, Switzerland, 2018. [Google Scholar] [CrossRef]
- Scharnhop, H.; Winterhalter, P. Isolation of coffee diterpenes by means of high-speed countercurrent chromatography. J. Food Compos. Anal. 2009, 22, 233–237. [Google Scholar] [CrossRef]
- Speer, K.; Kölling-Speer, I. The lipid fraction of the coffee bean. Braz. J. Plant Physiol. 2006, 18, 201–216. [Google Scholar] [CrossRef]
- Finotello, C.; Forzato, C.; Gasparini, A.; Mammi, S.; Navarini, L.; Schievano, E. NMR quantification of 16-O-methylcafestol and kahweol in Coffea canephora var. robusta beans from different geographical origins. Food Control 2017, 75, 62–69. [Google Scholar] [CrossRef]
- Schievano, E.; Finotello, C.; De Angelis, E.; Mammi, S.; Navarini, L. Rapid authentication of coffee blends and quantification of 16-O-methylcafestol in roasted coffee beans by nuclear magnetic resonance. J. Agric. Food Chem. 2014, 62, 12309–12314. [Google Scholar] [CrossRef]
- Smrke, S.; Kroslakova, I.; Gloess, A.N.; Yeretzian, C. Differentiation of degrees of ripeness of Catuai and Tipica green coffee by chromatographical and statistical techniques. Food Chem. 2015, 174, 637–642. [Google Scholar] [CrossRef]
- Jumhawan, U.; Putri, S.P.; Bamba, T.; Fukusaki, E. Application of gas chromatography/flame ionization detector-based metabolite fingerprinting for authentication of Asian palm civet coffee (Kopi Luwak). J. Biosci. Bioeng. 2015, 120, 555–561. [Google Scholar] [CrossRef]
- Jumhawan, U.; Putri, S.P.; Marwani, E.; Bamba, T.; Fukusaki, E. Selection of discriminant markers for authentication of asian palm civet coffee (Kopi Luwak): A metabolomics approach. J. Agric. Food Chem. 2013, 61, 7994–8001. [Google Scholar] [CrossRef]
- Mancha Agresti, P.D.C.; Franca, A.S.; Oliveira, L.S.; Augusti, R. Discrimination between defective and non-defective Brazilian coffee beans by their volatile profile. Food Chem. 2008, 106, 787–796. [Google Scholar] [CrossRef]
- Özdestan, Ö.; van Ruth, S.M.; Alewijn, M.; Koot, A.; Romano, A.; Cappellin, L.; Biasioli, F. Differentiation of specialty coffees by proton transfer reaction-mass spectrometry. Food Res. Int. 2013, 53, 433–439. [Google Scholar] [CrossRef]
- Monakhova, Y.B.; Ruge, W.; Kuballa, T.; Ilse, M.; Winkelmann, O.; Diehl, B.; Thomas, F.; Lachenmeier, D.W. Rapid approach to identify the presence of Arabica and Robusta species in coffee using 1H NMR spectroscopy. Food Chem. 2015, 182, 178–184. [Google Scholar] [CrossRef] [PubMed]
- Rodrigues, C.; Brunner, M.; Steiman, S.; Bowen, G.J.; Nogueira, J.M.F.; Gautz, L.; Prohaska, T.; Máguas, C. Isotopes as tracers of the Hawaiian coffee-producing regions. J. Agric. Food Chem. 2011, 59, 10239–10246. [Google Scholar] [CrossRef] [PubMed]
- Medina, J.; Caro Rodríguez, D.; Arana, V.A.; Bernal, A.; Esseiva, P.; Wist, J. Comparison of attenuated total reflectance mid-infrared, near infrared, and 1H-nuclear magnetic resonance spectroscopies for the determination of coffee’s geographical origin. Int. J. Anal. Chem. 2017, 2017, 7210463. [Google Scholar] [CrossRef] [PubMed]
- Esteban-Díez, I.; González-Sáiz, J.M.; Sáenz-González, C.; Pizarro, C. Coffee varietal differentiation based on near infrared spectroscopy. Talanta 2007, 71, 221–229. [Google Scholar] [CrossRef] [PubMed]
- Dong, W.; Zhao, J.; Hu, R.; Dong, Y.; Tan, L. Differentiation of Chinese robusta coffees according to species, using a combined electronic nose and tongue, with the aid of chemometrics. Food Chem. 2017, 229, 743–751. [Google Scholar] [CrossRef] [PubMed]
- Grembecka, M.; Malinowska, E.; Szefer, P. Differentiation of market coffee and its infusions in view of their mineral composition. Sci. Total Environ. 2007, 383, 59–69. [Google Scholar] [CrossRef]
- Monakhova, Y.B.; Schäfer, H.; Humpfer, E.; Spraul, M.; Kuballa, T.; Lachenmeier, D.W. Application of automated eightfold suppression of water and ethanol signals in 1H NMR to provide sensitivity for analyzing alcoholic beverages. Magn. Reson. Chem. 2011, 49, 734–739. [Google Scholar] [CrossRef]
- Monakhova, Y.B.; Schütz, B.; Schäfer, H.; Spraul, M.; Kuballa, T.; Hahn, H.; Lachenmeier, D.W. Validation studies for multicomponent quantitative NMR analysis: The example of apple fruit juice. Accredit. Qual. Assur. 2014, 19, 17–29. [Google Scholar] [CrossRef]
- Spraul, M.; Schütz, B.; Rinke, P.; Koswig, S.; Humpfer, E.; Schäfer, H.; Mörtter, M.; Fang, F.; Marx, U.C.; Minoja, A. NMR-based multi parametric quality control of fruit juices: SGF profiling. Nutrients 2009, 1, 148–155. [Google Scholar] [CrossRef] [PubMed]
- Defernez, M.; Wren, E.; Watson, A.D.; Gunning, Y.; Colquhoun, I.J.; Le Gall, G.; Williamson, D.; Kemsley, E.K. Low-field 1H NMR spectroscopy for distinguishing between arabica and robusta ground roast coffees. Food Chem. 2017, 216, 106–113. [Google Scholar] [CrossRef] [PubMed]
- Lachenmeier, D.W.; Schwarz, S.; Teipel, J.; Hegmanns, M.; Kuballa, T.; Walch, S.G.; Breitling-Utzmann, C.M. Potential antagonistic effects of acrylamide mitigation during coffee roasting on furfuryl alcohol, furan and 5-hydroxymethylfurfural. Toxics 2019, 7, 1. [Google Scholar] [CrossRef]
- Okaru, A.O.; Lachenmeier, D.W. The food and beverage occurrence of furfuryl alcohol and myrcene—Two emerging potential human carcinogens? Toxics 2017, 5, 9. [Google Scholar] [CrossRef] [PubMed]
- Lachenmeier, D.W.; Teipel, J.; Scharinger, A.; Kuballa, T.; Walch, S.G.; Grosch, F.; Bunzel, M.; Okaru, A.O.; Schwarz, S. Fully automated identification of coffee species and simultaneous quantification of furfuryl alcohol using NMR spectroscopy. J. AOAC Int. 2020, in press. [Google Scholar] [CrossRef]
- Grosse, Y.; Loomis, D.; Guyton, K.Z.; El Ghissassi, F.; Bouvard, V.; Benbrahim-Tallaa, L.; Mattock, H.; Straif, K.; International Agency for Research on Cancer Monograph Working Group. Some chemicals that cause tumours of the urinary tract in rodents. Lancet. Oncol. 2017, 18, 1003–1004. [Google Scholar] [CrossRef]
- Malz, F.; Jancke, H. Validation of quantitative NMR. J. Pharm. Biomed. Anal. 2005, 38, 813–823. [Google Scholar] [CrossRef]
- Bharti, S.K.; Roy, R. Quantitative 1H NMR spectroscopy. Trends Anal. Chem. 2012, 35, 5–26. [Google Scholar] [CrossRef]
- Lachenmeier, D.; Schönberger, T.; Ehni, S.; Schütz, B.; Spraul, M. A discussion about the potentials and pitfalls of quantitative nuclear magnetic resonance (qNMR) spectroscopy in food science and beyond. In Proceedings of the XIII International Conference on the Applications of Magnetic Resonance in Food Science, Karlsruhe, Germany, 7–10 June 2016; pp. 77–85. [Google Scholar] [CrossRef]
- Humpfer, E.; Schütz, B.; Fang, F.; Cannet, C.; Mörtter, M.; Schäfer, H.; Spraul, M. Food NMR optimized for industrial use-an NMR platform concept. In Magnetic Resonance in Food Science: Defining Food by Magnetic Resonance; Royal Society of Chemistry: Cambridge, UK, 2015; pp. 77–83. [Google Scholar] [CrossRef]
- Verordnung über Kaffee, Kaffee- und Zichorien-Extrakte vom 15. November 2001 (BGBl. I S. 3107), die zuletzt durch Artikel 6 der Verordnung vom 5. Juli 2017 (BGBl. I S. 2272) geändert worden ist. Available online: https://www.gesetze-im-internet.de/kaffeev_2001/BJNR310700001.html (accessed on 18 December 2019). (In German).
- Wider, G.; Dreier, L. Measuring protein concentrations by NMR spectroscopy. J. Am. Chem. Soc. 2006, 128, 2571–2576. [Google Scholar] [CrossRef]
- DIN 32645:2008-11. Chemical Analysis—Decision Limit, Detection Limit and Determination Limit under Repeatability Conditions—Terms, Methods, Evaluation; DIN e. V.: Berlin, Germany, 2008.
- DIN 10779:2011-03. Analysis of Coffee and Coffee Products—Determination of 16-O-Methyl Cafestol Content of Roasted Coffee—HPLC-Method; DIN e. V.: Berlin, Germany, 2008.
- Lachenmeier, D.W. CVUA Karlsruhe unterstützt die Europol/INTERPOL-Operation OPSON VIII zur Aufklärung von Lebensmittelbetrug bei Kaffee. 2019. Available online: https://www.ua-bw.de/pub/beitrag.asp?subid=2&Thema_ID=2&ID=2985&lang=DE&Pdf=No (accessed on 18 December 2019). (In German).
- Europol. Over €100 Million Worth of Fake Food and Drinks Seized in Latest Europol-Interpol Operation. 2019. Available online: https://www.europol.europa.eu/newsroom/news/over-%E2%82%AC100-million-worth-of-fake-food-and-drinks-seized-in-latest-europol-interpol-operation (accessed on 18 December 2019).


| Substance | Guidance Value a (mg/kg) | Defined Working Ranges According to Experience (mg/kg) |
|---|---|---|
| OMC | <50 for arabica | 7.5–7500 |
| Caffeine | <1000 for decaf | 7.5–7500 |
| Kahweol | <300 for robusta | 7.5–7500 |
| Furfuryl alcohol | - | 7.5–7500 |
| HMF | - | 7.5–7500 |
| Array | Factor 1: NMR Device | Factor 2: Coffee Type | Factor 3: Shaking Time (min) |
|---|---|---|---|
| 1 | Ultrashield/Ascend | 100% arabica decaffeinated | 20 |
| 2 | Ultrashield/Ascend | 100% robusta | 20 |
| 3 | Ultrashield/Ascend | Green coffee | 20 |
| 4 | Ultrashield/Ascend | 100% arabica decaffeinated | 10 |
| 5 | Ultrashield/Ascend | 100% robusta | 10 |
| 6 | Ultrashield/Ascend | Green coffee | 10 |
| Desired Calibration Concentration (mg/L) | Dilution of Stock Solution (1000 mg/L) | Desired Final Concentration (mg/L) | Volume per Stock Solution (µL) | Volume of all Analytes (µL) | Volume of CDCl3 (µL) |
|---|---|---|---|---|---|
| 0 (Blank, 2×) | 0 | 0 | - | - | 1500 |
| 1 | 1:1000 | 1 | 1.5 | 7.5 | 1492.5 |
| 5 | 1:200 | 5 | 7.5 | 37.5 | 1462.5 |
| 10 | 1:100 | 10 | 15 | 75 | 1425 |
| 25 | 1:40 | 25 | 37.5 | 187.5 | 1312.5 |
| 50 | 1:20 | 50 | 75 | 375 | 1125 |
| 100 | 1:10 | 100 | 150 | 750 | 750 |
| 250 | 1:20 | 250 | 75 | 375 | 1125 |
| 500 | 1:10 | 500 | 150 | 750 | 750 |
| 750 | 1:6.66 | 750 | 225 | 1125 | 375 |
| 1000 | 1:5 | 1000 | 300 | 1500 | - |
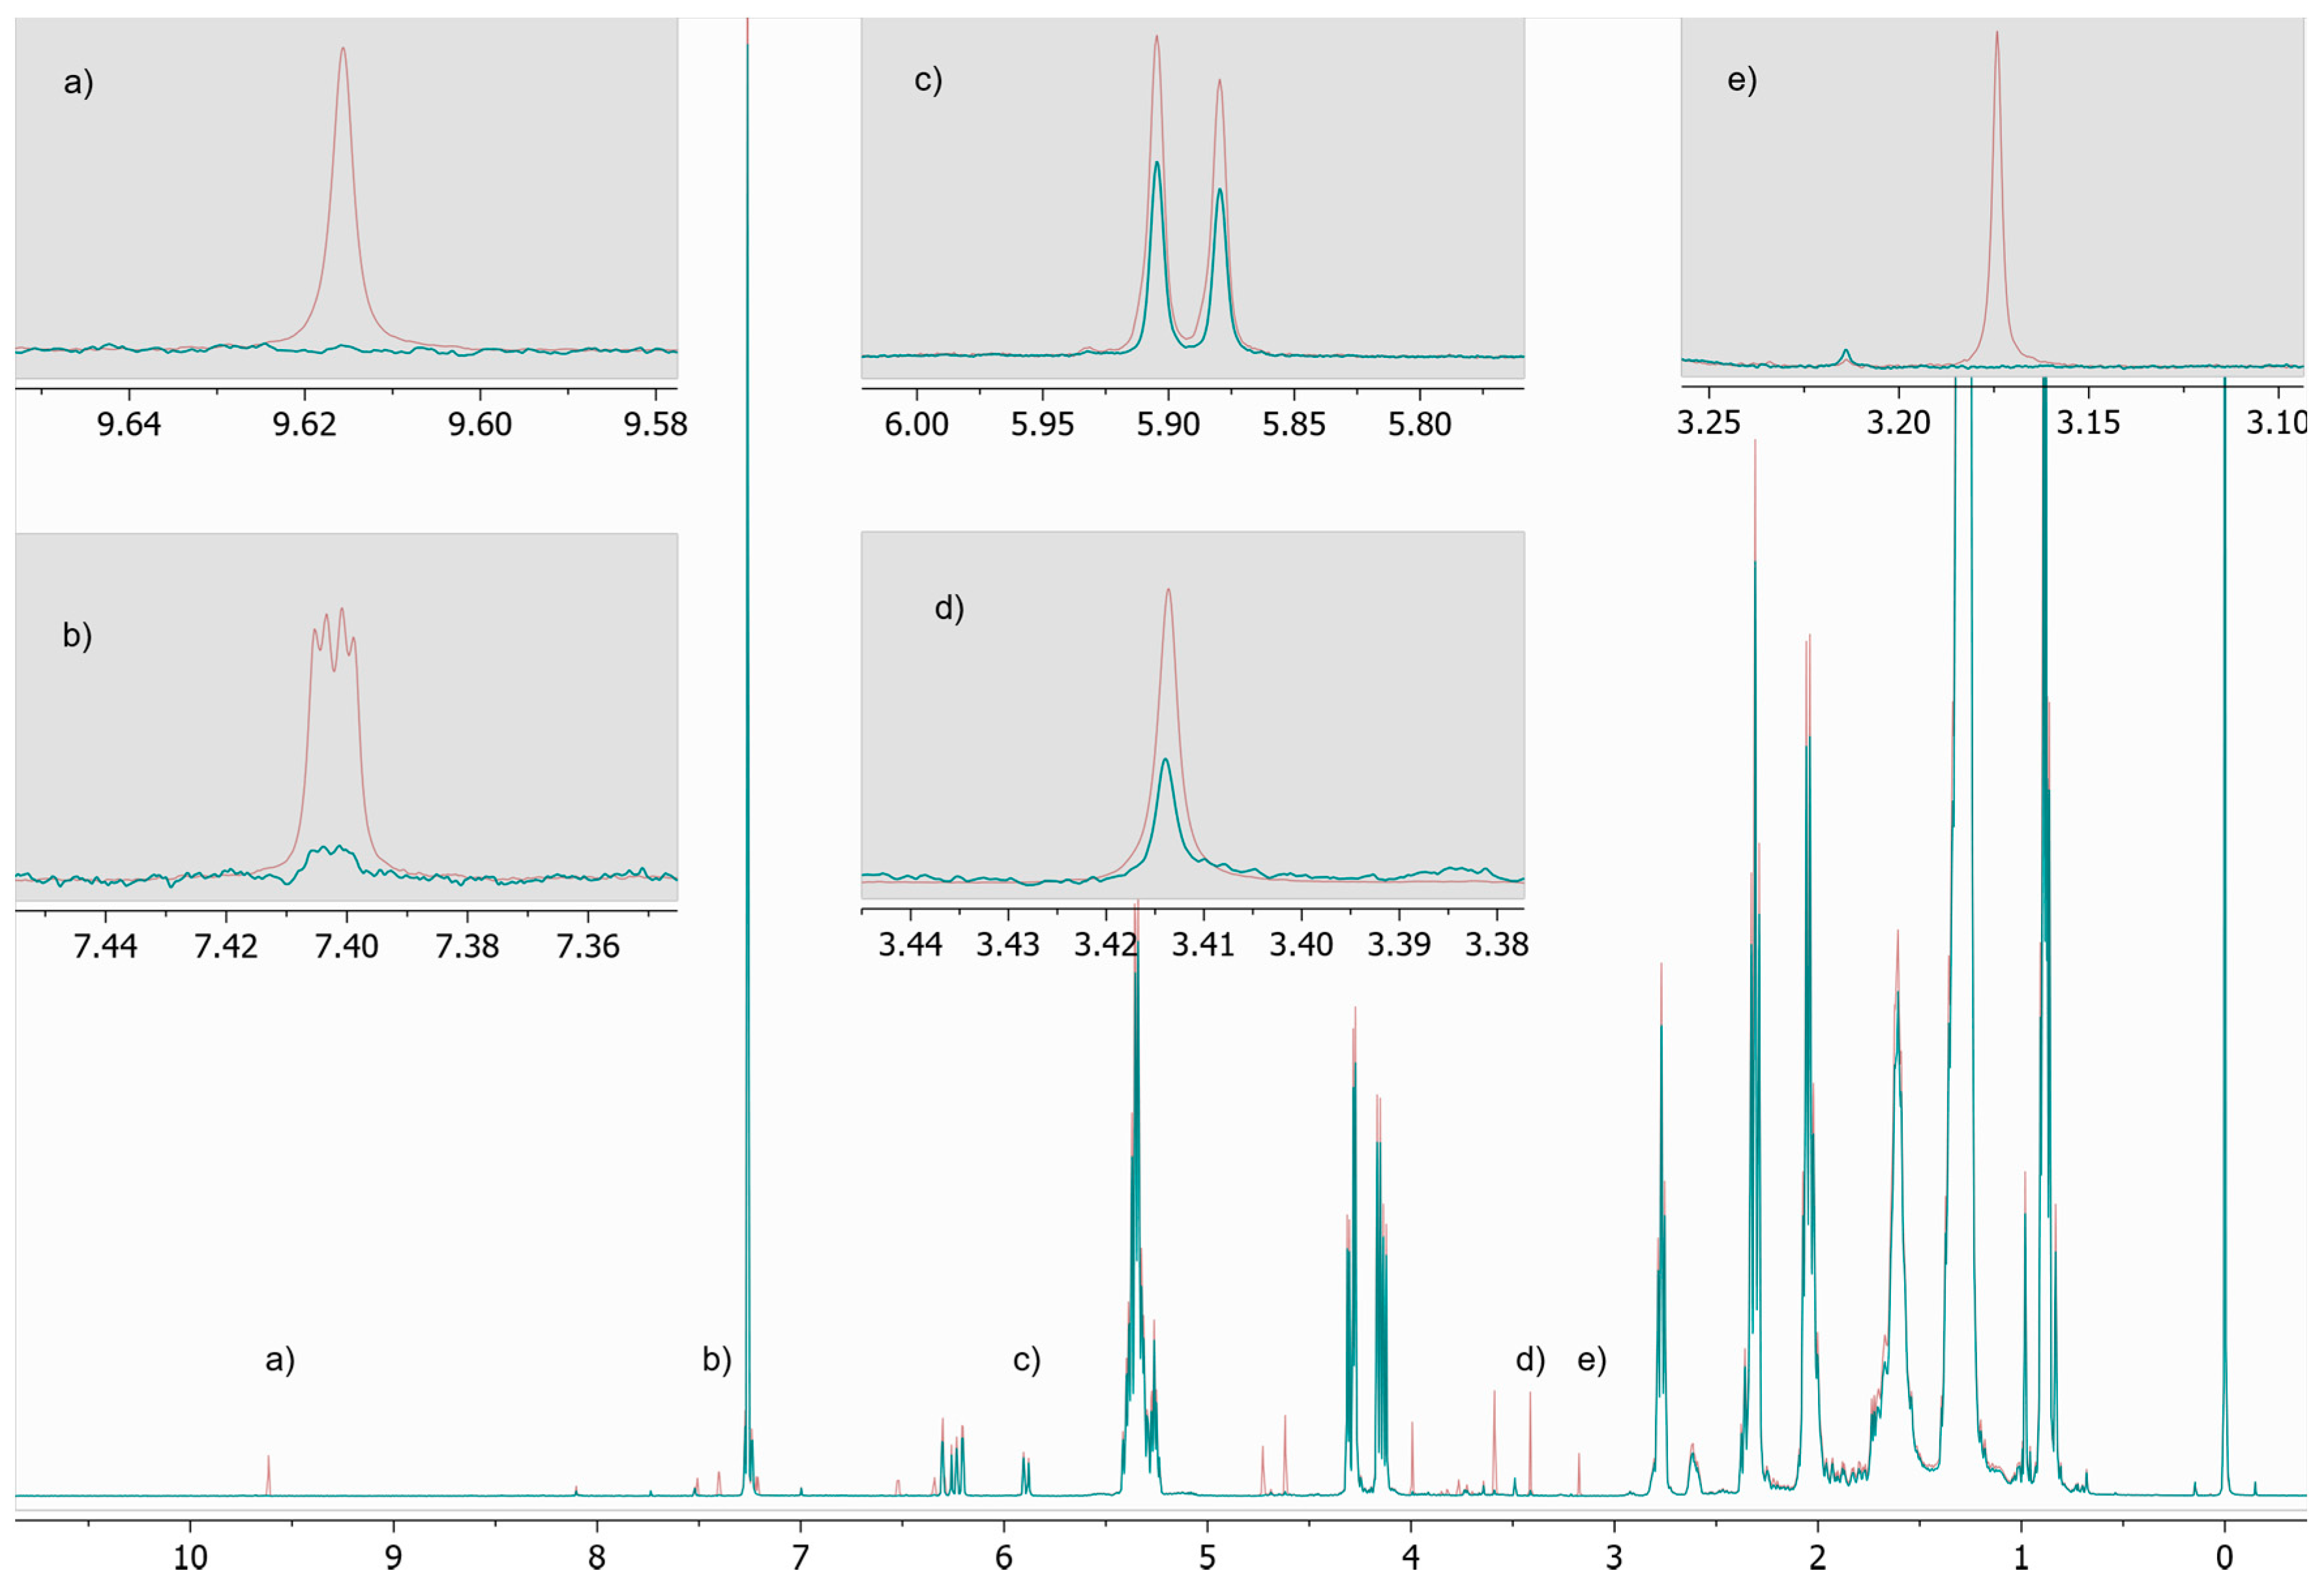
| Analyte | Integration Range (ppm) |
|---|---|
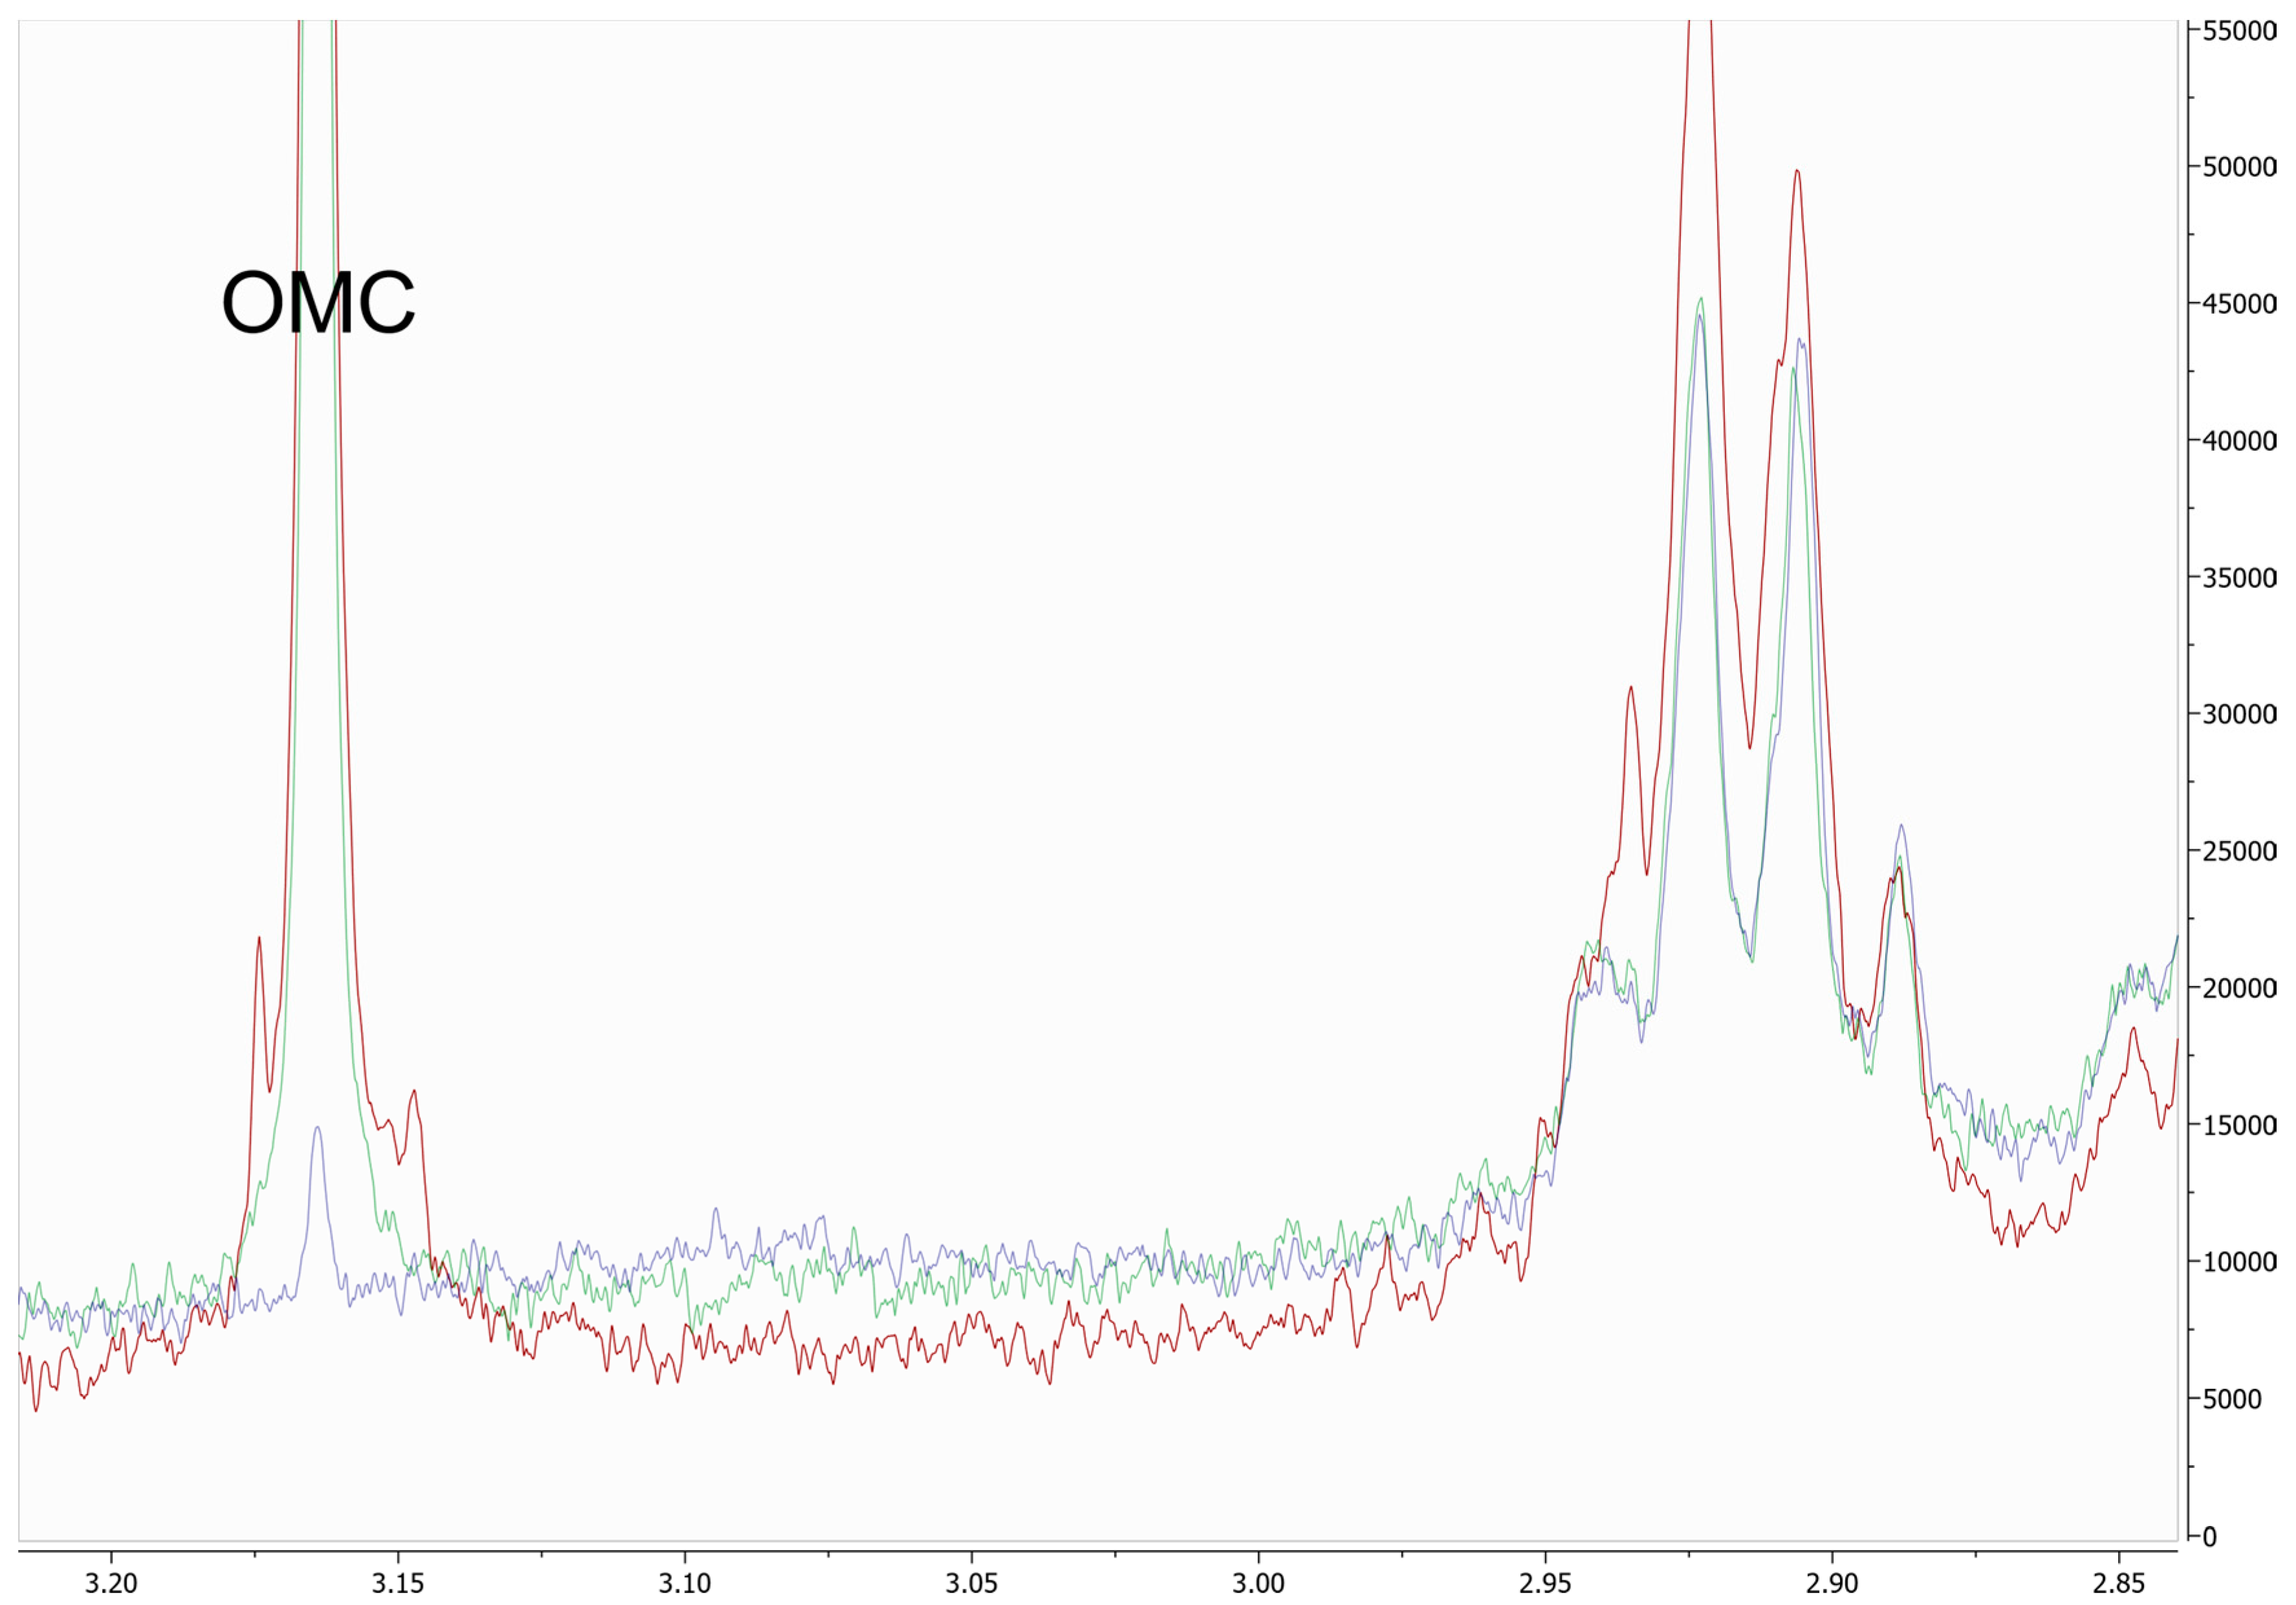
| OMC | 3.185–3.125 |
| Caffeine | 3.44–3.38 |
| Kahweol | 5.925–5.85 |
| Furfuryl alcohol | 7.411–7.39 |
| HMF | 9.69–9.67 |
| Analyte | Detection Limit (mg/kg) | Determination Limit (mg/kg) | Concentration Range for Determination of Limit (mg/kg) |
|---|---|---|---|
| OMC | 2.5 | 7.4 | 7.5–187.5 |
| Caffeine | 15.7 | 43.1 | 7.5–187.5 |
| Kahweol | 186.0 | 501.4 | 187.5–1875.0 |
| Furfuryl alcohol | 11.6 | 39.4 | 7.5–75 |
| HMF | 6.3 | 22.9 | 7.5–75 |
| Matrix | Recovery (%) | ||||
|---|---|---|---|---|---|
| Caffeine | OMC | Kahweol | Furfuryl Alcohol | HMF | |
| Decaf. arabica | 101 | 97 | 95 | 97 | 102 |
| Robusta | 102 | 101 | 74 * | 99 | 101 |
| Green coffee | 137 * | 54 * | 188 * | 93 | 107 |
| Matrix | Precision (CV) | ||||
|---|---|---|---|---|---|
| Caffeine | OMC | Kahweol | Furfuryl Alcohol | HMF | |
| Decaf. arabica | 8.1 | 6.5 | 22.2 * | 6.1 | 8.3 |
| Robusta | 7.4 | 7.8 | 32.7 * | 5.8 | 6.9 |
| Green coffee | 104 * | 188 * | 570 * | 25 * | 27 * |
| Analyte | Linearity (mg/kg) | Coefficient of Determination (R2) |
|---|---|---|
| OMC | 7.5–5625 | 1.0000 |
| Caffeine | 7.5–5625 | 1.0000 |
| Kahweol | 7.5–5625 | 0.9949 |
| Furfuryl alcohol | 7.5–5625 | 1.0000 |
| HMF | 7.5–5625 | 0.9997 |
© 2020 by the authors. Licensee MDPI, Basel, Switzerland. This article is an open access article distributed under the terms and conditions of the Creative Commons Attribution (CC BY) license (http://creativecommons.org/licenses/by/4.0/).
Share and Cite
Okaru, A.O.; Scharinger, A.; Rajcic de Rezende, T.; Teipel, J.; Kuballa, T.; Walch, S.G.; Lachenmeier, D.W. Validation of a Quantitative Proton Nuclear Magnetic Resonance Spectroscopic Screening Method for Coffee Quality and Authenticity (NMR Coffee Screener). Foods 2020, 9, 47. https://doi.org/10.3390/foods9010047
Okaru AO, Scharinger A, Rajcic de Rezende T, Teipel J, Kuballa T, Walch SG, Lachenmeier DW. Validation of a Quantitative Proton Nuclear Magnetic Resonance Spectroscopic Screening Method for Coffee Quality and Authenticity (NMR Coffee Screener). Foods. 2020; 9(1):47. https://doi.org/10.3390/foods9010047
Chicago/Turabian StyleOkaru, Alex O., Andreas Scharinger, Tabata Rajcic de Rezende, Jan Teipel, Thomas Kuballa, Stephan G. Walch, and Dirk W. Lachenmeier. 2020. "Validation of a Quantitative Proton Nuclear Magnetic Resonance Spectroscopic Screening Method for Coffee Quality and Authenticity (NMR Coffee Screener)" Foods 9, no. 1: 47. https://doi.org/10.3390/foods9010047
APA StyleOkaru, A. O., Scharinger, A., Rajcic de Rezende, T., Teipel, J., Kuballa, T., Walch, S. G., & Lachenmeier, D. W. (2020). Validation of a Quantitative Proton Nuclear Magnetic Resonance Spectroscopic Screening Method for Coffee Quality and Authenticity (NMR Coffee Screener). Foods, 9(1), 47. https://doi.org/10.3390/foods9010047