The Role of Trust in Explaining Food Choice: Combining Choice Experiment and Attribute Best–Worst Scaling †


Abstract
1. Introduction
1.1. Thematic Background
… the willingness of a party to be vulnerable to the actions of another party based on the expectation that the other will perform a particular action important to the trustor, irrespective of the ability to monitor or control that other party.([59], p. 712)
1.2. Methodological Background
2. Materials and Methods
2.1. Data Collection
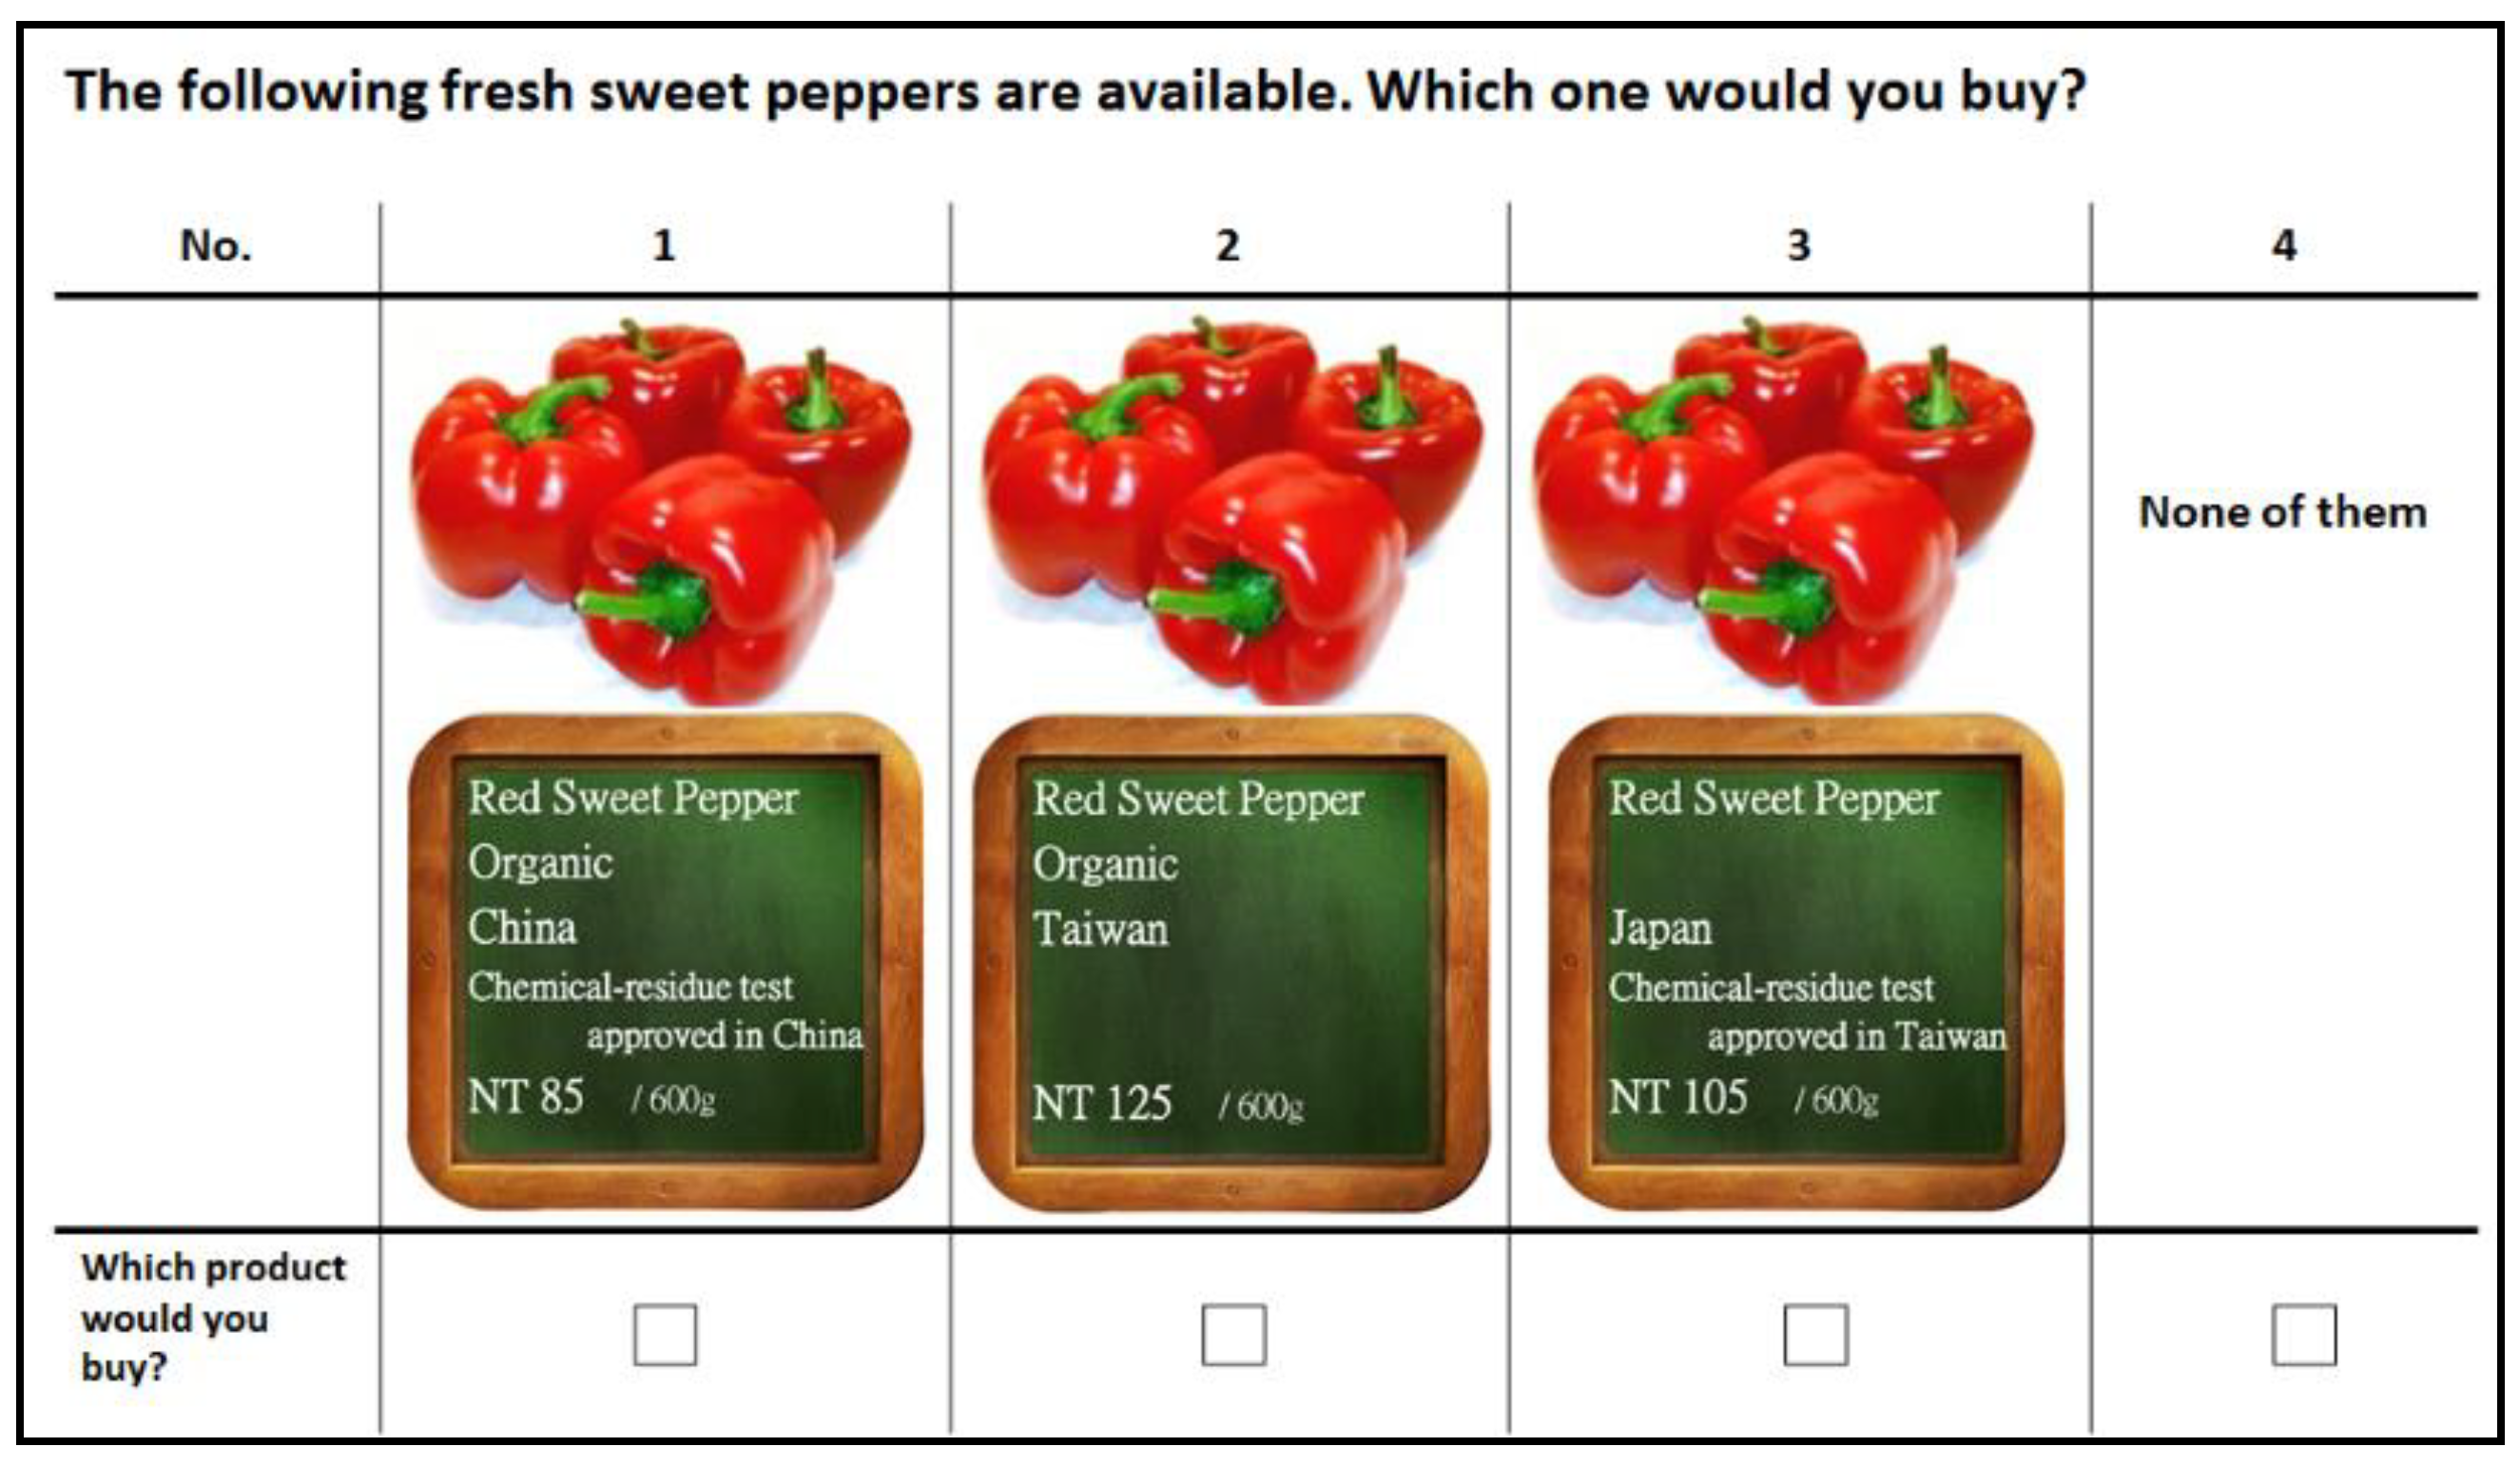
2.2. Discrete Choice Experiment (DCE)
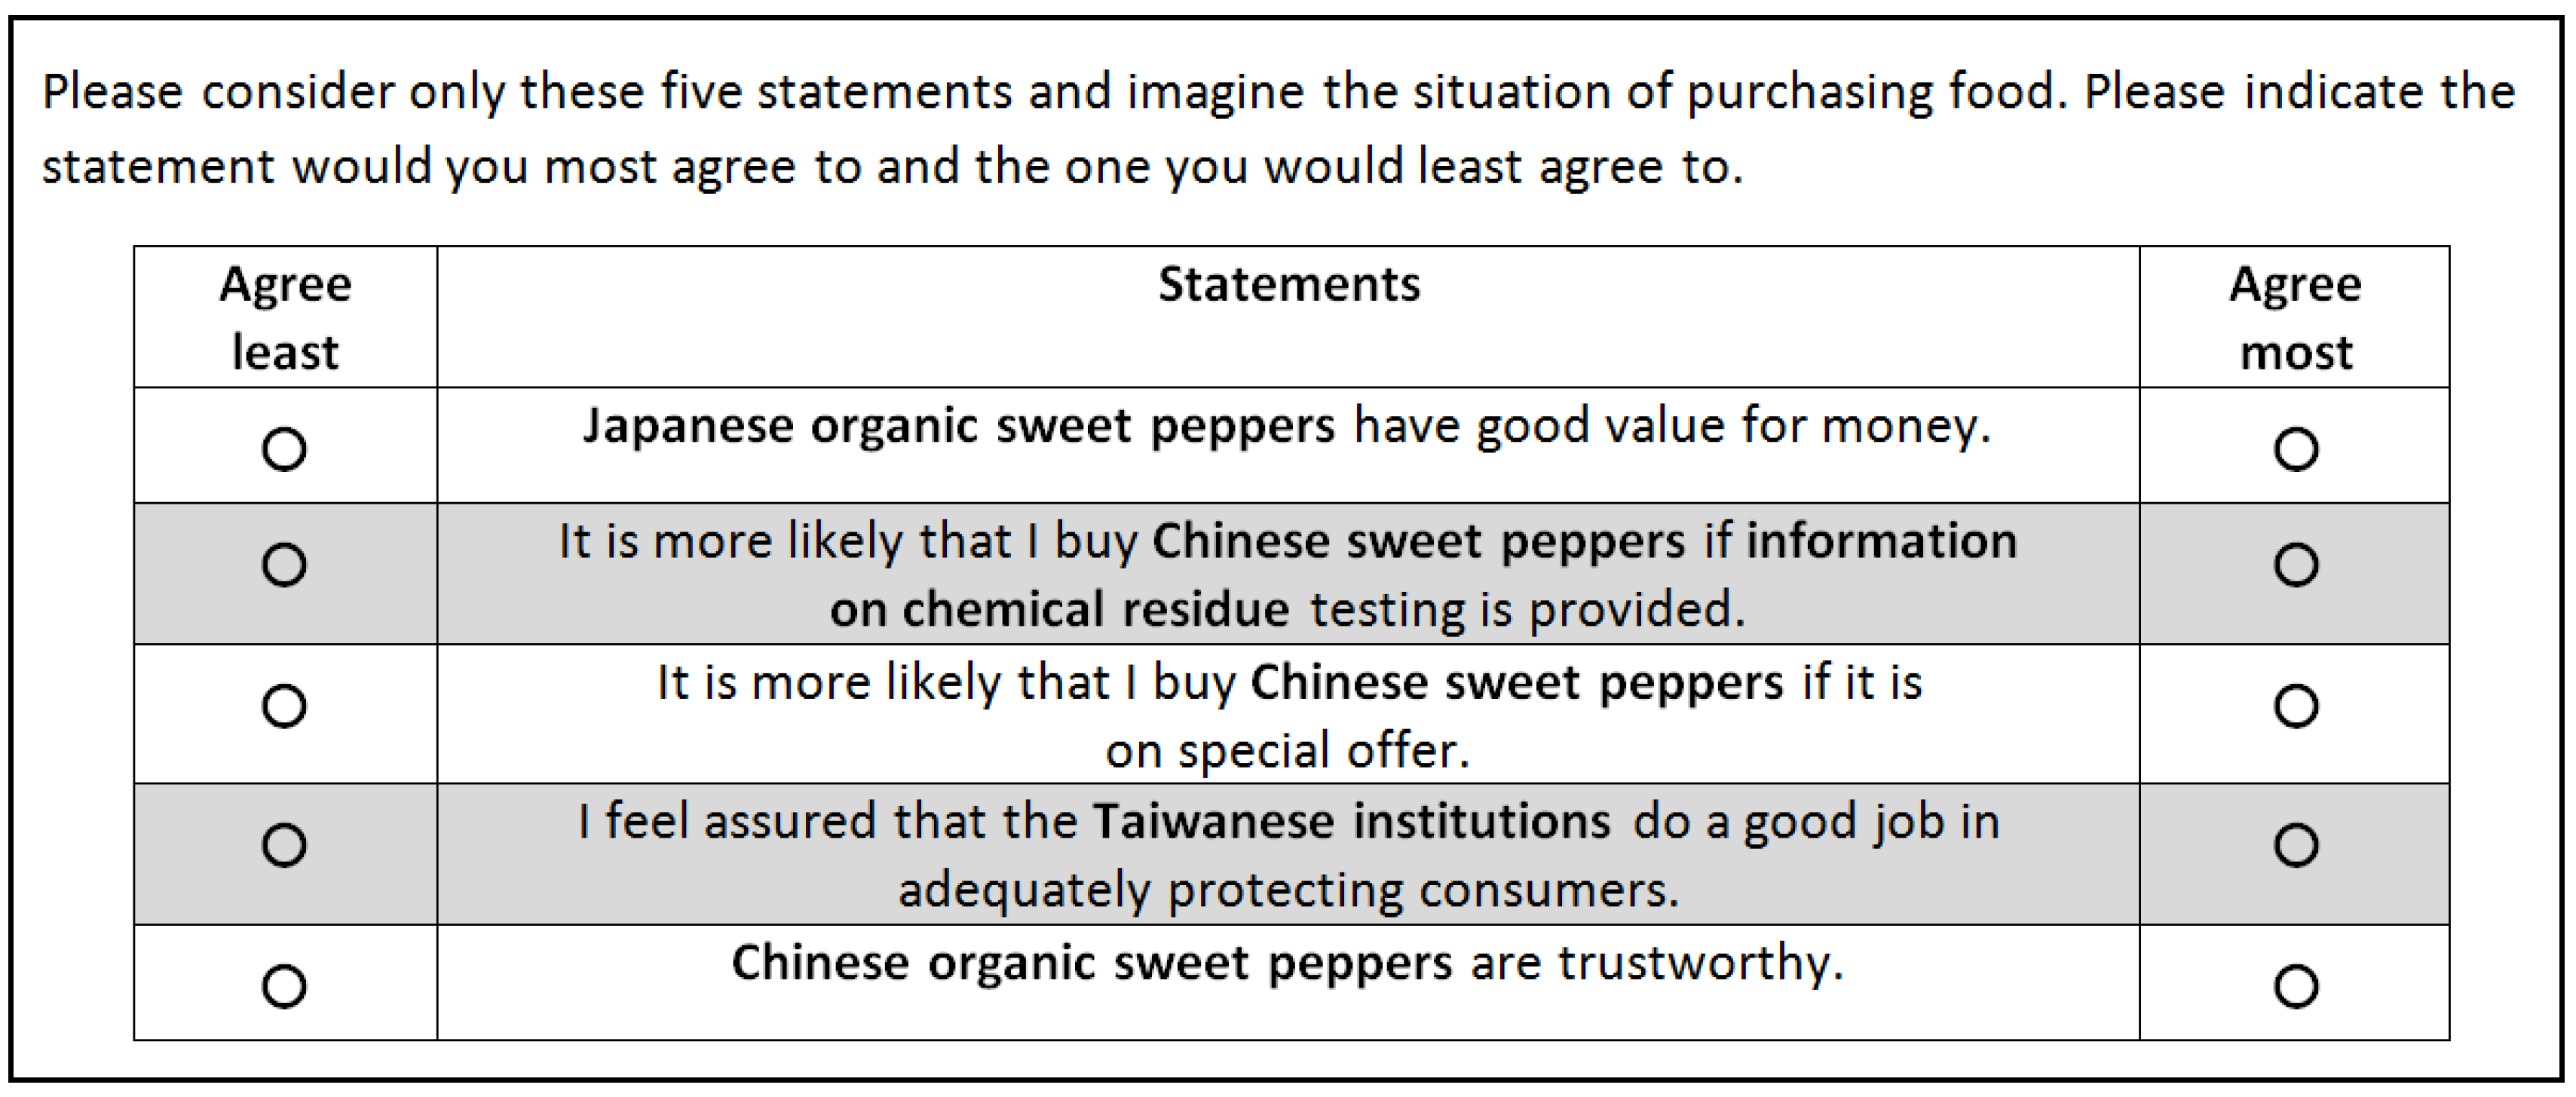
2.3. Best–Worst Scaling (BWS)
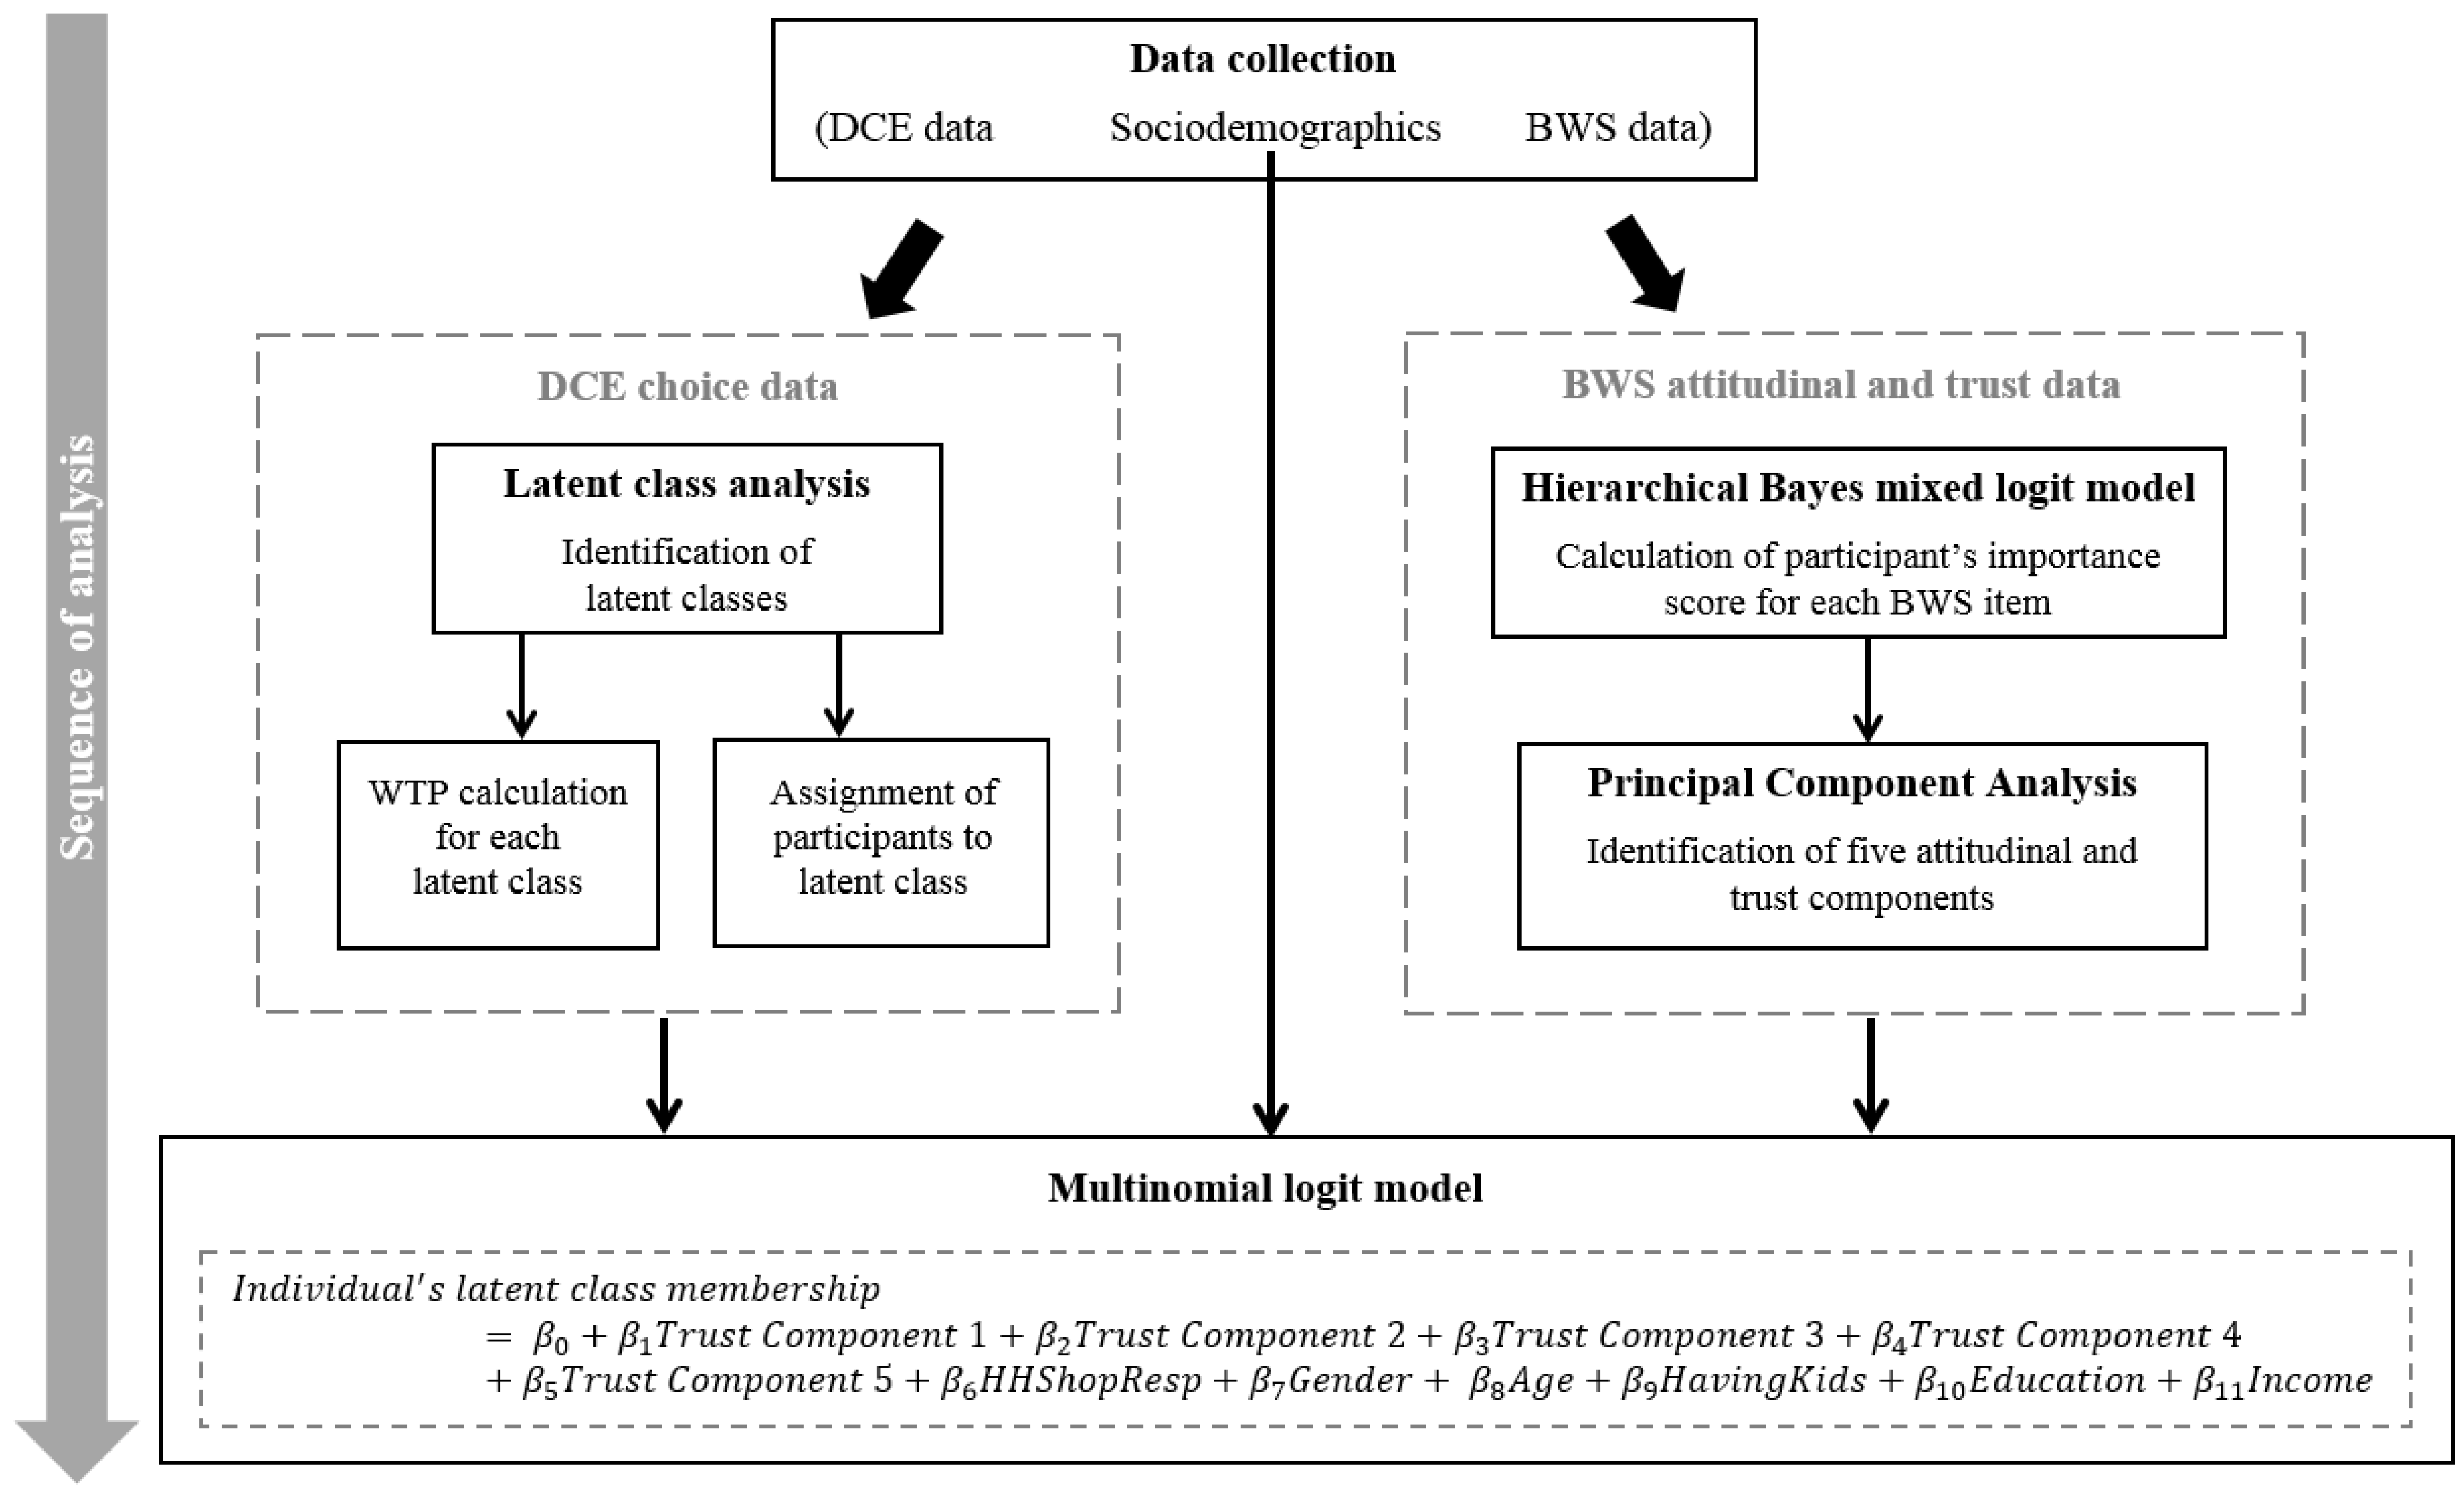
2.4. Combining DCE and BWS
3. Results
3.1. Sample Demographics
3.2. Identifying Consumer Segments Based on DCE Data
3.3. Identifying Consumers’ Attitude and Trust Based on BWS Data
3.4. Characterizing Consumer Segments with Respect to Attitudes and Trust
4. Discussion
5. Conclusions
Author Contributions
Funding
Conflicts of Interest
Appendix A. BWS Design Matrices

| Number of statements = 25 | |
| Number of statements per choice set = 5 | |
| Number of sets per respondent: 10 | |
| Number of blocks: 30 | |
| One Way Frequencies: | |
| Statement | Frequencies Used |
| 1 | 60 |
| 2 | 60 |
| 3 | 60 |
| 4 | 60 |
| 5 | 60 |
| 6 | 60 |
| 7 | 60 |
| 8 | 60 |
| 9 | 60 |
| 10 | 60 |
| 11 | 60 |
| 12 | 60 |
| 13 | 60 |
| 14 | 60 |
| 15 | 60 |
| 16 | 60 |
| 17 | 60 |
| 18 | 60 |
| 19 | 60 |
| 20 | 60 |
| 21 | 60 |
| 22 | 60 |
| 23 | 60 |
| 24 | 60 |
| 25 | 60 |
| Mean = | 60 |
| S.D. = | 0 |
| Positional Frequencies: | |||||
| Position in the BWS choice set | |||||
| Statement | 1 | 2 | 3 | 4 | 5 |
| 1 | 12 | 12 | 12 | 12 | 12 |
| 2 | 11 | 13 | 12 | 12 | 12 |
| 3 | 12 | 13 | 12 | 12 | 11 |
| 4 | 12 | 11 | 13 | 12 | 12 |
| 5 | 12 | 12 | 12 | 13 | 11 |
| 6 | 12 | 13 | 11 | 12 | 12 |
| 7 | 12 | 12 | 12 | 13 | 11 |
| 8 | 12 | 12 | 12 | 11 | 13 |
| 9 | 12 | 11 | 12 | 12 | 13 |
| 10 | 12 | 12 | 12 | 12 | 12 |
| 11 | 12 | 12 | 12 | 12 | 12 |
| 12 | 12 | 13 | 12 | 11 | 12 |
| 13 | 12 | 12 | 12 | 12 | 12 |
| 14 | 12 | 12 | 12 | 12 | 12 |
| 15 | 12 | 11 | 12 | 13 | 12 |
| 16 | 12 | 12 | 12 | 12 | 12 |
| 17 | 12 | 12 | 12 | 12 | 12 |
| 18 | 11 | 12 | 12 | 12 | 13 |
| 19 | 12 | 12 | 12 | 12 | 12 |
| 20 | 13 | 12 | 12 | 11 | 12 |
| 21 | 12 | 12 | 13 | 11 | 12 |
| 22 | 13 | 12 | 11 | 12 | 12 |
| 23 | 12 | 11 | 12 | 13 | 12 |
| 24 | 12 | 12 | 12 | 11 | 13 |
| 25 | 12 | 12 | 12 | 13 | 11 |
| Mean = | 12 | ||||
| S.D. = | 0.522 | ||||
| Two Way Frequencies: | |||||||||||||||||||||||||
|---|---|---|---|---|---|---|---|---|---|---|---|---|---|---|---|---|---|---|---|---|---|---|---|---|---|
| Statement | 1 | 2 | 3 | 4 | 5 | 6 | 7 | 8 | 9 | 10 | 11 | 12 | 13 | 14 | 15 | 16 | 17 | 18 | 19 | 20 | 21 | 22 | 23 | 24 | 25 |
| 1 | 60 | 10 | 11 | 10 | 10 | 10 | 10 | 10 | 10 | 10 | 10 | 11 | 9 | 11 | 10 | 10 | 10 | 10 | 10 | 10 | 9 | 10 | 9 | 10 | 10 |
| 2 | 10 | 60 | 10 | 10 | 10 | 10 | 10 | 10 | 10 | 10 | 10 | 10 | 9 | 10 | 10 | 11 | 10 | 9 | 10 | 10 | 11 | 10 | 10 | 10 | 10 |
| 3 | 11 | 10 | 60 | 10 | 10 | 9 | 10 | 10 | 10 | 9 | 10 | 10 | 11 | 10 | 10 | 10 | 10 | 10 | 11 | 9 | 10 | 10 | 10 | 10 | 10 |
| 4 | 10 | 10 | 10 | 60 | 10 | 10 | 9 | 10 | 10 | 10 | 9 | 10 | 10 | 10 | 10 | 10 | 11 | 11 | 10 | 10 | 10 | 10 | 10 | 10 | 10 |
| 5 | 10 | 10 | 10 | 10 | 60 | 10 | 10 | 10 | 10 | 10 | 10 | 10 | 10 | 10 | 10 | 10 | 10 | 10 | 10 | 9 | 10 | 11 | 10 | 10 | 10 |
| 6 | 10 | 10 | 9 | 10 | 10 | 60 | 10 | 11 | 10 | 10 | 10 | 10 | 10 | 10 | 9 | 10 | 10 | 10 | 11 | 10 | 10 | 10 | 9 | 10 | 11 |
| 7 | 10 | 10 | 10 | 9 | 10 | 10 | 60 | 10 | 10 | 11 | 11 | 10 | 10 | 11 | 9 | 10 | 9 | 10 | 10 | 10 | 10 | 10 | 10 | 10 | 10 |
| 8 | 10 | 10 | 10 | 10 | 10 | 11 | 10 | 60 | 10 | 9 | 10 | 10 | 11 | 10 | 10 | 10 | 10 | 10 | 11 | 10 | 9 | 10 | 10 | 10 | 9 |
| 9 | 10 | 10 | 10 | 10 | 10 | 10 | 10 | 10 | 60 | 10 | 10 | 10 | 11 | 9 | 11 | 9 | 10 | 11 | 9 | 10 | 10 | 10 | 10 | 10 | 10 |
| 10 | 10 | 10 | 9 | 10 | 10 | 10 | 11 | 9 | 10 | 60 | 10 | 10 | 10 | 10 | 11 | 9 | 11 | 10 | 10 | 10 | 10 | 10 | 10 | 10 | 10 |
| 11 | 10 | 10 | 10 | 9 | 10 | 10 | 11 | 10 | 10 | 10 | 60 | 9 | 11 | 9 | 11 | 11 | 10 | 10 | 10 | 10 | 10 | 10 | 10 | 9 | 10 |
| 12 | 11 | 10 | 10 | 10 | 10 | 10 | 10 | 10 | 10 | 10 | 9 | 60 | 9 | 11 | 11 | 11 | 9 | 9 | 10 | 10 | 10 | 10 | 10 | 10 | 10 |
| 13 | 9 | 9 | 11 | 10 | 10 | 10 | 10 | 11 | 11 | 10 | 11 | 9 | 60 | 10 | 10 | 10 | 10 | 10 | 9 | 10 | 10 | 10 | 10 | 10 | 10 |
| 14 | 11 | 10 | 10 | 10 | 10 | 10 | 11 | 10 | 9 | 10 | 9 | 11 | 10 | 60 | 10 | 9 | 9 | 10 | 10 | 10 | 10 | 10 | 11 | 10 | 10 |
| 15 | 10 | 10 | 10 | 10 | 10 | 9 | 9 | 10 | 11 | 11 | 11 | 11 | 10 | 10 | 60 | 10 | 10 | 10 | 9 | 11 | 10 | 9 | 10 | 10 | 9 |
| 16 | 10 | 11 | 10 | 10 | 10 | 10 | 10 | 10 | 9 | 9 | 11 | 11 | 10 | 9 | 10 | 60 | 10 | 10 | 10 | 10 | 10 | 10 | 10 | 10 | 10 |
| 17 | 10 | 10 | 10 | 11 | 10 | 10 | 9 | 10 | 10 | 11 | 10 | 9 | 10 | 9 | 10 | 10 | 60 | 10 | 10 | 10 | 10 | 10 | 10 | 10 | 11 |
| 18 | 10 | 9 | 10 | 11 | 10 | 10 | 10 | 10 | 11 | 10 | 10 | 9 | 10 | 10 | 10 | 10 | 10 | 60 | 9 | 10 | 10 | 10 | 10 | 11 | 10 |
| 19 | 10 | 10 | 11 | 10 | 10 | 11 | 10 | 11 | 9 | 10 | 10 | 10 | 9 | 10 | 9 | 10 | 10 | 9 | 60 | 9 | 11 | 11 | 10 | 10 | 10 |
| 20 | 10 | 10 | 9 | 10 | 9 | 10 | 10 | 10 | 10 | 10 | 10 | 10 | 10 | 10 | 11 | 10 | 10 | 10 | 9 | 60 | 11 | 10 | 11 | 10 | 10 |
| 21 | 9 | 11 | 10 | 10 | 10 | 10 | 10 | 9 | 10 | 10 | 10 | 10 | 10 | 10 | 10 | 10 | 10 | 10 | 11 | 11 | 60 | 9 | 10 | 10 | 10 |
| 22 | 10 | 10 | 10 | 10 | 11 | 10 | 10 | 10 | 10 | 10 | 10 | 10 | 10 | 10 | 9 | 10 | 10 | 10 | 11 | 10 | 9 | 60 | 10 | 10 | 10 |
| 23 | 9 | 10 | 10 | 10 | 10 | 9 | 10 | 10 | 10 | 10 | 10 | 10 | 10 | 11 | 10 | 10 | 10 | 10 | 10 | 11 | 10 | 10 | 60 | 10 | 10 |
| 24 | 10 | 10 | 10 | 10 | 10 | 10 | 10 | 10 | 10 | 10 | 9 | 10 | 10 | 10 | 10 | 10 | 10 | 11 | 10 | 10 | 10 | 10 | 10 | 60 | 10 |
| 25 | 10 | 10 | 10 | 10 | 10 | 11 | 10 | 9 | 10 | 10 | 10 | 10 | 10 | 10 | 9 | 10 | 11 | 10 | 10 | 10 | 10 | 10 | 10 | 10 | 60 |
| Mean = | 10 | ||||||||||||||||||||||||
| S.D. = | 0.497 | ||||||||||||||||||||||||
Appendix B. Results of the Hierarchical Bayesian Mixed Logit Model for BWS Data
| Total respondents | 459 | ||
| Total Best Choices | 4590 | ||
| Total Worst Choices | 4590 | ||
| Root Likelihood statistics (model fit) | 0.58 | ||
| BWS Statements | Rank a | Avg. Imprt. Scores b | [95% C.I. Lower, Upper] |
| 1. I feel assured that the Taiwanese institutions do a good job in adequately protecting consumers. | 12 | 4.80 | [4.50–5.10] |
| 2. I feel assured that the Chinese institutions do a good job in adequately protecting consumers. | 24 | 0.08 | [0.06–0.11] |
| 3. I feel assured that the Japanese institutions do a good job in adequately protecting consumers. | 10 | 5.43 | [5.18–5.69] |
| 4. I generally like to consume conventional red sweet peppers produced in Taiwan | 14 | 4.26 | [4.01–4.51] |
| 5. I generally like to consume conventional red sweet peppers produced in China. | 25 | 0.05 | [0.03–0.07] |
| 6. I generally like to consume conventional red sweet peppers produced in Japan. | 18 | 1.98 | [1.84–2.11] |
| 7. I generally like to consume organic red sweet peppers produced in Taiwan. | 4 | 7.30 | [7.09–7.52] |
| 8. I generally like to consume organic red sweet peppers produced in China. | 22 | 0.33 | [0.24–0.42] |
| 9. I generally like to consume organic red sweet peppers produced in Japan. | 13 | 4.68 | [4.38–4.98] |
| 10. Taiwanese organic red sweet peppers are trustworthy. | 2 | 7.73 | [7.52–7.93] |
| 11. Chinese organic red sweet peppers are trustworthy. | 21 | 0.49 | [0.37–0.61] |
| 12. Japanese organic red sweet peppers are trustworthy. | 7 | 5.96 | [5.67–6.24] |
| 13. I feel sure that organic red sweet peppers contain higher vitamin C and anti-cancer substances than conventional ones. | 16 | 3.24 | [2.98–3.51] |
| 14. I feel sure that organic red sweet peppers contain the same vitamin C and anti-cancer substances as conventional ones. | 15 | 3.53 | [3.23–3.83] |
| 15. With purchasing organic red sweet peppers I help preserve the environment and natural resources. | 11 | 5.29 | [5.01–5.57] |
| 16. There are no differences between buying organic red sweet peppers or conventional ones with respect to preserving the environment and natural resources. | 17 | 2.32 | [2.09–2.54] |
| 17. It is more likely that I buy Taiwanese red sweet peppers if information on chemical residue testing is provided. | 1 | 8.42 | [8.21–8.62] |
| 18. It is more likely that I buy Chinese red sweet peppers if information on chemical residue testing is provided. | 19 | 0.75 | [0–0.92] |
| 19. It is more likely that I buy Japanese red sweet peppers if information on chemical residue testing is provided. | 5 | 7.27 | [7–7.48] |
| 20. It is more likely that I buy Taiwanese red sweet peppers if they are on special offer. | 6 | 6.52 | [6–6.84] |
| 21. It is more likely that I buy Chinese red sweet peppers if they are on special offer. | 23 | 0.29 | [0–0.39] |
| 22. It is more likely that I buy Japanese red sweet peppers if they are on special offer. | 8 | 5.78 | [5–6.08] |
| 23. Taiwanese organic red sweet peppers have good value for money. | 3 | 7.39 | [7–7.61] |
| 24. Chinese organic red sweet peppers have good value for money. | 20 | 0.50 | [0.37–0.64] |
| 25. Japanese organic red sweet peppers have good value for money. | 9 | 5.61 | [5–5.92] |
References
- Peng, G.J.; Chang, M.H.; Fang, M.; Liao, C.D.; Tsai, C.F.; Tseng, S.H.; Kao, Y.-M.; Chou, H.-K.; Cheng, H.F. Incidents of major food adulteration in Taiwan between 2011 and 2015. Food Control 2017, 72, 145–152. [Google Scholar] [CrossRef]
- Cheng, W.-C.; Kuo, C.-W.; Chi, T.-Y.; Lin, L.-C.; Lee, C.-H.; Feng, R.-L.; Tsai, S.J. Investigation on the trend of food-borne disease outbreaks in Taiwan (1991–2010). J. Food Drug Anal. 2013, 21, 261–267. [Google Scholar] [CrossRef]
- Chern, W.S.; Hong, J.-P.; Liu, K.E. Comparison of the Vickrey second-price and random nth-price auctions for analyzing country of origin labeling in Taiwan. Acad. Econ. Pap. 2013, 41, 215–254. [Google Scholar]
- Liu, C.Y. Institutional Isomorphism and Food Fraud: A Longitudinal Study of the Mislabeling of Rice in Taiwan. J. Agric. Environ. Ethics 2016, 29, 607–630. [Google Scholar] [CrossRef]
- Yang, Y.-T. The development of Taiwan’s healthy agriculture industry. Agric. Biotechnol. Ind. Q. 2013, 32, 1–6. [Google Scholar]
- Epstein, L. Fifty years since silent spring. Ann. Rev. Phytopathol. 2014, 52, 377–402. [Google Scholar] [CrossRef]
- Yen, T.H.; Lin-Tan, D.T.; Lin, J.L. Food safety involving ingestion of foods and beverages prepared with phthalate-plasticizer-containing clouding agents. J. Formos. Med. Assoc. 2011, 110, 671–684. [Google Scholar] [CrossRef]
- Kang, J.J.; Chu, S.F.; Wu, Z.Z.; Chou, S.W.; Tsai, S.J.; Chiu, W.T. Crisis management turns Taiwan’s plasticizer nightmare into progressive policy. J. Formos. Med. Assoc. 2012, 111, 409–411. [Google Scholar] [CrossRef]
- Chern, W.S.; Chang, C.Y. Benefit evaluation of the country of origin labeling in Taiwan: Results from an auction experiment. Food Policy 2012, 37, 511–519. [Google Scholar] [CrossRef]
- Teng, C.C.; Wang, Y.M. Decisional factors driving organic food consumption: Generation of consumer purchase intentions. Br. Food J. 2015, 117, 1066–1081. [Google Scholar] [CrossRef]
- Tonkin, E.; Coveney, J.; Meyer, S.B.; Wilson, A.M.; Webb, T. Managing uncertainty about food risks—Consumer use of food labelling. Appetite 2016, 107, 242–252. [Google Scholar] [CrossRef] [PubMed]
- Grunert, K.G. Food quality and safety: Consumer perception and demand. Eur. Rev. Agric. Econ. 2005, 32, 369–391. [Google Scholar] [CrossRef]
- Vandeplas, A.; Minten, B. Food quality in domestic markets of developing economies: A comparative study of two countries. Agric. Econ. 2015, 46, 617–628. [Google Scholar] [CrossRef]
- Tung, S.J.; Shih, C.C.; Wei, S.; Chen, Y.H. Attitudinal inconsistency toward organic food in relation to purchasing intention and behavior: An illustration of Taiwan consumers. Br. Food J. 2012, 114, 997–1015. [Google Scholar] [CrossRef]
- Bravo, C.P.; Cordts, A.; Schulze, B.; Spiller, A. Assessing determinants of organic food consumption using data from the German National Nutrition Survey II. Food Qual. Prefer. 2013, 28, 60–70. [Google Scholar] [CrossRef]
- Moser, A.K. Consumers’ purchasing decisions regarding environmentally friendly products: An empirical analysis of German consumers. J. Retail. Consum. Serv. 2016, 31, 389–397. [Google Scholar] [CrossRef]
- Janssen, D.; Langen, N. The bunch of sustainability labels–Do consumers differentiate? J. Clean. Prod. 2017, 143, 1233–1245. [Google Scholar] [CrossRef]
- Klöckner, H.; Langen, N.; Hartmann, M. COO labeling as a tool for pepper differentiation in Germany: Insights into the taste perception of organic food shoppers. Br. Food J. 2013, 115, 1149–1168. [Google Scholar] [CrossRef]
- Vabø, M.; Hansen, H.; Hansen, K.V.; Kraggerud, H. Ethnocentrism and domestic food choice: Insights from an affluent protectionist market. J. Food Prod. Mark. 2017, 23, 570–590. [Google Scholar] [CrossRef]
- Roos, G.M.; Hansen, K.V.; Skuland, A.V. Consumers, Norwegian food and belonging: A qualitative study. Br. Food J. 2016, 118, 2359–2371. [Google Scholar] [CrossRef]
- Aprile, M.C.; Caputo, V.; Nayga, R.M., Jr. Consumers’ valuation of food quality labels: The case of the European geographic indication and organic farming labels. Int. J. Consum. Stud. 2012, 36, 158–165. [Google Scholar] [CrossRef]
- Castaldo, S.; Perrini, F.; Misani, N.; Tencati, A. The missing link between corporate social responsibility and consumer trust: The case of fair trade products. J. Bus. Ethics 2009, 84, 1–15. [Google Scholar] [CrossRef]
- Hall, C.; Osses, F. A review to inform understanding of the use of food safety messages on food labels. Int. J. Consum. Stud. 2013, 37, 422–432. [Google Scholar] [CrossRef]
- Brom, F.W. Food, consumer concerns, and trust: Food ethics for a globalizing market. J. Agric. Environ. Ethics 2000, 12, 127–139. [Google Scholar] [CrossRef]
- Einsiedel, E.F. GM food labeling: The interplay of information, social values, and institutional trust. Sci. Commun. 2002, 24, 209–221. [Google Scholar] [CrossRef]
- De Jonge, J.; Van Trijp, J.C.M.; van der Lans, I.A.; Renes, R.J.; Frewer, L.J. How trust in institutions and organizations builds general consumer confidence in the safety of food: A decomposition of effects. Appetite 2008, 51, 311–317. [Google Scholar] [CrossRef]
- Qiu, H.; Huang, J.; Pray, C.; Rozelle, S. Consumers’ trust in government and their attitudes towards genetically modified food: Empirical evidence from China. J. Chin. Econ. Bus. Stud. 2012, 10, 67–87. [Google Scholar] [CrossRef][Green Version]
- Chen, W. The effects of different types of trust on consumer perceptions of food safety: An empirical study of consumers in Beijing Municipality, China. China Agric. Econ. Rev. 2013, 5, 43–65. [Google Scholar] [CrossRef]
- Lang, J.T. Elements of public trust in the American food system: Experts, organizations, and genetically modified food. Food Policy 2013, 41, 145–154. [Google Scholar] [CrossRef]
- Omari, R.; Ruivenkamp, G.T.; Tetteh, E.K. Consumers’ trust in government institutions and their perception and concern about safety and healthiness of fast food. J. Trust Res. 2017, 7, 170–186. [Google Scholar] [CrossRef]
- Frewer, L.J.; Scholderer, J.; Bredahl, L. Communicating about the risks and benefits of genetically modified foods: The mediating role of trust. Risk Anal. 2003, 23, 1117–1133. [Google Scholar] [CrossRef] [PubMed]
- Frewer, L.J. Risk perception, communication and food safety. In Strategies for Achieving Food Security in Central Asia; Alpas, H., Smith, M., Kulmyrzaev, A., Eds.; Springer: Dordrecht, The Netherlands, 2012; pp. 123–131. [Google Scholar]
- De Jonge, J.; Van Trijp, H.; Renes, R.J.; Frewer, L.J. Consumer confidence in the safety of food and newspaper coverage of food safety issues: A longitudinal perspective. Risk Anal. 2010, 30, 125–142. [Google Scholar] [CrossRef] [PubMed]
- Siegrist, M.; Cvetkovich, G. Perception of hazards: The role of social trust and knowledge. Risk Anal. 2000, 20, 713–720. [Google Scholar] [CrossRef] [PubMed]
- Siegrist, M.; Keller, C.; Kiers, H.A. Lay people’s perception of food hazards: Comparing aggregated data and individual data. Appetite 2006, 47, 324–332. [Google Scholar] [CrossRef]
- Henson, S. Demand-side constraints on the introduction of new food technologies: The case of food irradiation. Food Policy 1995, 20, 111–127. [Google Scholar] [CrossRef]
- Wandel, M.; Fagerli, R.A. Consumer concern about food related health risks and their trust in experts. Ecol. Food Nutr. 2001, 40, 253–283. [Google Scholar] [CrossRef]
- Sapp, S.G.; Downing-Matibag, T. Consumer acceptance of food irradiation: A test of the recreancy theorem. Int. J. Consum. Stud. 2009, 33, 417–424. [Google Scholar] [CrossRef]
- Bruhn, C.M. United States consumer choice of irradiated food. In Irradiation for Food Safety and Quality; Loaharanu, P., Thomas, P., Eds.; Technomic Publishing Company: Lancaster, PA, USA, 2001; pp. 169–173. [Google Scholar]
- Siegrist, M.; Cousin, M.E.; Kastenholz, H.; Wiek, A. Public acceptance of nanotechnology foods and food packaging: The influence of affect and trust. Appetite 2007, 49, 459–466. [Google Scholar] [CrossRef]
- Siegrist, M.; Stampfli, N.; Kastenholz, H.; Keller, C. Perceived risks and perceived benefits of different nanotechnology foods and nanotechnology food packaging. Appetite 2008, 51, 283–290. [Google Scholar] [CrossRef]
- Siegrist, M.; Stampfli, N.; Kastenholz, H. Acceptance of nanotechnology foods: A conjoint study examining consumers’ willingness to buy. Br. Food J. 2009, 111, 660–668. [Google Scholar] [CrossRef]
- Roosen, J.; Bieberstein, A.; Blanchemanche, S.; Goddard, E.; Marette, S.; Vandermoere, F. Trust and willingness to pay for nanotechnology food. Food Policy 2015, 52, 75–83. [Google Scholar] [CrossRef]
- Poortinga, W.; Pidgeon, N.F. Trust in risk regulation: Cause or consequence of the acceptability of GM food? Risk Anal. 2005, 25, 199–209. [Google Scholar] [CrossRef] [PubMed]
- Fandos Herrera, C.; Flavián Blanco, C. Consequences of consumer trust in PDO food products: The role of familiarity. J. Prod. Brand Manag. 2011, 20, 282–296. [Google Scholar] [CrossRef]
- Lassoued, R.; Hobbs, J.E. Consumer confidence in credence attributes: The role of brand trust. Food Policy 2015, 52, 99–107. [Google Scholar] [CrossRef]
- Lassoued, R.; Hobbs, J.E.; Micheels, E.T.; Zhang, D.D. Consumer trust in chicken brands: A structural equation model. Can. J. Agric. Econ. 2015, 63, 621–647. [Google Scholar] [CrossRef]
- Taylor, A.W.; Coveney, J.; Ward, P.R.; Henderson, J.; Meyer, S.B.; Pilkington, R.; Gill, T.K. Fruit and vegetable consumption–the influence of aspects associated with trust in food and safety and quality of food. Public Health Nutr. 2012, 15, 208–217. [Google Scholar] [CrossRef]
- Viktoria Rampl, L.; Eberhardt, T.; Schütte, R.; Kenning, P. Consumer trust in food retailers: Conceptual framework and empirical evidence. Int. J. Retail Distrib. Manag. 2012, 40, 254–272. [Google Scholar] [CrossRef]
- Banwell, C.; Kelly, M.; Dixon, J.; Seubsman, S.A.; Sleigh, A. Trust: The missing dimension in the food retail transition in Thailand. Anthropol. Forum 2016, 26, 138–154. [Google Scholar] [CrossRef]
- Xie, Y.; Batra, R.; Peng, S. An extended model of preference formation between global and local brands: The roles of identity expressiveness, trust, and affect. J. Int. Mark. 2015, 23, 50–71. [Google Scholar] [CrossRef]
- Chinomona, R.; Mahlangu, D.; Pooe, D. Brand service quality, satisfaction, trust and preference as predictors of consumer brand loyalty in the retailing industry. Mediterr. J. Soc. Sci. 2013, 4. [Google Scholar] [CrossRef]
- Becker, M.; Hanley, M. The mediating effects of privacy and preference management on trust and consumer participation in a mobile marketing initiative: A proposed conceptual model. In Trust and New Technologies: Marketing and Management on the Internet and Mobile Media; Kautonen, T., Karjaluoto, H., Eds.; Edward Elgar Publishing Limited: Cheltenham, UK, 2008; pp. 127–145. [Google Scholar]
- Hariyanto, E. The Influence of Brand Experience through Brand Trust and Brand Satisfaction toward Brand Loyalty Consumer at Carl’s Jr Surabaya. Petra Bus. Manag. Rev. 2018, 4, 20–29. [Google Scholar]
- Earle, T.C. Trust in risk management: A model-based review of empirical research. Risk Anal. 2010, 30, 541–574. [Google Scholar] [CrossRef] [PubMed]
- Jin, N.; Line, N.D.; Merkebu, J. The impact of brand prestige on trust, perceived risk, satisfaction, and loyalty in upscale restaurants. J. Hosp. Mark. Manag. 2016, 25, 523–546. [Google Scholar] [CrossRef]
- Woolley, K.; Fishbach, A. A recipe for friendship: Similar food consumption promotes trust and cooperation. J. Consum. Psychol. 2017, 27, 1–10. [Google Scholar] [CrossRef]
- Yim, D.S. Trust of Agricultural Food and Affective Commitment: A Comparison of Levels of Consumer’s Income. J. Korean Soc. Int. Agric. 2012, 24, 293–298. [Google Scholar]
- Mayer, R.C.; Davis, J.H.; Schoorman, F.D. An integrative model of organizational trust. Acad. Manag. Rev. 1995, 20, 709–734. [Google Scholar] [CrossRef]
- McKnight, D.H.; Chervany, N.L. Trust and distrust definitions: One bite at a time. In Trust in Cyber-Societies; Falcone, R., Singh, M., Tan, Y.-H., Eds.; Springer: Berlin, Germany, 2001; pp. 27–54. [Google Scholar]
- Kożuch, B.; Magala, S.J.; Paliszkiewicz, J. Managing Public Trust; Springer: Schoonhoven, The Netherlands, 2018. [Google Scholar]
- Siegrist, M.; Gutscher, H.; Earle, T.C. Perception of risk: The influence of general trust, and general confidence. J. Risk Res. 2005, 8, 145–156. [Google Scholar] [CrossRef]
- Ding, Y.; Veeman, M.M.; Adamowicz, W.L. The impact of generalized trust and trust in the food system on choices of a functional GM food. Agribusiness 2012, 28, 54–66. [Google Scholar] [CrossRef]
- McKnight, D.H.; Cummings, L.L.; Chervany, N.L. Initial trust formation in new organizational relationships. Acad. Manag. Rev. 1998, 23, 473–490. [Google Scholar] [CrossRef]
- Love, B.; Mackert, M.; Silk, K. Consumer trust in information sources: Testing an interdisciplinary model. Sage Open 2013, 3. [Google Scholar] [CrossRef]
- Tsai, M.T.; Chin, C.W.; Chen, C.C. The effect of trust belief and salesperson’s expertise on consumer’s intention to purchase nutraceuticals: Applying the theory of reasoned action. Soc. Behav. Personal. 2010, 38, 273–287. [Google Scholar] [CrossRef]
- Zhang, J.; Liu, H.; Sayogo, D.S.; Picazo-Vela, S.; Luna-Reyes, L. Strengthening institutional-based trust for sustainable consumption: Lessons for smart disclosure. Gov. Inf. Q. 2016, 33, 552–561. [Google Scholar] [CrossRef]
- McKnight, D.H.; Choudhury, V.; Kacmar, C. Developing and validating trust measures for e-commerce: An integrative typology. Inf. Syst. Res. 2002, 13, 334–359. [Google Scholar] [CrossRef]
- Lam, T.; Heales, J.; Hartley, N.; Hodkinson, C. Information Transparency Matters in Relation to Consumer Trust in Food Safety. Presented at the Australasian Conference on Information Systems, Sydney, Australia, 3–5 December 2018. [Google Scholar]
- Zhang, X.; Zhang, Q. Online trust forming mechanism: Approaches and an integrated model. In Proceedings of the 7th International Conference on Electronic Commerce, Xi’an, China, 15–17 August 2005; pp. 201–209. [Google Scholar]
- McKnight, D.H.; Chervany, N.L. What trust means in e-commerce customer relationships: An interdisciplinary conceptual typology. Int. J. Electron. Commun. 2001, 6, 35–59. [Google Scholar] [CrossRef]
- Bachmann, R.; Inkpen, A.C. Understanding institutional-based trust building processes in inter-organizational relationships. Organ. Stud. 2011, 32, 281–301. [Google Scholar] [CrossRef]
- Morrow, J.L., Jr.; Hansen, M.H.; Pearson, A.W. The cognitive and affective antecedents of general trust within cooperative organizations. J. Manag. Issues 2014, 16, 48–64. [Google Scholar]
- Benson, T.; Lavelle, F.; Spence, M.; Elliott, C.T.; Dean, M. The development and validation of a toolkit to measure consumer trust in food. Food Control 2019, 110, 106988. [Google Scholar] [CrossRef]
- Couch, L.L.; Jones, W.H. Measuring levels of trust. J. Res. Personal. 1997, 31, 319–336. [Google Scholar] [CrossRef]
- Moorman, C.; Deshpande, R.; Zaltman, G. Factors Affecting Trust in Market Research Relationships. J. Mark. 1993, 57, 81–101. [Google Scholar] [CrossRef]
- Yan, Z. Security via trusted communications. In Handbook of Information and Communication Security; Stavroulakis, P., Stamp, M., Eds.; Springer: Berlin, Germany, 2010; pp. 719–746. [Google Scholar]
- Feldmann, C.; Hamm, U. Consumers’ perceptions and preferences for local food: A review. Food Qual. Prefer. 2015, 40, 152–164. [Google Scholar] [CrossRef]
- Mørkbak, M.R.; Christensen, T.; Gyrd-Hansen, D. Valuation of food safety in meat—A review of stated preference studies. Food Econ. Acta Agric. Scand. C 2008, 5, 63–74. [Google Scholar]
- Moser, R.; Raffaelli, R.; Thilmany-McFadden, D. Consumer preferences for fruit and vegetables with credence-based attributes: A review. Int. Food Agribus. Manag. 2011, 14, 121–142. [Google Scholar]
- Tonkin, E.; Wilson, A.M.; Coveney, J.; Webb, T.; Meyer, S.B. Trust in and through labelling—A systematic review and critique. Br. Food J. 2015, 117, 318–338. [Google Scholar] [CrossRef]
- Kim, R. Japanese consumers’ use of extrinsic and intrinsic cues to mitigate risky food choices. Int. J. Consum. Stud. 2008, 32, 49–58. [Google Scholar] [CrossRef]
- Zheng, Y.; Li, X.; Peterson, H.H. In pursuit of safe foods: Chinese preferences for soybean attributes in soymilk. Agribusiness 2013, 29, 377–391. [Google Scholar] [CrossRef]
- Charity, N.E.J. Economic Analysis of Consumers’ Awareness and Willingness to Pay for Geographical Indicators and Other Quality Attributes of Honey in Kenya. Master’s Thesis, University of Nairobi, Nairobi, Kenya, 2016. [Google Scholar]
- Bolduc, D.; Alvarez-Daziano, R. On estimation of hybrid choice models. In Choice Modelling: The State-of-the-Art and the State-of-Practice: Proceedings from the Inaugural International Choice Modelling Conference; Hess, S., Daly, A., Eds.; Emerald Group Publishing Limited: Bingley, UK, 2010; pp. 259–287. [Google Scholar]
- Abou-Zeid, M.; Ben-Akiva, M. Hybrid choice model. In Handbook of Choice Modelling; Hess, S., Daly, A., Eds.; Edward Elgar Publishing Limited: Cheltenham, UK, 2014; pp. 283–412. [Google Scholar]
- Hensher, D.A.; Rose, J.M.; Greene, W.H. Applied Choice Analysis, 2nd ed.; Cambridge University Press: Cambridge, UK, 2015. [Google Scholar]
- Langen, N. Are ethical consumption and charitable giving substitutes or not? Insights into consumers’ coffee choice. Food Qual. Prefer. 2011, 22, 412–421. [Google Scholar] [CrossRef]
- Yangui, A.; Costa-Font, M.; Gil, J.M. The effect of personality traits on consumers’ preferences for extra virgin olive oil. Food Qual. Prefer. 2016, 51, 27–38. [Google Scholar] [CrossRef]
- O’Neill, V.; Hess, S.; Campbell, D. A question of taste: Recognising the role of latent preferences and attitudes in analysing food choices. Food Qual. Prefer. 2014, 32, 299–310. [Google Scholar] [CrossRef]
- Song, F.; Hess, S.; Dekker, T. Comparing and Combining Best-Worst Scaling and Stated Choice Data to Understand Attribute Importance in Mode-Choice Behavior. In Proceedings of the Transportation Research Board 97th Annual Meeting, Washington, DC, USA, 7–11 January 2018. [Google Scholar]
- Kikulwe, E.M.; Birol, E.; Wesseler, J.; Falck-Zepeda, J. A latent class approach to investigating demand for genetically modified banana in Uganda. Agric. Econ. 2011, 42, 547–560. [Google Scholar] [CrossRef]
- Owusu-Sekyere, E.; Owusu, V.; Akwetey, W.Y.; Jordaan, H.; Ogundeji, A.A. Economic welfare implications of policy changes regarding food safety and quality in Ghana. Afr. J. Agric. Resour. Econ. 2018, 13, 357–371. [Google Scholar]
- Thurstone, L.L. A law of comparative judgement. Psychol. Rev. 1927, 34, 273–286. [Google Scholar] [CrossRef]
- McFadden, D. Conditional logit analysis of qualitative choice behavior. In Frontiers in Econometrics; Zarembka, P., Ed.; Academic Press: New York, NY, USA, 1973; pp. 105–142. [Google Scholar]
- Batinic, B.; Reips, U.D.; Bosnjak, M. Online Social Sciences; Hogrefe & Huber: Seattle, WA, USA, 2002. [Google Scholar]
- Bethlehem, J.; Biffignandi, S. Handbook of Web Surveys; John Wiley & Sons: Hoboken, NJ, USA, 2011. [Google Scholar]
- Lancaster, K.J. A new approach to consumer theory. J. Political Econ. 1966, 74, 132–157. [Google Scholar] [CrossRef]
- Rachlin, H. Economics and behavioral psychology. In Limits to Action: The Allocation of Individual Behavior; Academic Press: New York, NY, USA, 1980; pp. 205–236. [Google Scholar]
- McFadden, D. The choice theory approach to market research. Mark. Sci. 1986, 5, 275–297. [Google Scholar] [CrossRef]
- The Committee of Agricultural Extension. Sweet peppers and agricultural facilities. In Review of Agricultural Extension Science, 68; National Ilan University: Ilan, Taiwan, 2014. [Google Scholar]
- Taichung District Agricultural Research and Extension Station. Sweet Peppers Production and Cultivation Technology; Council of Agriculture Executive Yuan: Taipei, Taiwan, 2016. Available online: http://www.tdais.gov.tw (accessed on 4 April 2016).
- Dekhili, S.; Sirieix, L.; Cohen, E. How consumers choose olive oil: The importance of origin cues. Food Qual. Prefer. 2011, 22, 757–762. [Google Scholar] [CrossRef]
- Fernqvist, F.; Ekelund Axelson, L. Consumer attitudes towards origin and organic-the role of credence labels on consumers’ liking of tomatoes. Eur. J. Hortic. Sci. 2013, 78, 184–190. [Google Scholar]
- Choice Metrics. Ngene 1.1.1 User Manual & Reference Guide; Choice Metrics, Ltd.: Sydney, Australia, 2012. [Google Scholar]
- Zwerina, K.; Huber, J.; Kuhfeld, W.F. A General Method for Constructing Efficient Choice Designs; Fuqua School of Business, Duke University: Durham, NC, USA, 1996. [Google Scholar]
- Carlsson, F.; Martinsson, P. Design techniques for stated preference methods in health economics. Health Econ. 2003, 12, 281–294. [Google Scholar] [CrossRef]
- Rose, J.M.; Bliemer, M.C. Constructing Efficient Choice Experiments; ITLS Working Paper, ITLS-WP-05-07; Institute of Transport and Logistic Studies: Sydney, Australia, 2005. [Google Scholar]
- Scarpa, R.; Campbell, D.; Hutchinson, W.G. Benefit estimates for landscape improvements: Sequential Bayesian design and respondents’ rationality in a choice experiment. Land Econ. 2007, 83, 617–634. [Google Scholar] [CrossRef]
- Train, K.E. Discrete Choice Methods with Simulation, 2nd ed.; Cambridge University Press: New York, NY, USA, 2009. [Google Scholar]
- Haughton, D.; Legrand, P.; Woolford, S. Review of three latent class cluster analysis packages: Latent Gold, poLCA, and MCLUST. Am. Stat. 2009, 63, 81–91. [Google Scholar] [CrossRef]
- Boxall, P.C.; Adamowicz, W.L. Understanding heterogeneous preferences in random utility models: A latent class approach. Environ. Resour. Econ. 2002, 23, 421–446. [Google Scholar] [CrossRef]
- Swait, J. A structural equation model of latent segmentation and product choice for cross-sectional revealed preference choice data. J. Retail. Consum. Serv. 1994, 1, 77–89. [Google Scholar] [CrossRef]
- McCutcheon, A.L. Latent Class Analysis; Sage Publications: Cheltenham, UK, 1987. [Google Scholar]
- McCutcheon, A.L. Basic concepts and procedures in single-and multiple-group latent class analysis. In Applied Latent Class Analysis; McCutcheon, A.L., Ed.; Cambridge University Press: Cambridge, UK, 2002; pp. 56–88. [Google Scholar]
- Lusk, J.L.; Roosen, J.; Fox, J.A. Demand for beef from cattle administered growth hormones or fed genetically modified corn: A comparison of consumers in France, Germany, the United Kingdom, and the United States. Am. J. Agric. Econ. 2003, 85, 16–29. [Google Scholar] [CrossRef]
- Bech, M.; Gyrd-Hansen, D. Effects coding in discrete choice experiments. Health Econ. 2005, 14, 1079–1083. [Google Scholar] [CrossRef] [PubMed]
- Ortega, D.L.; Wang, H.H.; Wu, L.; Olynk, N.J. Modeling heterogeneity in consumer preferences for select food safety attributes in China. Food Policy 2011, 36, 318–324. [Google Scholar] [CrossRef]
- Hole, A.R. A comparison of approaches to estimating confidence intervals for willingness to pay measures. Health Econ. 2007, 16, 827–840. [Google Scholar] [CrossRef]
- Hein, K.A.; Jaeger, S.R.; Carr, B.T.; Delahunty, C.M. Comparison of five common acceptance and preference methods. Food Qual. Prefer. 2008, 19, 651–661. [Google Scholar] [CrossRef]
- Flynn, T.N.; Marley, A.A.J. Best-worst scaling: Theory and methods. In Handbook of Choice Modelling; Hess, S., Daly, A., Eds.; Edward Elgar Publishing: Cheltenham, UK, 2004; pp. 178–201. [Google Scholar]
- Finn, A.; Louviere, J.J. Determining the appropriate response to evidence of public concern: The case of food safety. J. Public Policy Mark. 1992, 11, 12–25. [Google Scholar] [CrossRef]
- Cohen, S. Maximum difference scaling: Improved measures of importance and preference for segmentation. In Sawtooth Software Conference Proceedings; Sawtooth Software, Inc.: Provo, UT, USA, 2003; Volume 530, pp. 61–74. [Google Scholar]
- Louviere, J.J.; Flynn, T.N.; Marley, A.A.J. Best-Worst Scaling: Theory, Methods and Applications; Cambridge University Press: Cambridge, UK, 2015. [Google Scholar]
- Cohen, S.H.; Markowitz, P. Renewing market segmentation: Some new tools to correct old problems. In ESOMAR 2002 Congress Proceedings; ESOMAR: Amsterdam, The Netherlands, 2002; pp. 595–612. [Google Scholar]
- Louviere, J.J.; Woodworth, G.G. Best-Worst Analysis; Working Paper; Department of Marketing and Economic Analysis, University of Alberta: Edmonton, AB, Canada, 1990. [Google Scholar]
- Smith, N.F.; Street, D.J. The use of balanced incomplete block designs in designing randomized response surveys. Aust. N. Z. J. Stat. 2003, 45, 181–194. [Google Scholar] [CrossRef]
- Sawtooth Software. The MaxDiff v6.0 Technical Paper; Sawtooth Software Inc.: Provo, UT, USA, 2007. [Google Scholar]
- Lagerkvist, C.J.; Okello, J.; Karanja, N. Anchored vs. relative best–worst scaling and latent class vs. hierarchical Bayesian analysis of best–worst choice data: Investigating the importance of food quality attributes in a developing country. Food Qual. Prefer. 2012, 25, 29–40. [Google Scholar] [CrossRef]
- De-Magistris, T.; Royo, A.G. Wine consumers preferences in Spain: An analysis using the best-worst scaling approach. Span. J. Agric. Res. 2014, 12, 529–541. [Google Scholar] [CrossRef]
- Campbell, D.; Erdem, S. Position bias in best-worst scaling surveys: A case study on trust in institutions. Am. J. Agric. Econ. 2015, 97, 526–545. [Google Scholar] [CrossRef]
- Claybaugh, C.C.; Haseman, W.D. Understanding professional connections in LINKEDIN—A question of trust. J. Comput. Inf. Syst. 2013, 54, 94–105. [Google Scholar] [CrossRef]
- Hämäläinen, A. Trust Antecedents in Social Networking Services. Master’s Thesis, School of Business, Aalto University, Espoo, Finland, 2015. [Google Scholar]
- Kivijärvi, H.; Leppänen, A.; Hallikainen, P. Antecedents of Information Technology Trust and the Effect of Trust on Perceived Performance Improvement. Int. J. Soc. Org. 2013, 3, 17–32. [Google Scholar] [CrossRef][Green Version]
- Allenby, G.M.; Ginter, J.L. Using extremes to design products and segment markets. J. Mark. Res. 1995, 32, 392–403. [Google Scholar] [CrossRef]
- Lenk, P.J.; DeSarbo, W.S.; Green, P.E.; Young, M.R. Hierarchical Bayes conjoint analysis: Recovery of partworth heterogeneity from reduced experimental designs. Mark. Sci. 1996, 15, 173–191. [Google Scholar] [CrossRef]
- Akinc, D.; Vandebroek, M. Comparing the performances of maximum simulated likelihood and hierarchical Bayesian estimation for mixed logit models. In Proceedings of the International Choice Modelling Conference 2017, Cape Town, South Africa, 3–5 April 2017. [Google Scholar]
- Lusk, J.L.; Briggeman, B.C. Food values. Am. J. Agric. Econ. 2009, 91, 184–196. [Google Scholar] [CrossRef]
- Hansson, H.; Lagerkvist, C.J. Dairy farmers’ use and non-use values in animal welfare: Determining the empirical content and structure with anchored best-worst scaling. J. Dairy Sci. 2016, 99, 579–592. [Google Scholar] [CrossRef]
- Rodríguez-Delgado, M.Á.; González-Hernández, G.; Conde-González, J.E.; Pérez-Trujillo, J.P. Principal component analysis of the polyphenol content in young red wines. Food Chem. 2002, 78, 523–532. [Google Scholar] [CrossRef]
- Costello, A.B.; Osborne, J.W. Best practices in exploratory factor analysis: Four recommendations for getting the most from your analysis. Pract. Assess. Res. Eval. 2005, 10, 1–9. [Google Scholar]
- Horn, J.L. A rationale and test for the number of factors in factor analysis. Psychometrika 1965, 30, 179–185. [Google Scholar] [CrossRef]
- Fabrigar, L.R.; Wegener, D.T.; MacCallum, R.C.; Strahan, E.J. Evaluating the use of exploratory factor analysis in psychological research. Psychol. Methods 1999, 4, 272–299. [Google Scholar] [CrossRef]
- Hayton, J.C.; Allen, D.G.; Scarpello, V. Factor retention decisions in exploratory factor analysis: A tutorial on parallel analysis. Organ. Res. Methods 2004, 7, 191–205. [Google Scholar] [CrossRef]
- Dinno, A. Implementing Horn’s parallel analysis for principal component analysis and factor analysis. Stata J. 2009, 9, 291–298. [Google Scholar] [CrossRef]
- Timmerman, M.E.; Lorenzo-Seva, U. Dimensionality assessment of ordered polytomous items with parallel analysis. Psychol. Methods 2011, 16, 209. [Google Scholar] [CrossRef] [PubMed]
- Orme, B. Sample size issues for conjoint analysis. In Getting Started with Conjoint Analysis: Strategies for Product Design and Pricing Research, 2nd ed.; Research Publishers LLC: Madison, WI, USA, 2010. [Google Scholar]
- Lu Hsu, J.; Lin, Y.T. Consumption and attribute perception of fluid milk in Taiwan. Nutr. Food Sci. 2006, 36, 177–182. [Google Scholar] [CrossRef]
- Coltman, T.R.; Devinney, T.M.; Midgley, D.F. E-Business strategy and firm performance: A latent class assessment of the drivers and impediments to success. J. Inf. Technol. 2007, 22, 87–101. [Google Scholar] [CrossRef]
- Hauser, J.R. Testing the accuracy, usefulness, and significance of probabilistic choice models: An information-theoretic approach. Oper. Res. 1978, 26, 406–421. [Google Scholar] [CrossRef]
- Ogawa, K. An approach to simultaneous estimation and segmentation in conjoint analysis. Mark. Sci. 1987, 6, 66–81. [Google Scholar] [CrossRef]
- Bozdogan, H. Model selection and Akaike’s information criterion (AIC): The general theory and its analytical extensions. Psychometrika 1987, 52, 345–370. [Google Scholar] [CrossRef]
- Schwarz, G. Estimating the dimension of a model. Ann. Stat. 1978, 6, 461–464. [Google Scholar] [CrossRef]
- Hair, J.F.; Black, W.C.; Babin, B.J.; Anderson, R.E. Multivariate Data Analysis: Pearson New International Edition; Pearson Education Limited: London, UK, 2014. [Google Scholar]
- Huang, S. Nation-branding and transnational consumption: Japan-mania and the Korean wave in Taiwan. Media Cult. Soc. 2011, 33, 3–18. [Google Scholar] [CrossRef]
- Ma, J.; Wang, S.; Hao, W. Does cultural similarity matter? Extending the animosity model from a new perspective. J. Consum. Mark. 2012, 29, 319–332. [Google Scholar] [CrossRef]
- Becker, K. Positioning strategies against nations with perceived quality advantages. J. Transl. Manag. 2009, 14, 74–99. [Google Scholar] [CrossRef]
- Lim, K.H.; Hu, W.; Maynard, L.J.; Goddard, E. US consumers’ preference and willingness to pay for country-of-origin-labeled beef steak and food safety enhancements. Can. J. Agric. Econ. 2013, 61, 93–118. [Google Scholar] [CrossRef]
- Rahmawati, N.A.; Muflikhati, I. Effect of Consumer Ethnocentrism and Perceived Quality of Product on Buying Behavior of Domestic and Foreign Food Products: A Case Study in Pekanbaru, Riau, Indonesia. J. Consum. Sci. 2016, 1, 1–13. [Google Scholar] [CrossRef][Green Version]
- Grunert, K.G.; Sonntag, W.I.; Glanz-Chanos, V.; Forum, S. Consumer interest in environmental impact, safety, health and animal welfare aspects of modern pig production: Results of a cross-national choice experiment. Meat Sci. 2018, 137, 123–129. [Google Scholar] [CrossRef]
- Koistinen, L.; Pouta, E.; Heikkilä, J.; Forsman-Hugg, S.; Kotro, J.; Mäkelä, J.; Niva, M. The impact of fat content, production methods and carbon footprint information on consumer preferences for minced meat. Food Qual. Prefer. 2013, 29, 126–136. [Google Scholar] [CrossRef]
- Boncinelli, F.; Contini, C.; Romano, C.; Scozzafava, G.; Casini, L. Territory, environment, and healthiness in traditional food choices: Insights into consumer heterogeneity. Int. Food Agribus. Manag. Rev. 2017, 20, 143–157. [Google Scholar] [CrossRef]
- Apostolidis, C.; McLeay, F. Should we stop meating like this? Reducing meat consumption through substitution. Food Policy 2016, 65, 74–89. [Google Scholar] [CrossRef]
- Peschel, A.O.; Grebitus, C.; Steiner, B.; Veeman, M. How does consumer knowledge affect environmentally sustainable choices? Evidence from a cross-country latent class analysis of food labels. Appetite 2016, 106, 78–91. [Google Scholar] [CrossRef]
- Chen, M.F. Attitude toward organic foods among Taiwanese as related to health consciousness, environmental attitudes, and the mediating effects of a healthy lifestyle. Br. Food J. 2009, 111, 165–178. [Google Scholar] [CrossRef]
- Yiridoe, E.K.; Bonti-Ankomah, S.; Martin, R.C. Comparison of consumer perceptions and preference toward organic versus conventionally produced foods: A review and update of the literature. Renew. Agric. Food Syst. 2005, 20, 193–205. [Google Scholar] [CrossRef]
- Festinger, L. A Theory of Cognitive Dissonance; Stanford University Press: Stanford, CA, USA, 1957; Volume 2. [Google Scholar]
- Losch, M.E.; Cacioppo, J.T. Cognitive dissonance may enhance sympathetic tonus, but attitudes are changed to reduce negative affect rather than arousal. J. Exp. Soc. Psychol. 1990, 26, 289–304. [Google Scholar] [CrossRef]
- Hasimu, H.; Marchesini, S.; Canavari, M. A concept mapping study on organic food consumers in Shanghai, China. Appetite 2017, 108, 191–202. [Google Scholar] [CrossRef] [PubMed]
- Xie, B.; Wang, L.; Yang, H.; Wang, Y.; Zhang, M. Consumer perceptions and attitudes of organic food products in Eastern China. Br. Food J. 2015, 117, 1105–1121. [Google Scholar] [CrossRef]
- Liang, R.D. Predicting intentions to purchase organic food: The moderating effects of organic food prices. Br. Food J. 2016, 118, 183–199. [Google Scholar] [CrossRef]
- Jing, B.; Wen, Z. Finitely loyal customers, switchers, and equilibrium price promotion. J. Econ. Manag. Strategy 2008, 17, 683–707. [Google Scholar] [CrossRef]
- Koçaş, C.; Bohlmann, J.D. Segmented switchers and retailer pricing strategies. J. Mark. 2008, 72, 124–142. [Google Scholar] [CrossRef]
- Gao, Z.; Schroeder, T.C. Consumer responses to new food quality information: Are some consumers more sensitive than others? Agric. Econ. 2009, 40, 339–346. [Google Scholar] [CrossRef]


| Attributes | Levels |
|---|---|
| Country of origin |
|
| Production method |
|
| Chemical residue testing information |
|
| Price |
|
| Trust Constructs | Items Used in BWS Experiment | No. of Items | References |
|---|---|---|---|
|
| 3 | Adapted from the studies of [65,68,132]. |
|
| 2 | Adapted from the studies of [65,132]. |
| |||
|
| 2 | Adapted from the studies of [65,132]. |
| |||
|
| 3 | Adapted from the studies of [65,68]. |
|
| 3 | Adapted from the studies of [65,68]. |
|
| 3 | Adapted from the studies of [65,68]. |
|
| 3 | Adapted from the studies of [65]. |
|
| 3 | Adapted from the studies of [133,134]. |
|
| 3 |
| Respondents | Taiwanese Population a | ||
|---|---|---|---|
| Number of Respondents | 459 | ||
| Freq. | (%) | (%) | |
| Gender | |||
| Male | 128 | 27.9 | 49.9 |
| Female | 331 | 72.1 | 50.1 |
| Responsibility for household food shopping | |||
| Fully | 220 | 47.9 | |
| Partly | 239 | 52.1 | |
| Age | |||
| Up to 29 | 68 | 14.8 | 34.2 |
| 30–49 | 311 | 67.7 | 32.5 |
| 50 and over | 78 | 17.0 | 33.4 |
| Missing ¶ | 2 | 0.4 | |
| Marital status | |||
| Single | 147 | 32.0 | 34.67 |
| Married | 284 | 61.9 | 51.12 |
| Other (widowed/divorced) | 23 | 5.0 | 14.21 |
| Missing | 5 | 1.1 | |
| Having children (<18 years old) in a household (dummy coded: 1 = Yes; 0 = No) | 208 | 45.3 | |
| Education | |||
| Up to senior high school (12 years) | 95 | 20.7 | 58.2 |
| College (14 years) | 119 | 25.9 | 11.4 |
| University | 233 | 50.8 | 30.4 |
| Missing | 12 | 2.6 | |
| Avg. monthly net income of the household | |||
| Up to NT 60,000 | 179 | 39.0 | |
| NT 60,001–120,000 | 152 | 33.1 | |
| NT 120,001 and over | 56 | 12.2 | |
| Missing | 72 | 15.7 | |
| Participants | 459 | ||||
|---|---|---|---|---|---|
| Null Log-Likelihood | −3817.85 | ||||
| Groups | Log-Likelihood | Pct. Cert. | CAIC | Chi-Square | BIC |
| 2 | −2691.81 | 29.49 | 5517.43 | 2252.09 | 5502.43 |
| 3 | −2557.13 | 33.02 | 5319.43 | 2521.46 | 5296.43 |
| 4 | −2454.62 | 35.71 | 5185.87 | 2726.48 | 5154.78 |
| 5 | −2397.36 | 37.21 | 5142.64 | 2840.99 | 5103.64 |
| 6 | −2358.04 | 38.24 | 5135.36 | 2919.63 | 5088.36 |
| Null log-likelihood | −3817.85 | |||||||
| Restricted log-likelihood | −2454.62 | |||||||
| Pct. Cert. | 35.71 | |||||||
| Consistent Akaike Info Criterion | 5185.87 | |||||||
| Chi-Square | 2726.38 | |||||||
| Bayesian Information Criterion | 5154.87 | |||||||
| Segmentation | 1. Japan Lovers | 2. Domestic Supporters | 3. Price Conscious Consumers | 4. Process Quality Supporters | ||||
| Segment size (N = 459) | 31.3% | 26.1% | 21.8% | 20.8% | ||||
| Att. Imprt. | Rescaled Util. (S.E.) | Att. Imprt. | Rescaled Util. (S.E.) | Att. Imprt. | Rescaled Util. (S.E.) | Att. Imprt. | Rescaled Util. (S.E.) | |
| COO | 59.83 | 71.66 | 27.36 | 32.26 | ||||
| Taiwan | 64.38 (0.22) *** | 141.18 (0.21) *** | 28.98 (0.18) *** | 54.18 (0.18) *** | ||||
| Japan | 87.46 (0.11) *** | 4.25 (0.13) | 40.22 (0.10) *** | 20.67 (0.10) *** | ||||
| China | −151.85 (0.30) *** | −145.44 (0.29) *** | −69.20 (0.23) *** | −74.85 (0.23) *** | ||||
| Production methods | 6.83 | 5.23 | 3.36 | 32.45 | ||||
| Organic | 13.66 (0.06) *** | 10.46 (0.07) *** | 6.73 (0.07) * | 64.90 (0.07) *** | ||||
| Conventional | −13.66 (0.06) *** | −10.46 (0.07) *** | −6.73 (0.07) * | −64.90 (0.07) *** | ||||
| CRT | 8.85 | 6.90 | 15.33 | 27.98 | ||||
| CRT appr. in prod. country | 14.47 (0.08) *** | −1.39 (0.10) | −23.50 (0.09) *** | 5.58 (0.09) | ||||
| CRT appr.in TW | 6.46 (0.08) ** | 14.50 (0.10) *** | 37.84 (0.09) *** | 53.16 (0.09) *** | ||||
| No CRT | −20.94 (0.10) *** | −13.11 (0.12) ** | −14.34 (0.12) ** | −58.74 (0.12) *** | ||||
| Price | 24.49 | −32.65 (0.13) *** | 16.21 | −21.61 (0.13) *** | 53.95 | −71.93 (0.10) *** | 7.32 | −9.75 (0.10) * |
| No Choice | −55.30 (0.19) *** | −26.87 (0.17) *** | −320.63 (0.37) *** | −156.05 (0.37) *** | ||||
| Share of No-Choice option | 8.69% | 13.87% | 0.17% | 1.24% | ||||
| Segmentation | 1. Japan Lovers | 2. Domestic Supporters | 3. Price Conscious Consumers | 4. Process Quality Supporters | ||||
|---|---|---|---|---|---|---|---|---|
| Segment Sizes (N = 459) | 31.3% | 26.1% | 21.8% | 20.8% | ||||
| (NT/600 g) | WTP | [95% C.I. Lower, Upper §] | WTP | [95% C.I. Lower, Upper] | WTP | [95% C.I. Lower, Upper] | WTP | [95% C.I. Lower, Upper] |
| COO | ||||||||
| Taiwan | 3.94 | [3.16, 4.73] | 13.07 | [9.45, 16.68] | 0.81 | [0.44, 1.17] | 11.11 | [4.11, 18.11] |
| Japan | 5.36 | [4.46, 6.15] | 0.39 | [−0.28, 1.06] | 1.12 | [0.96, 1.27] | 4.24 | [2.35, 6.12] |
| China | −9.30 | [−10.83, −7.77] | −13.46 | [−17.05, −9.86] | −1.92 | [−2.42, −1.43] | −15.35 | [−24.09, −6.61] |
| Production methods | ||||||||
| Organic | 0.84 | [0.64, 1.04] | 0.97 | [0.51, 1.42] | 0.19 | [0.05, 0.32] | 13.31 | [4.27, 22.35] |
| Conventional | −0.84 | [1.04, −0.64] | −0.97 | [−1.42, −0.51] | −0.19 | [−0.32, −0.05] | −13.31 | [−22.35, −4.27] |
| CRT | ||||||||
| CRT appr. in prod. country | 0.89 | [0.65, 1.12] | −0.13 | [−0.66, 0.41] | −0.65 | [−0.73, −0.58] | 1.14 | [−0.28, 2.57] |
| CRT appr. in TW | 0.40 | [0.21, 0.58] | 1.34 | [0.69, 1.99] | 1.05 | [0.85, 1.25] | 10.90 | [3.92, 17.88] |
| No CRT | −1.28 | [−1.59, −0.97] | −1.21 | [−1.95, −0.48] | −0.40 | [−0.60, −0.19] | −12.05 | [−20.13, −3.96] |
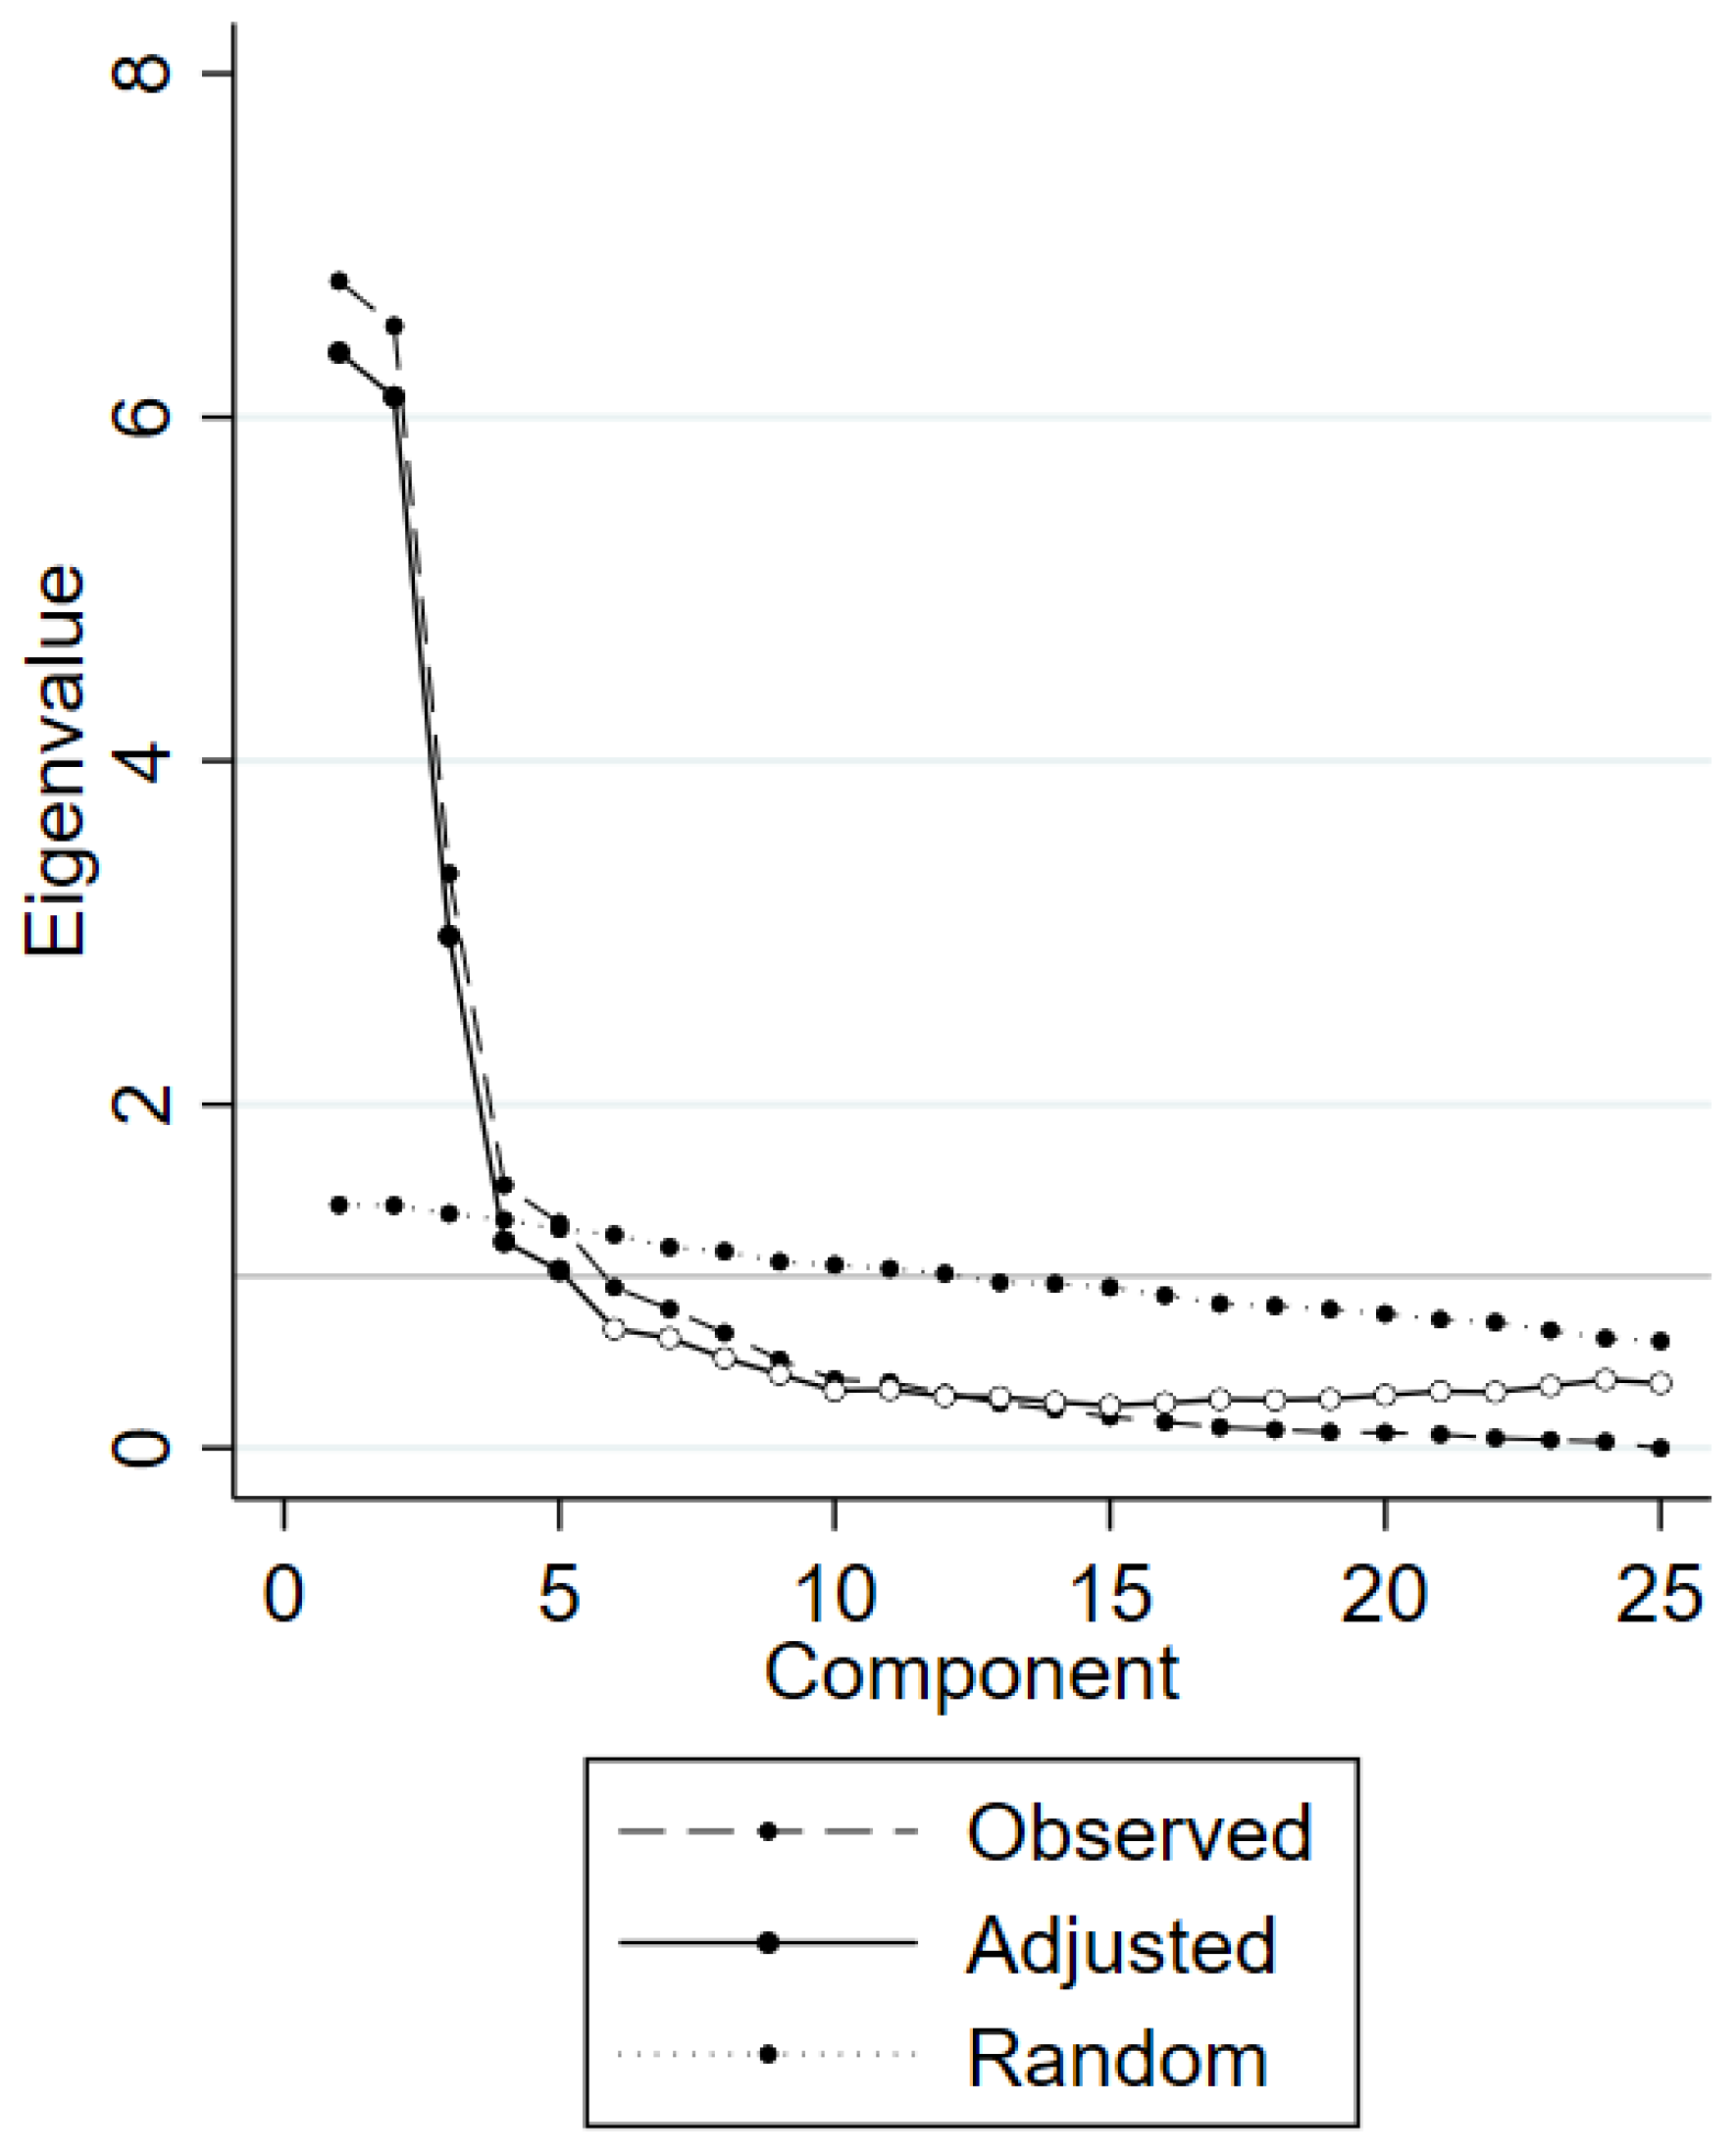
| Component | Adjusted Eigenvalue | Unadjusted Eigenvalue | Estimated Bias |
|---|---|---|---|
| 1 | 6.33 | 6.79 | 0.46 |
| 2 | 6.17 | 6.53 | 0.36 |
| 3 | 3.03 | 3.34 | 0.31 |
| 4 | 1.25 | 1.53 | 0.28 |
| 5 | 1.06 | 1.31 | 0.25 |
| BWS Statement | Comp. 1 Trust in Japan | Comp. 2 Trust in Taiwan and Organics | Comp. 3 Trust in Chinese Products | Comp. 4 No Trust in Organics | Comp. 5 Trust in Chinese Organic Products |
|---|---|---|---|---|---|
| 9. I generally like to consume organic sweet peppers produced in Japan. | 0.890 | ||||
| 12. Japanese organic sweet peppers are trustworthy. | 0.863 | ||||
| 4. I generally like to consume conventional sweet peppers produced in Taiwan. | −0.817 | ||||
| 20. It is more likely that I buy Taiwanese sweet peppers if it is on special offer. | −0.794 | ||||
| 25. Japanese organic sweet peppers have good value for money. | 0.700 | ||||
| 10. Taiwanese organic sweet peppers are trustworthy. | 0.866 | ||||
| 22. It is more likely that I buy Japanese sweet peppers if it is on special offer. | −0.837 | ||||
| 7. I generally like to consume organic sweet peppers produced in Taiwan. | 0.818 | ||||
| 15. With purchasing organic sweet peppers, I help preserving the environment and natural resources. | 0.785 | ||||
| 6. I generally like to consume conventional sweet peppers produced in Japan. | −0.758 | ||||
| 1. I feel assured that the Taiwanese institutions do a good job in adequately protecting consumers. | 0.748 | ||||
| 19. It is more likely that I buy Japanese sweet peppers if information on chemical residue testing is provided. | −0.704 | ||||
| 13. I feel sure that organic sweet peppers contain higher vitamin C and anti-cancer substances than conventional ones. | 0.679 | ||||
| 23. Taiwanese organic sweet peppers have good value for money. | 0.631 | ||||
| 3 I feel assured that the Japanese institutions do a good job in adequately protecting consumers. | −0.517 | ||||
| 18. It is more likely that I buy Chinese sweet peppers if information on chemical residue testing is provided. | 0.906 | ||||
| 21. It is more likely that I buy Chinese sweet peppers if it is on special offer. | 0.749 | ||||
| 5. I generally like to consume conventional sweet peppers produced in China. | 0.615 | ||||
| 14. I feel sure that organic sweet peppers contain the same vitamin C and anti-cancer substances as conventional ones. | −0.816 | ||||
| 16. There are no differences between buying organic sweet peppers or conventional ones with respect to preserving the environment and natural resources. | −0.777 | ||||
| 8. I generally like to consume organic sweet peppers produced in China. | 0.930 | ||||
| 24. Chinese organic sweet peppers have good value for money. | 0.928 | ||||
| 11. Chinese organic sweet peppers are trustworthy. | 0.903 | ||||
| 17. It is more likely that I buy Taiwanese sweet peppers if information on chemical residue testing is provided. | −0.828 | ||||
| 2. I feel assured that the Chinese institutions do a good job in adequately protecting consumers. | 0.454 |
| Component | Initial Eigenvalues | ||
|---|---|---|---|
| Total | Percentage of Variance | Cumulative Percentage | |
| 1 | 6.79 | 27.17 | 27.17 |
| 2 | 6.53 | 26.12 | 53.29 |
| 3 | 3.34 | 13.38 | 66.67 |
| 4 | 1.53 | 6.12 | 72.79 |
| 5 | 1.31 | 5.24 | 78.03 |
| 6 | 0.94 | 3.75 | 81.78 |
| 7 | 0.81 | 3.24 | 85.02 |
| 8 | 0.67 | 2.68 | 87.70 |
| 9 | 0.52 | 2.06 | 89.76 |
| 10 | 0.40 | 1.60 | 91.36 |
| 11 | 0.39 | 1.54 | 92.90 |
| 12 | 0.32 | 1.27 | 94.17 |
| 13 | 0.26 | 1.04 | 95.21 |
| 14 | 0.23 | 0.90 | 96.11 |
| 15 | 0.18 | 0.73 | 96.84 |
| 16 | 0.15 | 0.61 | 97.45 |
| 17 | 0.12 | 0.49 | 97.94 |
| 18 | 0.11 | 0.43 | 98.37 |
| 19 | 0.09 | 0.38 | 98.75 |
| 20 | 0.09 | 0.36 | 99.10 |
| 21 | 0.08 | 0.32 | 99.42 |
| 22 | 0.06 | 0.24 | 99.66 |
| 23 | 0.05 | 0.19 | 99.85 |
| 24 | 0.04 | 0.15 | 100.00 |
| 25 | 0.00 | 0.00 | 100.00 |
| (N = 459) | Model 1 | Model 2 | ||
|---|---|---|---|---|
| Log-likelihood of null model | −629.93 | −629.93 | ||
| Log-likelihood of restricted model | −484.92 | −469.61 | ||
| LR test Chi-square (33) | 196.05 | 223.32 | ||
| Prob > Chi-square | 0.00 | 0.00 | ||
| Pseudo R-squares | 0.23 | 0.25 | ||
| DCE four segments | Coef. | Robust Std. Err. | Coef. | Robust Std. Err. |
| Japan Lovers | Reference group | |||
| Domestics Supporters | ||||
| Trust in Japan | −0.84 *** | 0.17 | −0.81 *** | 0.17 |
| Trust in Taiwan & organic | 1.29 *** | 0.18 | 1.33 *** | 0.19 |
| Trust in Chinese products | −0.28 | 0.42 | −0.10 | 0.45 |
| No trust in organic | 0.09 | 0.18 | 0.04 | 0.18 |
| Trust in Chinese organic prod. | −0.10 | 0.29 | −0.14 | 0.29 |
| Full_HHShopResp | 0.63 * | 0.33 | ||
| Female | −0.16 | 0.34 | ||
| Age_below40 | 0.13 | 0.32 | ||
| Have_Kids | −0.48 | 0.30 | ||
| Edu_aboveCollege | −0.67 * | 0.36 | ||
| HHincome_above90k | −0.04 | 0.34 | ||
| Constant | −0.42 * | 0.22 | 0.12 | 0.52 |
| Price Conscious Consumers | ||||
| Trust in Japan | −0.89 *** | 0.18 | −0.86 *** | 0.19 |
| Trust in Taiwan & organic | −0.03 | 0.17 | 0.09 | 0.17 |
| Trust in Chinese products | 1.19 *** | 0.41 | 1.26 *** | 0.49 |
| No trust in organic | 0.07 | 0.19 | −0.01 | 0.20 |
| Trust in Chinese organic prod. | 0.52 * | 0.29 | 0.49 * | 0.30 |
| Full_HHShopResp | −0.01 | 0.34 | ||
| Female | −0.63 * | 0.34 | ||
| Age_below40 | −0.48 | 0.35 | ||
| Have_Kids | −0.79 ** | 0.34 | ||
| Edu_aboveCollege | −0.90 ** | 0.44 | ||
| HHincome_above90k | −0.16 | 0.35 | ||
| Constant | −0.26 | 0.29 | 1.47 *** | 0.59 |
| Process Quality Supporters | ||||
| Trust in Japan | −0.36 ** | 0.17 | −0.34 ** | 0.17 |
| Trust in Taiwan & organic | 0.80 *** | 0.17 | 0.86 *** | 0.18 |
| Trust in Chinese products | 0.67 * | 0.40 | 0.75 | 0.47 |
| No trust in organic | 0.23 | 0.20 | 0.18 | 0.20 |
| Trust in Chinese organic prod. | 0.93 *** | 0.23 | 0.90 *** | 0.23 |
| Full_HHShopResp | 0.25 | 0.33 | ||
| Female | −0.13 | 0.36 | ||
| Age_below40 | −0.48 | 0.31 | ||
| Have_Kids | −0.15 | 0.31 | ||
| Edu_aboveCollege | −0.63 | 0.42 | ||
| HHincome_above90k | −0.15 | 0.37 | ||
| Constant | −0.26 | 0.21 | 0.55 | 0.58 |
© 2020 by the authors. Licensee MDPI, Basel, Switzerland. This article is an open access article distributed under the terms and conditions of the Creative Commons Attribution (CC BY) license (http://creativecommons.org/licenses/by/4.0/).
Share and Cite
Yeh, C.-H.; Hartmann, M.; Langen, N. The Role of Trust in Explaining Food Choice: Combining Choice Experiment and Attribute Best–Worst Scaling. Foods 2020, 9, 45. https://doi.org/10.3390/foods9010045
Yeh C-H, Hartmann M, Langen N. The Role of Trust in Explaining Food Choice: Combining Choice Experiment and Attribute Best–Worst Scaling. Foods. 2020; 9(1):45. https://doi.org/10.3390/foods9010045
Chicago/Turabian StyleYeh, Ching-Hua, Monika Hartmann, and Nina Langen. 2020. "The Role of Trust in Explaining Food Choice: Combining Choice Experiment and Attribute Best–Worst Scaling" Foods 9, no. 1: 45. https://doi.org/10.3390/foods9010045
APA StyleYeh, C.-H., Hartmann, M., & Langen, N. (2020). The Role of Trust in Explaining Food Choice: Combining Choice Experiment and Attribute Best–Worst Scaling. Foods, 9(1), 45. https://doi.org/10.3390/foods9010045