Multilayer Bixin Microcapsules: The Impact of Native Carbohydrates on the Microencapsulation Efficiency and Dispersion Stability

 ,
,  ,
,
Abstract
:
1. Introduction
2. Materials and Methods
2.1. Materials
2.2. Colorant Extraction
2.3. PB and/or CRB Suspensions
2.4. Spray Drying of the Suspensions
2.5. Bixin Spectrophotometrical Analysis
2.5.1. Total Bixin Determination
2.5.2. Surface Bixin Determination
2.5.3. Encapsulation Efficiency Measurements
2.6. Microcapsules Characterization:
2.6.1. Particle Size Distribution
2.6.2. Scanning Electron Microscopy
2.6.3. Optical Microscopy
2.7. Characterization of Water Dissolved Microcapsules
2.7.1. Colorimetric Analysis
2.7.2. Physical Stability of the Dispersions
2.8. Chemical Analysis of the Annatto Seed Integument Carbohydrate Fraction
2.8.1. Enzymatic Analysis
2.8.2. Analysis of Monosaccharide Composition of the Integument
3. Results
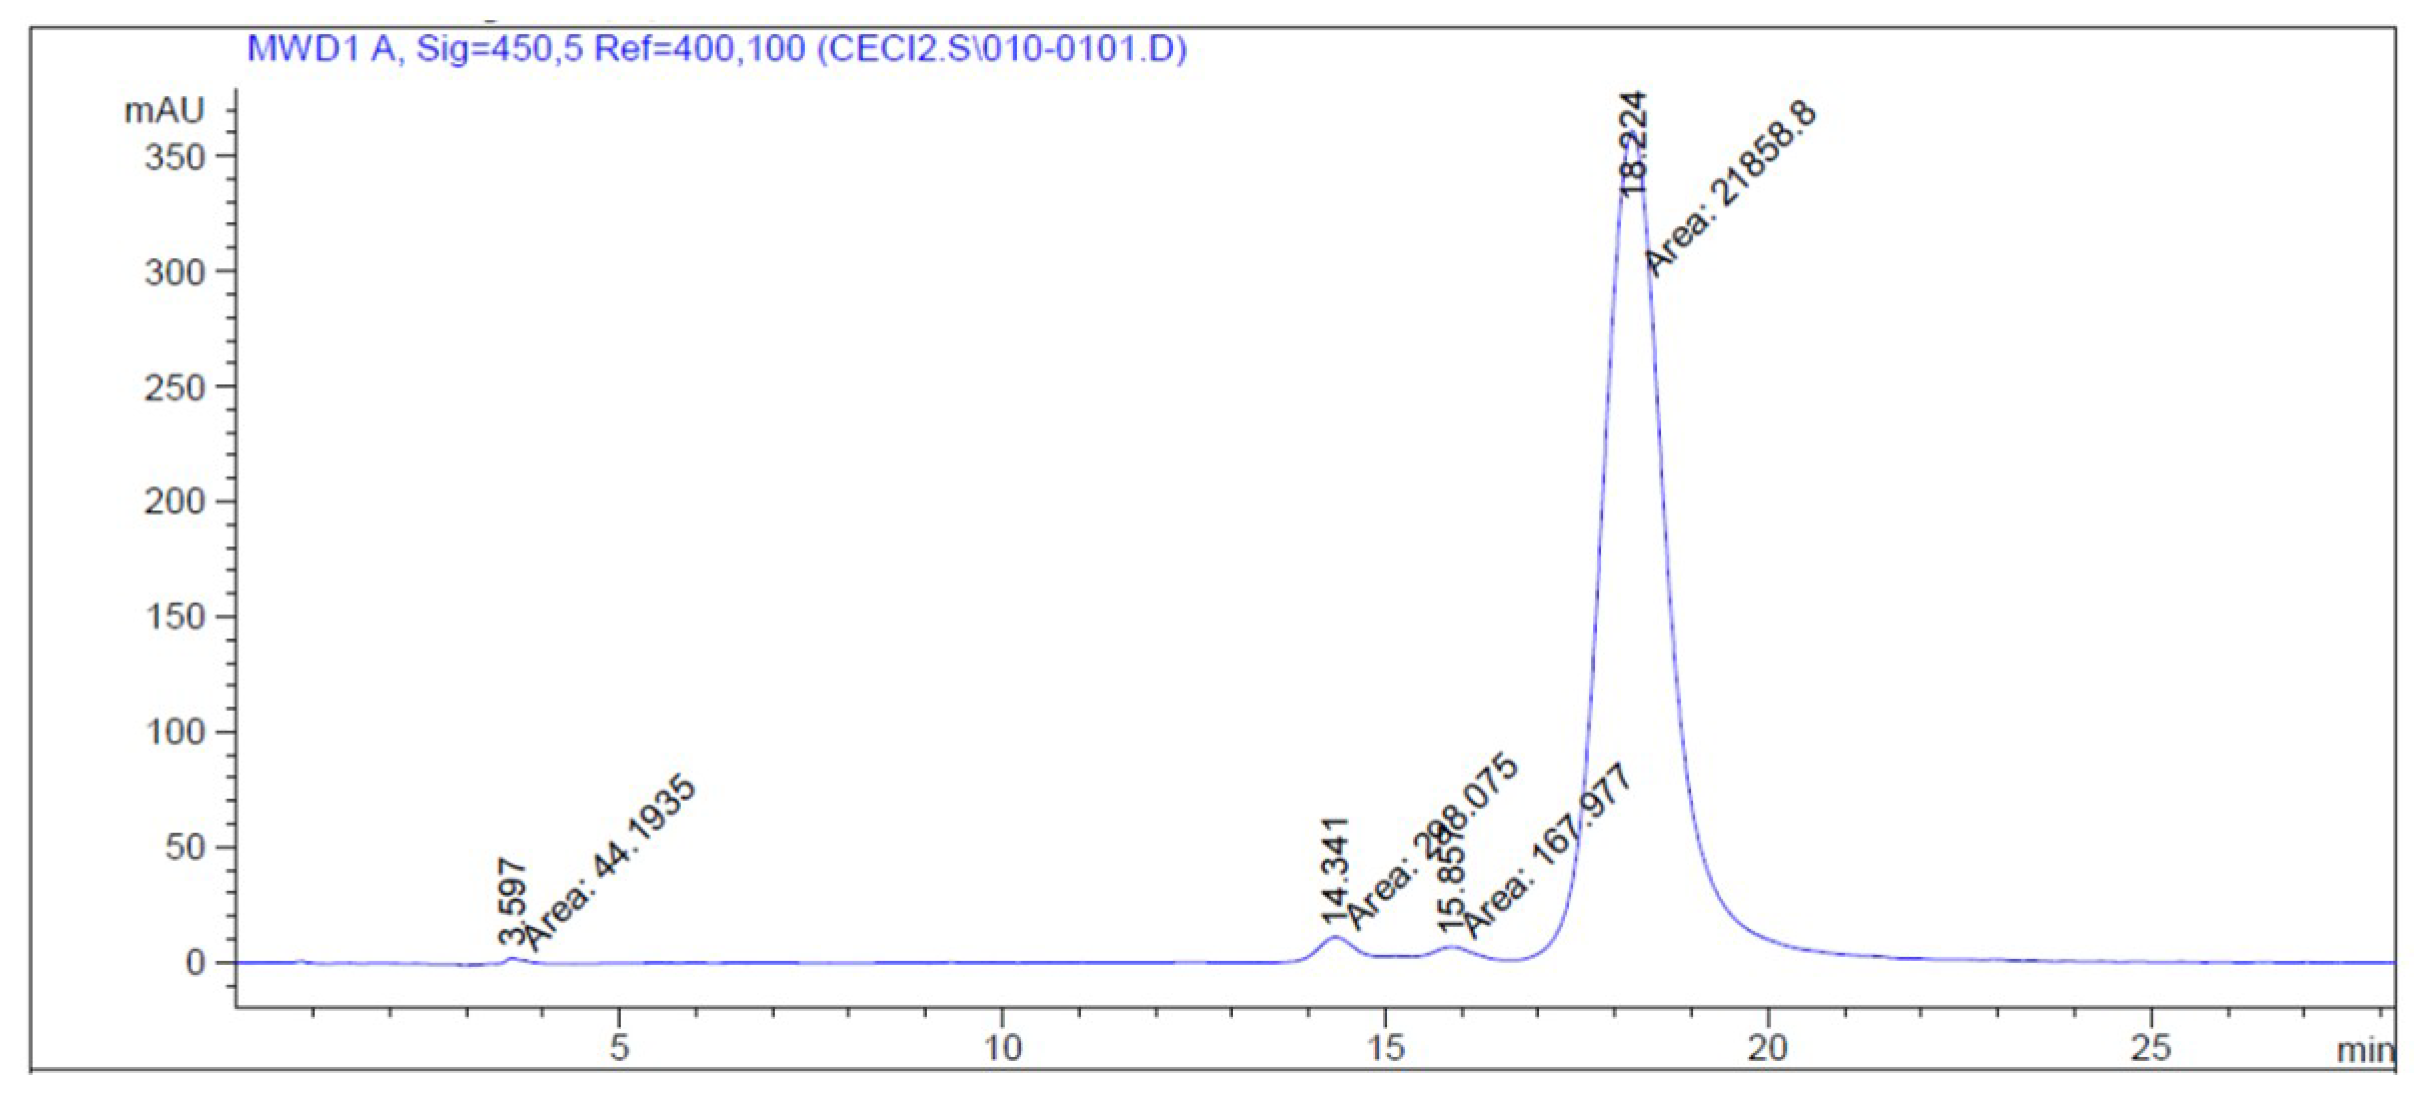
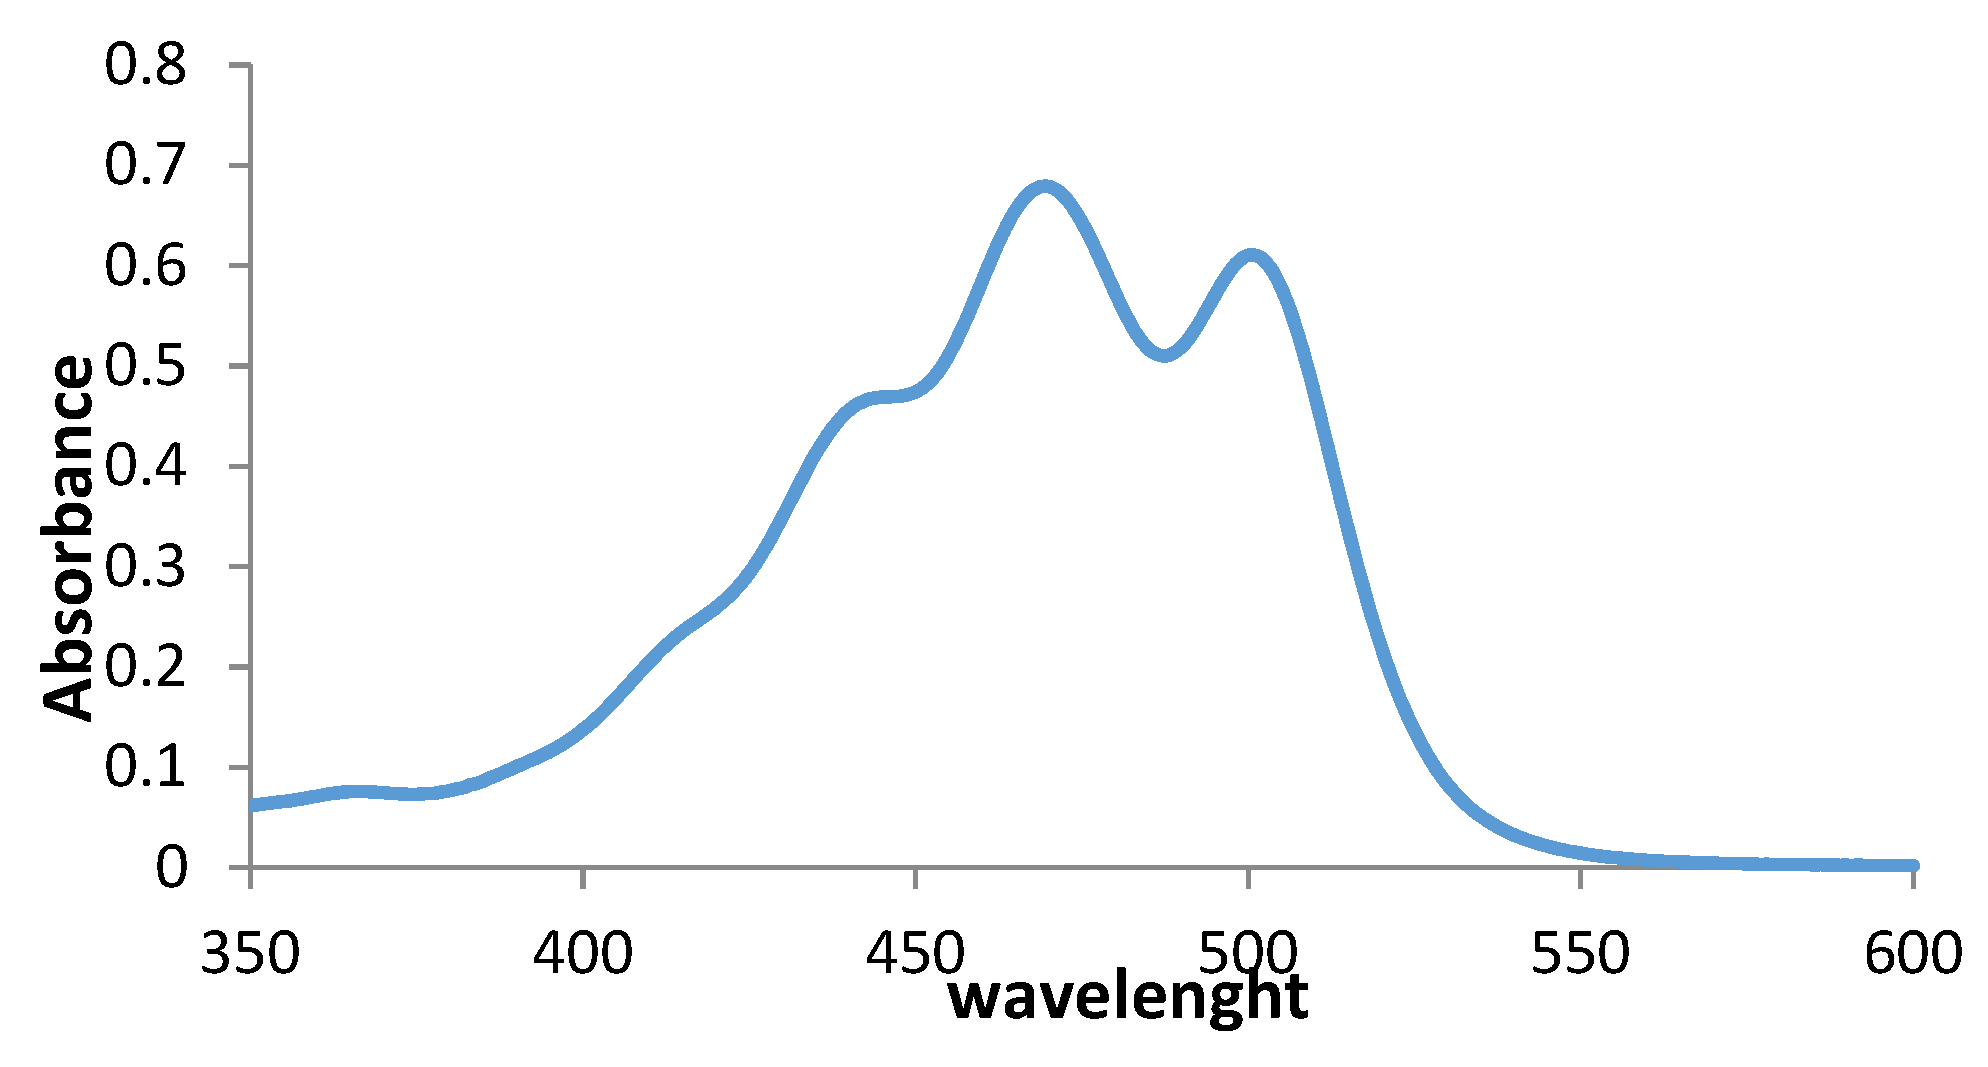
3.1. Bixin and CRB Purity
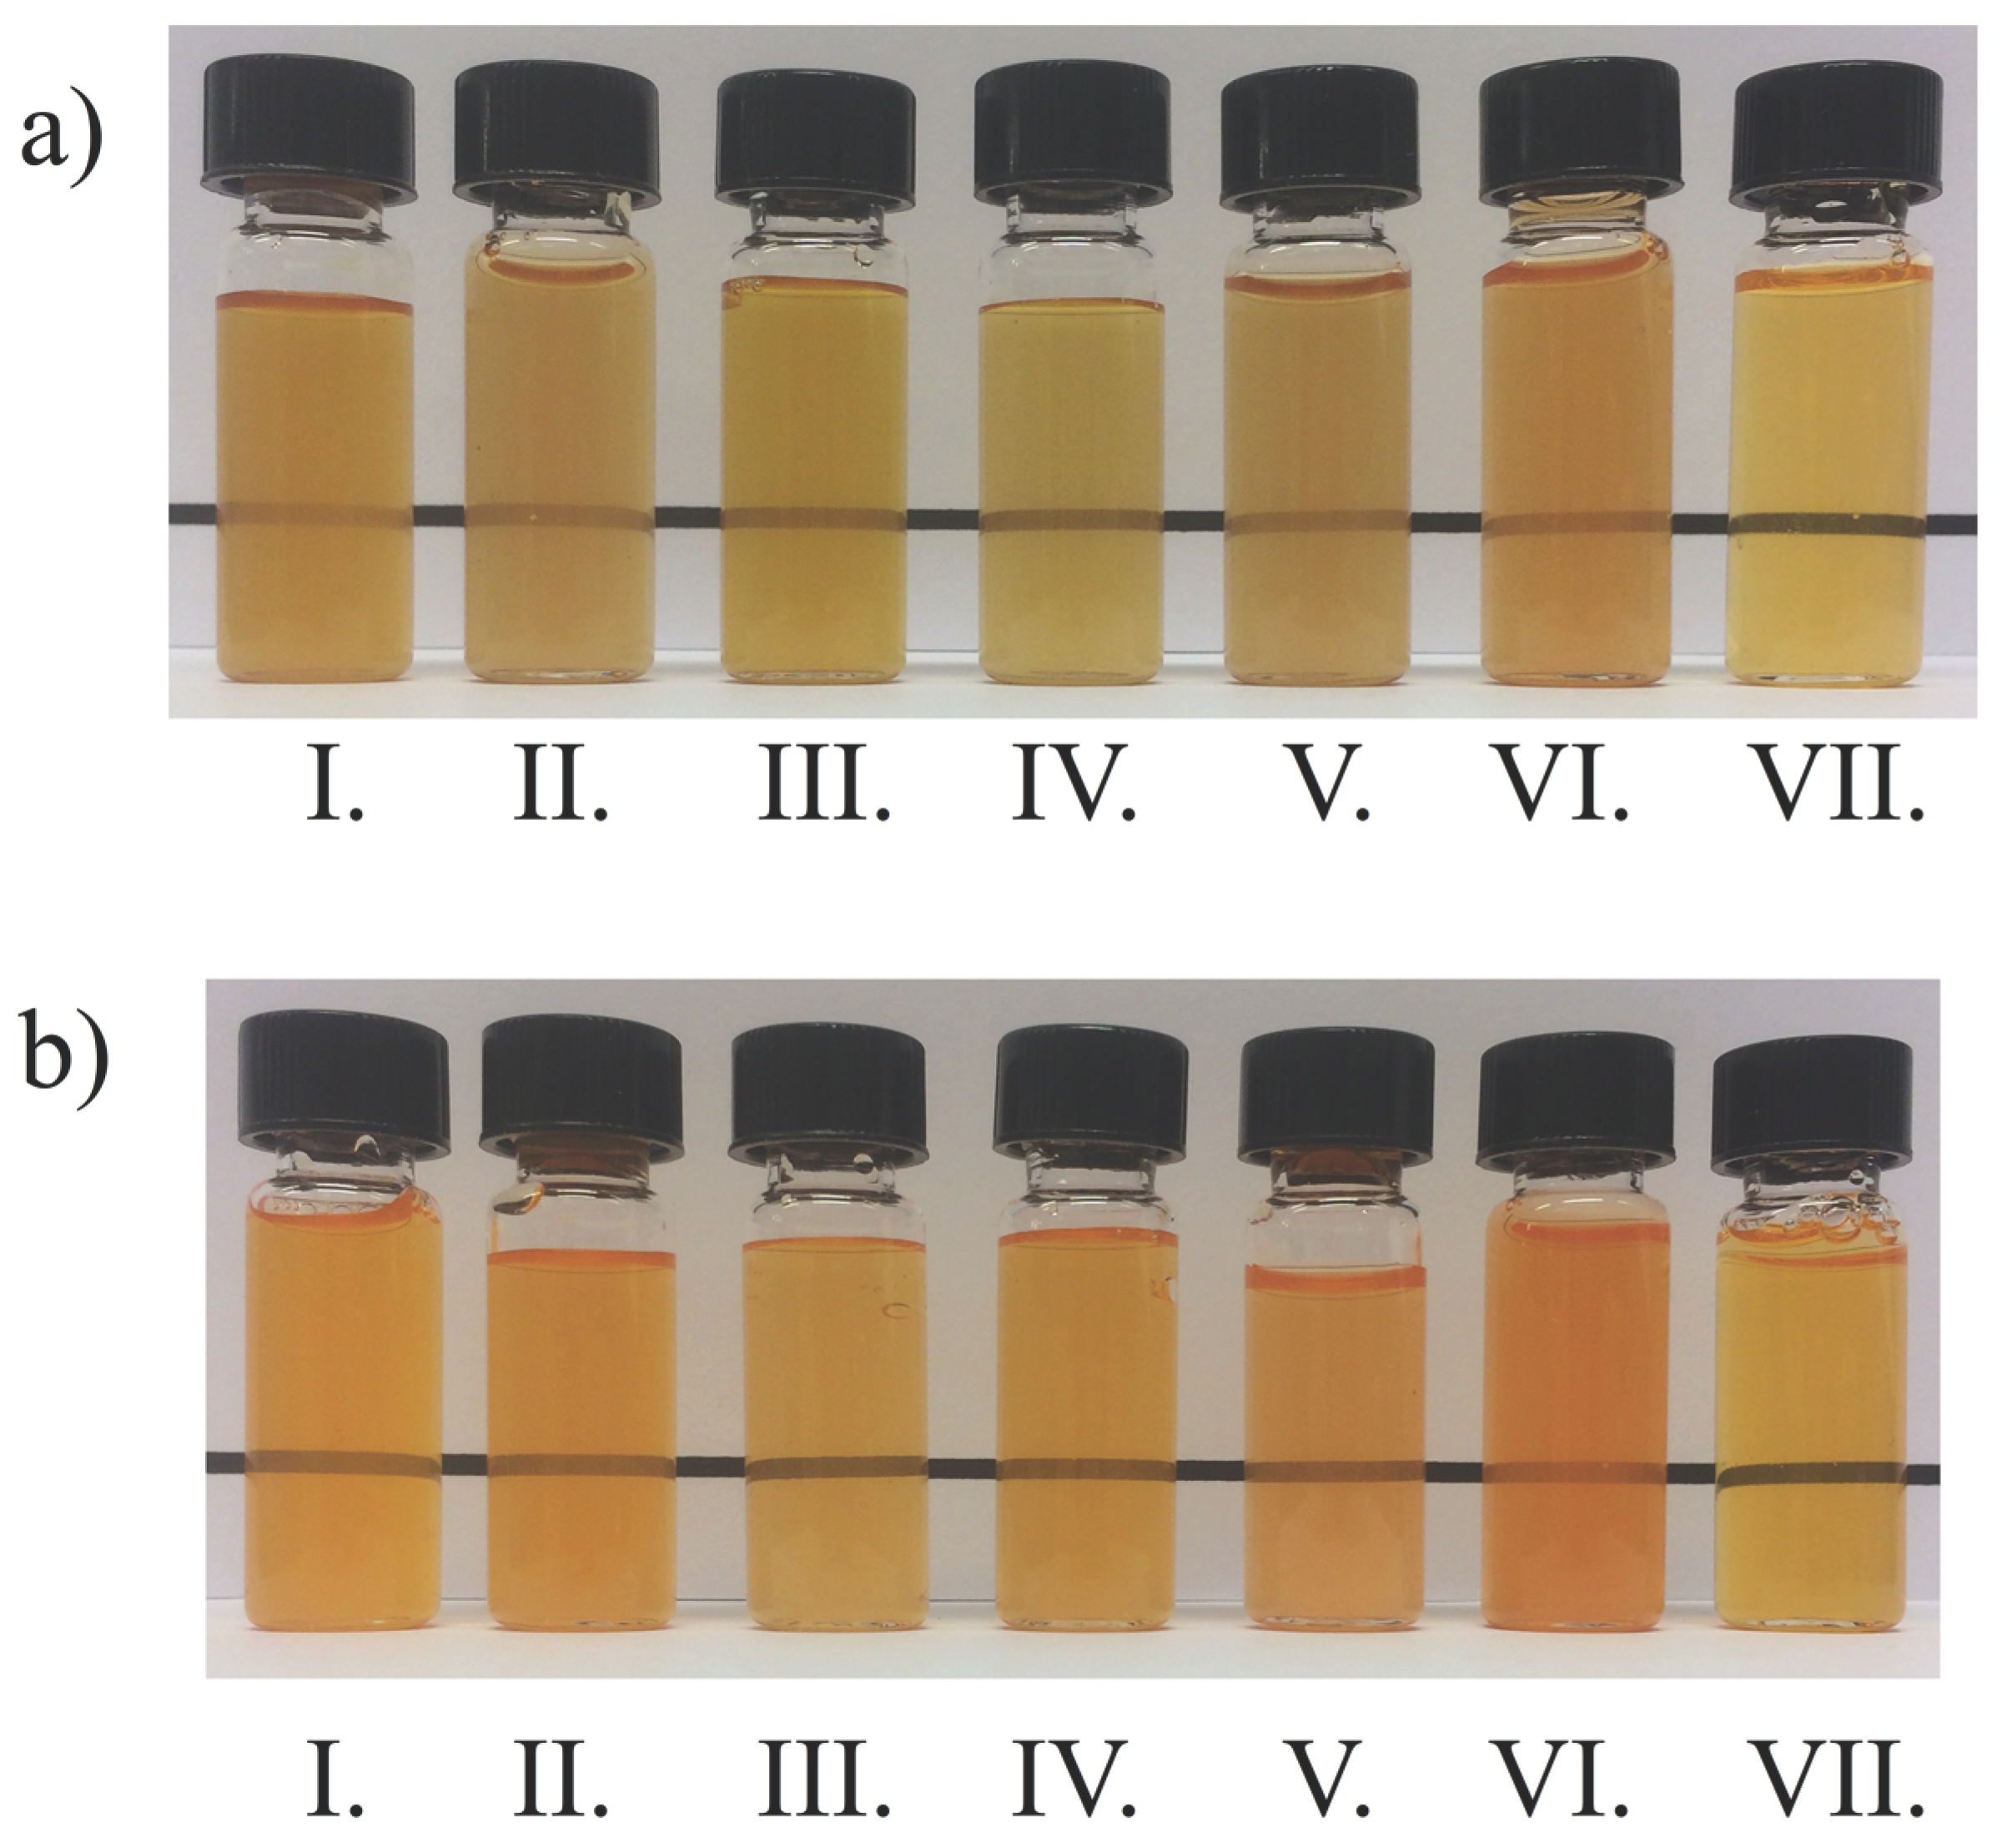
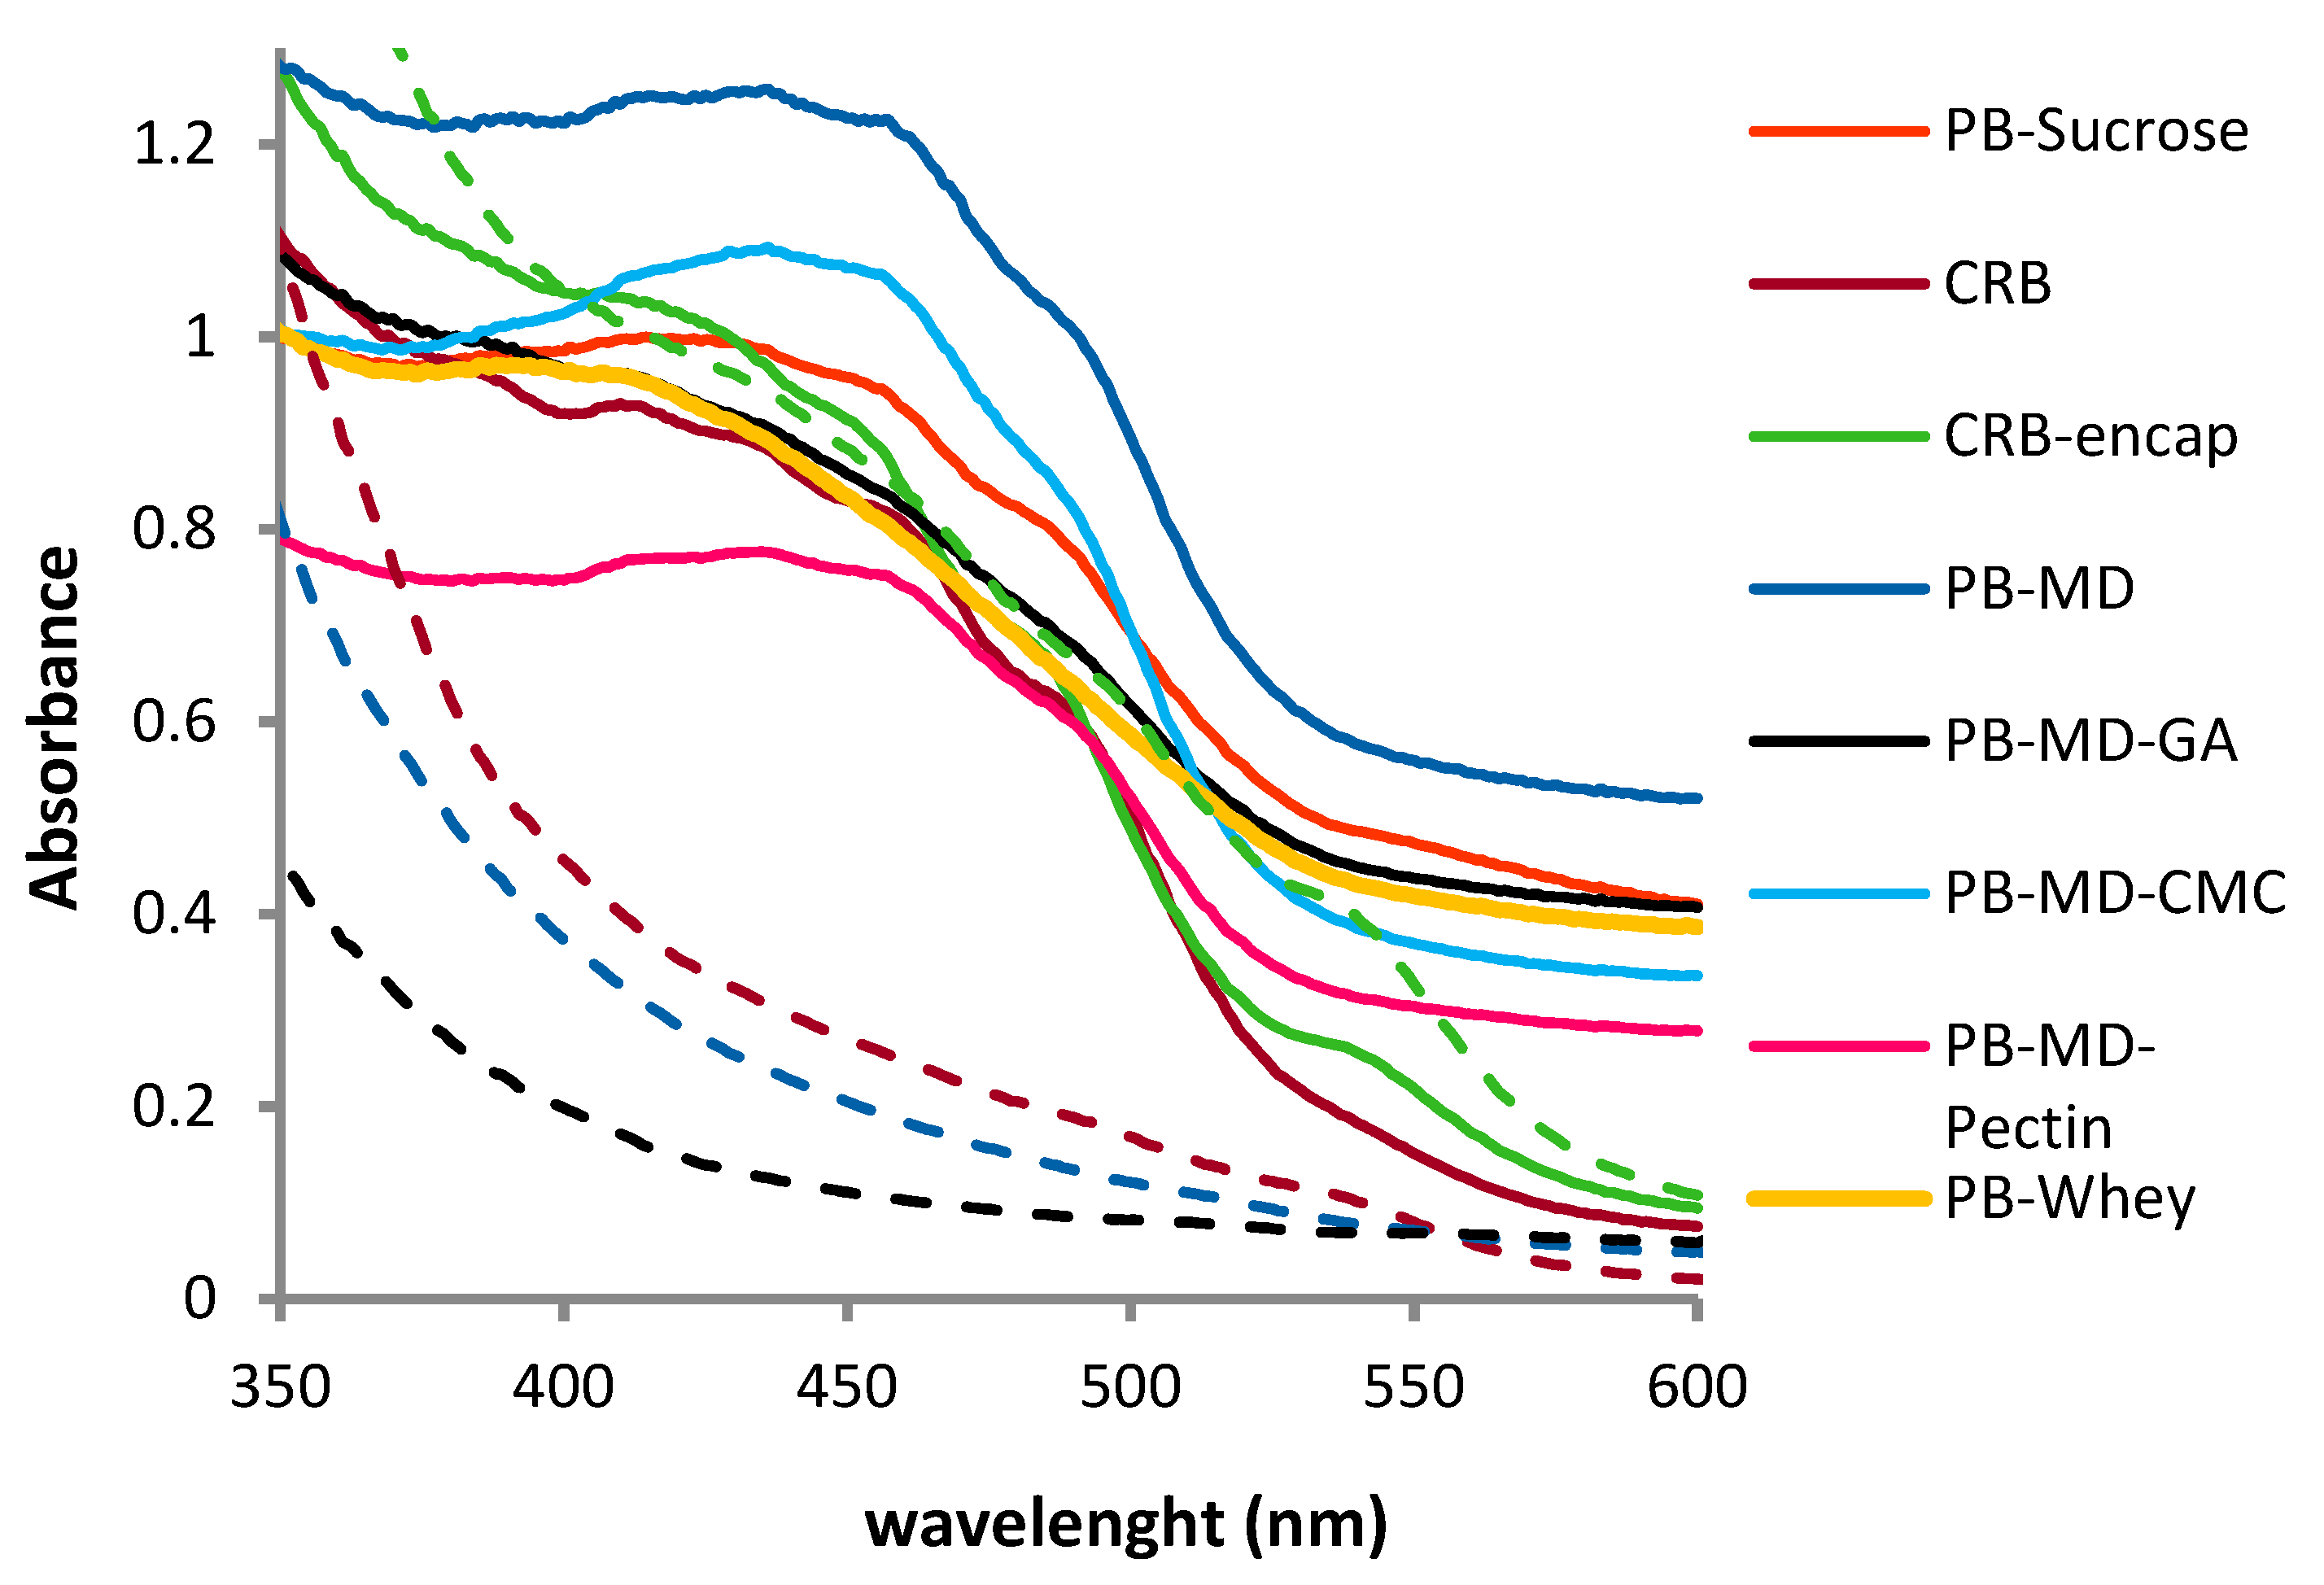
3.2. Bixin and CRB Suspensions
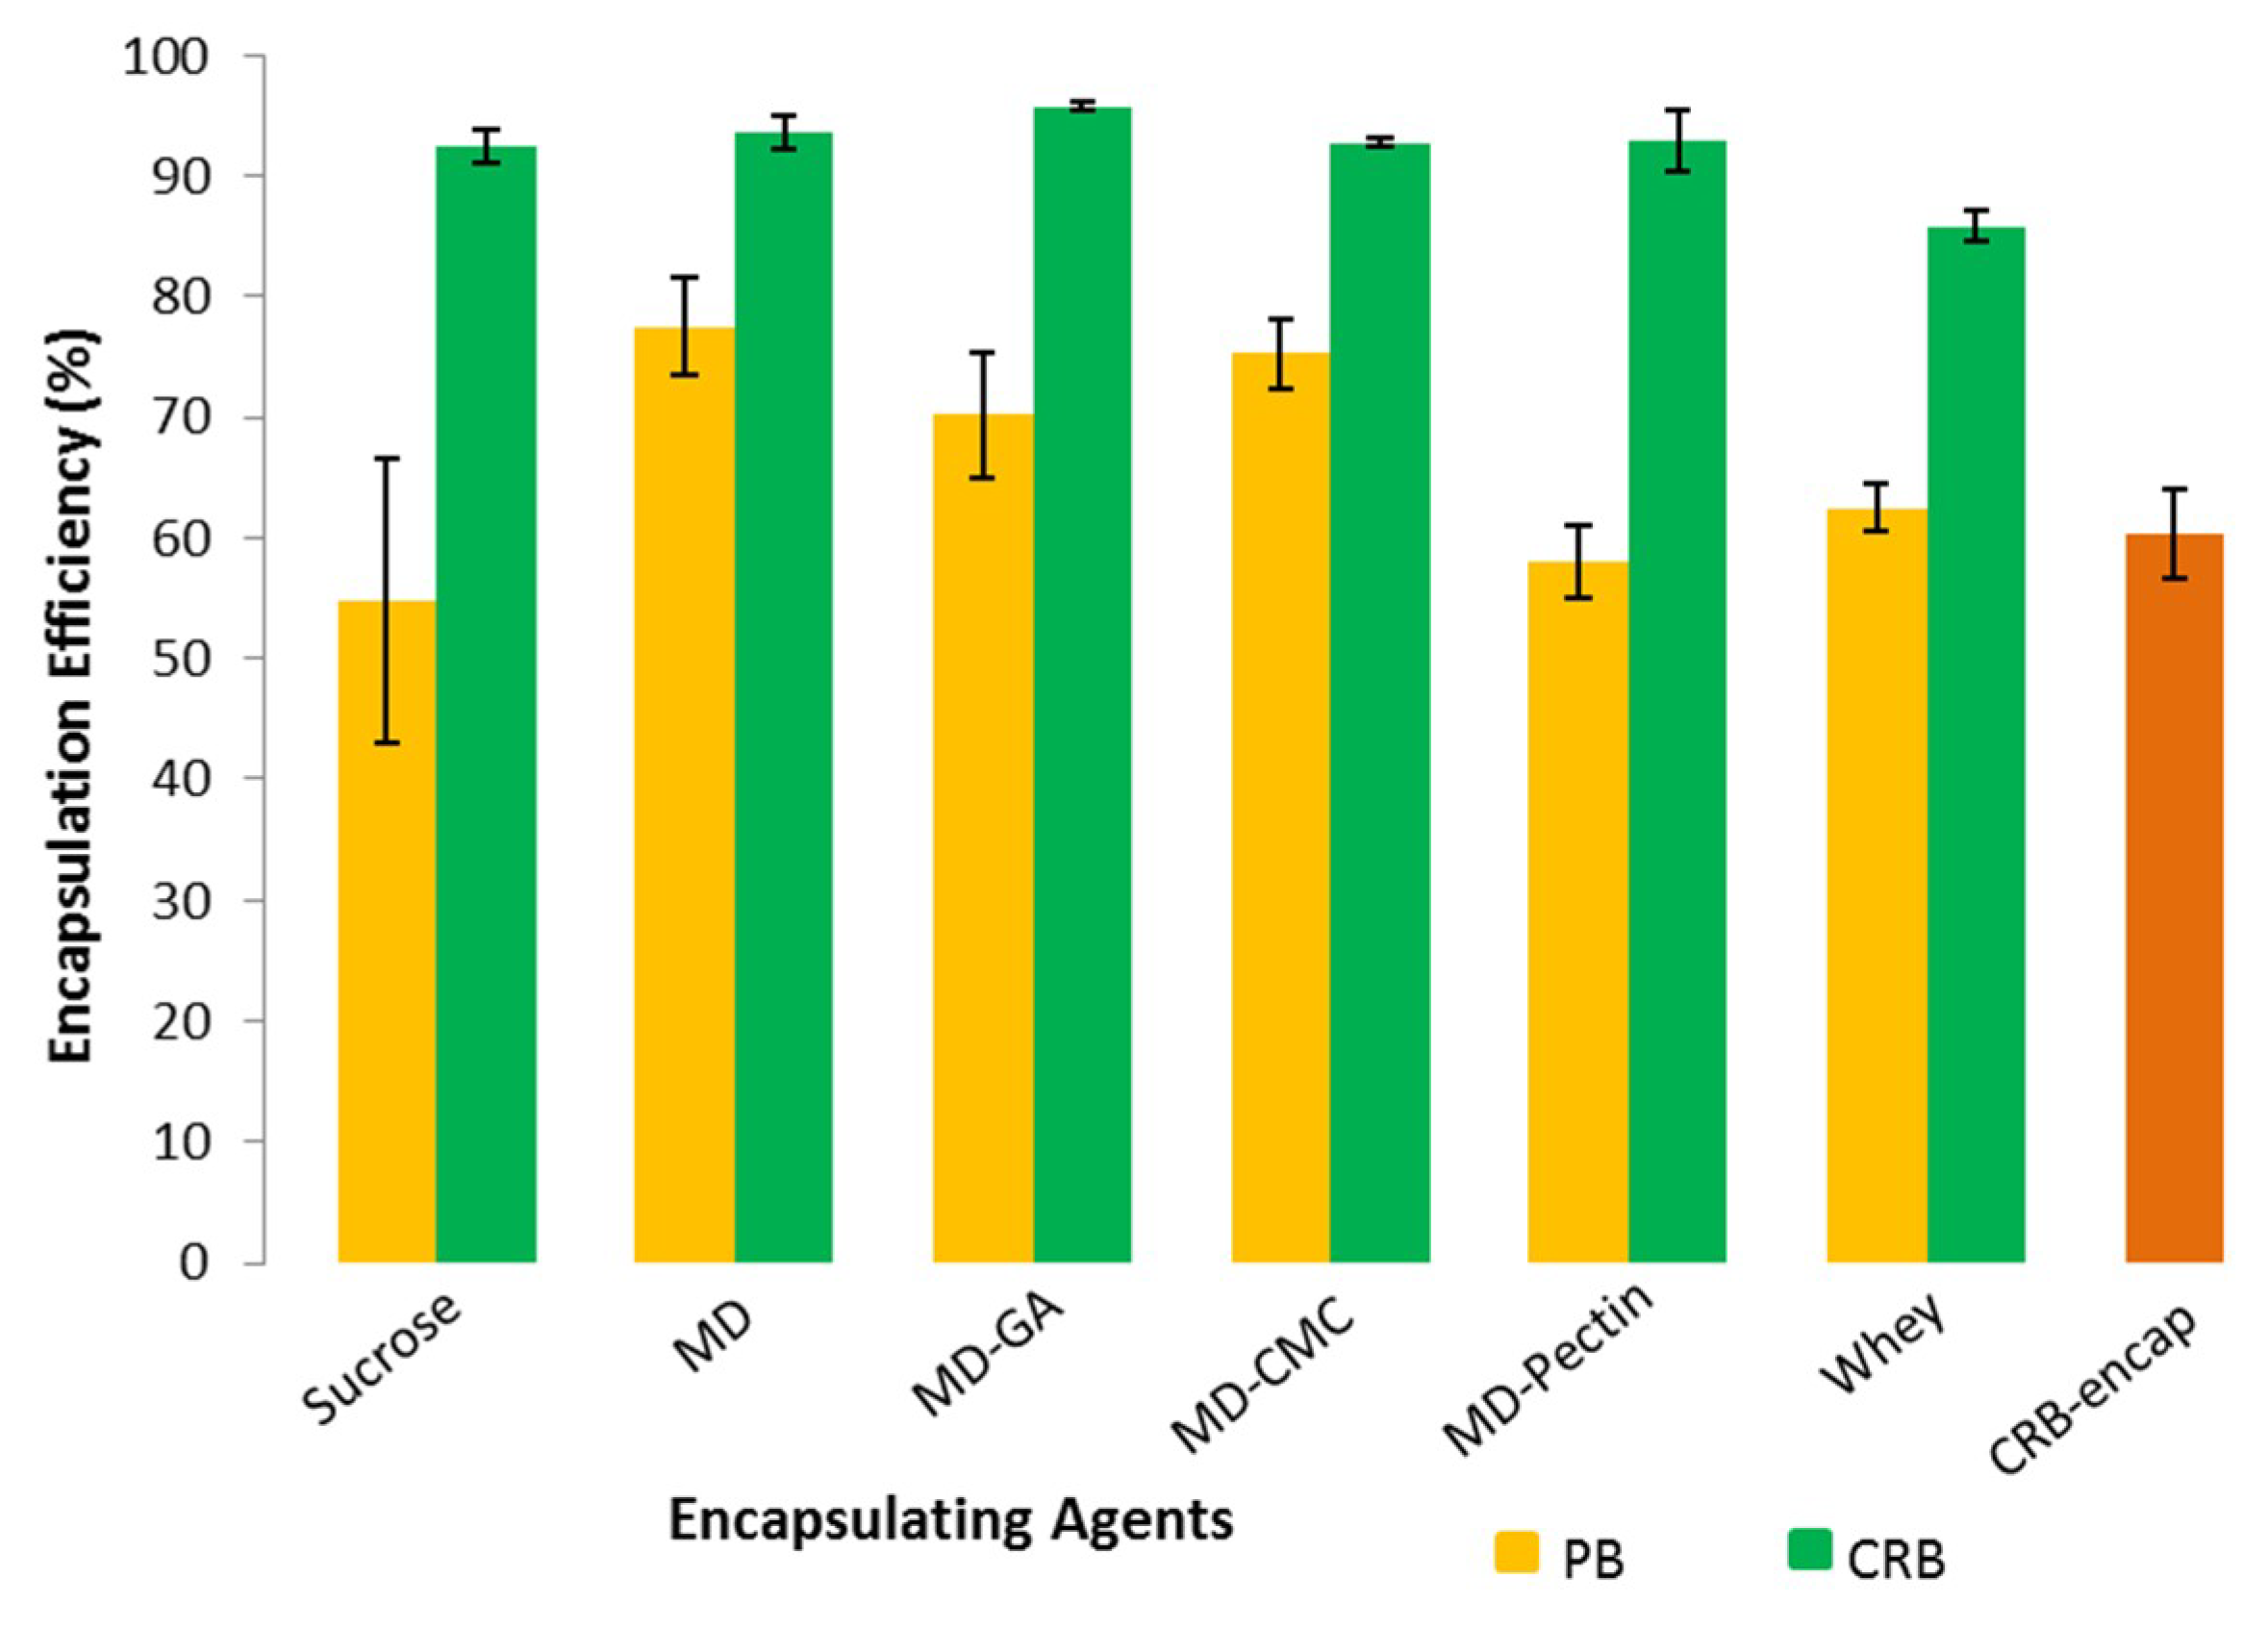
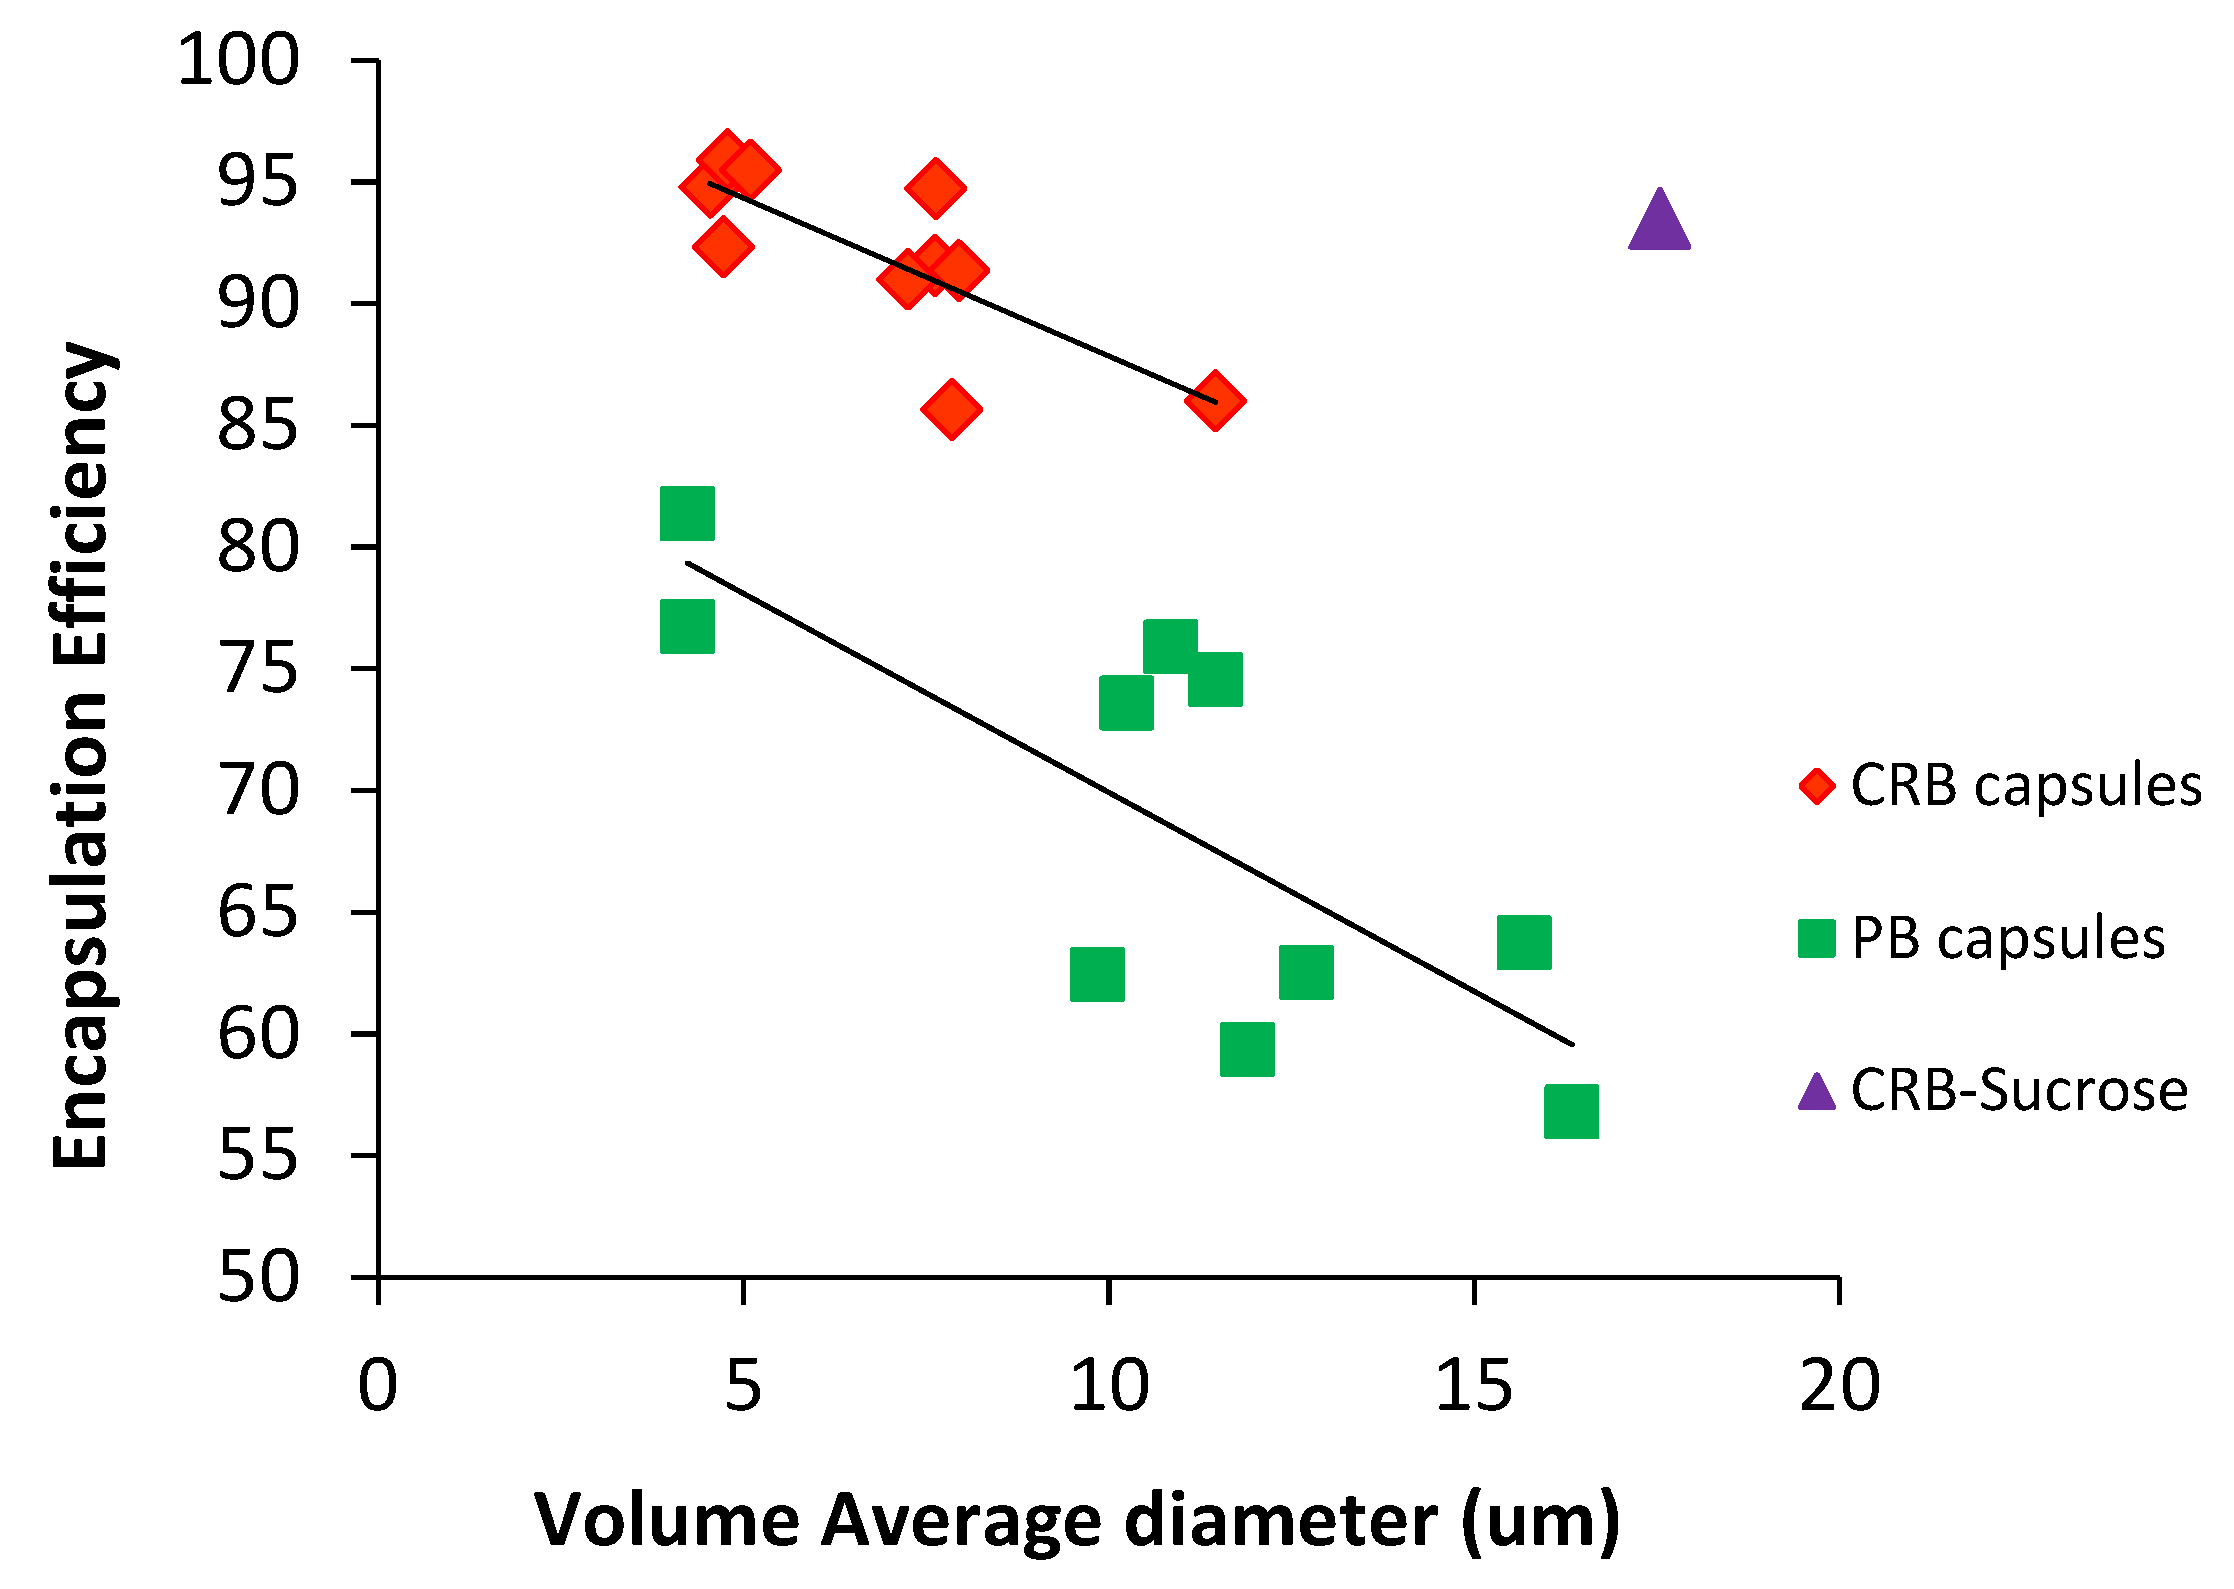
3.3. Encapsulation Result and Efficiency
3.4. Microcapsules Characteristics
3.4.1. Particle Size Distribution
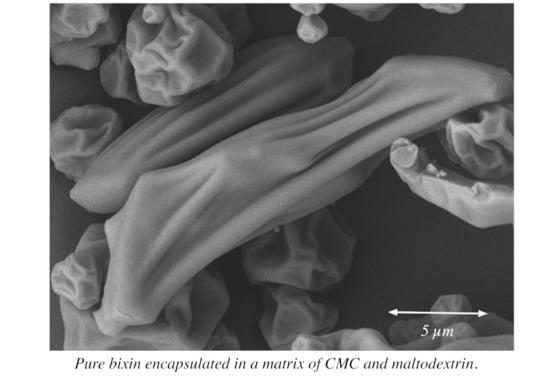
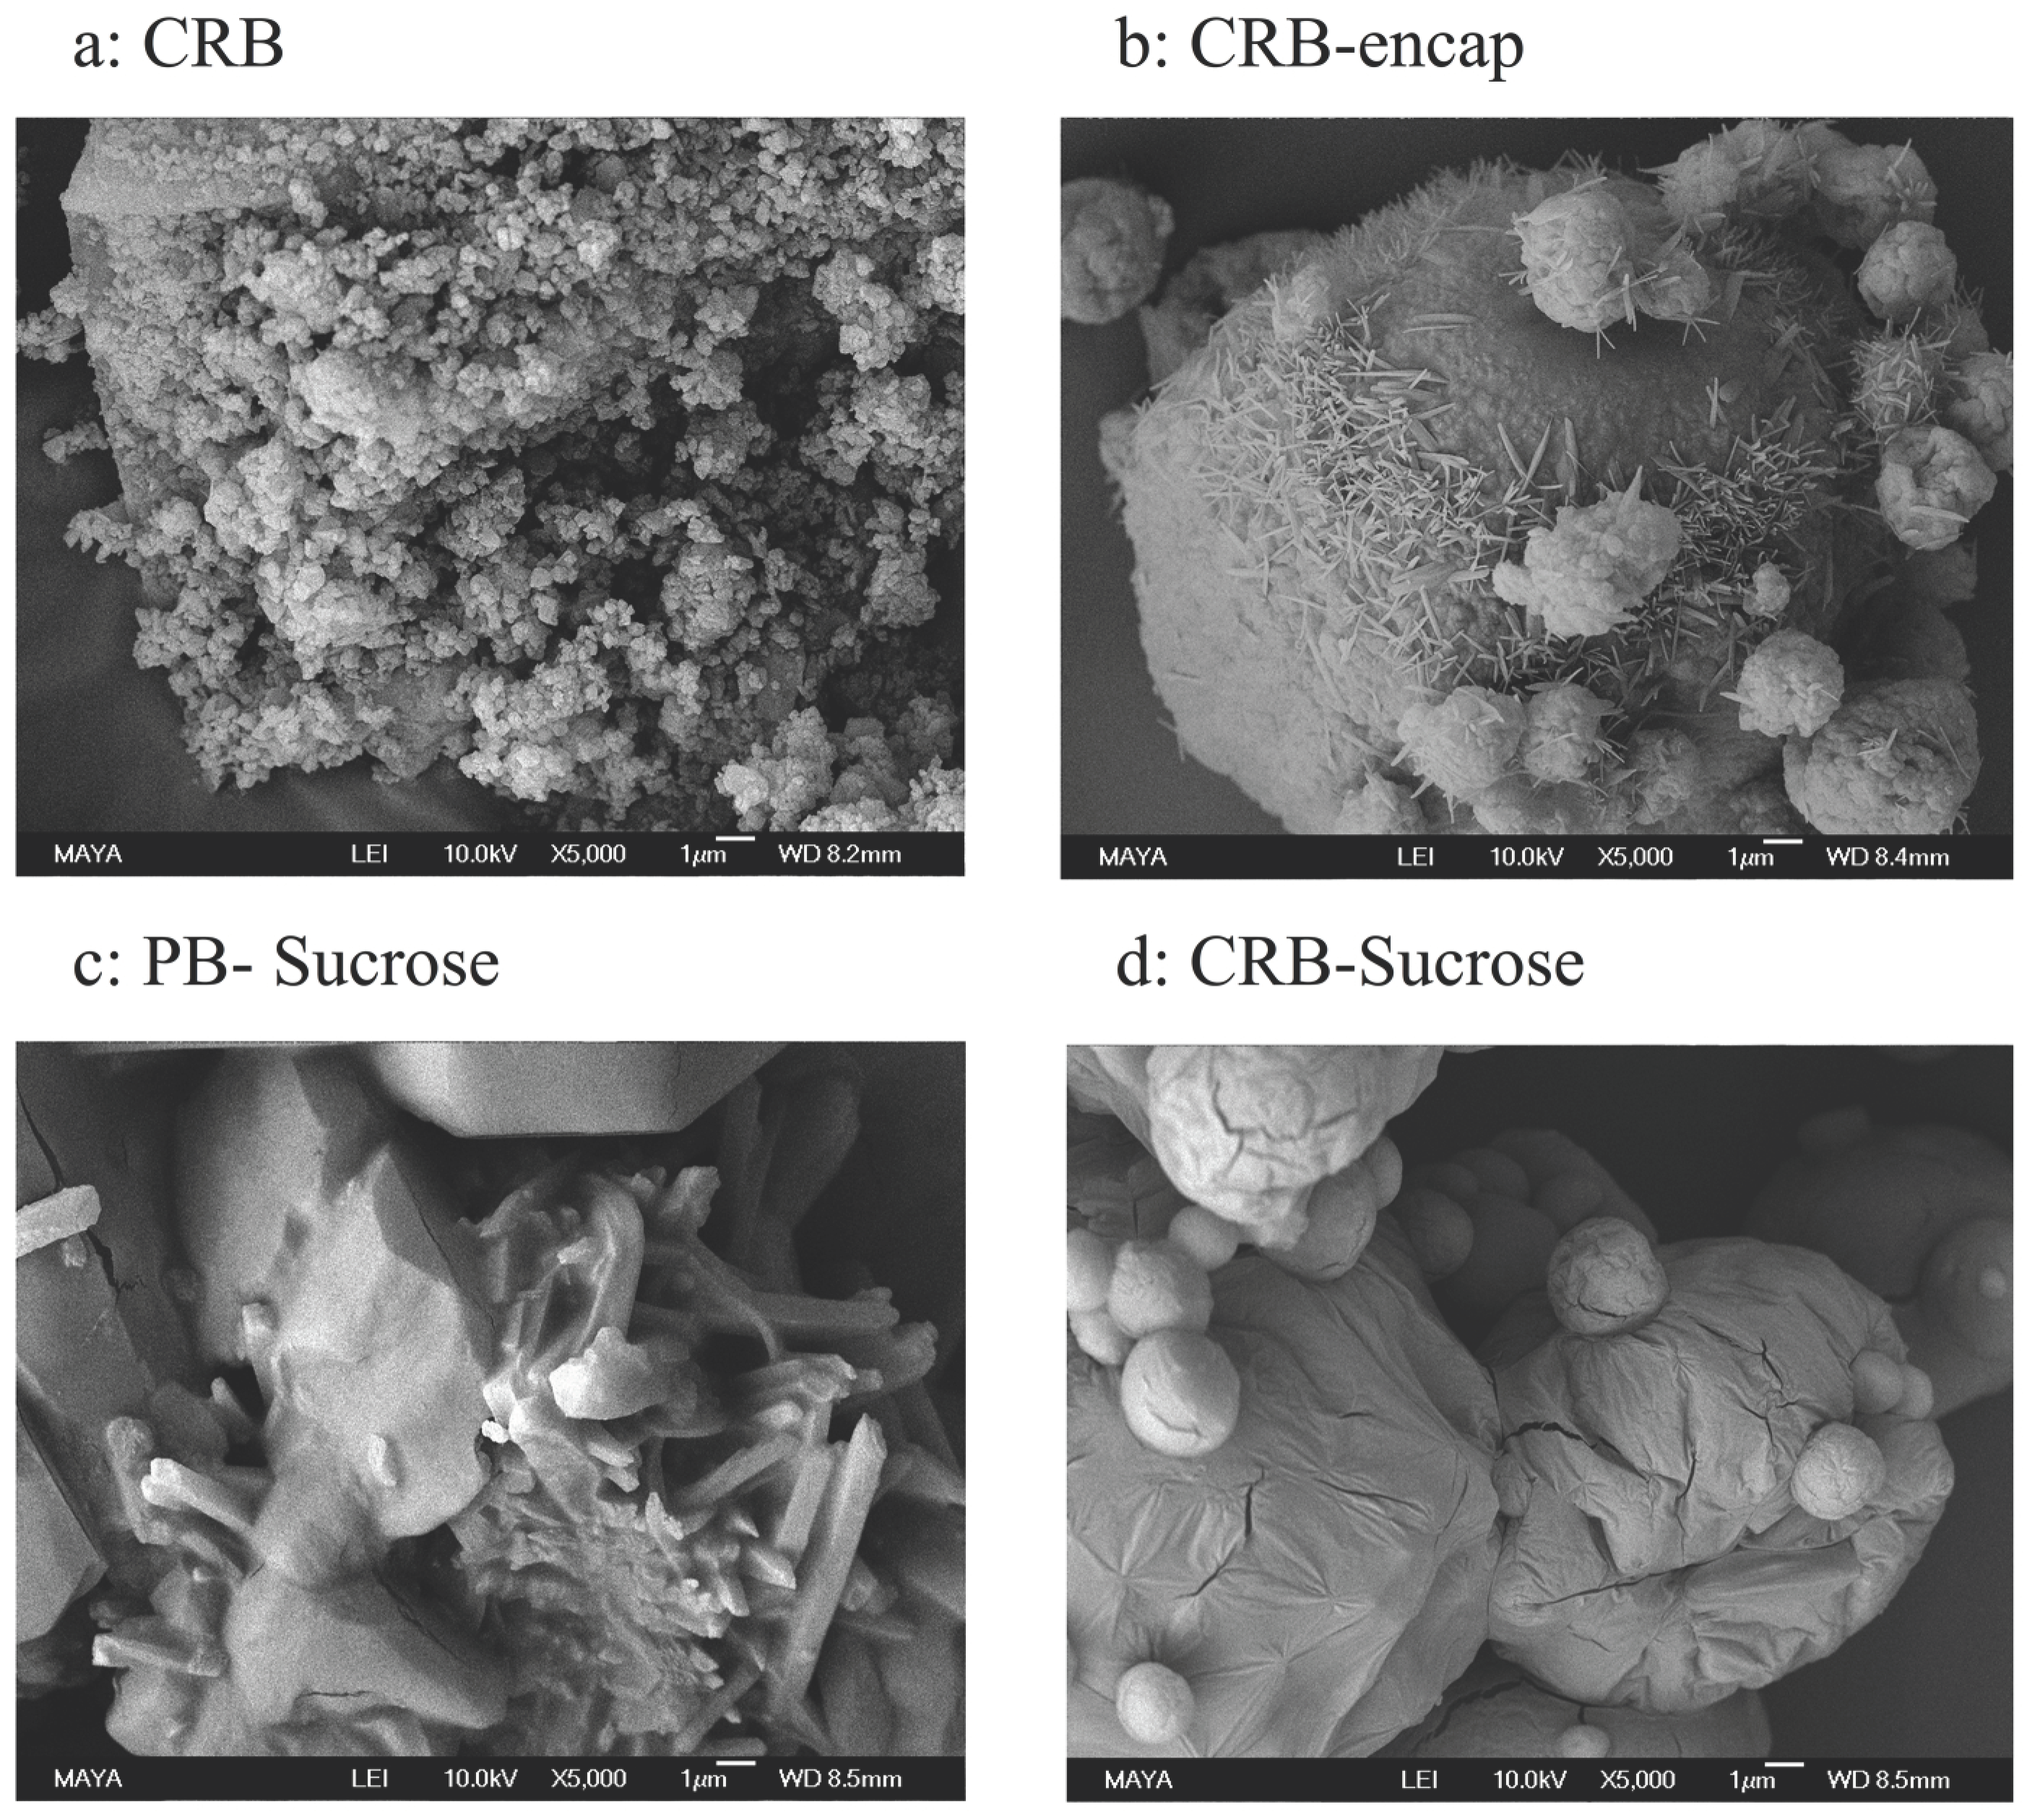
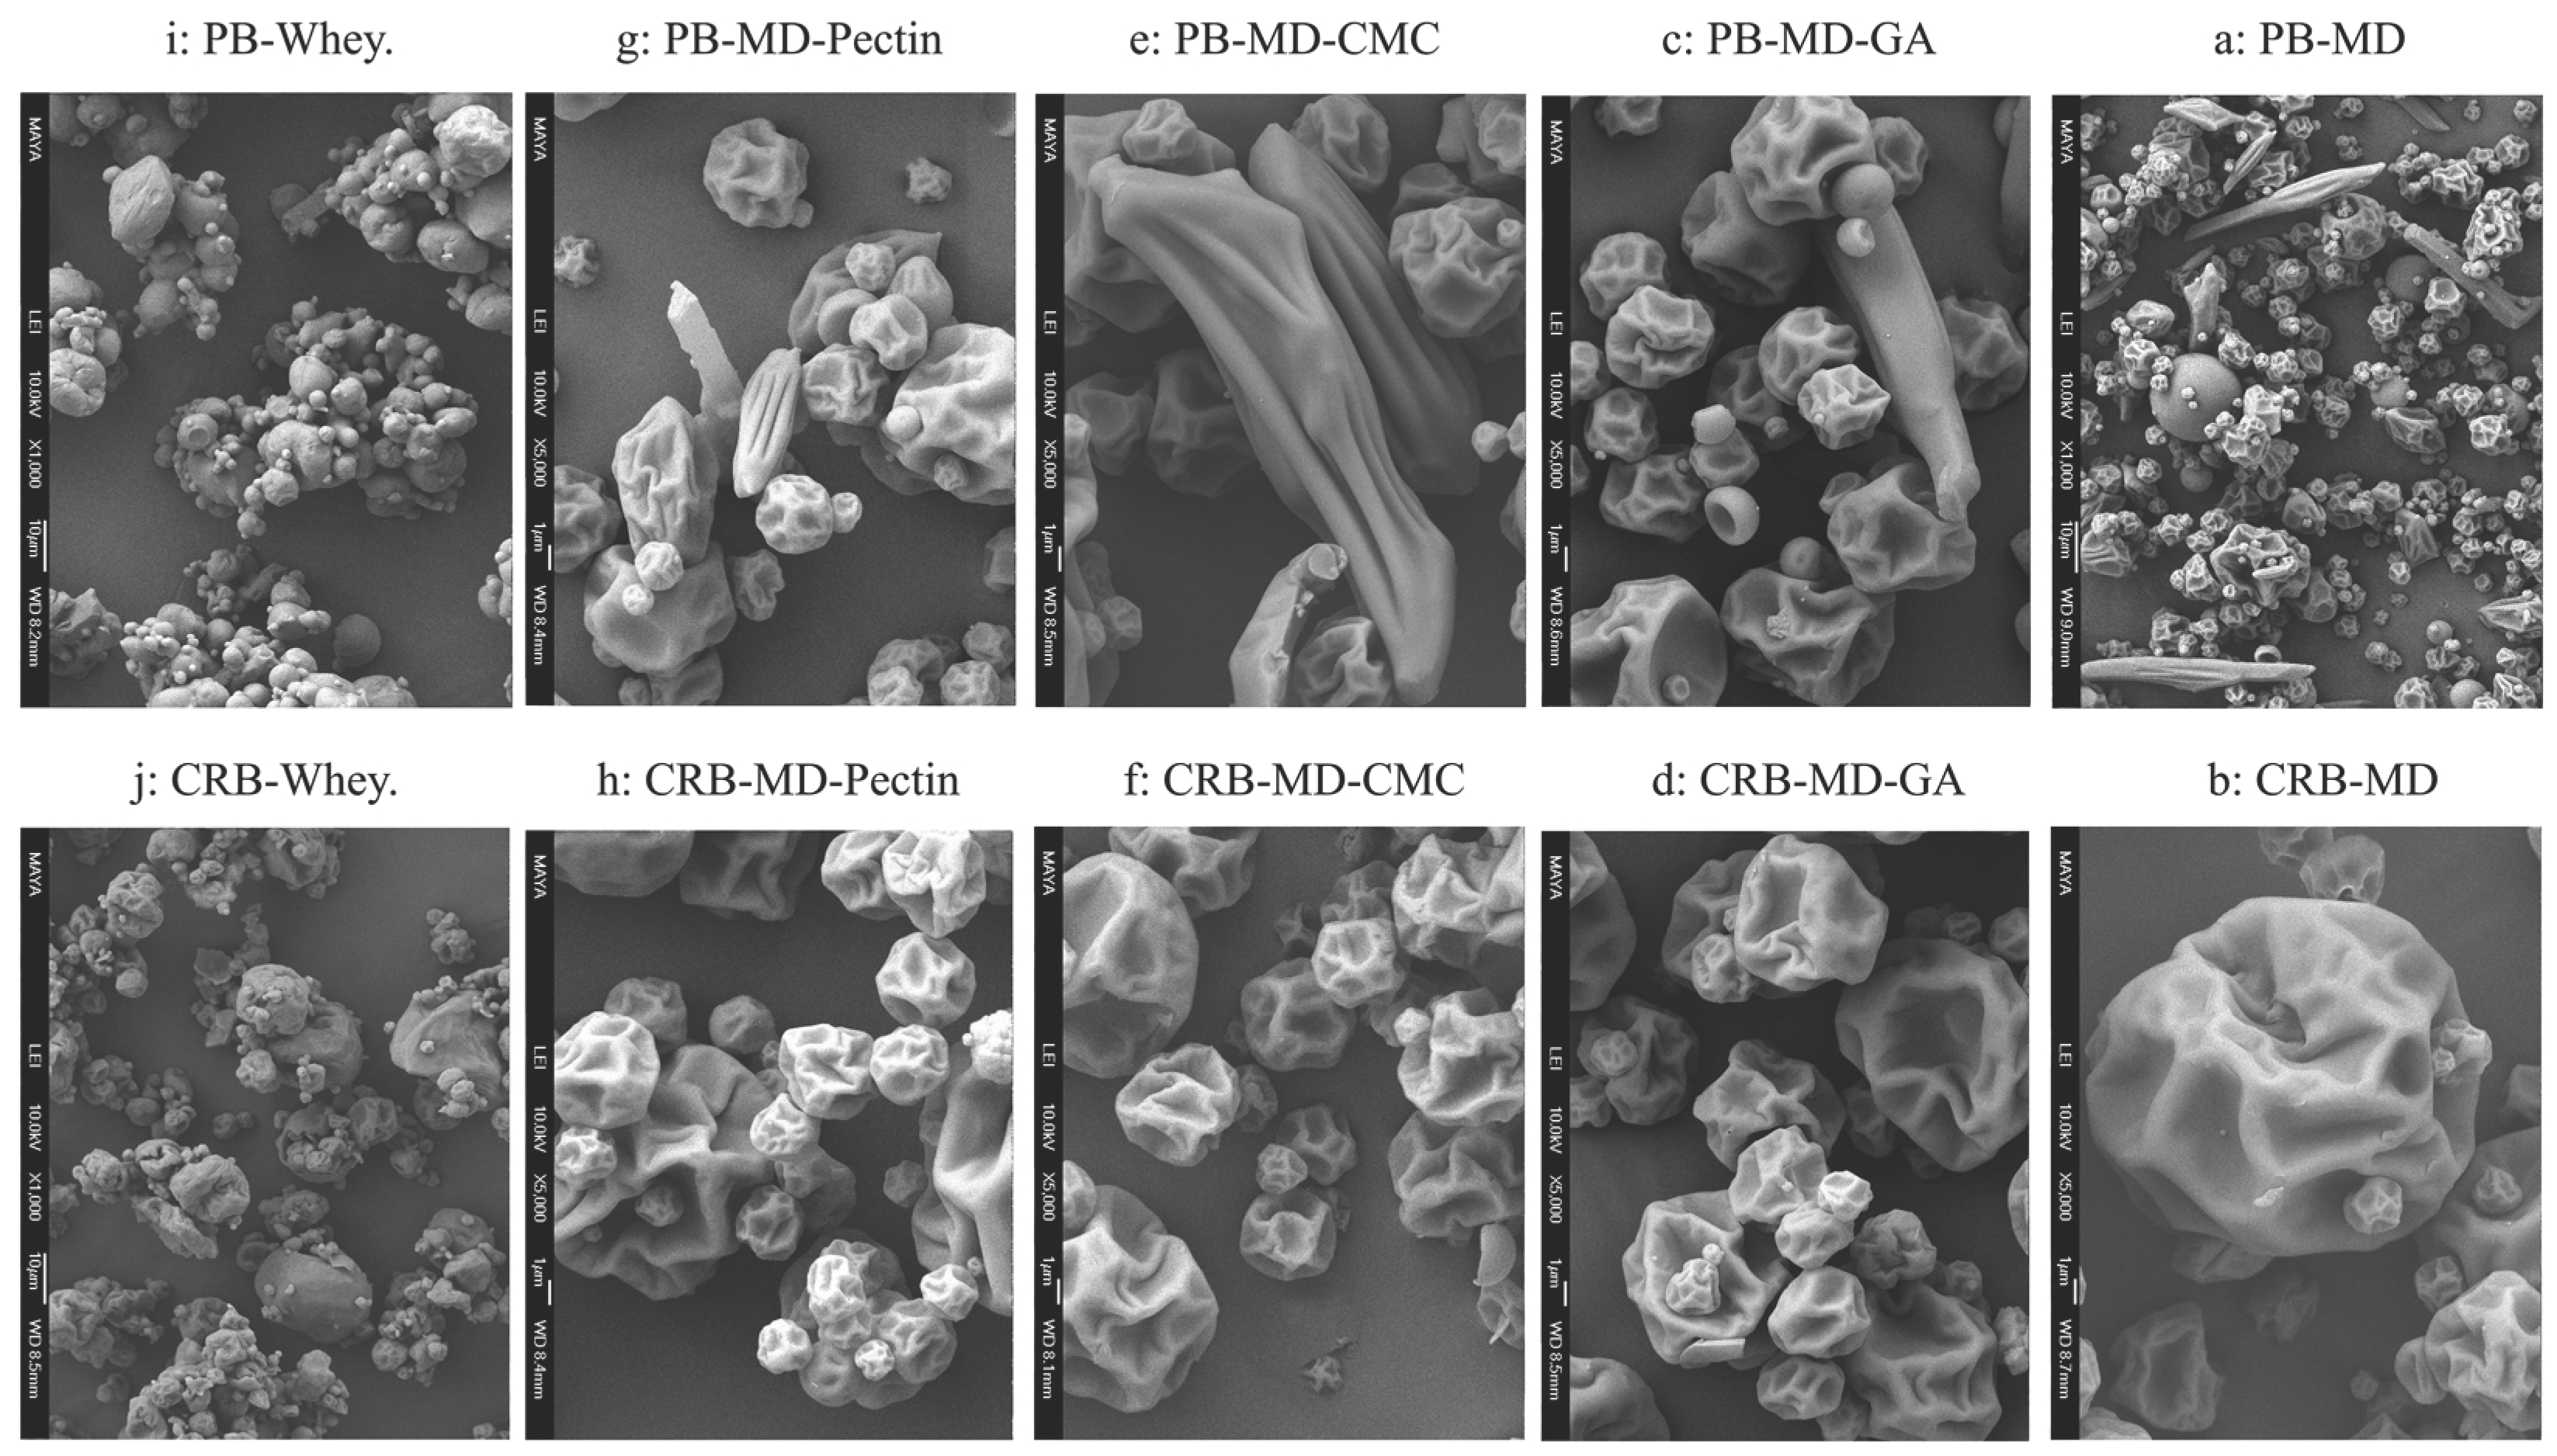
3.4.2. Morphological Characteristics by SEM
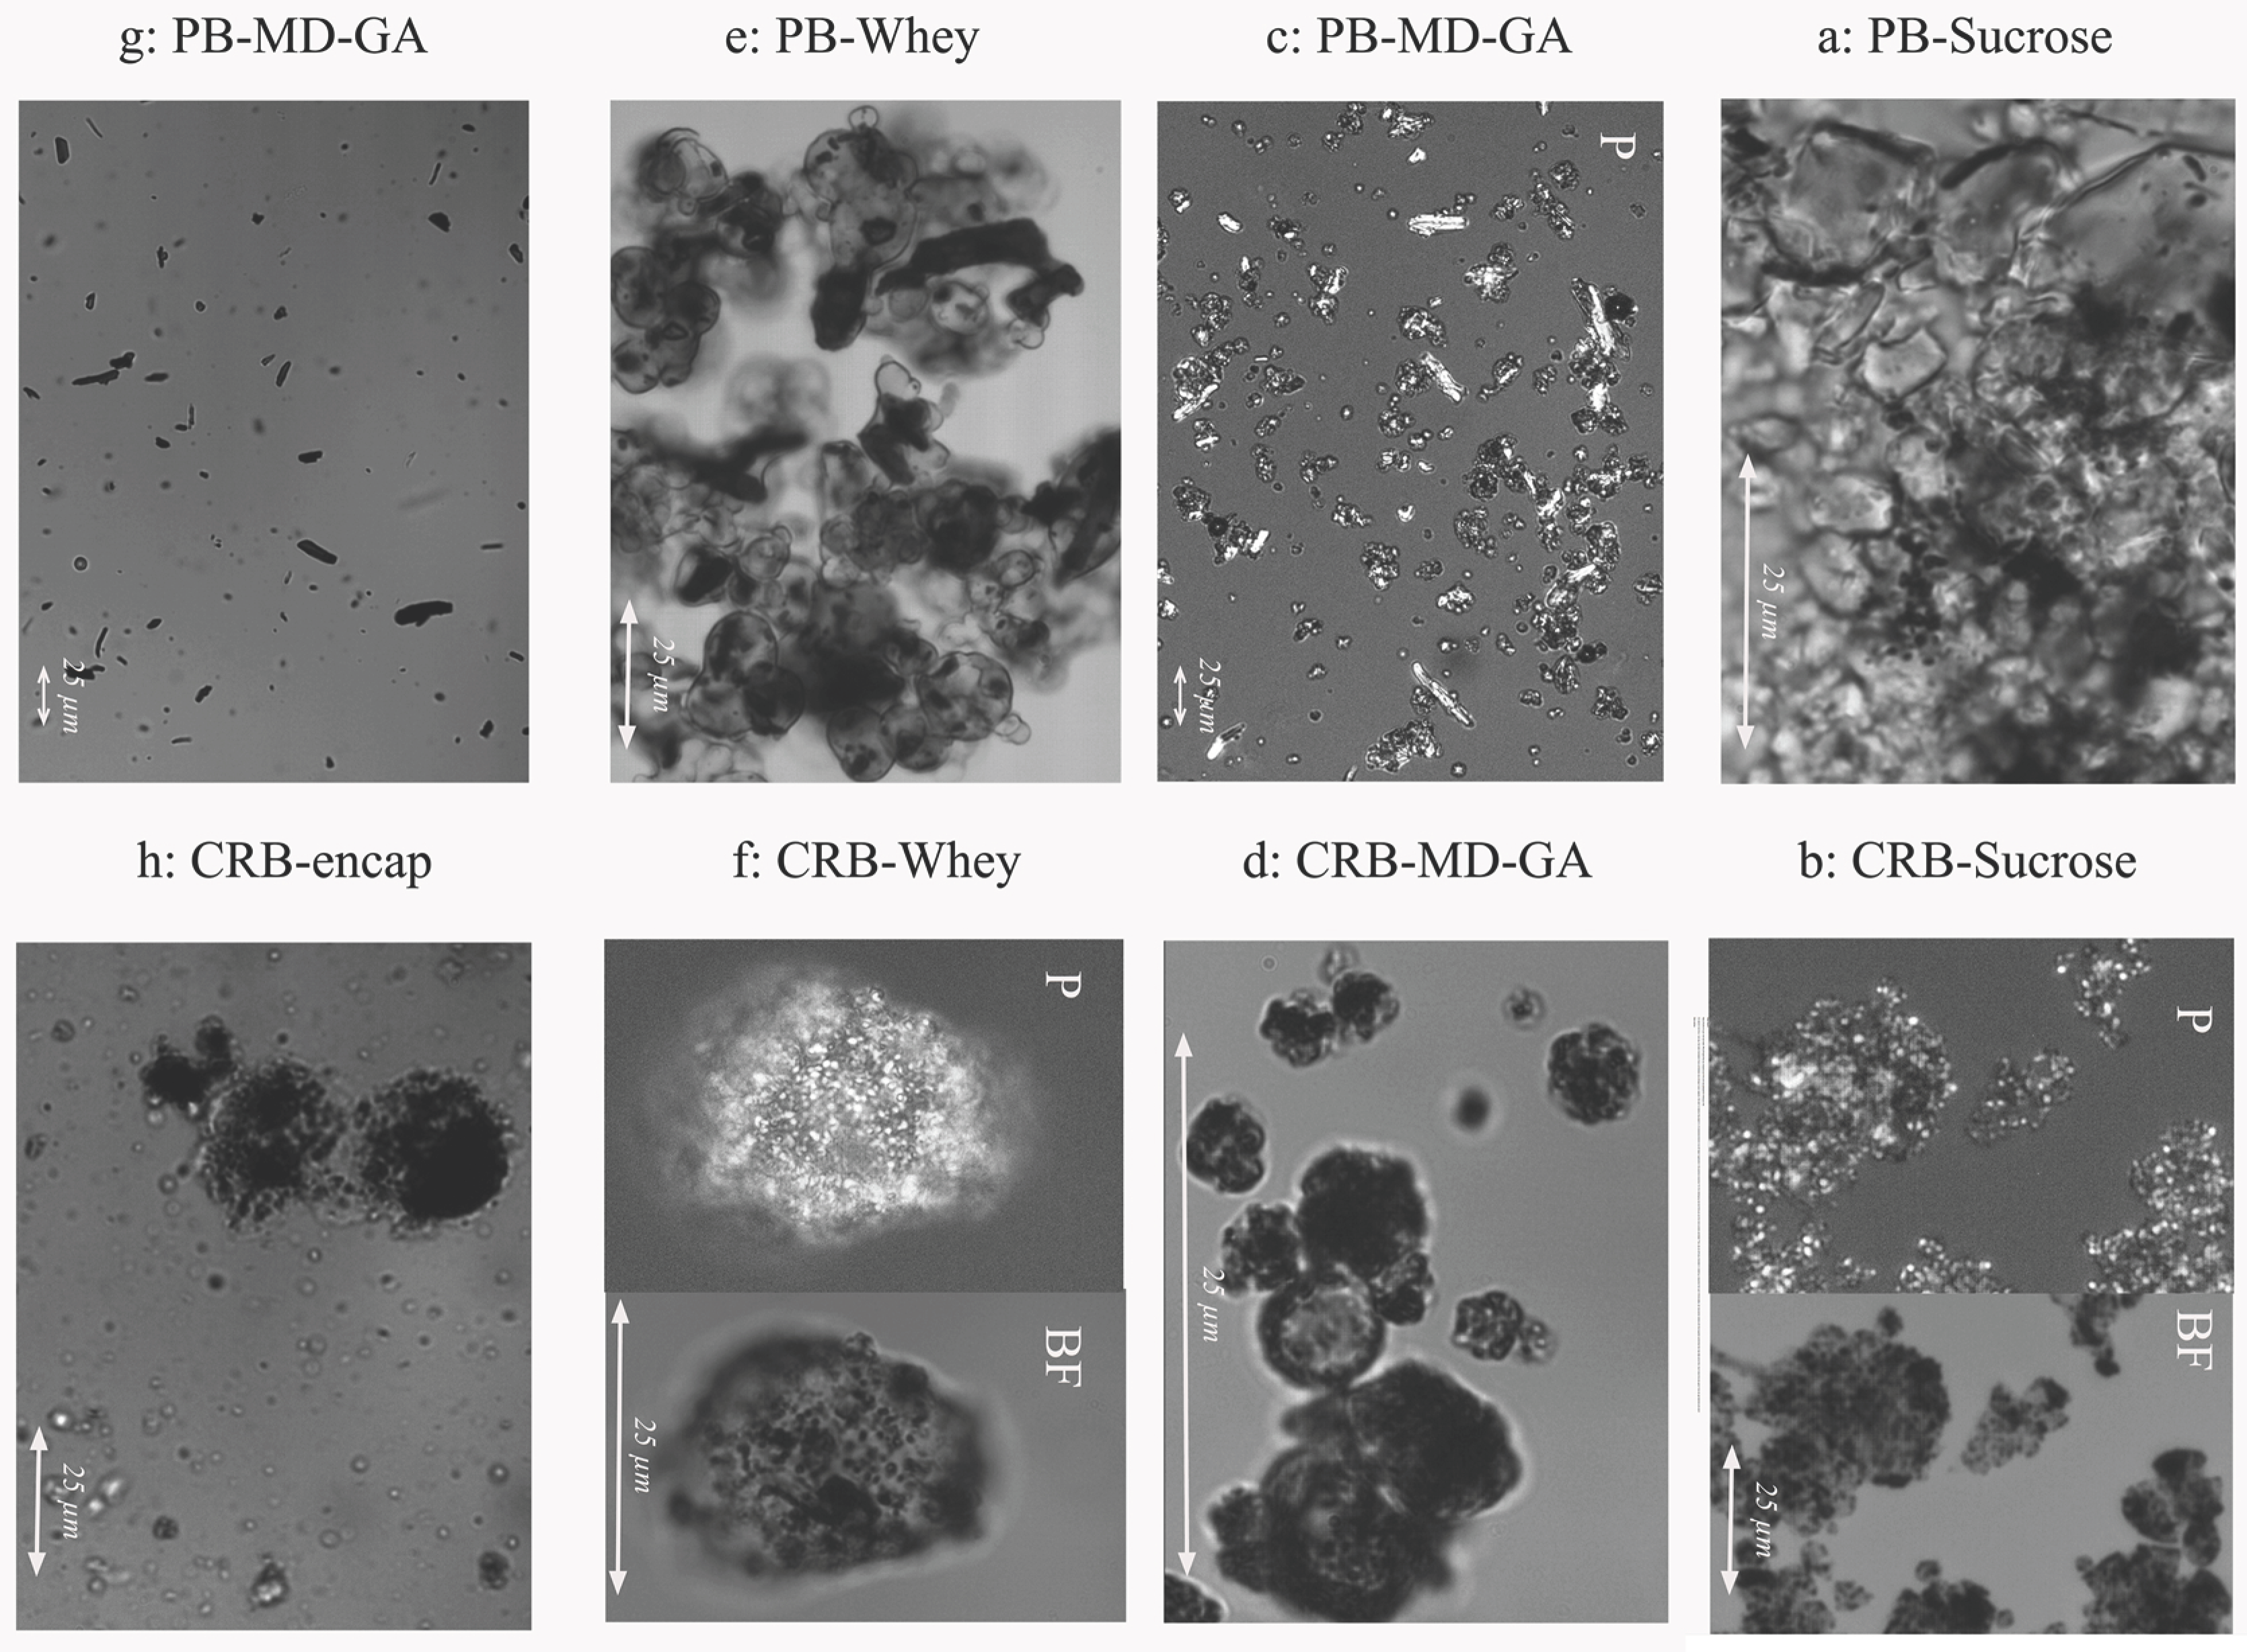
3.4.3. Microscopic Characteristics
3.5. Properties of Aqueous Dissolved Microcapsules
3.5.1. Colorimetric Properties
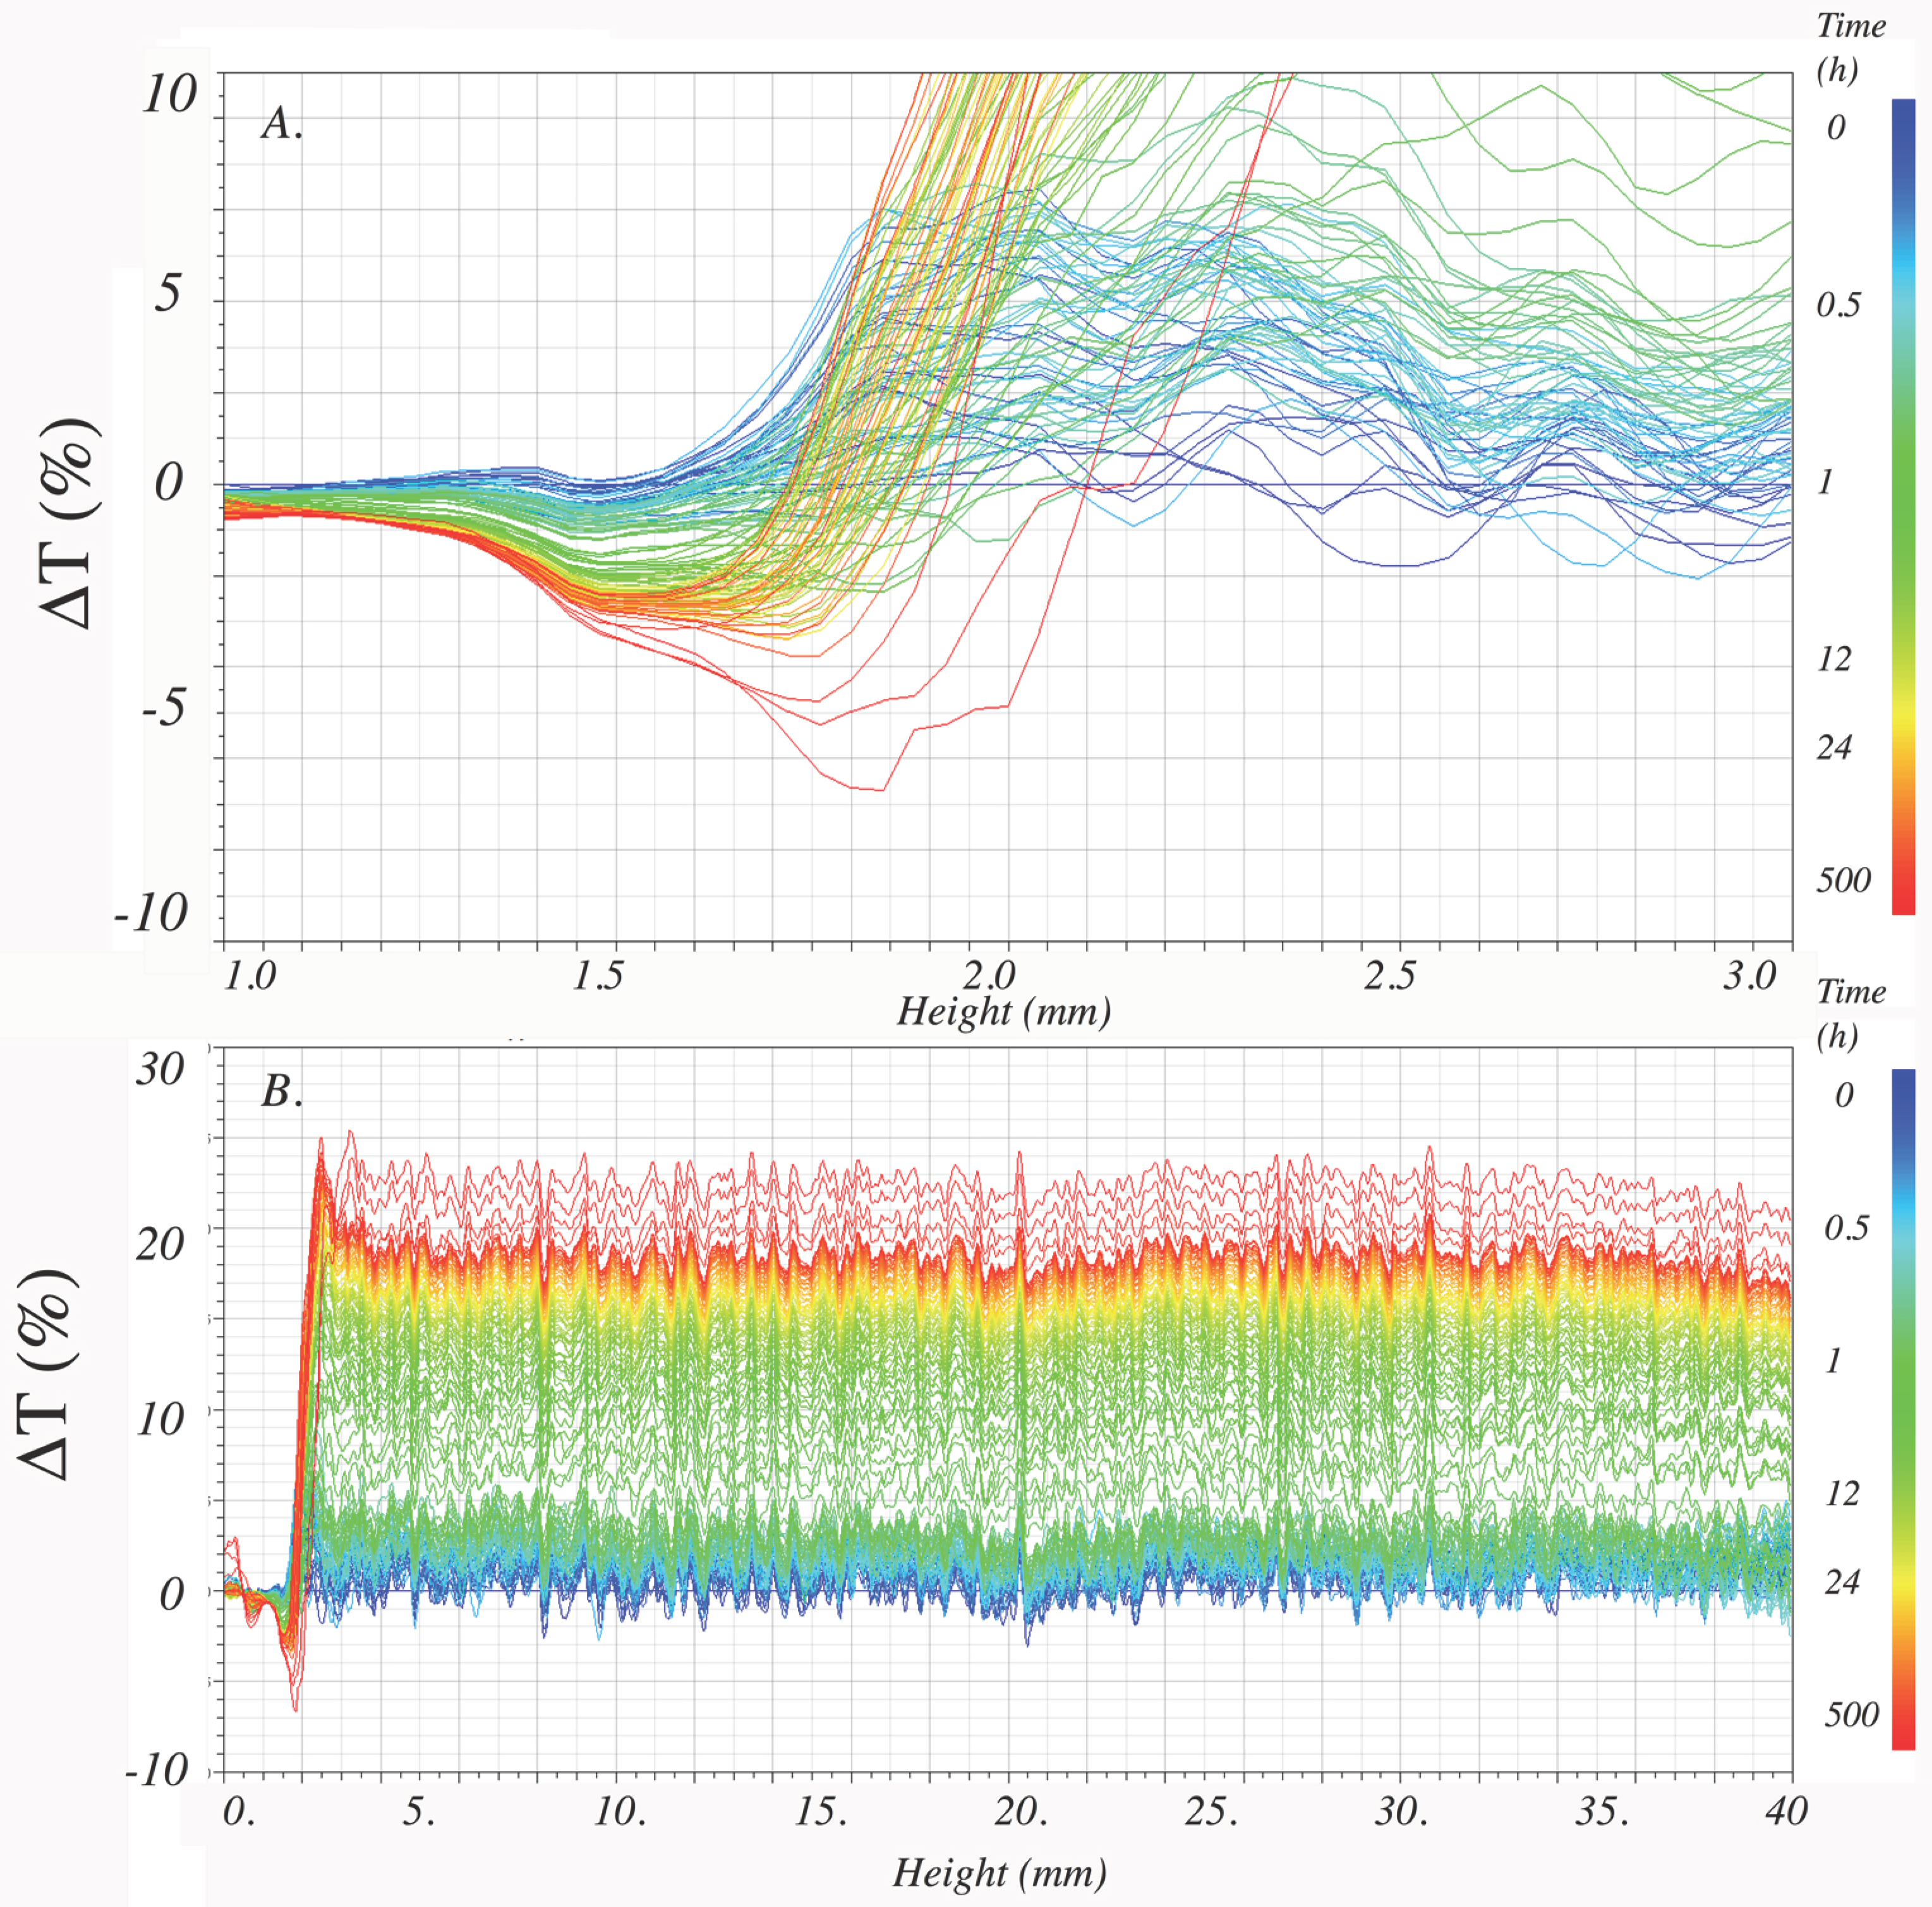
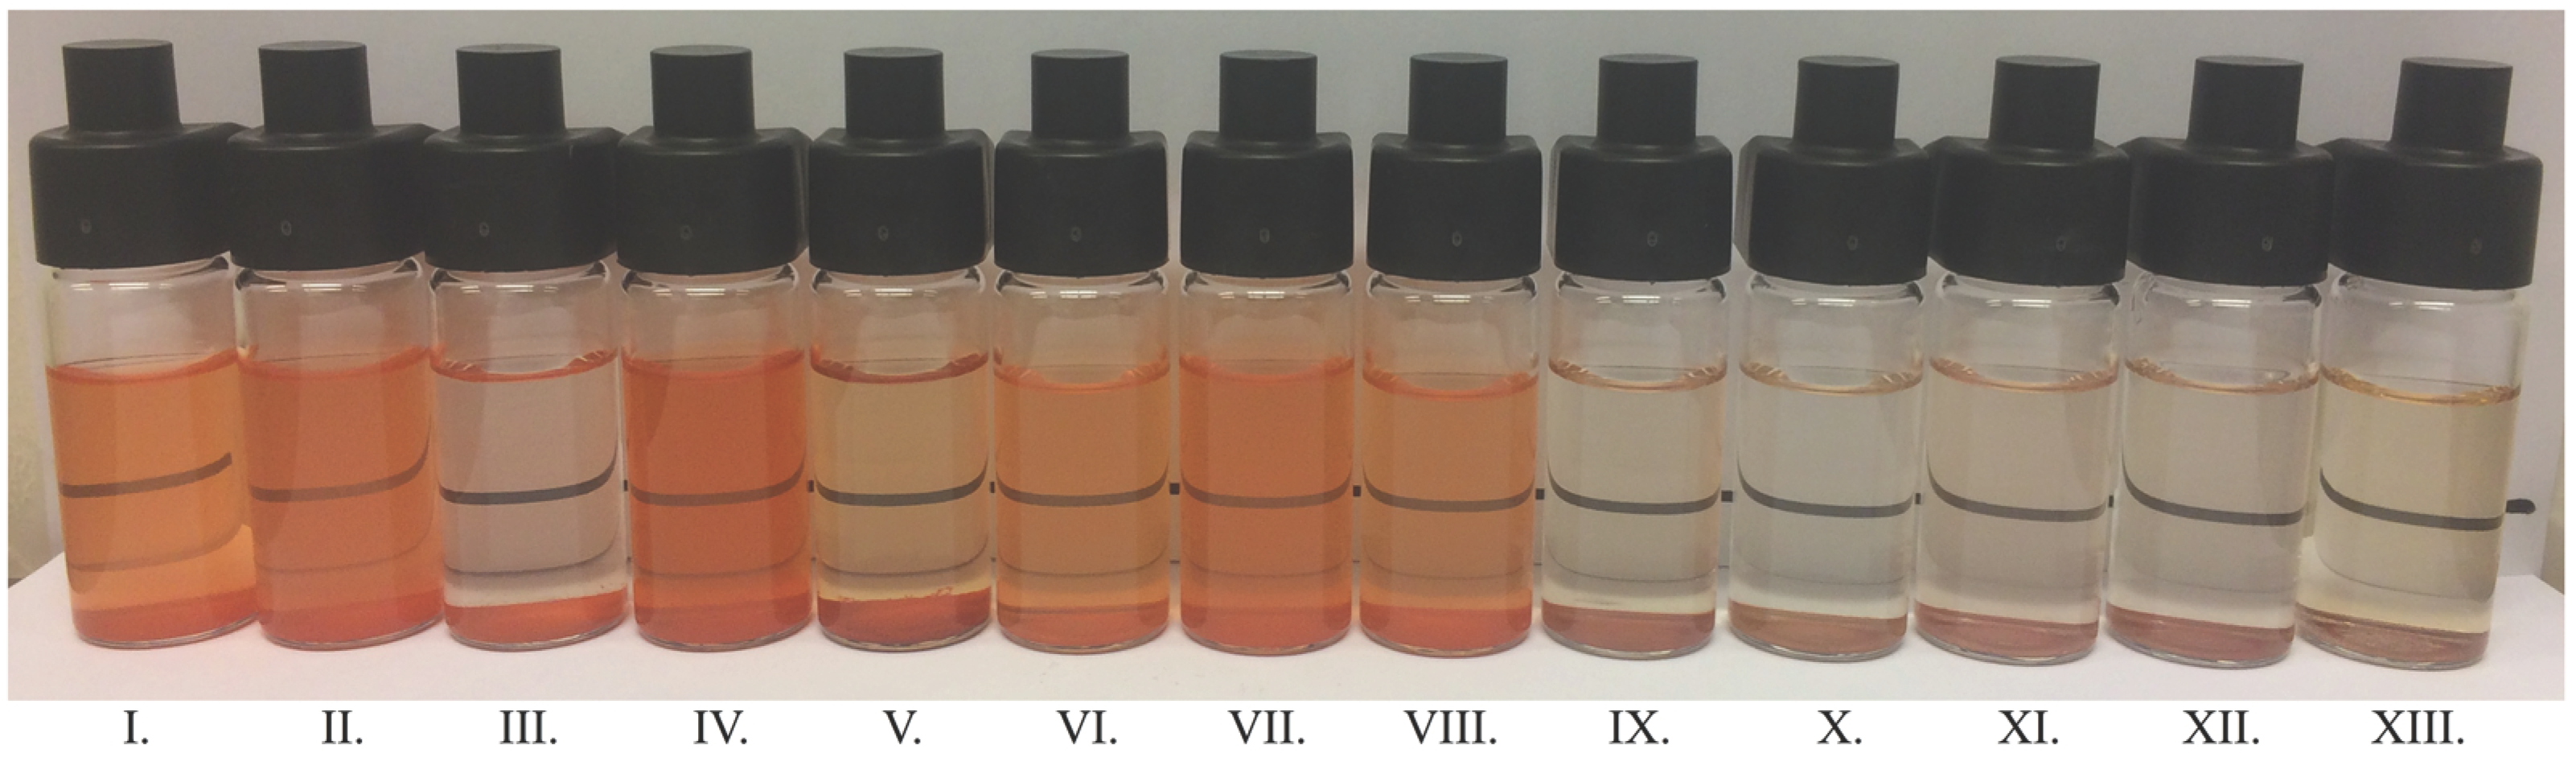
3.5.2. Physical Stability of Water Dispersions
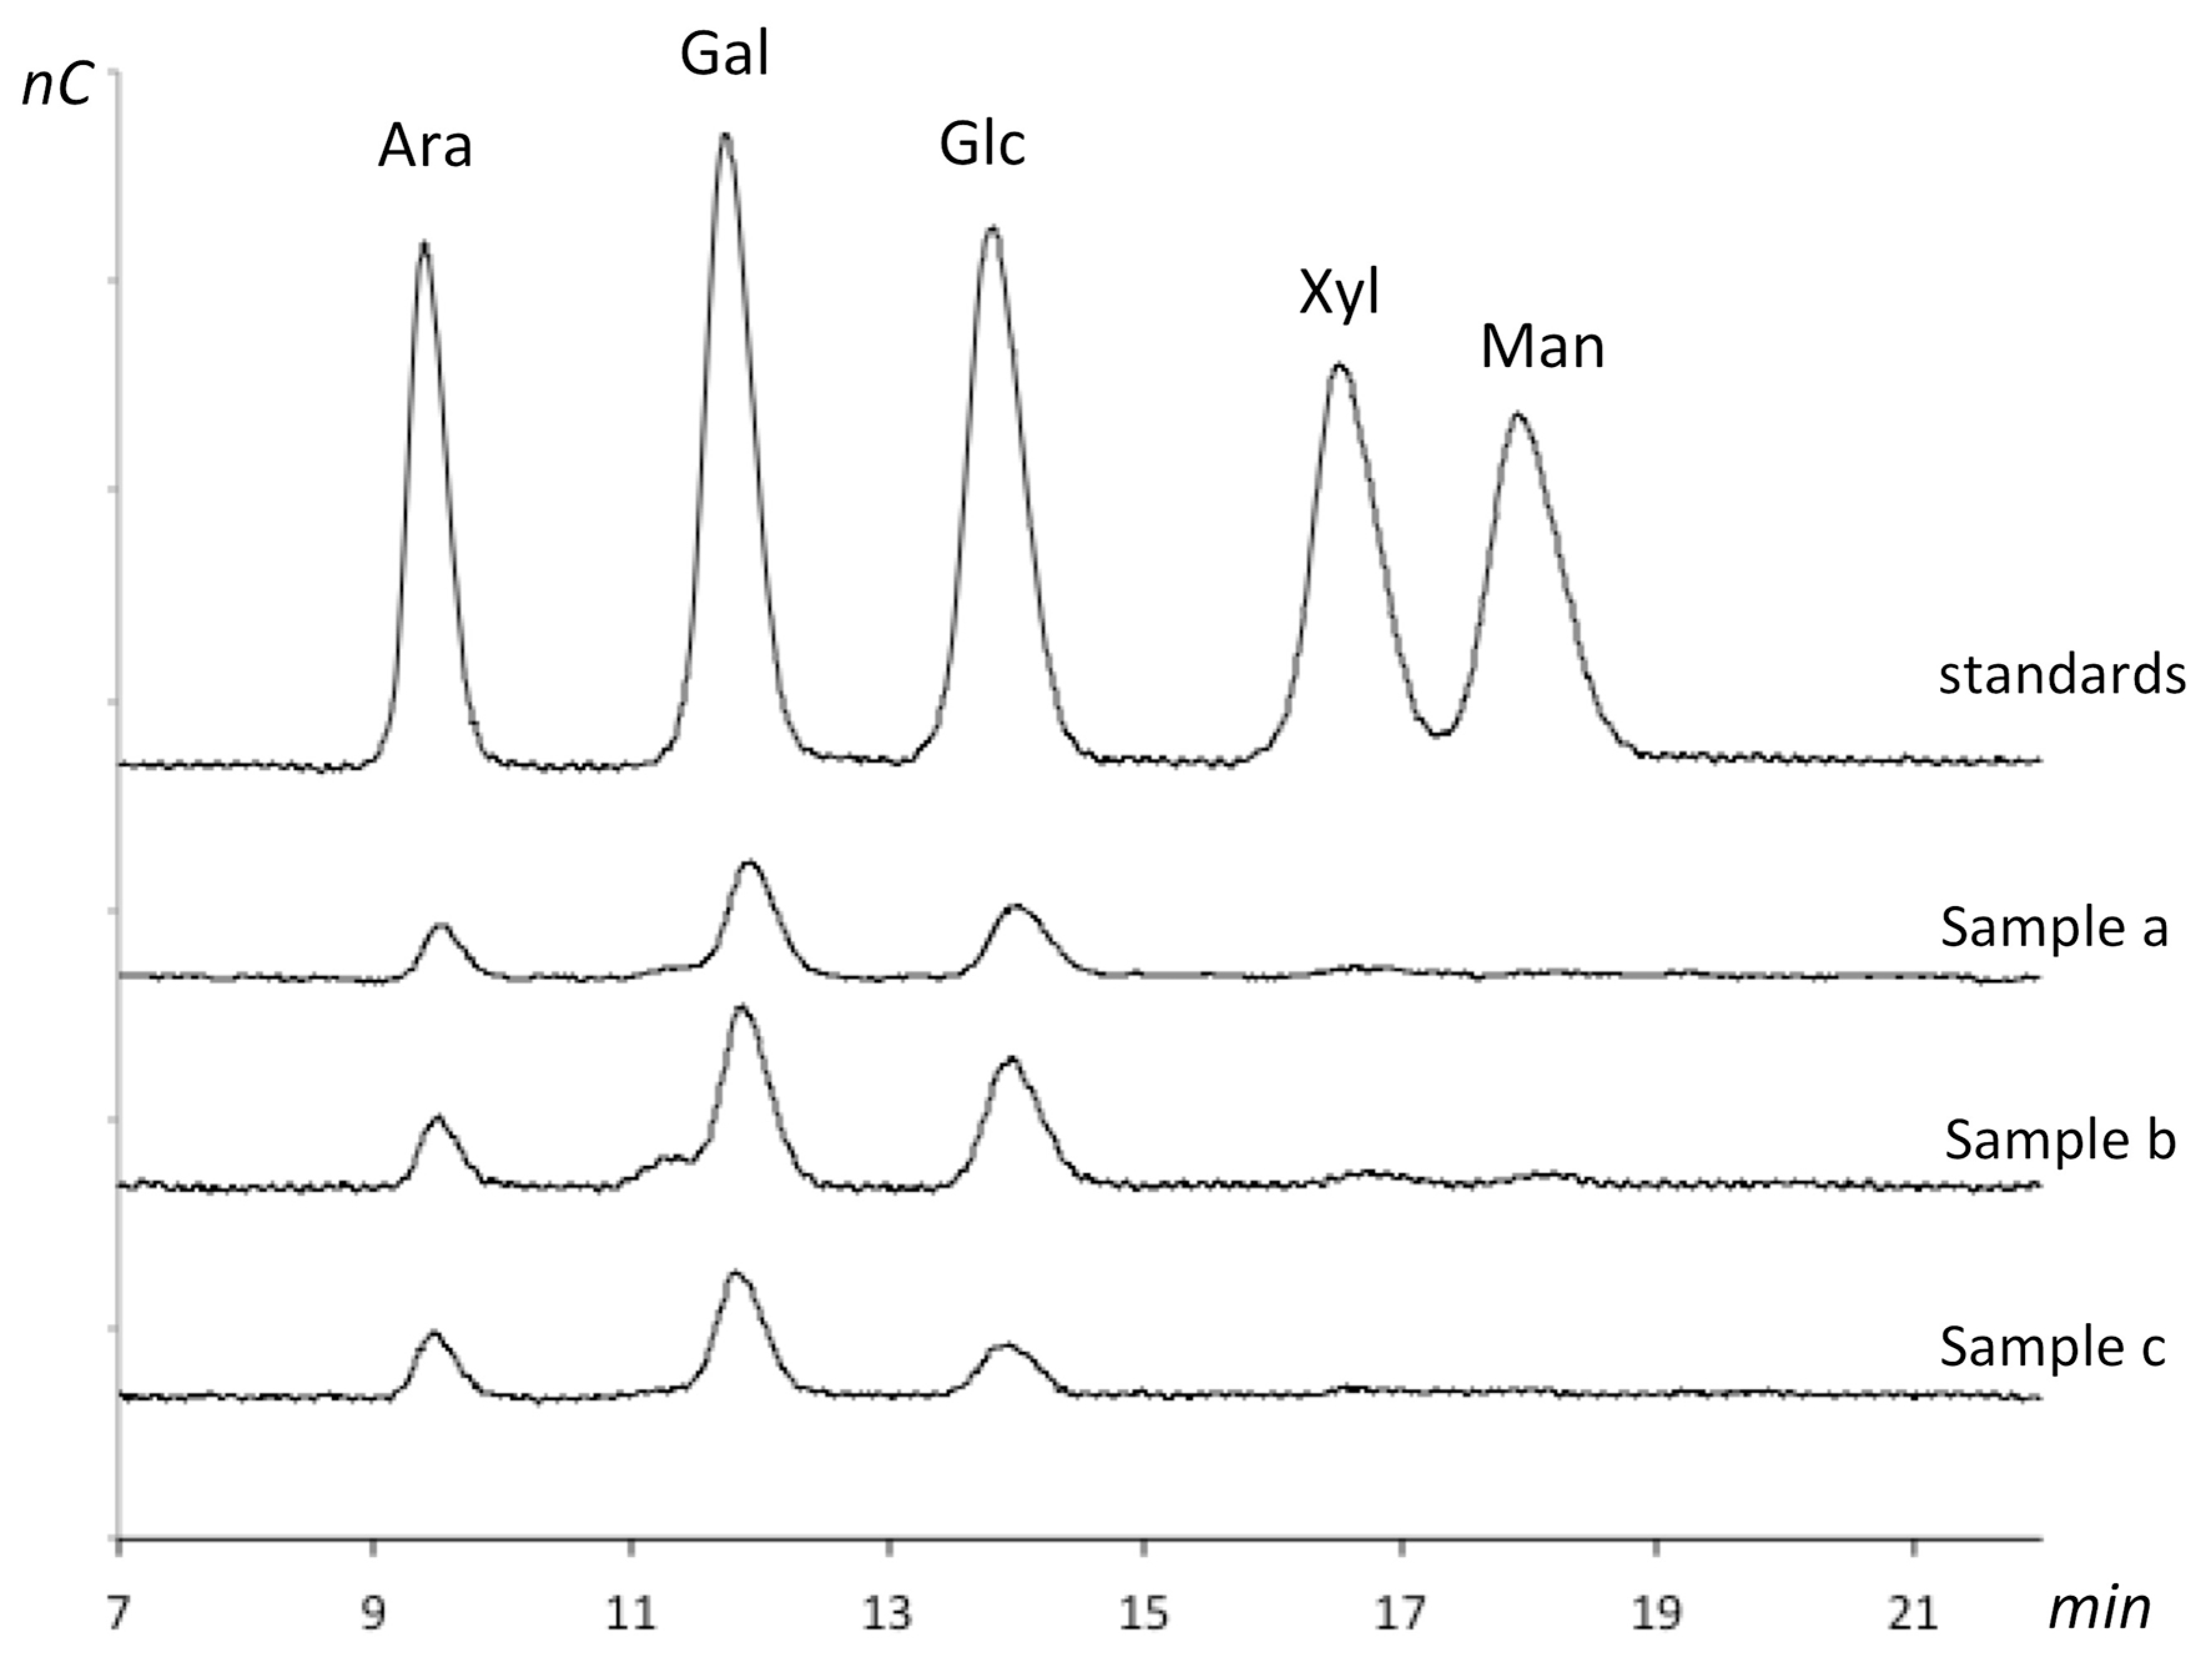
3.6. Chemical Composition of the Native Carbohydrate Fraction of the CRB
4. Discussion
5. Conclusions
Supplementary Materials
Author Contributions
Funding
Acknowledgments
Conflicts of Interest
Abbreviations
| PB | Pure Bixin |
| CRB | Carbohydrate Rich Bixin prior spray drying |
| CRB-encap | Carbohydrate Rich Bixin encapsulated (spray dried CRB) |
| PB-Sucrose | Pure Bixin-Sucrose |
| PB-MD | Pure Bixin-Maltodextrine |
| PB-MD-GA | Pure Bixin-Maltodextrine-Gum Arabic |
| PB-MD-CMC | Pure Bixin-Maltodextrine-Carboxylmethylcecllulose |
| PB-MD-Pectin | Pure Bixin-Maltodextrine-Pectin |
| PB-Whey | Pure Bixin-Whey |
| CRB-Sucrose | Carbohydrate Rich Bixin-Sucrose |
| CRB-MD | Carbohydrate Rich Bixin-Maltodextrine |
| CRB-MD-GA | Carbohydrate Rich Bixin-Maltodextrine-Gum Arabic |
| CRB-MD-CMC | Carbohydrate Rich Bixin-Maltodextrine-Carboxyl Methyl Cellulose |
| CRB-MD-Pectin | Carbohydrate Rich Bixin-Maltodextrine-Pectine |
| CRB-Whey | Carbohydrate Rich Bixin-Maltodextrine-Whey |
| CRB | Carbohydrate Rich Bixin |
| HPAEC-PAD | High Performance Anion-Exchange Chromatography Coupled with Pulsed Electrochemical Detection |
Appendix A
References
- McAvoy, S.A. Global regulations of food colors. Manuf. Confect. 2014, 94, 77–86. [Google Scholar]
- Satyanarayana, A.; Prabhakara, P.G. Chemistry, Processing and Toxicology of Annatto (Bixa orellana L.). J. Food Sci. Technol. 2003, 40, 131–141. [Google Scholar]
- Smith, J. In Proceedings of the 67th Joint FAO/WHO Expert Committee on Food Additives (JECFA) Meeting Annatto Extracts, Rome, Italy, 20–29 June 2006; pp. 1–21.
- Preston, H.D.; Rickard, M.D. Extraction and chemistry of annatto. Food Chem. 1980, 5, 47–56. [Google Scholar] [CrossRef]
- Green, C. Natural Colourants and Dyestuffs: A Review of Production, Markets and Development Potential; Food and Agriculture Organization of the United Nations: Rome, Italy, 1995. [Google Scholar]
- Commission Regulations (EU) No 1129/2011. Regulations: Amending Annex II Regulation (EC) No 1333/2008 of the European Parliament and of the Council by a Union List of Food Additives. Off. J. Eur. Union 2011, 295, 1–32. [Google Scholar]
- Amaral, L.; Cortelazzo, Â.; Buckeridge, M.; Pereira, L.; Pereira, M.F. Anatomical and biochemical changes in the composition of developing seed coats of annatto (Bixa orellana L.). Trees 2009, 23, 287–293. [Google Scholar] [CrossRef]
- Joint FAO/WHO Expert Committee on Food Additives. Compendium of Food Additive Specifications; Food and Agriculture Organization of the United Nation: Rome, Italy, 2006. [Google Scholar]
- Cardarelli, C.; Benassi, M.; Mercadante, A. Characterization of different annatto extracts based on antioxidant and colour properties. LWT-Food Sci. Technol. 2008, 41, 1689–1693. [Google Scholar] [CrossRef]
- Chiste, R.C.; Yamashita, F.; Gozzo, F.C.; Mercadante, A.Z. Simultaneous extraction and analysis by high performance liquid chromatography coupled to diode array and mass spectrometric detectors of bixin and phenolic compounds from annatto seeds. J. Chromatogr. A 2011, 1218, 57–63. [Google Scholar] [CrossRef] [Green Version]
- Rahmalia, W.; Fabre, J.F.; Usman, T.; Mouloungui, Z. Aprotic solvents effect on the UV-visible absorption spectra of bixin. Spectrochim. Acta A Mol. Biomol. Spectrosc. 2014, 131, 455–460. [Google Scholar] [CrossRef] [PubMed]
- Scotter, M. The chemistry and analysis of annatto food colouring: A review. Food Addit. Contam. Part A 2009, 26, 1123–1145. [Google Scholar] [CrossRef]
- Tennant, D.R.; O’Callaghan, M. Survey of usage and estimated intakes of annatto extracts. Food Res. Int. 2005, 38, 911–917. [Google Scholar] [CrossRef]
- Lauro, G.; Francis, J. Natural food Colorants: Science and Technology; CRC Press: New York, NY, USA, 2000. [Google Scholar]
- Satyanarayana, A.; Rao, P.P.; Rao, D.G. Influence of source and quality on the color characteristics of annatto dyes and formulations. LWT-Food Sci. Technol. 2010, 43, 1456–1460. [Google Scholar] [CrossRef]
- Najar, S.V.; Bobbio, F.O.; Bobbio, P.A. Effects of light, air, anti-oxidants and pro-oxidants on annatto extracts (Bixa orellana). Food Chem. 1988, 29, 283–289. [Google Scholar] [CrossRef]
- Gharsallaoui, A.; Roudaut, G.; Chambin, O.; Voilley, A.; Saurel, R. Applications of spray-drying in microencapsulation of food ingredients: An overview. Food Res. Int. 2007, 40, 1107–1121. [Google Scholar] [CrossRef]
- Barbosa, M.I.M.J.; Borsarelli, C.D.; Mercadante, A.Z. Light stability of spray-dried bixin encapsulated with different edible polysaccharide preparations. Food Res. Int. 2005, 38, 989–994. [Google Scholar] [CrossRef]
- Sousdaleff, M.; Baesso, M.L.; Medina Neto, A.; Nogueira, A.C.; Marcolino, V.A.; Matioli, G. Microencapsulation by freeze-drying of potassium norbixinate and curcumin with maltodextrin: Stability, solubility, and food application. J. Agric. Food Chem. 2013, 61, 955–965. [Google Scholar] [CrossRef]
- Zhang, Y.; Zhong, Q. Encapsulation of bixin in sodium caseinate to deliver the colorant in transparent dispersions. Food Hydrocoll. 2013, 33, 1–9. [Google Scholar] [CrossRef]
- Yadav, M.P.; Johnston, D.B.; Hicks, K.B. Corn fiber gum: New structure/function relationships for this potential beverage flavor stabilizer. Food Hydrocoll. 2009, 23, 1488–1493. [Google Scholar] [CrossRef]
- Ebringerová, A. Structural diversity and application potential of hemicelluloses. Macromol. Symp. 2005, 232, 1–12. [Google Scholar]
- Mikkonen, K.; Yadav, M.; Cooke, P.; Willför, S.; Hicks, K.; Tenkanen, M. Films from spruce galactoglucomannan blended with poly (vinyl alcohol), corn arabinoxylan, and konjac glucomannan. BioResources 2008, 3, 178–191. [Google Scholar]
- Hansen, N.; Plackett, D. Sustainable films and coatings from hemicelluloses: A review. Biomacromolecules 2008, 9, 1493–1505. [Google Scholar] [CrossRef]
- Tatar, F.; Tunç, M.T.; Dervisoglu, M.; Cekmecelioglu, D.; Kahyaoglu, T. Evaluation of hemicellulose as a coating material with gum arabic for food microencapsulation. Food Res. Int. 2014, 57, 168–175. [Google Scholar] [CrossRef]
- Berton-Carabin, C.C.; Schroën, K. Pickering emulsions for food applications: Background, trends, and challenges. Annu. Rev. Food Sci. Technol. 2015, 6, 263–297. [Google Scholar] [CrossRef] [PubMed]
- Mcclements, D.J. Critical review of techniques and methodologies for characterization of emulsion stability. Crit. Rev. Food Sci. Nutr. 2007, 47, 611–649. [Google Scholar] [CrossRef]
- Rios, A.; Mercadante, A. Otimização das Condições para Obtenção de Padrão de Bixina e das etapas de Extração e Saponificação para Quantificação de Bixina em “Snacks” extrusados por CLAE. Alim. Nutr. 2004, 15, 203–213. [Google Scholar]
- Jafari, S.M.; Assadpoor, E.; He, Y.; Bhandari, B. Encapsulation efficiency of food flavours and oils during spray drying. Dry. Technol. 2008, 26, 816–835. [Google Scholar] [CrossRef]
- Balch, R. Measurement of turbidity with a spectrophotometer. Ind. Eng. Chem. Anal. Ed. 1931, 3, 124–127. [Google Scholar] [CrossRef]
- Gil-Ramirez, A.; Salas-Veizaga, D.M.; Grey, C.; Karlsson, E.N.; Rodriguez-Meizoso, I.; Linares-Pastén, J.A. Integrated process for sequential extraction of saponins, xylan and cellulose from quinoa stalks (Chenopodium quinoa Willd.). Ind. Crops Prod. 2018, 121, 54–65. [Google Scholar] [CrossRef]
- Faryar, R.; Linares-Pastén, J.; Immerzeel, P.; Mamo, G.; Andersson, M.; Stålbrand, H.; Mattiasson, B.; Karlsson, E. Production of prebiotic xylooligosaccharides from alkaline extracted wheat straw using the K80R-variant of a thermostable alkali-tolerant xylanase. Food Bioprod. Process. 2015, 93, 1–10. [Google Scholar] [CrossRef]
- Salas-Veizaga, D.M.; Villagomez, R.; Linares-Pastén, J.A.; Carrasco, C.; Álvarez, M.T.; Adlercreutz, P.; Nordberg Karlsson, E. Extraction of glucuronoarabinoxylan from quinoa stalks (Chenopodium quinoa Willd.) and evaluation of xylooligosaccharides produced by GH10 and GH11 xylanases. J. Agric. Food Chem. 2017, 65, 8663–8673. [Google Scholar] [CrossRef]
- Lobato, K.B.; Paese, K.; Forgearini, J.C.; Guterres, S.S.; Jablonski, A.; Rios Ade, O. Characterisation and stability evaluation of bixin nanocapsules. Food Chem. 2013, 141, 3906–3912. [Google Scholar] [CrossRef] [Green Version]
- Nachtigall, A.; Ibrahim Silva, P.; Corrêa Bertoldi, M.; Stringheta, P.C. Estudo da saponificação em pigmentos de urucum. Ciência e Tecnologia de Alimentos 2009, 29. [Google Scholar] [CrossRef]
- Silva, P.I.; Nachtigall, A.M.; Stringheta, P.C. Fatores que influenciam a reação de saponificação dos carotenóides presentes no urucum (Bixa orellana L.). Ciência e agrotecnologia 2009, 33, 1892–1897. [Google Scholar] [CrossRef]
- Embuscado, M.; Huber, K. Edible Films and Coatings for Food Applications; Springer: New York, NY, USA, 2009. [Google Scholar]
- Kuang, P.; Zhang, H.; Bajaj, P.R.; Yuan, Q.; Tang, J.; Chen, S.; Sablani, S.S. Physicochemical properties and storage stability of lutein microcapsules prepared with maltodextrins and sucrose by spray drying. J. Food Sci. 2015, 80, E359–E369. [Google Scholar] [CrossRef] [PubMed]
- Hollabaugh, C.; Burt, L.; Walsh, A. Carboxymethylcellulose. Uses and applications. Ind. Eng. Chem. 1945, 37, 943–947. [Google Scholar] [CrossRef]
- Dickinson, E. Hydrocolloids at interfaces and the influence on the properties of dispersed systems. Food Hydrocoll. 2003, 17, 25–39. [Google Scholar] [CrossRef]
- El-Sayed, M.M. An arabinogalactan from the seeds of Pseudium guava. Carbohydr. Res. 1981, 98, 209–212. [Google Scholar] [CrossRef]
- Palacios-Fonseca, A.; Castro-Rosas, J.; Gómez-Aldapa, C.; Tovar-Benítez, T.; Millán-Malo, B.; Del Real, A.; Rodríguez-García, M. Effect of the alkaline and acid treatments on the physicochemical properties of corn starch. CyTA-J. FOOD 2013, 11 (Suppl. 1), 67–74. [Google Scholar] [CrossRef] [Green Version]


| System | Bixin | Native Carbohydrates | Sucrose | MD | Whey | CMC | Pectin | GA | Na2CO3 |
|---|---|---|---|---|---|---|---|---|---|
| PB-Sucrose | 9.7% | 87.6% | 2.6% | ||||||
| PB-MD | 9.7% | 87.6% | 2.6% | ||||||
| PB-MD-GA | 9.7% | 73.0% | 14.6% | 2.6% | |||||
| PB-MD-CMC | 9.7% | 86.7% | 1.0% | 2.6% | |||||
| PB-MD-Pectin | 9.7% | 82.8% | 4.9% | 2.6% | |||||
| PB-Whey | 9.7% | 87.6% | 2.6% | ||||||
| CRB-Sucrose | 11.9% | 11.9% | 71.3% | 4.9% | |||||
| CRB-MD | 11.9% | 11.9% | 71.3% | 4.9% | |||||
| CRB-MD-GA | 11.9% | 11.9% | 57.0% | 14.3% | 4.9% | ||||
| CRB-MD-CMC | 11.9% | 11.9% | 70.3% | 1.0% | 4.9% | ||||
| CRB-MD-Pectin | 11.9% | 11.9% | 66.5% | 4.8% | 4.9% | ||||
| CRB-Whey | 11.9% | 11.9% | 71.2% | 5.1% | |||||
| CRB | 50% | 50% |
| Sample | TB (%) | Wa | Sample | TB (%) | Wa | ||||||
|---|---|---|---|---|---|---|---|---|---|---|---|
| CRB * | 36.0 ± 1.60 | -- | (1) | 74.5 | nd | CRB-encap | 49.3 ± 2.14 | 0.41 | (1) | 8.86 | 0.19 |
| (2) | 42.4 | -- | (2) | 6.57 | -- | ||||||
| PB-Sucrose | 6.2 ± 0.41 | 0.37 | (1) | 7.44 | nd | CRB-Sucrose | 8.46 ± 0.11 | 0.30 | (1) | 7.62 | 0.23 |
| (2) | 6.45 | -- | (2) | 17.54 | -- | ||||||
| PB-MD | 8.8 ± 1.31 | 0.39 | (1) | 10.25 | nd | CRB-MD | 9.62 ± 0.58 | 0.27 | (1) | 4.54 | 0.31 |
| (2) | 4.23 | -- | (2) | 4.72 | -- | ||||||
| PB-MD-GA | 8.4 ± 0.62 | 0.38 | (1) | 15.69 | nd | CRB-MD-GA | 9.63 ± 0.23 | 0.29 | (1) | 4.78 | 0.25 |
| (2) | 4.23 | -- | (2) | 5.09 | -- | ||||||
| PB-MD-CMC | 6.5 ± 1.56 | 0.41 | (1) | 11.46 | nd | CRB-MD-CMC | 7.34 ± 0.12 | 0.28 | (1) | 7.94 | 0.24 |
| (2) | 10.85 | -- | (2) | -- | -- | ||||||
| PB-MD-Pectin | 7.4 ± 0.29 | 0.38 | (1) | 16.34 | nd | CRB-MD-Pectin | 7.79 ± 0.25 | 0.33 | (1) | 7.24 | 0.85 |
| (2) | 11.90 | -- | (2) | 7.63 | -- | ||||||
| PB-Whey | 7.5 ± 0.79 | 0.34 | (1) | 9.84 | nd | CRB-Whey | 6.62 ± 0.16 | 0.30 | (1) | 7.85 | nd |
| (2) | 12.71 | -- | (2) | 11.46 | -- | ||||||
| Sample | Colorimetry | t at 600 nm | ||
|---|---|---|---|---|
| a | b | L | ||
| CRB | 54.29 | 10.50 | 50.34 | -- |
| CRB-encap | 52.77 | 13.19 | 66.24 | 0.22 |
| PB-Sucrose | 45.01 | 12.07 | 46.13 | 0.41 |
| CRB-Sucrose | 41.90 | 20.31 | 56.47 | 0.38 |
| PB-MD | 48.06 | 10.67 | 53.70 | 0.52 |
| CRB-MD | 44.00 | 19.38 | 72.62 | 0.23 |
| PB-MD-GA | 48.98 | 8.15 | 40.29 | 0.41 |
| CRB-MD-GA | 43.40 | 18.50 | 67.00 | 0.23 |
| PB-MD-CMC | 5.63 | 9.30 | 58.81 | 0.34 |
| CRB-MD-CMC | 53.20 | 11.10 | 44.68 | 0.17 |
| PB-MD-Pectin | 53.63 | 6.28 | 40.46 | 0.28 |
| CRB-MD-Pectin | 47.69 | 14.21 | 59.06 | 0.19 |
| PB-Whey | 48.62 | 8.05 | 39.09 | 0.39 |
| CRB-Whey | 48.21 | 13.89 | 39.72 | 0.24 |
| Sample | TSI | |||||
|---|---|---|---|---|---|---|
| R | 20 min | 2 days | 8 days | 23 days | 40 days | |
| CRB | (1) | 3.7 | 55.7 | 63.0 | 66.6 | 67.8 |
| (2) | 7.8 | 38.4 | 42.4 | 55.5 | 72.0 | |
| CRB-encap | (1) | 2.2 | 22.8 | 28.9 | 32.4 | 33.5 |
| PB-Sucrose | (1) | 1.1 | 15.7 | 22.2 | 25.1 | -- |
| CRB-Sucrose | (1) | 0.7 | 17.5 | 25.7 | 34.2 | 39.3 |
| PB-MD | (1) | 0.9 | 23.0 | 31.1 | 34.7 | -- |
| (2) | 1.0 | 39.4 | 56.0 | 67.2 | -- | |
| CRB-MD | (1) | 1.3 | 17.2 | 22.2 | 27.2 | 30.3 |
| PB-MD-GA | (1) | 1.2 | 22.5 | 27.9 | 29.8 | -- |
| (2) | 2.0 | 22.8 | 48.8 | 65.3 | -- | |
| CRB-MD-GA | (1) | 1.0 | 15.5 | 20.5 | 24.8 | 28.4 |
| PB-MD-CMC | (1) | 1.9 | 24.3 | 27.1 | 29.1 | -- |
| CRB-MD-CMC | (1) | 1.6 | 18.1 | 22.9 | 26.6 | 28.7 |
| PB-MD-Pectin | (1) | 1.9 | 21.0 | 23.6 | -- | -- |
| CRB-MD-Pectin | (1) | 1.8 | 20.1 | 24.9 | 29.3 | 32.6 |
| PB-Whey | (1) | 1.9 | 25.0 | 28.6 | 31.1 | -- |
| CRB-Whey | (1) | 0.8 | 48.0 | 48.7 | 49.7 | 49.9 |
| Enzyme | Activity (Abs/14 h) |
|---|---|
| endo-arabinase | nd |
| α-amylase | 2.615 |
| Cellulase | nd |
| xylanase | 0.038 |
© 2019 by the authors. Licensee MDPI, Basel, Switzerland. This article is an open access article distributed under the terms and conditions of the Creative Commons Attribution (CC BY) license (http://creativecommons.org/licenses/by/4.0/).
Share and Cite
Curi-Borda, C.K.; Linares-Pastén, J.A.; Tat, T.; Tarqui-Dueñas, R.; Chino-Flores, N.; Alvarado, J.-A.; Bergenstahl, B. Multilayer Bixin Microcapsules: The Impact of Native Carbohydrates on the Microencapsulation Efficiency and Dispersion Stability. Foods 2019, 8, 108. https://doi.org/10.3390/foods8030108
Curi-Borda CK, Linares-Pastén JA, Tat T, Tarqui-Dueñas R, Chino-Flores N, Alvarado J-A, Bergenstahl B. Multilayer Bixin Microcapsules: The Impact of Native Carbohydrates on the Microencapsulation Efficiency and Dispersion Stability. Foods. 2019; 8(3):108. https://doi.org/10.3390/foods8030108
Chicago/Turabian StyleCuri-Borda, Cecilia K., Javier A. Linares-Pastén, Tuba Tat, Rosmery Tarqui-Dueñas, Ninoska Chino-Flores, Juan-Antonio Alvarado, and Bjorn Bergenstahl. 2019. "Multilayer Bixin Microcapsules: The Impact of Native Carbohydrates on the Microencapsulation Efficiency and Dispersion Stability" Foods 8, no. 3: 108. https://doi.org/10.3390/foods8030108
APA StyleCuri-Borda, C. K., Linares-Pastén, J. A., Tat, T., Tarqui-Dueñas, R., Chino-Flores, N., Alvarado, J.-A., & Bergenstahl, B. (2019). Multilayer Bixin Microcapsules: The Impact of Native Carbohydrates on the Microencapsulation Efficiency and Dispersion Stability. Foods, 8(3), 108. https://doi.org/10.3390/foods8030108