Salt Distribution in Raw Sheep Milk Cheese during Ripening and the Effect on Proteolysis and Lipolysis


Abstract
1. Introduction
2. Materials and Methods
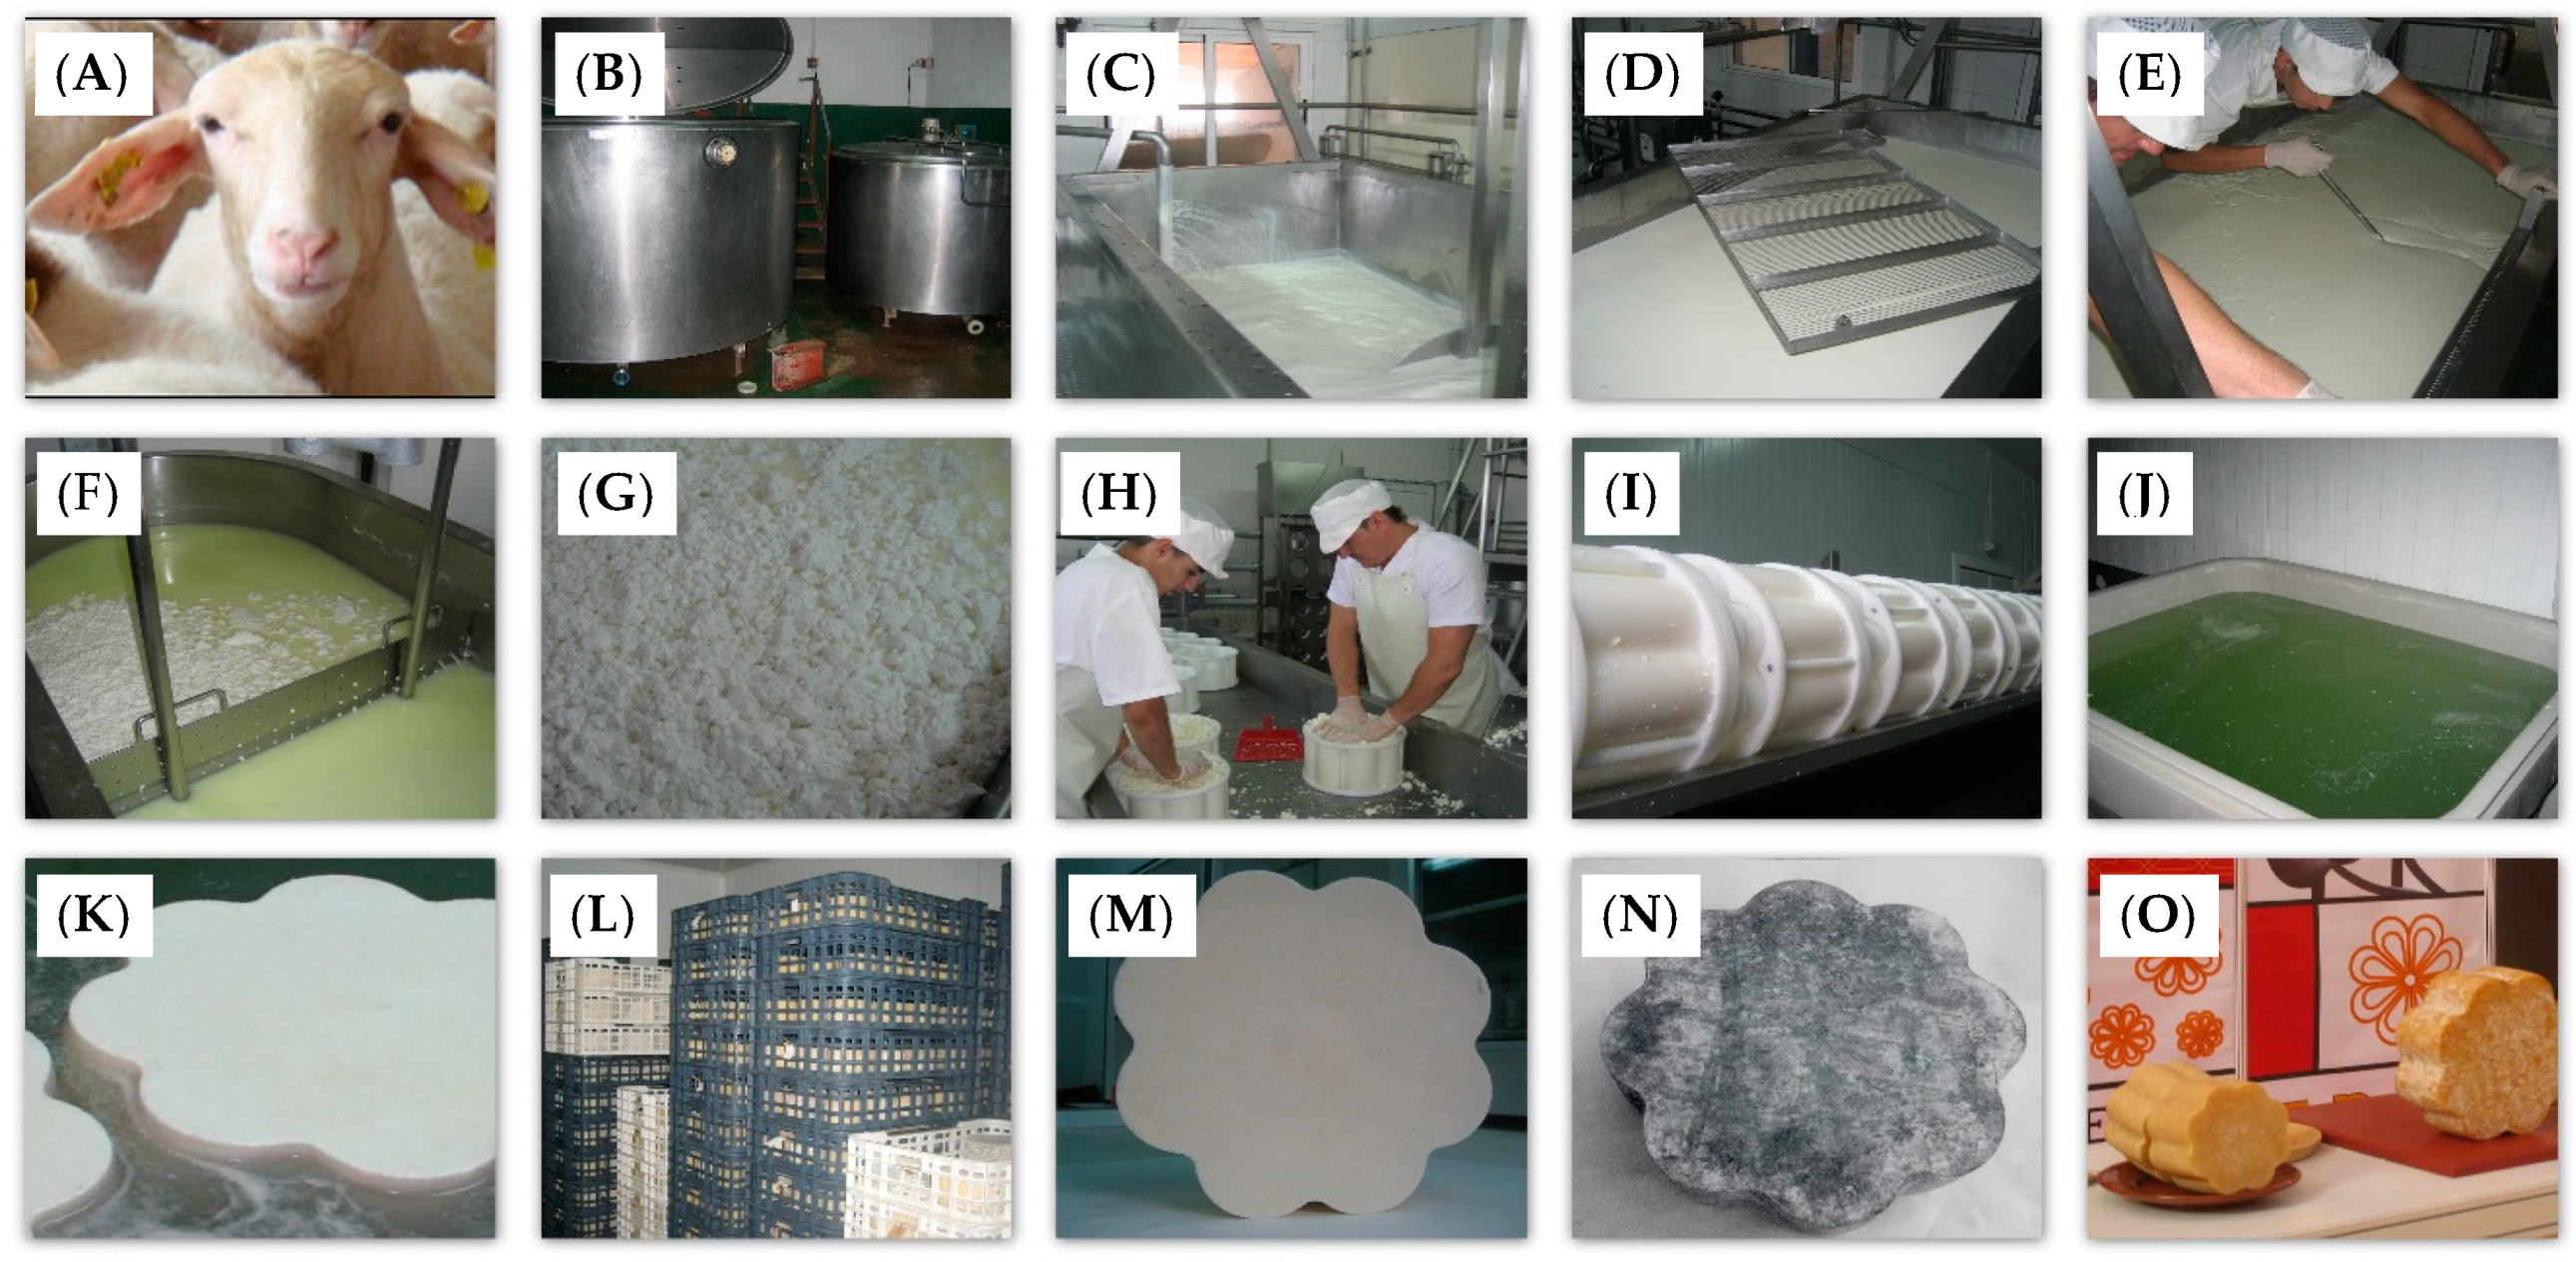
2.1. Cheese-Making Procedure
2.2. Sampling
2.3. Physicochemical Analysis
2.4. Proteolysis Assessment
2.5. Lipolysis Assessment: Analysis of Free Fatty Acids
2.6. Statistical Analysis
3. Results and Discussion
3.1. Chemical Composition
3.2. Salt Distribution
3.3. Proteolysis
3.3.1. Nitrogen Fractions
3.3.2. Free Amino Acids
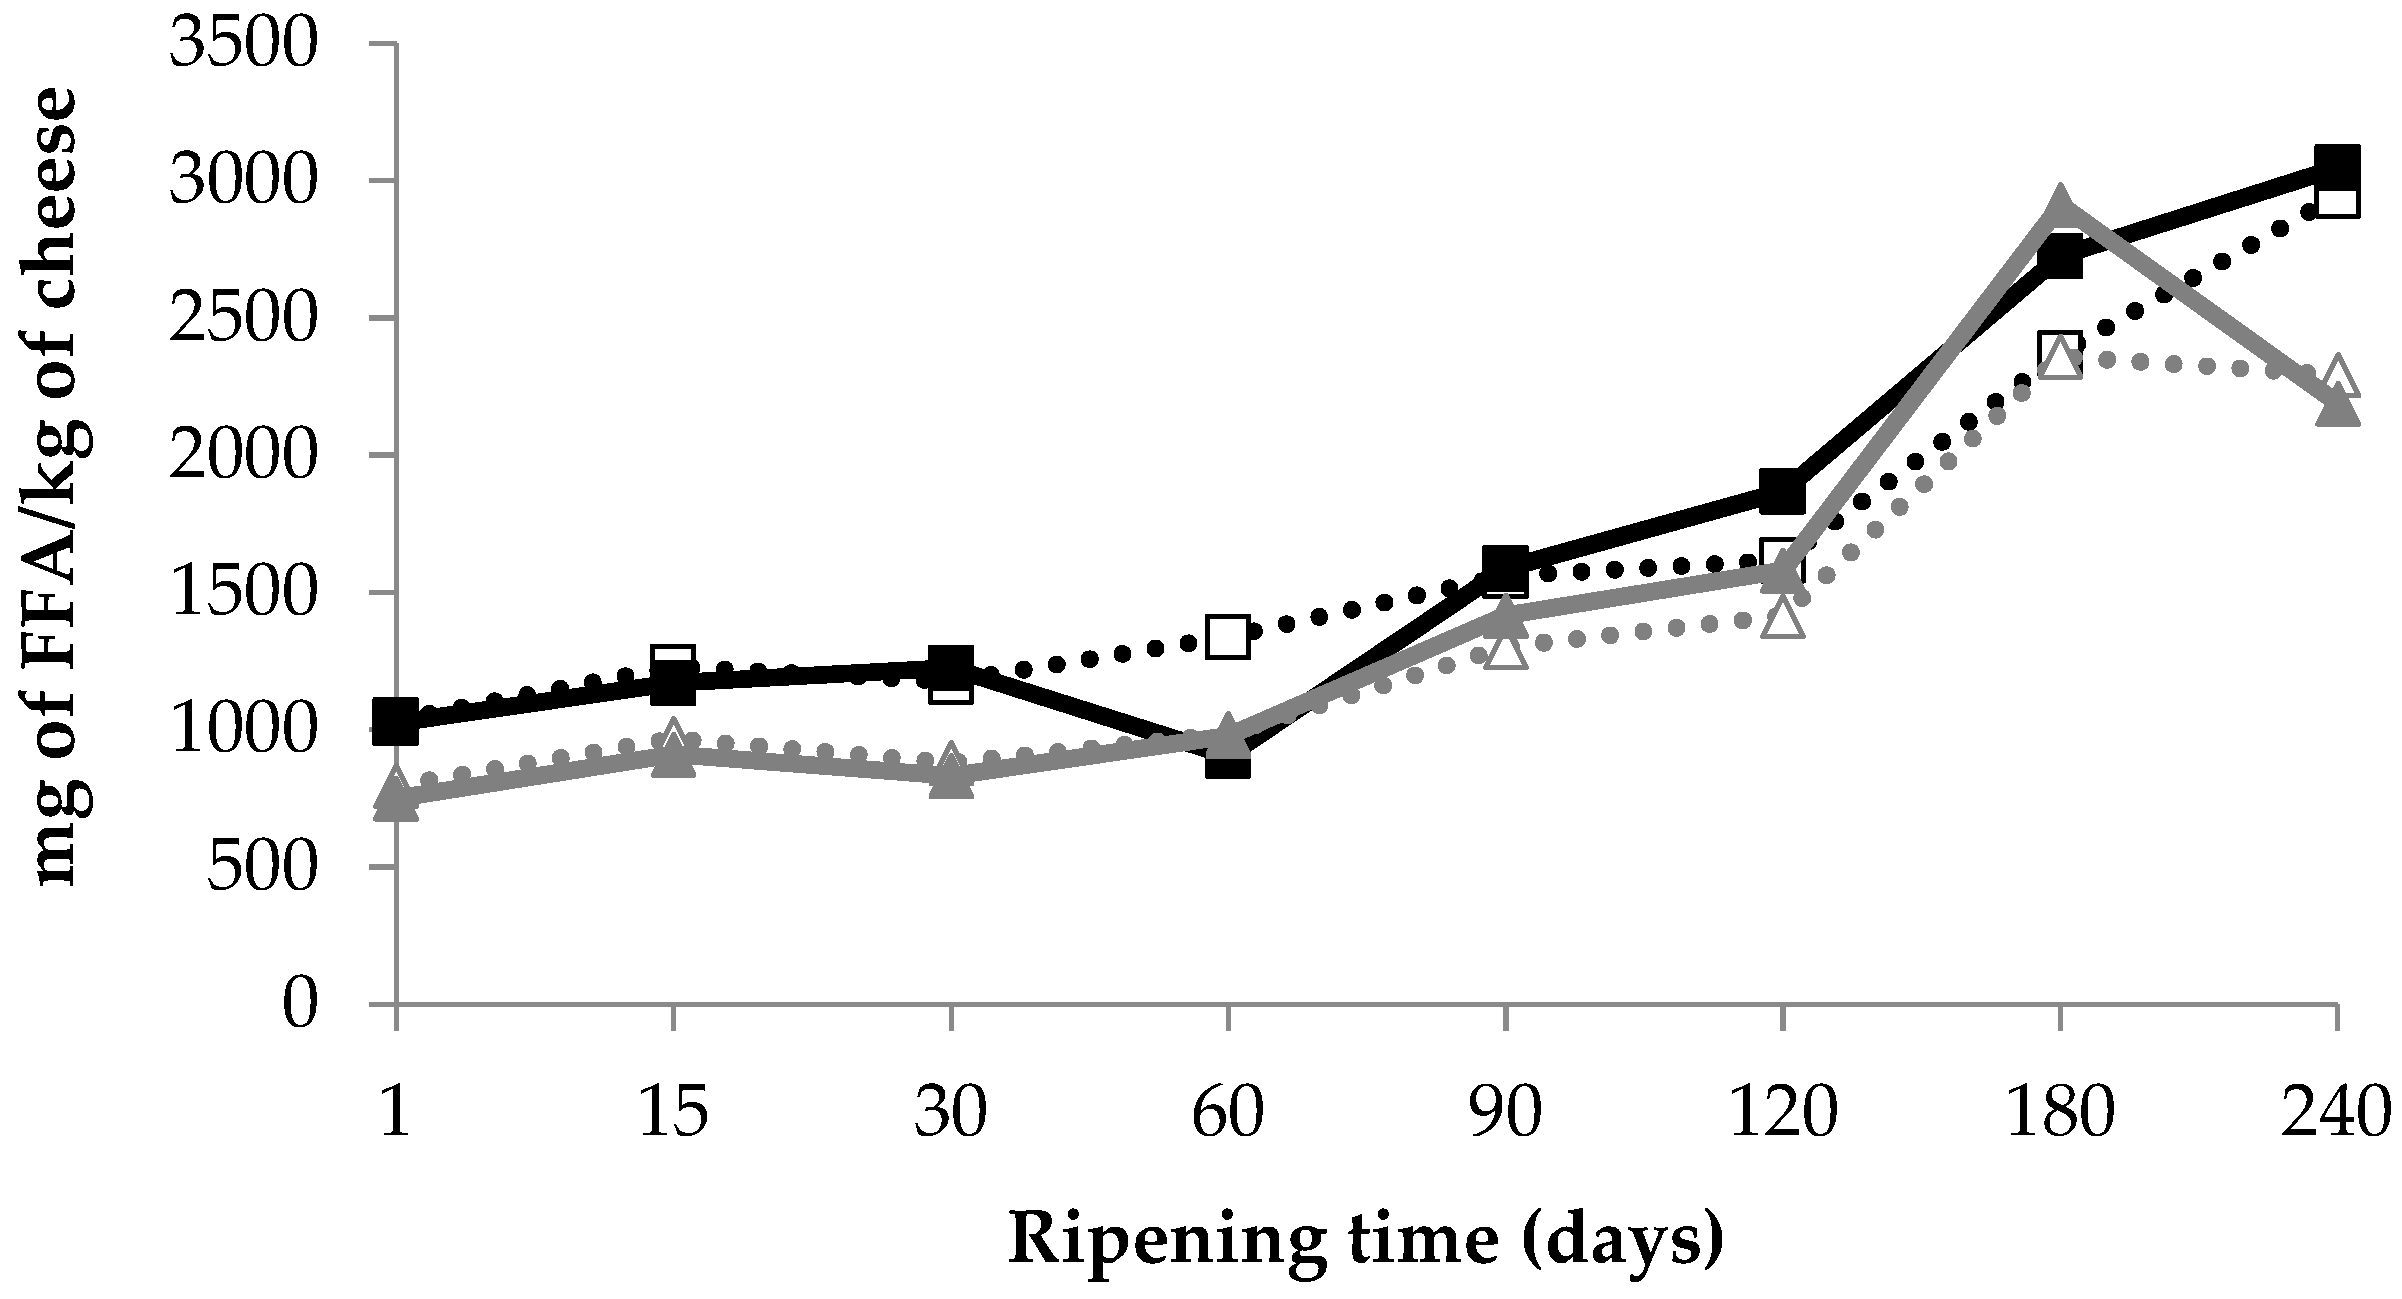
3.4. Lipolysis
4. Conclusions
Supplementary Materials
Author Contributions
Funding
Conflicts of Interest
References
- Montel, M.C.; Buchin, S.; Mallet, A.; Delbes-Paus, C.; Vuitton, D.A.; Desmasures, N.; Berthier, F. Traditional cheeses: Rich and diverse microbiota with associated benefits. Int. J. Food Microbiol. 2014, 177, 136–154. [Google Scholar] [CrossRef] [PubMed]
- Guinee, T.P.; Fox, P.F. Salt in Cheese: Chemistry, Physics and Microbiology. General Aspects, 3rd ed.; Chapman & Hall: London, UK, 2004; Volume 1, pp. 207–259. [Google Scholar]
- McCarthy, C.M.; Wilkinson, M.G.; Kelly, P.M.; Guinee, T.P. Effect of salt and fat reduction on the composition, lactose metabolism, water activity and microbiology of Cheddar cheese. Dairy Sci. Technol. 2015, 95, 587–611. [Google Scholar] [CrossRef]
- Baptista, D.P.; da Silva Araújo, F.D.; Eberlin, M.N.; Gigante, M.L. Reduction of 25% salt in Prato cheese does not affect proteolysis and sensory acceptance. Int. Dairy J. 2017, 75, 101–110. [Google Scholar] [CrossRef]
- Zabaleta, L.; Albisu, M.; Ojeda, M.; Gil, P.; Etaio, I.; Perez-Elortondo, F.; de Renobales, M.; Barron, L. Occurrence of sensory defects in semi-hard ewe’s raw milk cheeses. Dairy Sci. Technol. 2016, 96, 53–65. [Google Scholar] [CrossRef]
- McCarthy, C.M.; Kelly, P.M.; Wilkinson, M.G.; Guinee, T.P. Effect of fat and salt reduction on the changes in the concentrations of free amino acids and free fatty acids in Cheddar-style cheeses during maturation. J. Food Compos. Anal. 2017, 59, 132–140. [Google Scholar] [CrossRef]
- Malacarne, M.; Summer, A.; Franceschi, P.; Formaggioni, P.; Pecorari, M.; Panari, G.; Mariani, P. Free fatty acid profile of Parmigiano-Reggiano cheese throughout ripening: Comparison between the inner and outer regions of the wheel. Int. Dairy J. 2009, 19, 637–641. [Google Scholar] [CrossRef]
- Tosi, F.; Sandri, S.; Tedeschi, G.; Malacarne, M.; Fossa, E. Variazioni di composizione e proprietà fisico-chimiche del Parmigiano-Reggiano durante la maturazione e in differenti zone della forma. Scienza e Tecnica Lattiero-Casearia. 2008, 59, 507–528. [Google Scholar]
- Sihufe, G.A.; Zorrilla, S.E.; Mercanti, D.J.; Perotti, M.C.; Zalazar, C.A.; Rubiolo, A.C. The influence of ripening temperature and sampling site on the lipolysis in Reggianito Argentino cheese. Food Res. Int. 2007, 40, 1220–1226. [Google Scholar] [CrossRef]
- Verdini, R.A.; Zorrilla, S.E.; Rubiolo, A.C. Characterisation of soft cheese proteolysis by RP-HPLC analysis of its nitrogenous fractions. Effect of ripening time and sampling zone. Int. Dairy J. 2004, 14, 445–454. [Google Scholar] [CrossRef]
- ISO. Determination of the Total Solid Content (Reference Method); International Organization for Standardization: Geneva, Switzerland, 2004. [Google Scholar]
- ISO. Cheese and Processed Cheese Products. Determination of Fat Content. Gravimetric Method; International Organization for Standardization: Geneva, Switzerland, 2004. [Google Scholar]
- ISO. Determination of Nitrogen Content. Part 1: Kjeldahl Principle and Crude Protein Calculation; International Organization for Standardization: Geneva, Switzerland, 2014. [Google Scholar]
- ISO. Determination of Chloride Content. Potentiometric Titration Method; International Organization for Standardization: Geneva, Switzerland, 2006. [Google Scholar]
- Butikofer, U.; Ruegg, M.; Ardo, Y. Determination of Nitrogen Fractions in Cheese-Evaluation of a Collaborative Study. LWT Food Sci. Technol. 1993, 26, 271–275. [Google Scholar] [CrossRef]
- Milesi, M.M.; Vinderola, G.; Sabbag, N.; Meinardi, C.A.; Hynes, E. Influence on cheese proteolysis and sensory characteristics of non-starter lactobacilli strains with probiotic potential. Food Res. Int. 2009, 42, 1186–1196. [Google Scholar] [CrossRef]
- Waters, AccQ. Tag Chemistry Package: Instruction Manual; Waters Corporation: Milford, MA, USA, 2008. [Google Scholar]
- Estrada, O.; Molino, F.; Sanz, M.A.; Juan, T. Optimization of a Chromatographic Method for the Determination of Free Amino Acids in Cheese. In Proceedings of the VI IBEROLAB Virtual Ibero-American Conference on Quality Management in Laboratories. 2011. Available online: http://www.iberolab.org (accessed on 31 January 2019).
- Chavarri, F.; Virto, M.; Martin, C.; Najera, A.I.; Santisteban, A.; Barron, L.J.R.; De Renobales, M. Determination of free fatty acids in cheese: Comparison of two analytical methods. J. Dairy Res. 1997, 64, 445–452. [Google Scholar] [CrossRef]
- De Jong, C.; Badings, H. Determination of Free Fatty Acids in Milk and Cheese—Procedures for Extraction, Clean Up, and Capillary Gas-Chromatographic Analysis. HRC-J. High Resolut. Chromatogr. 1990, 13, 94–98. [Google Scholar] [CrossRef]
- Mucchetti, G.; Bonvini, B.; Remagni, M.C.; Ghiglietti, R.; Locci, F.; Barzaghi, S.; Francolino, S.; Perrone, A.; Rubiloni, A.; Campo, P.; et al. Influence of cheese-making technology on composition and microbiological characteristics of Vastedda cheese. Food Control 2008, 19, 119–125. [Google Scholar] [CrossRef]
- Todaro, M.; Francesca, N.; Reale, S.; Moschetti, G.; Vitale, F.; Settanni, L. Effect of different salting technologies on the chemical and microbiological characteristics of PDO Pecorino Siciliano cheese. Eur. Food Res. Technol. 2011, 233, 931–940. [Google Scholar] [CrossRef]
- Pellegrino, L.; Battelli, G.; Resmini, P.; Ferranti, P.; Barone, F.; Addeo, F. Effects of heat load gradient occurring in moulding on characterization and ripening of Grana Padano. Dairy Sci. Technol. 1997, 77, 217–228. [Google Scholar] [CrossRef]
- Poveda, J.M.; Sousa, M.J.; Cabezas, L.; McSweeney, P.L.H. Preliminary observations on proteolysis in Manchego cheese made with a defined-strain starter culture and adjunct starter (Lactobacillus plantarum) or a commercial starter. Int. Dairy J. 2003, 13, 169–178. [Google Scholar] [CrossRef]
- Mendia, C.; Ibañez, F.C.; Torre, P.; Barcina, Y. Influence of the season on proteolysis and sensory characteristics of Idiazabal cheese. J. Dairy Sci. 2000, 83, 1899–1904. [Google Scholar] [CrossRef]
- Sanjuan, E.; Millan, R.; Saavedra, P.; Carmona, M.A.; Gome, R.; Fernandez-Salguero, J. Influence of animal and vegetable rennet on the physicochemical characteristics of Los Pedroches cheese during ripening. Food Chem. 2002, 78, 281–289. [Google Scholar] [CrossRef]
- Sihufe, G.A.; Zorrilla, S.E.; Rubiolo, A.C. The influence of ripening temperature and sampling site on the proteolysis in Reggianito Argentino cheese. LWT-Food Sci. Technol. 2010, 43, 247–253. [Google Scholar] [CrossRef]
- Akkerman, M.; Kristensen, L.S.; Jespersen, L.; Ryssel, M.B.; Mackie, A.; Larsen, N.N.; Andersen, U.; Nørgaard, M.K.; Løkke, M.M.; Møller, J.R. Interaction between sodium chloride and texture in semi-hard Danish cheese as affected by brining time, DL-starter culture, chymosin type and cheese ripening. Int. Dairy J. 2017, 70, 34–45. [Google Scholar] [CrossRef]
- Pintado, A.I.E.; Pinho, O.; Ferreira, I.M.P.L.V.O.; Pintado, M.M.E.; Gomes, A.M.P.; Malcata, F.X. Microbiological, biochemical and biogenic amine profiles of Terrincho cheese manufactured in several dairy farms. Int. Dairy J. 2008, 18, 640. [Google Scholar] [CrossRef]
- Irigoyen, A.; Izco, J.M.; Ibañez, F.C.; Torre, P. Influence of calf or lamb rennet on the physicochemical, proteolytic, and sensory characteristics of an ewe’s-milk cheese. Int. Dairy J. 2002, 12, 27–34. [Google Scholar] [CrossRef]
- Fox, P.F.; Guinee, T.P.; Cogan, T.M.; McSweeney, P.L.H. Fundamentals of Cheese Science; Aspen Publisher Inc.: Gaithersburg, MD, USA, 2000. [Google Scholar]
- Bustamante, M.A.; Virto, M.; Aramburu, M.; Barron, L.J.R.; Perez-Elortondo, F.J.; Albisu, M.; de Renobales, M. Lamb rennet paste in ovine cheese (Idiazabal) manufacture. Proteolysis and relationship between analytical and sensory parameters. Int. Dairy J. 2003, 13, 547–557. [Google Scholar] [CrossRef]
- Galán, E.; Prados, F.; Pino, A.; Tejada, L.; Fernández-Salguero, J. Influence of different amounts of vegetable coagulant from cardoon Cynara cardunculus and calf rennet on the proteolysis and sensory characteristics of cheeses made with sheep milk. Int. Dairy J. 2008, 18, 93–98. [Google Scholar] [CrossRef]
- Laht, T.; Kask, S.; Elias, P.; Adamberg, K.; Paalme, T. Role of arginine in the development of secondary microflora in Swiss-type cheese. Int. Dairy J. 2002, 12, 831–840. [Google Scholar] [CrossRef]
- Poveda, J.M.; Chicón, R.; Cabezas, L. Biogenic amine content and proteolysis in Manchego cheese manufactured with Lactobacillus paracasei subsp. paracasei as adjunct and other autochthonous strains as starters. Int. Dairy J. 2015, 47, 94–101. [Google Scholar] [CrossRef]
- Christensen, J.E.; Dudley, E.G.; Pederson, J.A.; Steele, J.L. Peptidases and amino acid catabolism in lactic acid bacteria. Antonie Van Leeuwenhoek 1999, 76, 217–246. [Google Scholar] [CrossRef] [PubMed]
- Oneca, M.; Ortigosa, M.; Irigoyen, A.; Torre, P. Proteolytic activity of some Lactobacillus paracasei strains in a model ovine-milk curd system: Determination of free amino acids by RP-HPLC. Food Chem. 2007, 100, 1602–1610. [Google Scholar] [CrossRef]
- Muñoz, N.; Ortigosa, M.; Torre, P.; Izco, J.M. Free amino acids and volatile compounds in an ewe’s milk cheese as affected by seasonal and cheese-making plant variations. Food Chem. 2003, 83, 329–338. [Google Scholar] [CrossRef]
- Collins, Y.F.; McSweeney, P.L.H.; Wilkinson, M.G. Lipolysis and free fatty acid catabolism in cheese: A review of current knowledge. Int. Dairy J. 2003, 13, 841–866. [Google Scholar] [CrossRef]
- Boutoial, K.; Alcántara, Y.; Rovira, S.; García, V.; Ferrandini, E.; López, M.B. Influence of ripening on proteolysis and lipolysis of Murcia al Vino cheese. Int. J. Dairy Technol. 2013, 66, 366–372. [Google Scholar] [CrossRef]
- Reddy, K.A.; Marth, E.H. Composition of Cheddar cheese made with sodium chloride and potassium chloride either singly or as mixtures. J. Food Compos. Anal. 1993, 6, 354–363. [Google Scholar] [CrossRef]
- Freitas, A.C.; Fresno, J.M.; Prieto, B.; Malcata, F.X.; Carballo, J. Effects of ripening time and combination of ovine and caprine milks on proteolysis of Picante cheese. Food Chem. 1997, 60, 219–229. [Google Scholar] [CrossRef]
- Poveda, J.M.; Perez-Coello, M.S.; Cabezas, L. Seasonal variations in the free fatty acid composition of Manchego cheese and changes during ripening. Eur. Food Res. Technol. 2000, 210, 314–317. [Google Scholar] [CrossRef]

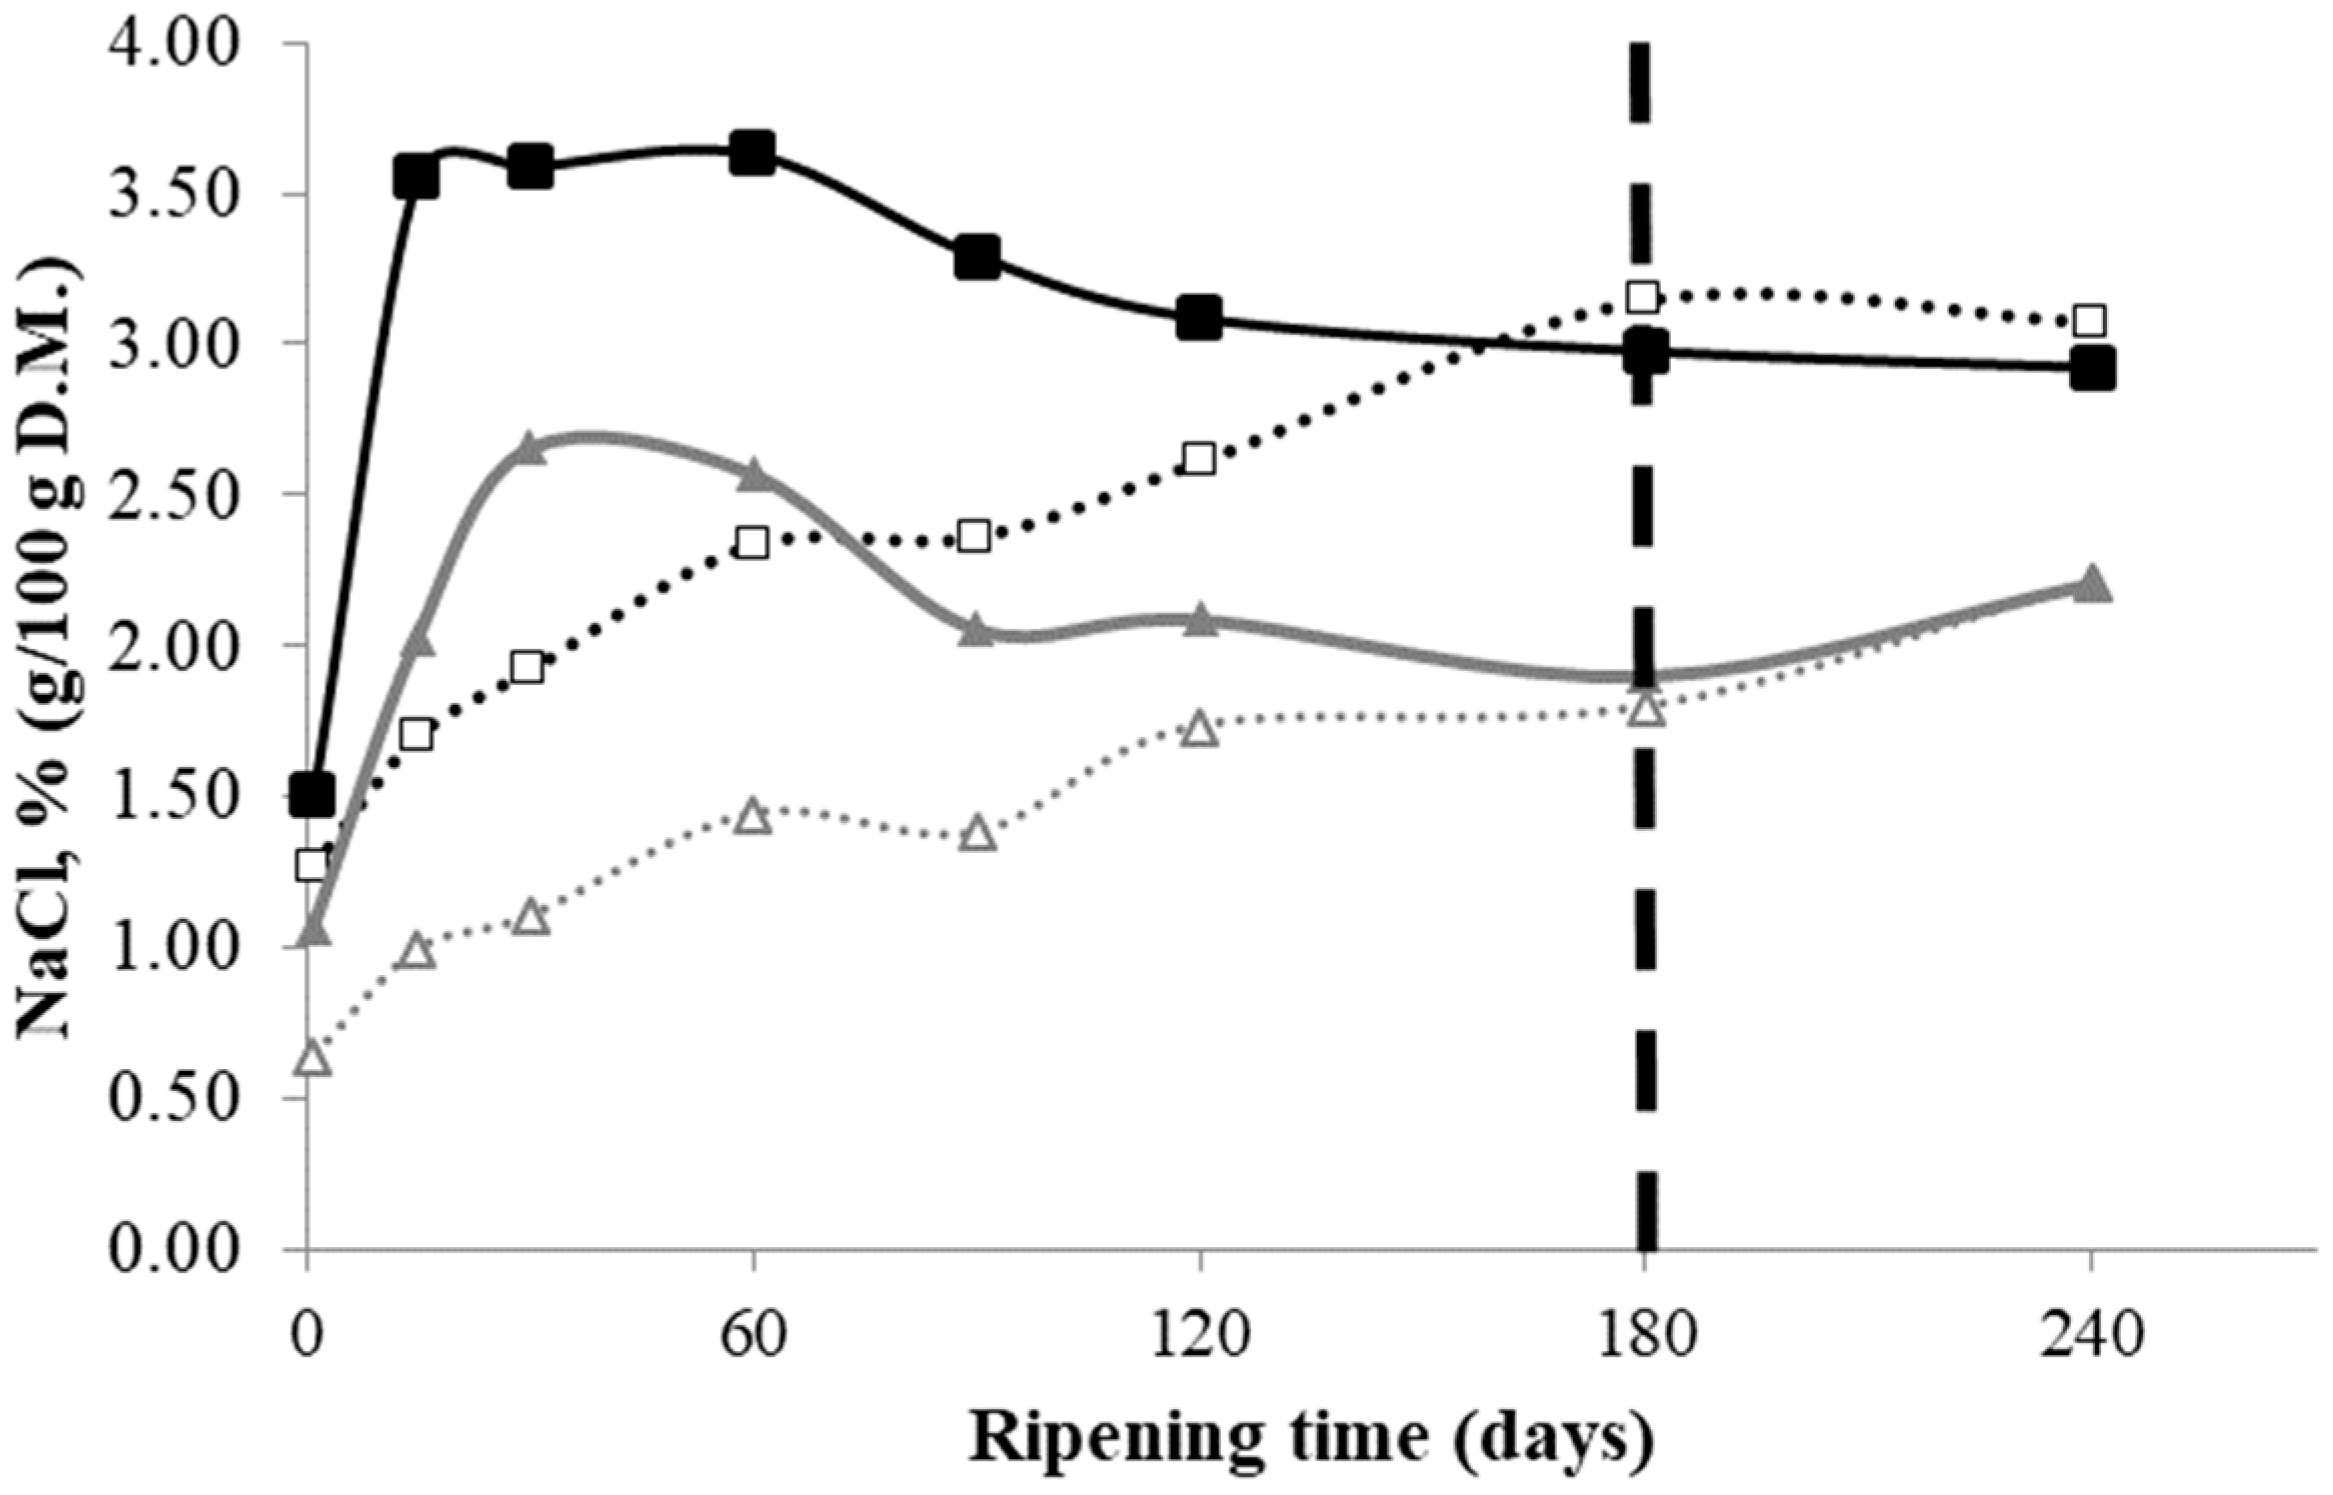
 ): D1 internal zone, (
 ): D1 external zone, (
 ): D2 internal zone, (
 ): D2 external zone.
): D1 internal zone, (): D1 external zone, (): D2 internal zone, (): D2 external zone.
): D2 external zone.
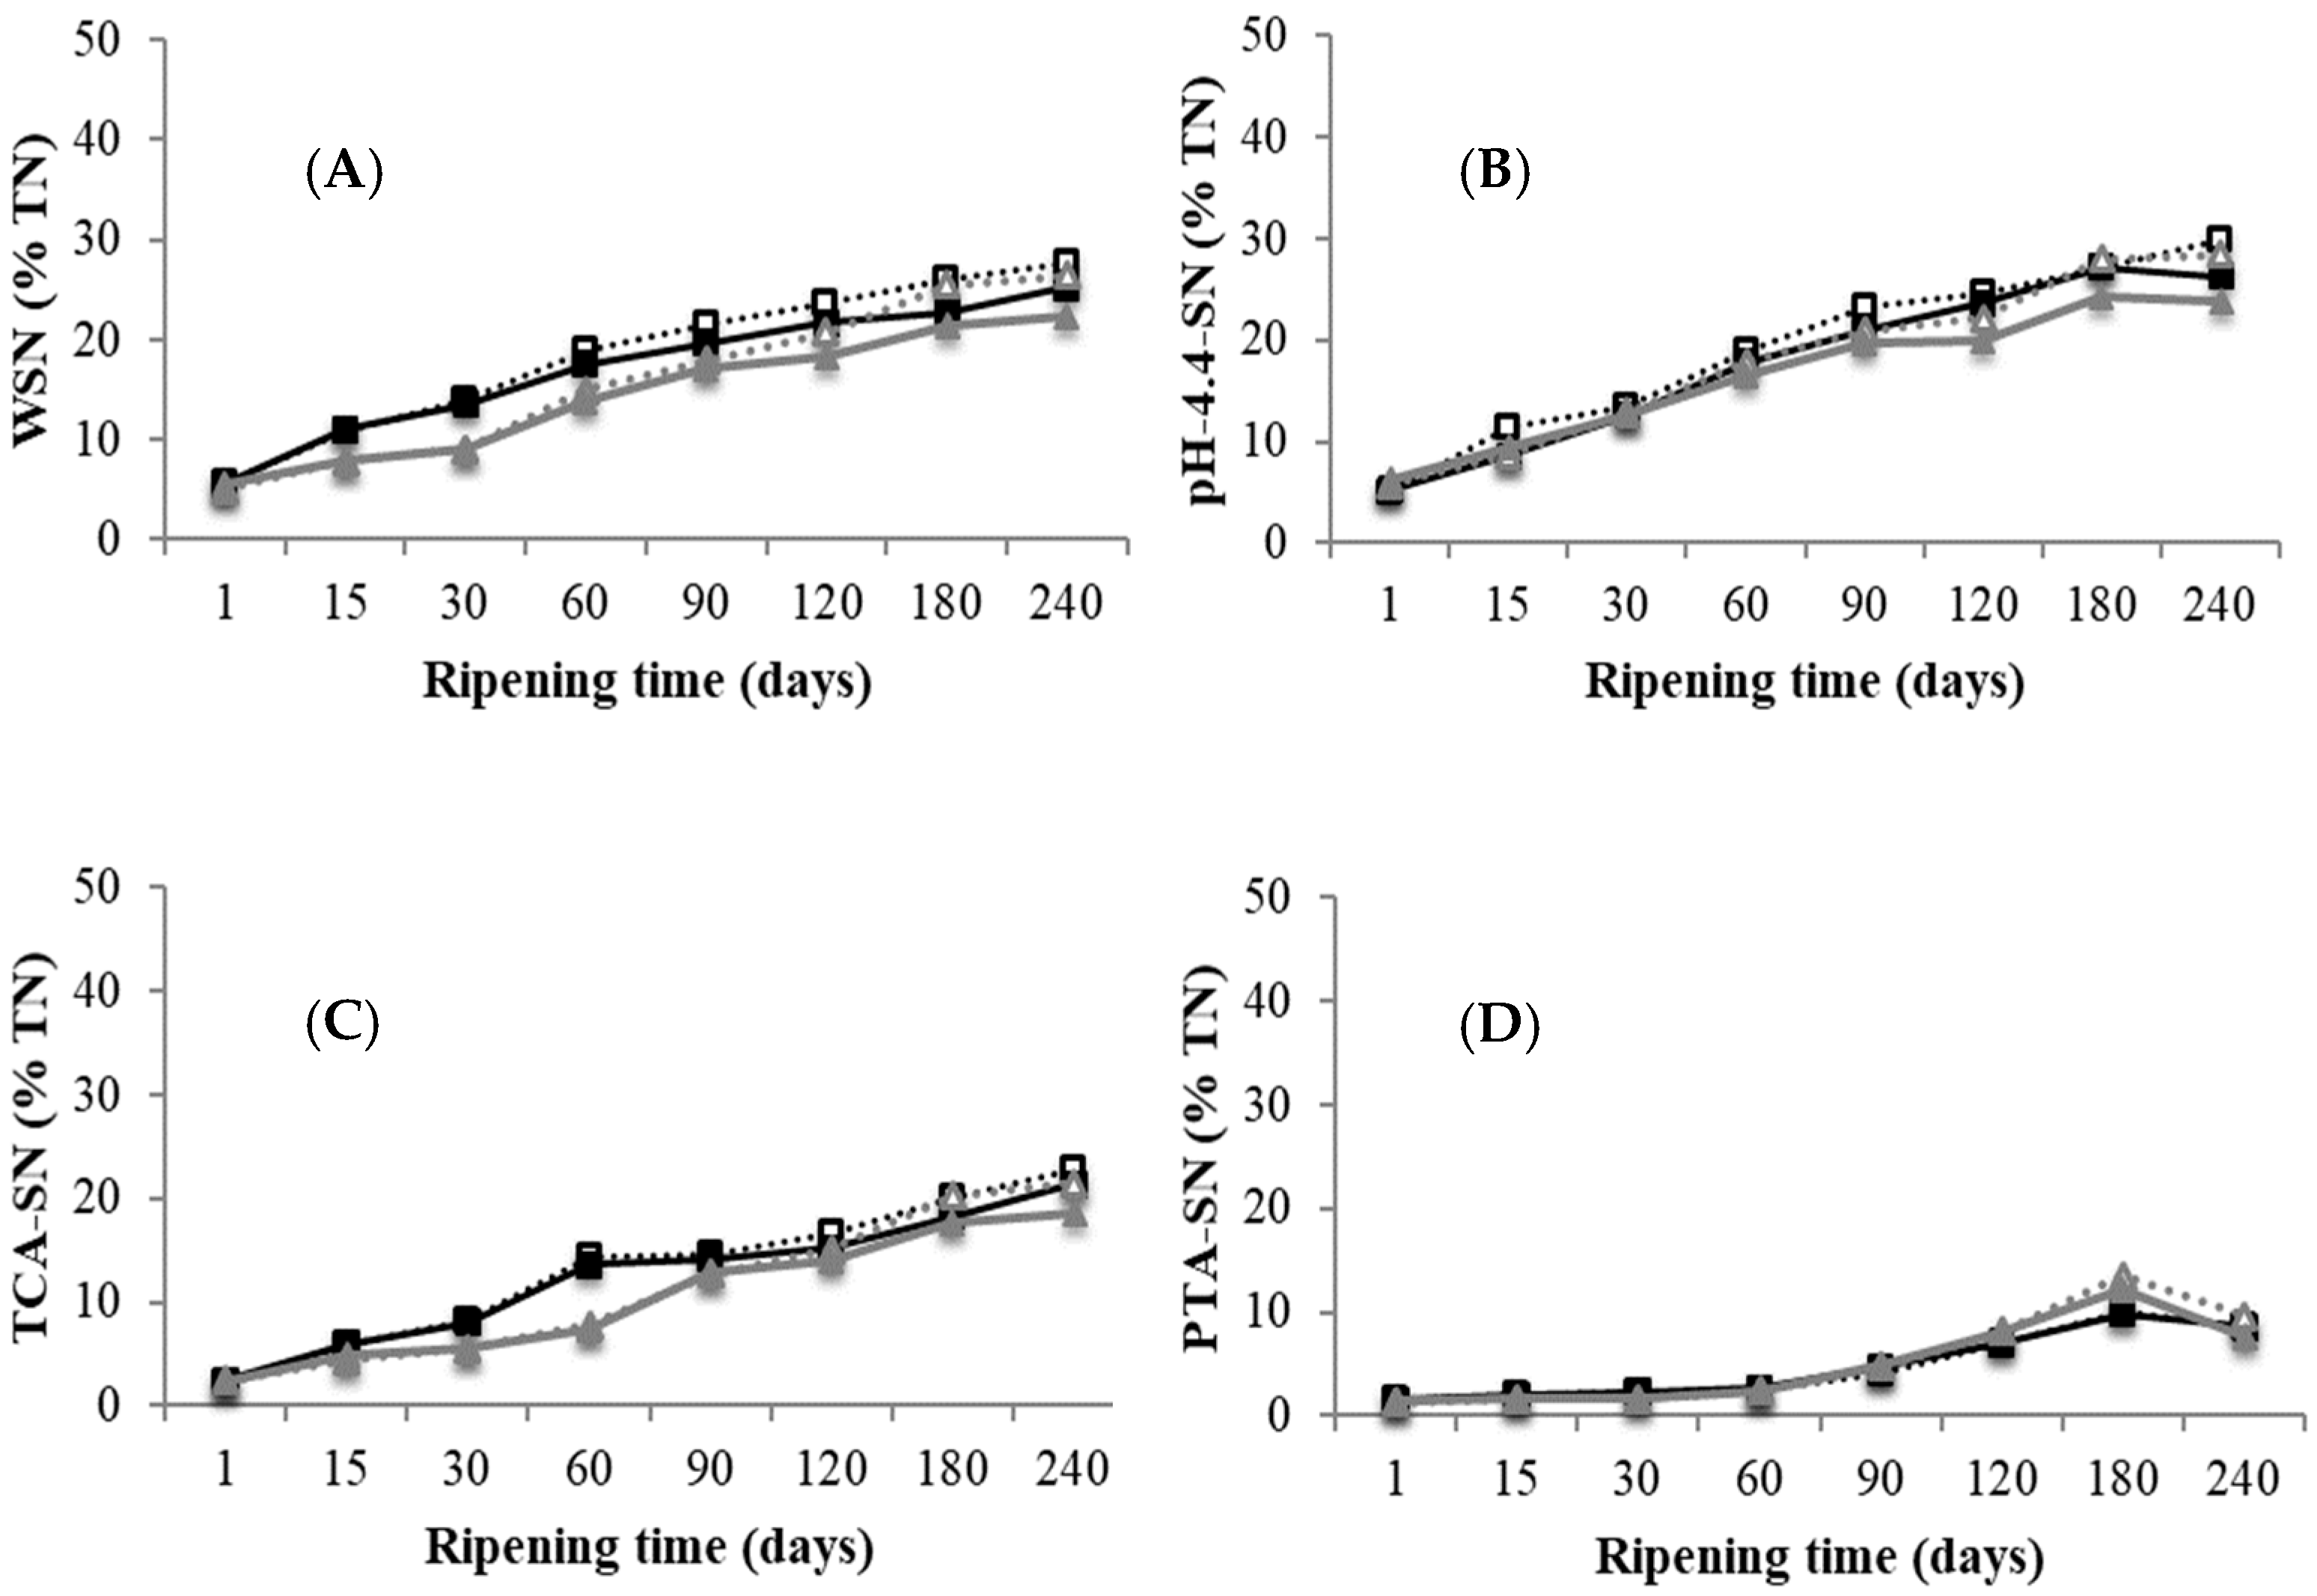
): D1 internal zone, (): D1 external zone, (): D2 internal zone, (): D2 external zone. ): D1 internal zone, (): D1 external zone, (): D2 internal zone, (): D2 external zone. (A) water-soluble nitrogen (WSN)/total nitrogen (TN); (B) pH 4.4 soluble nitrogen (SN)/TN; (C) trichloroacetic acid 12% (w/v) (TCA)-SN/TN; (D) phosphotungstic acid (PTA)-SN/TN.
): D1 internal zone, (): D1 external zone, (): D2 internal zone, (): D2 external zone. (A) water-soluble nitrogen (WSN)/total nitrogen (TN); (B) pH 4.4 soluble nitrogen (SN)/TN; (C) trichloroacetic acid 12% (w/v) (TCA)-SN/TN; (D) phosphotungstic acid (PTA)-SN/TN.
): D1 internal zone, (): D1 external zone, (): D2 internal zone, (): D2 external zone. (A) water-soluble nitrogen (WSN)/total nitrogen (TN); (B) pH 4.4 soluble nitrogen (SN)/TN; (C) trichloroacetic acid 12% (w/v) (TCA)-SN/TN; (D) phosphotungstic acid (PTA)-SN/TN.
 ): D1 internal zone, (): D1 external zone, (): D2 internal zone, (): D2 external zone.
): D1 internal zone, (): D1 external zone, (): D2 internal zone, (): D2 external zone.
): D1 internal zone, (): D1 external zone, (): D2 internal zone, (): D2 external zone.

| Dairy Plant | Days of Ripening | pH | Water Activity (aW) | Dry Matter (DM) | Fat (% DM) | Protein (% DM) | NaCl (% DM) | ||||||
|---|---|---|---|---|---|---|---|---|---|---|---|---|---|
| Internal | External | Internal | External | Internal | External | Internal | External | Internal | External | Internal | External | ||
| D1 | 1 | 5.46 ± 0.15 | 5.45 ± 0.16 | 0.98 ± 0.00 | 0.98 ± 0.01 | 54.3 ± 1.0 | 54.1 ± 1.6 | 54.5 ± 2.5 | 52.4 ± 1.9 | 37.7 ± 1.1 | 37.2 ± 0.6 | 1.27 ± 0.08 | 1.51 ± 0.29 |
| 15 | 5.47 ± 0.09 | 5.46 ± 0.04 | 0.98 ± 0.00 | 0.97 ± 0.00 | 55.9 ± 5.1 | 54.6 ± 2.3 | 50.9 ± 3.3 | 51.6 ± 1.6 | 35.5 ± 3.9 | 35.5 ± 2.5 | 1.70 ± 0.13 | 3.55 ± 0.17 | |
| 30 | 5.48 ± 0.09 | 5.53 ± 0.08 | 0.97 ± 0.01 | 0.96 ± 0.01 | 55.1 ± 1.8 | 55.8 ± 0.4 | 52.8 ± 3.8 | 50.6 ± 3.5 | 37.0 ± 1.1 | 36.1 ± 1.5 | 1.92 ± 0.43 | 3.59 ± 0.33 | |
| 60 | 5.47 ± 0.12 | 5.52 ± 0.05 | 0.97 ± 0.00 | 0.95 ± 0.00 | 57.0 ± 0.7 | 58.9 ± 1.2 | 53.6 ± 2.2 | 51.7 ± 2.2 | 37.1 ± 0.1 | 36.0 ± 1.0 | 2.34 ± 0.32 | 3.63 ± 0.12 | |
| 90 | 5.45 ± 0.05 | 5.37 ± 0.05 | 0.96 ± 0.00 | 0.95 ± 0.00 | 59.3 ± 0.6 | 61.3 ± 1.7 | 52.3 ± 3.8 | 53.5 ± 5.9 | 37.2 ± 0.8 | 37.4 ± 1.6 | 2.36 ± 0.05 | 3.29 ± 0.07 | |
| 120 | 5.46 ± 0.11 | 5.41 ± 0.09 | 0.96 ± 0.00 | 0.95 ± 0.00 | 60.0 ± 1.1 | 62.8 ± 2.0 | 55.0 ± 5.6 | 53.0 ± 2.5 | 38.8 ± 3.3 | 36.3 ± 0.6 | 2.61 ± 0.32 | 3.09 ± 0.29 | |
| 180 | 5.38 ± 0.13 | 5.32 ± 0.16 | 0.94 ± 0.00 | 0.93 ± 0.01 | 63.6 ± 1.3 | 69.1 ± 2.9 | 55.6 ± 2.3 | 48.3 ± 3.5 | 36.3 ± 0.9 | 36.4 ± 0.8 | 3.15 ± 0.13 | 2.98 ± 0.26 | |
| 240 | 5.54 ± 0.11 | 5.43 ± 0.07 | 0.92 ± 0.00 | 0.91 ± 0.00 | 66.6 ± 1.1 | 71.8 ± 0.4 | 52.5 ± 2.6 | 52.8 ± 1.7 | 36.5 ± 0.6 | 36.6 ± 0.6 | 3.07 ± 0.26 | 2.92 ± 0.28 | |
| D2 | 1 | 5.63 ± 0.03 | 5.58 ± 0.03 | 0.98 ± 0.00 | 0.98 ± 0.01 | 57.5 ± 1.4 | 56.1 ± 1.5 | 51.8 ± 2.8 | 51.2 ± 2.4 | 40.1 ± 1.4 | 40.6 ± 1.0 | 0.64 ± 0.34 | 1.07 ± 0.51 |
| 15 | 5.71 ± 0.11 | 5.77 ± 0.12 | 0.97 ± 0.01 | 0.98 ± 0.00 | 58.2 ± 2.0 | 58.1 ± 1.3 | 49.9 ± 2.3 | 50.0 ± 2.6 | 39.9 ± 2.6 | 39.1 ± 2.3 | 0.99 ± 0.44 | 2.03 ± 0.97 | |
| 30 | 5.73 ± 0.04 | 5.65 ± 0.07 | 0.97 ± 0.00 | 0.96 ± 0.01 | 59.2 ± 1.0 | 58.7 ± 1.1 | 50.7 ± 3.0 | 50.6 ± 2.2 | 39.7 ± 1.9 | 39.2 ± 1.8 | 1.1 ± 0.38 | 2.66 ± 0.54 | |
| 60 | 5.61 ± 0.08 | 5.58 ± 0.15 | 0.97 ± 0.00 | 0.95 ± 0.01 | 60.8 ± 1.3 | 63.2 ± 1.4 | 51.3 ± 2.6 | 50.3 ± 2.8 | 37.5 ± 3.8 | 39.5 ± 1.4 | 1.44 ± 0.50 | 2.57 ± 0.55 | |
| 90 | 5.75 ± 0.04 | 5.60 ± 0.01 | 0.96 ± 0.00 | 0.95 ± 0.01 | 62.8 ± 0.7 | 66.3 ± 2.0 | 51.0 ± 1.3 | 50.5 ± 2.5 | 39.9 ± 0.8 | 39.3 ± 1.3 | 1.38 ± 0.36 | 2.06 ± 0.27 | |
| 120 | 5.81 ± 0.18 | 5.61 ± 0.27 | 0.95 ± 0.01 | 0.94 ± 0.01 | 64.3 ± 0.9 | 69.0 ± 1.1 | 52.1 ± 3.9 | 49.1 ± 2.8 | 40.5 ± 0.6 | 38.5 ± 3.4 | 1.73 ± 0.59 | 2.09 ± 0.51 | |
| 180 | 5.82 ± 0.17 | 5.53 ± 0.13 | 0.94 ± 0.00 | 0.93 ± 0.01 | 67.2 ± 0.3 | 72.3 ± 0.6 | 52.9 ± 4.0 | 49.3 ± 2.0 | 38.7 ± 0.8 | 38.4 ± 0.5 | 1.8 ± 0.61 | 1.9 ± 0.59 | |
| 240 | 5.76 ± 0.03 | 5.59 ± 0.13 | 0.93 ± 0.00 | 0.91 ± 0.01 | 68.1 ± 0.2 | 74.4 ± 1.0 | 48.8 ± 0.2 | 48.4 ± 0.0 | 40.6 ± 3.8 | 38.6 ± 1.7 | 2.21 ± 0.22 | 2.21 ± 0.57 | |
| Dairy plant (D) | *** | NS | *** | ** | *** | *** | |||||||
| Sampling zone (SZ) | ** | *** | *** | NS | NS | *** | |||||||
| Ripening time | NS | *** | *** | NS | NS | * | |||||||
© 2019 by the authors. Licensee MDPI, Basel, Switzerland. This article is an open access article distributed under the terms and conditions of the Creative Commons Attribution (CC BY) license (http://creativecommons.org/licenses/by/4.0/).
Share and Cite
Estrada, O.; Ariño, A.; Juan, T. Salt Distribution in Raw Sheep Milk Cheese during Ripening and the Effect on Proteolysis and Lipolysis. Foods 2019, 8, 100. https://doi.org/10.3390/foods8030100
Estrada O, Ariño A, Juan T. Salt Distribution in Raw Sheep Milk Cheese during Ripening and the Effect on Proteolysis and Lipolysis. Foods. 2019; 8(3):100. https://doi.org/10.3390/foods8030100
Chicago/Turabian StyleEstrada, Olaia, Agustín Ariño, and Teresa Juan. 2019. "Salt Distribution in Raw Sheep Milk Cheese during Ripening and the Effect on Proteolysis and Lipolysis" Foods 8, no. 3: 100. https://doi.org/10.3390/foods8030100
APA StyleEstrada, O., Ariño, A., & Juan, T. (2019). Salt Distribution in Raw Sheep Milk Cheese during Ripening and the Effect on Proteolysis and Lipolysis. Foods, 8(3), 100. https://doi.org/10.3390/foods8030100