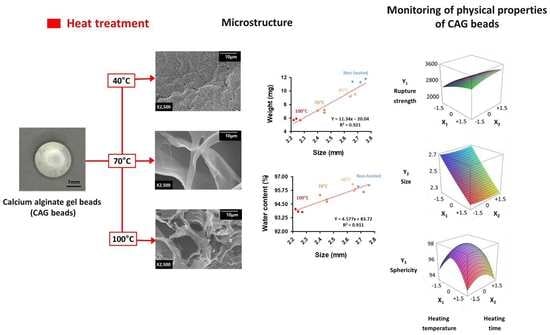
Effects of Thermal Treatment on the Physical Properties of Edible Calcium Alginate Gel Beads: Response Surface Methodological Approach


Abstract
:
1. Introduction
2. Materials and Methods
2.1. Materials
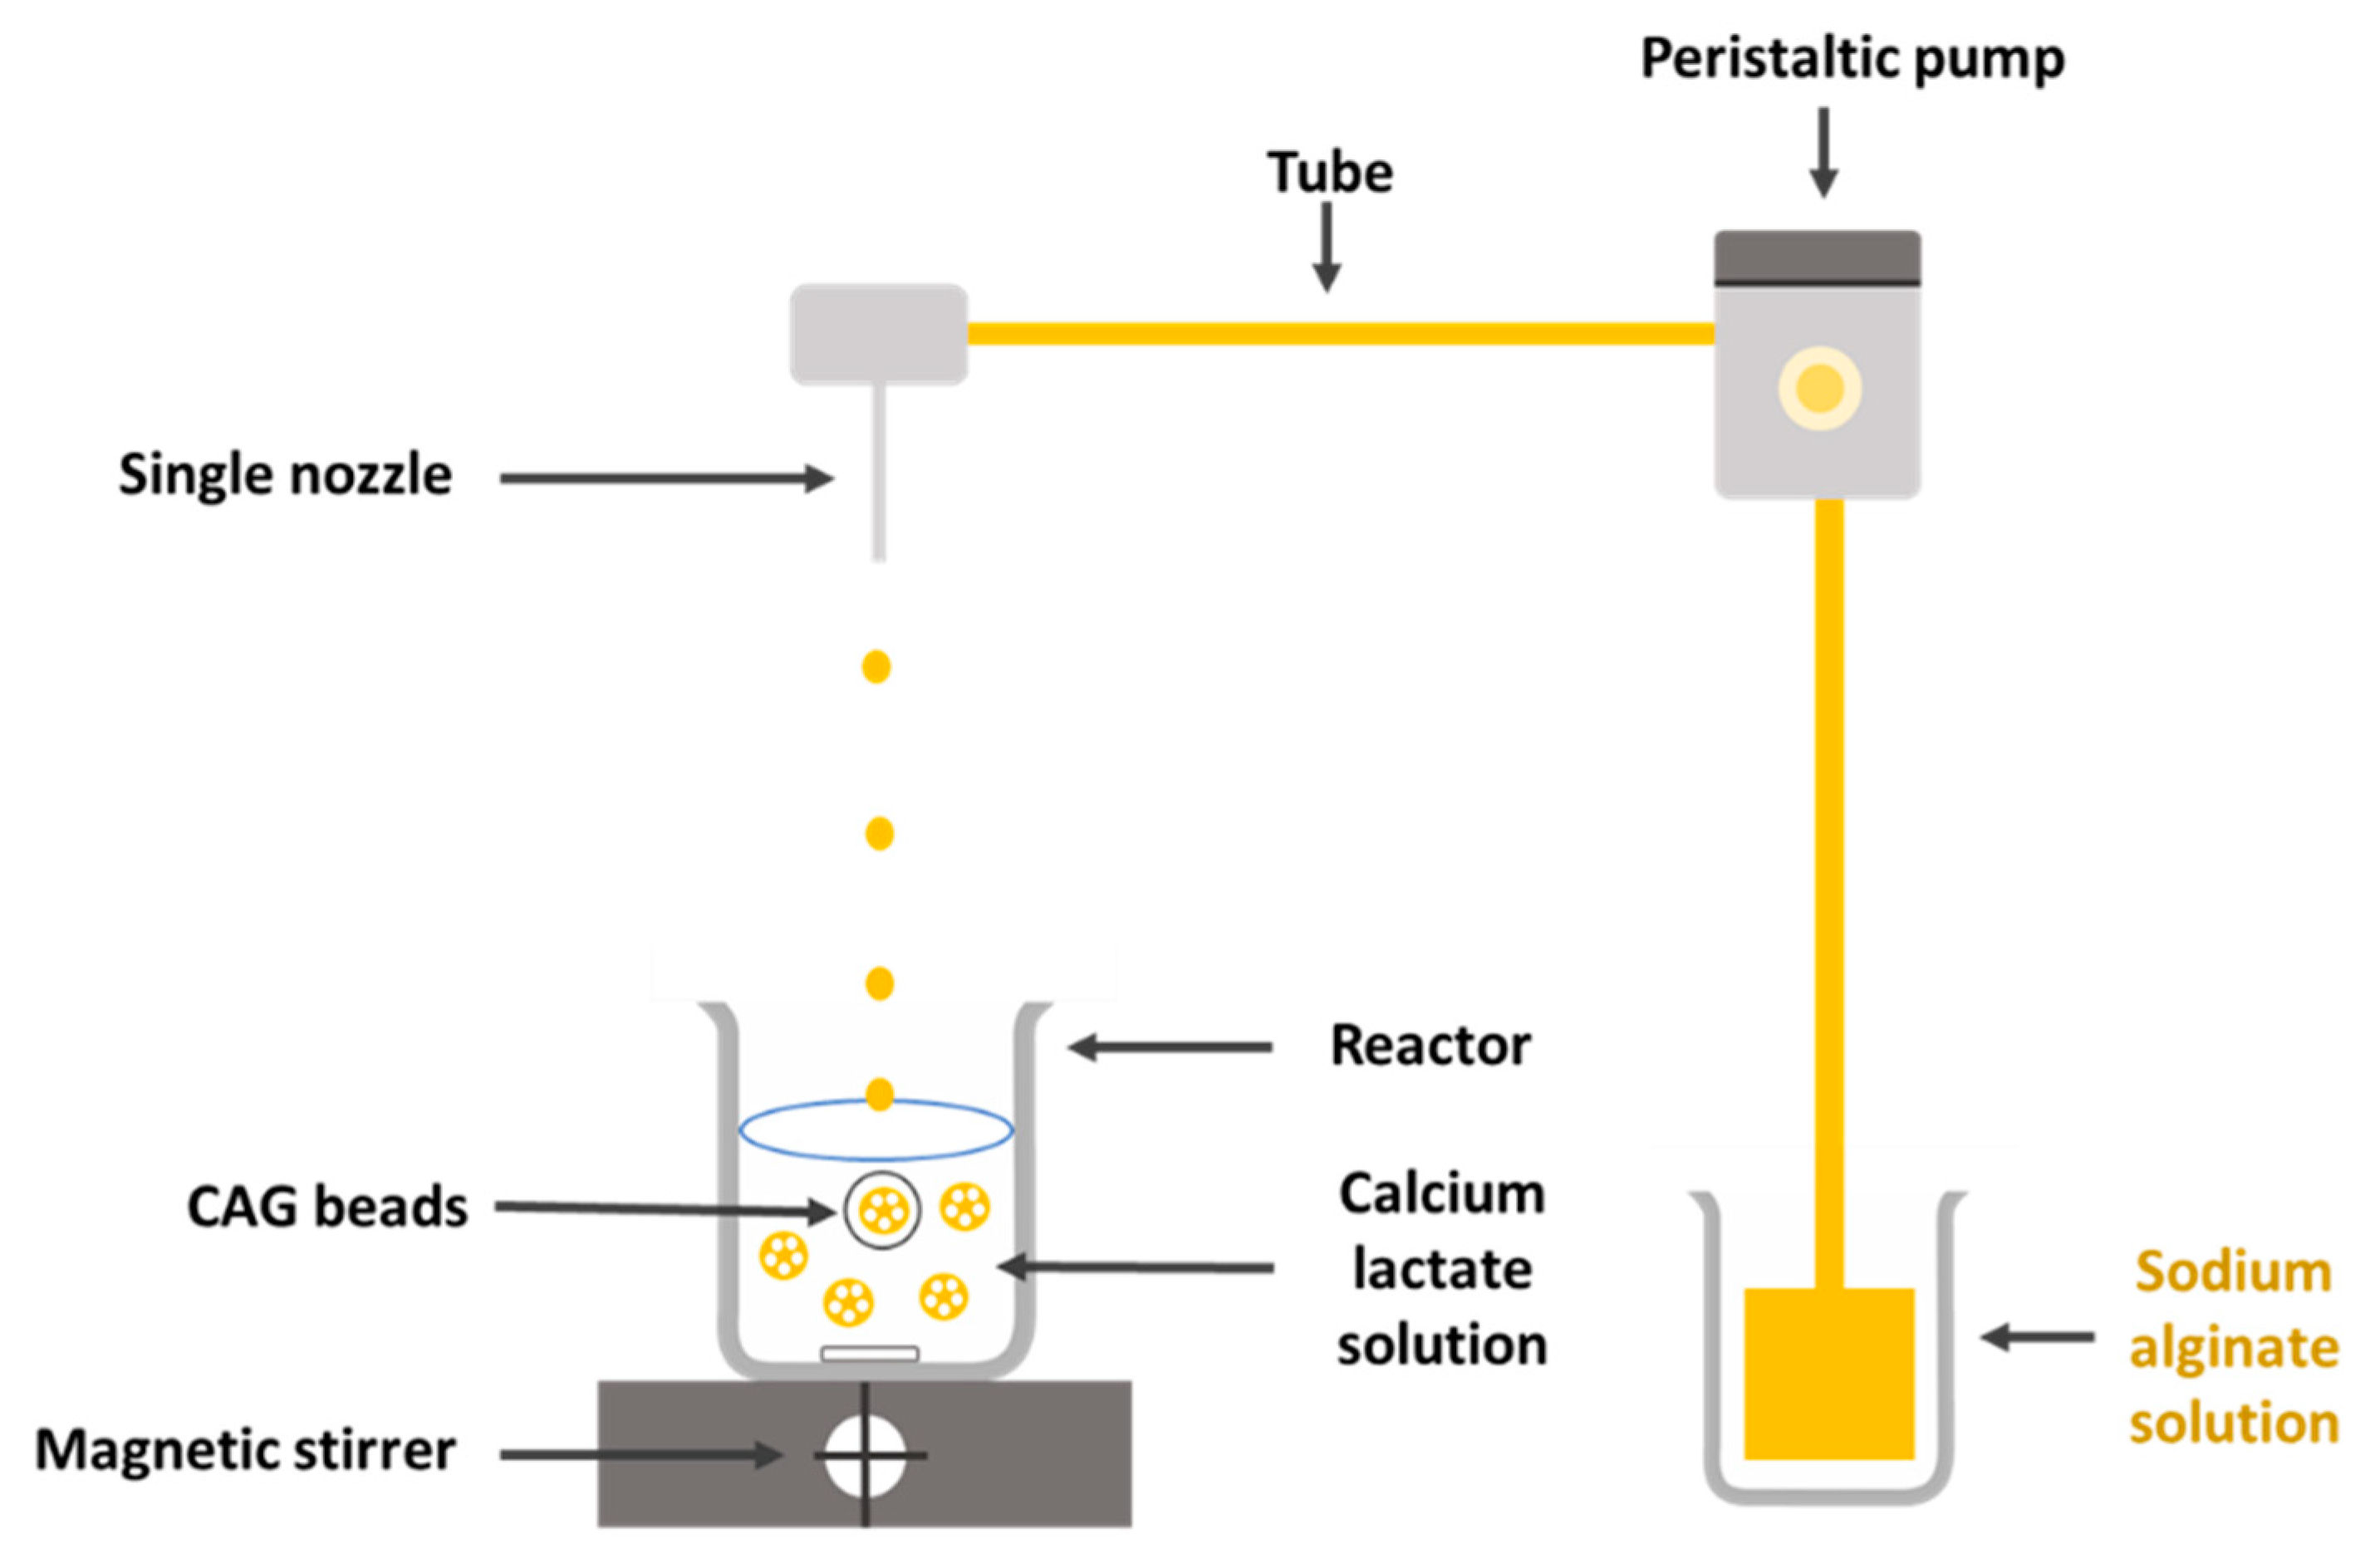
2.2. Preparation of CAG Beads
2.3. Measurement of Size and Sphericity of CAG
2.4. Measurement of Rupture Strength
2.5. Experimental Design
2.6. Data Analysis and Optimization
2.7. Scanning Electron Microscopy (SEM)
2.8. Weight and Water Contents of the CAG Beads
2.9. Measurement of Density
3. Results and Discussion
3.1. Diagnostic Checking of the Fitted Models
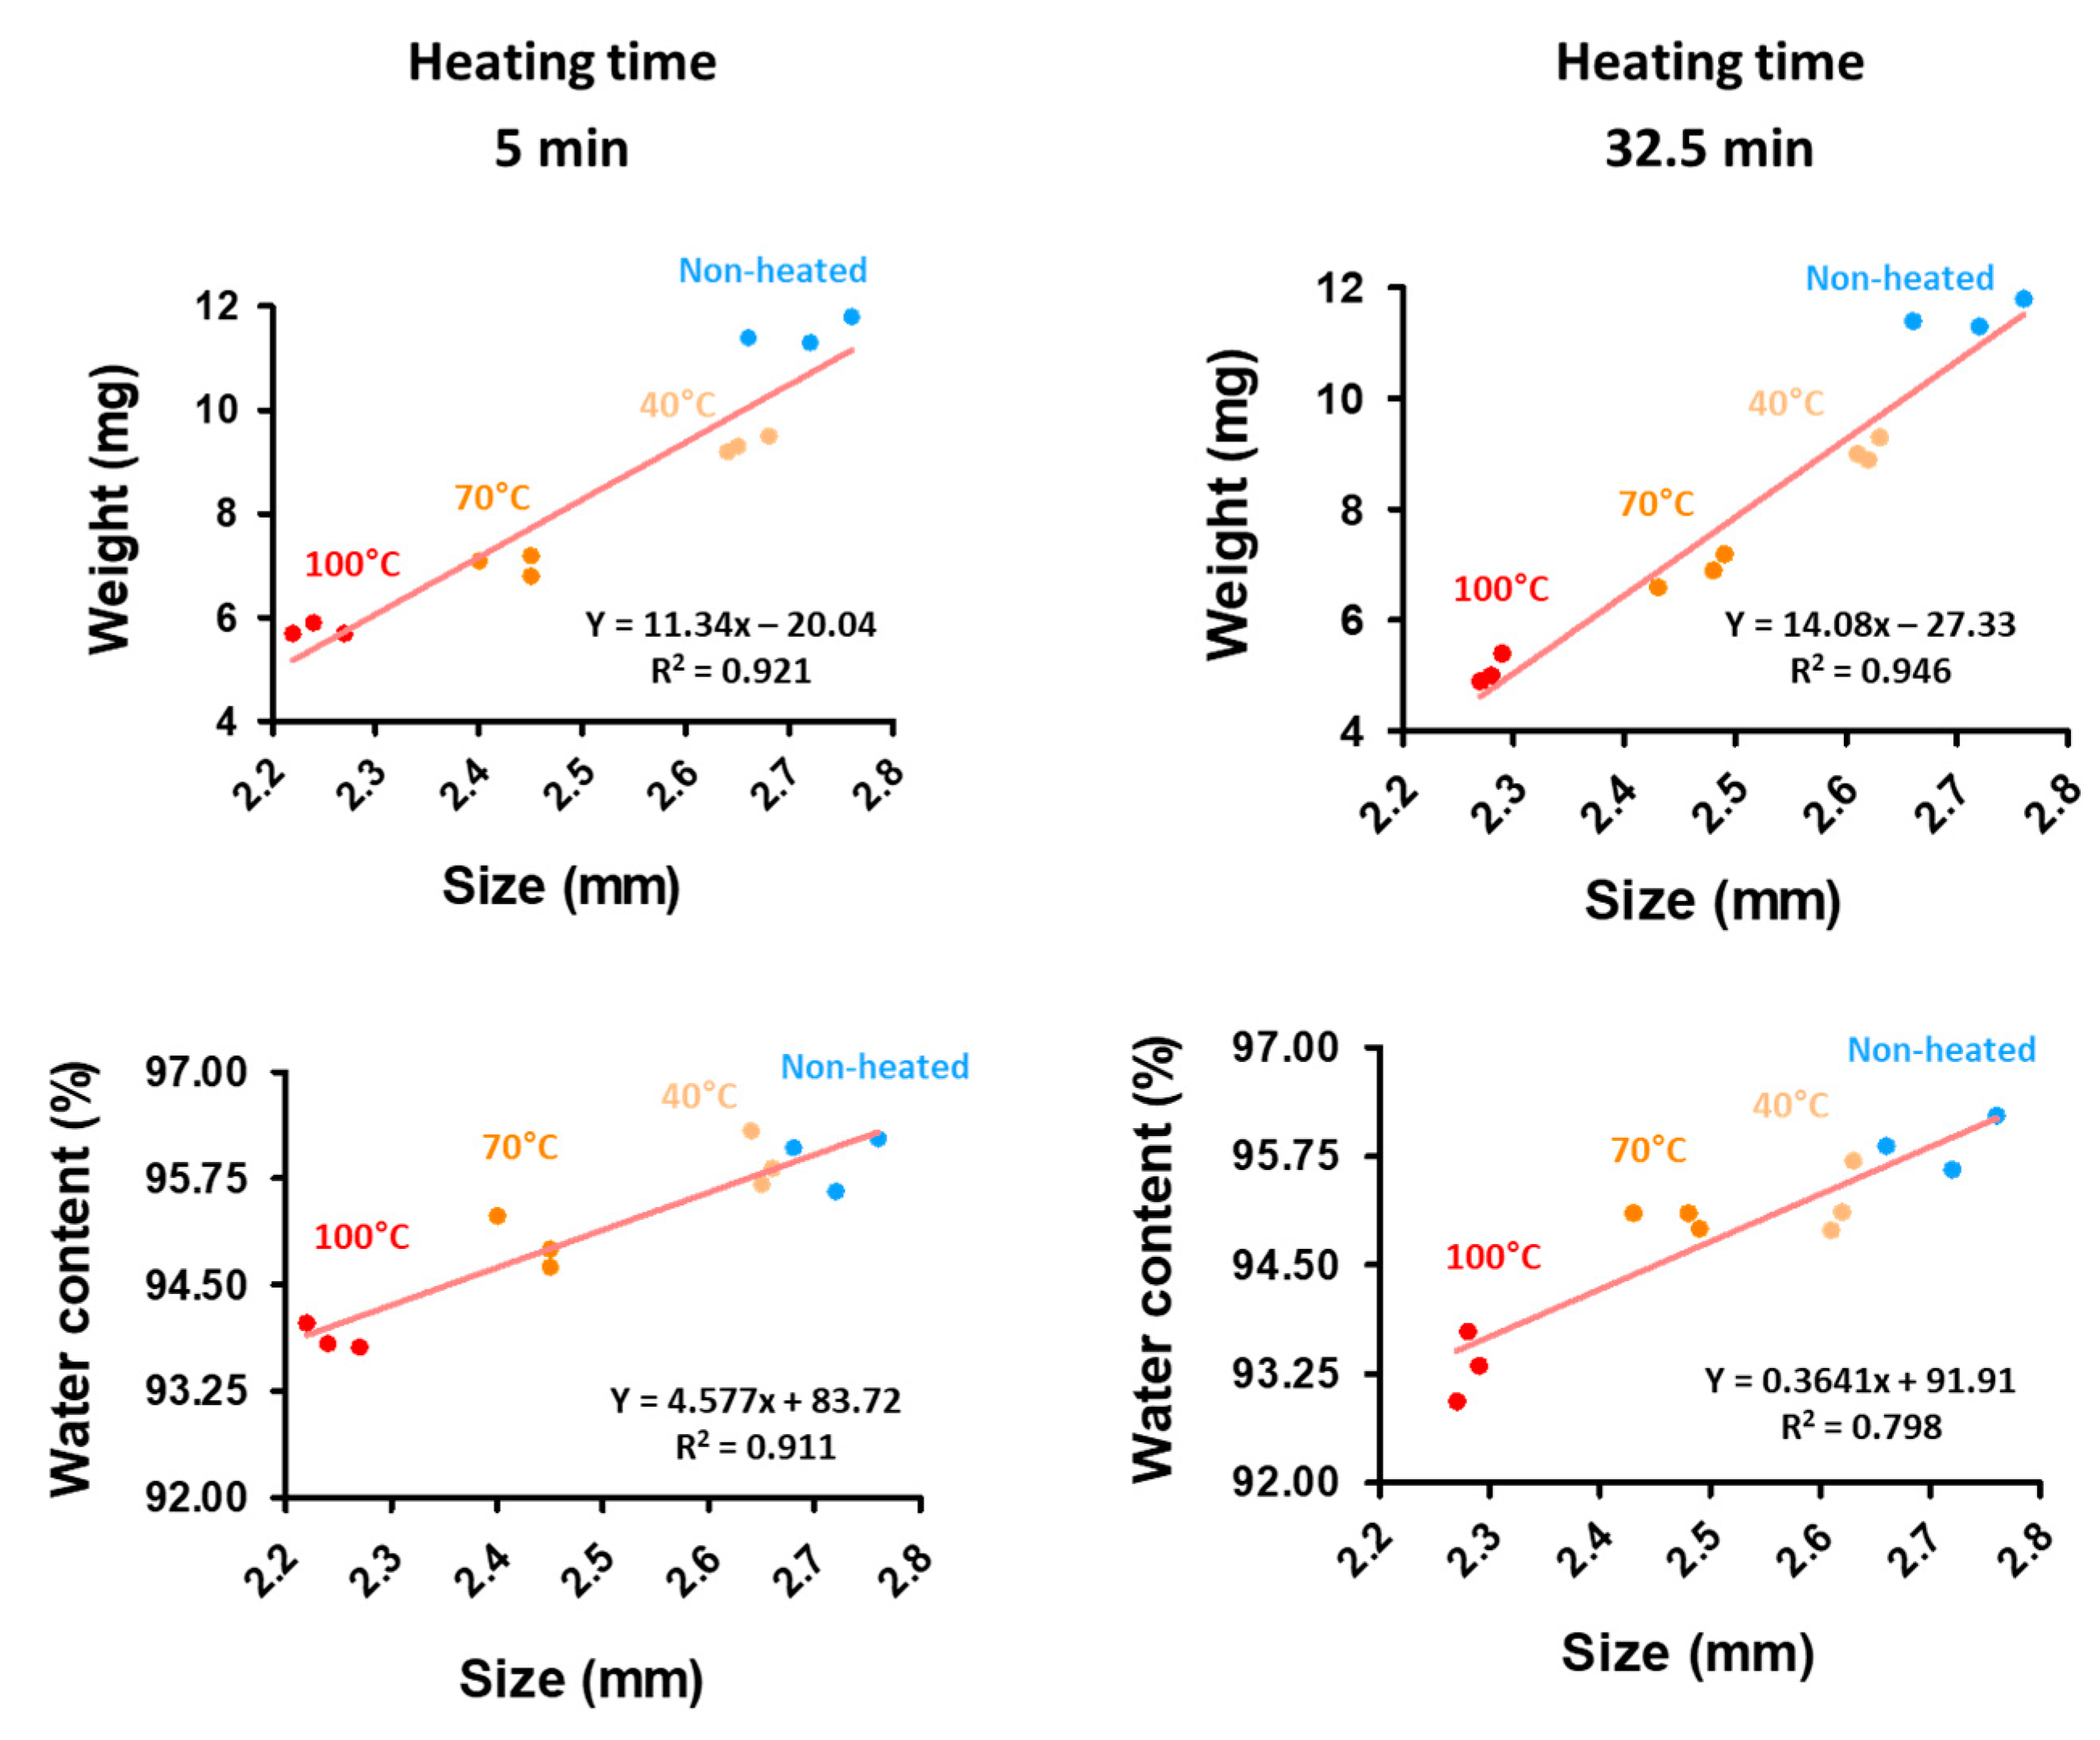
3.2. Response Surface Plots and the Effect of Factors
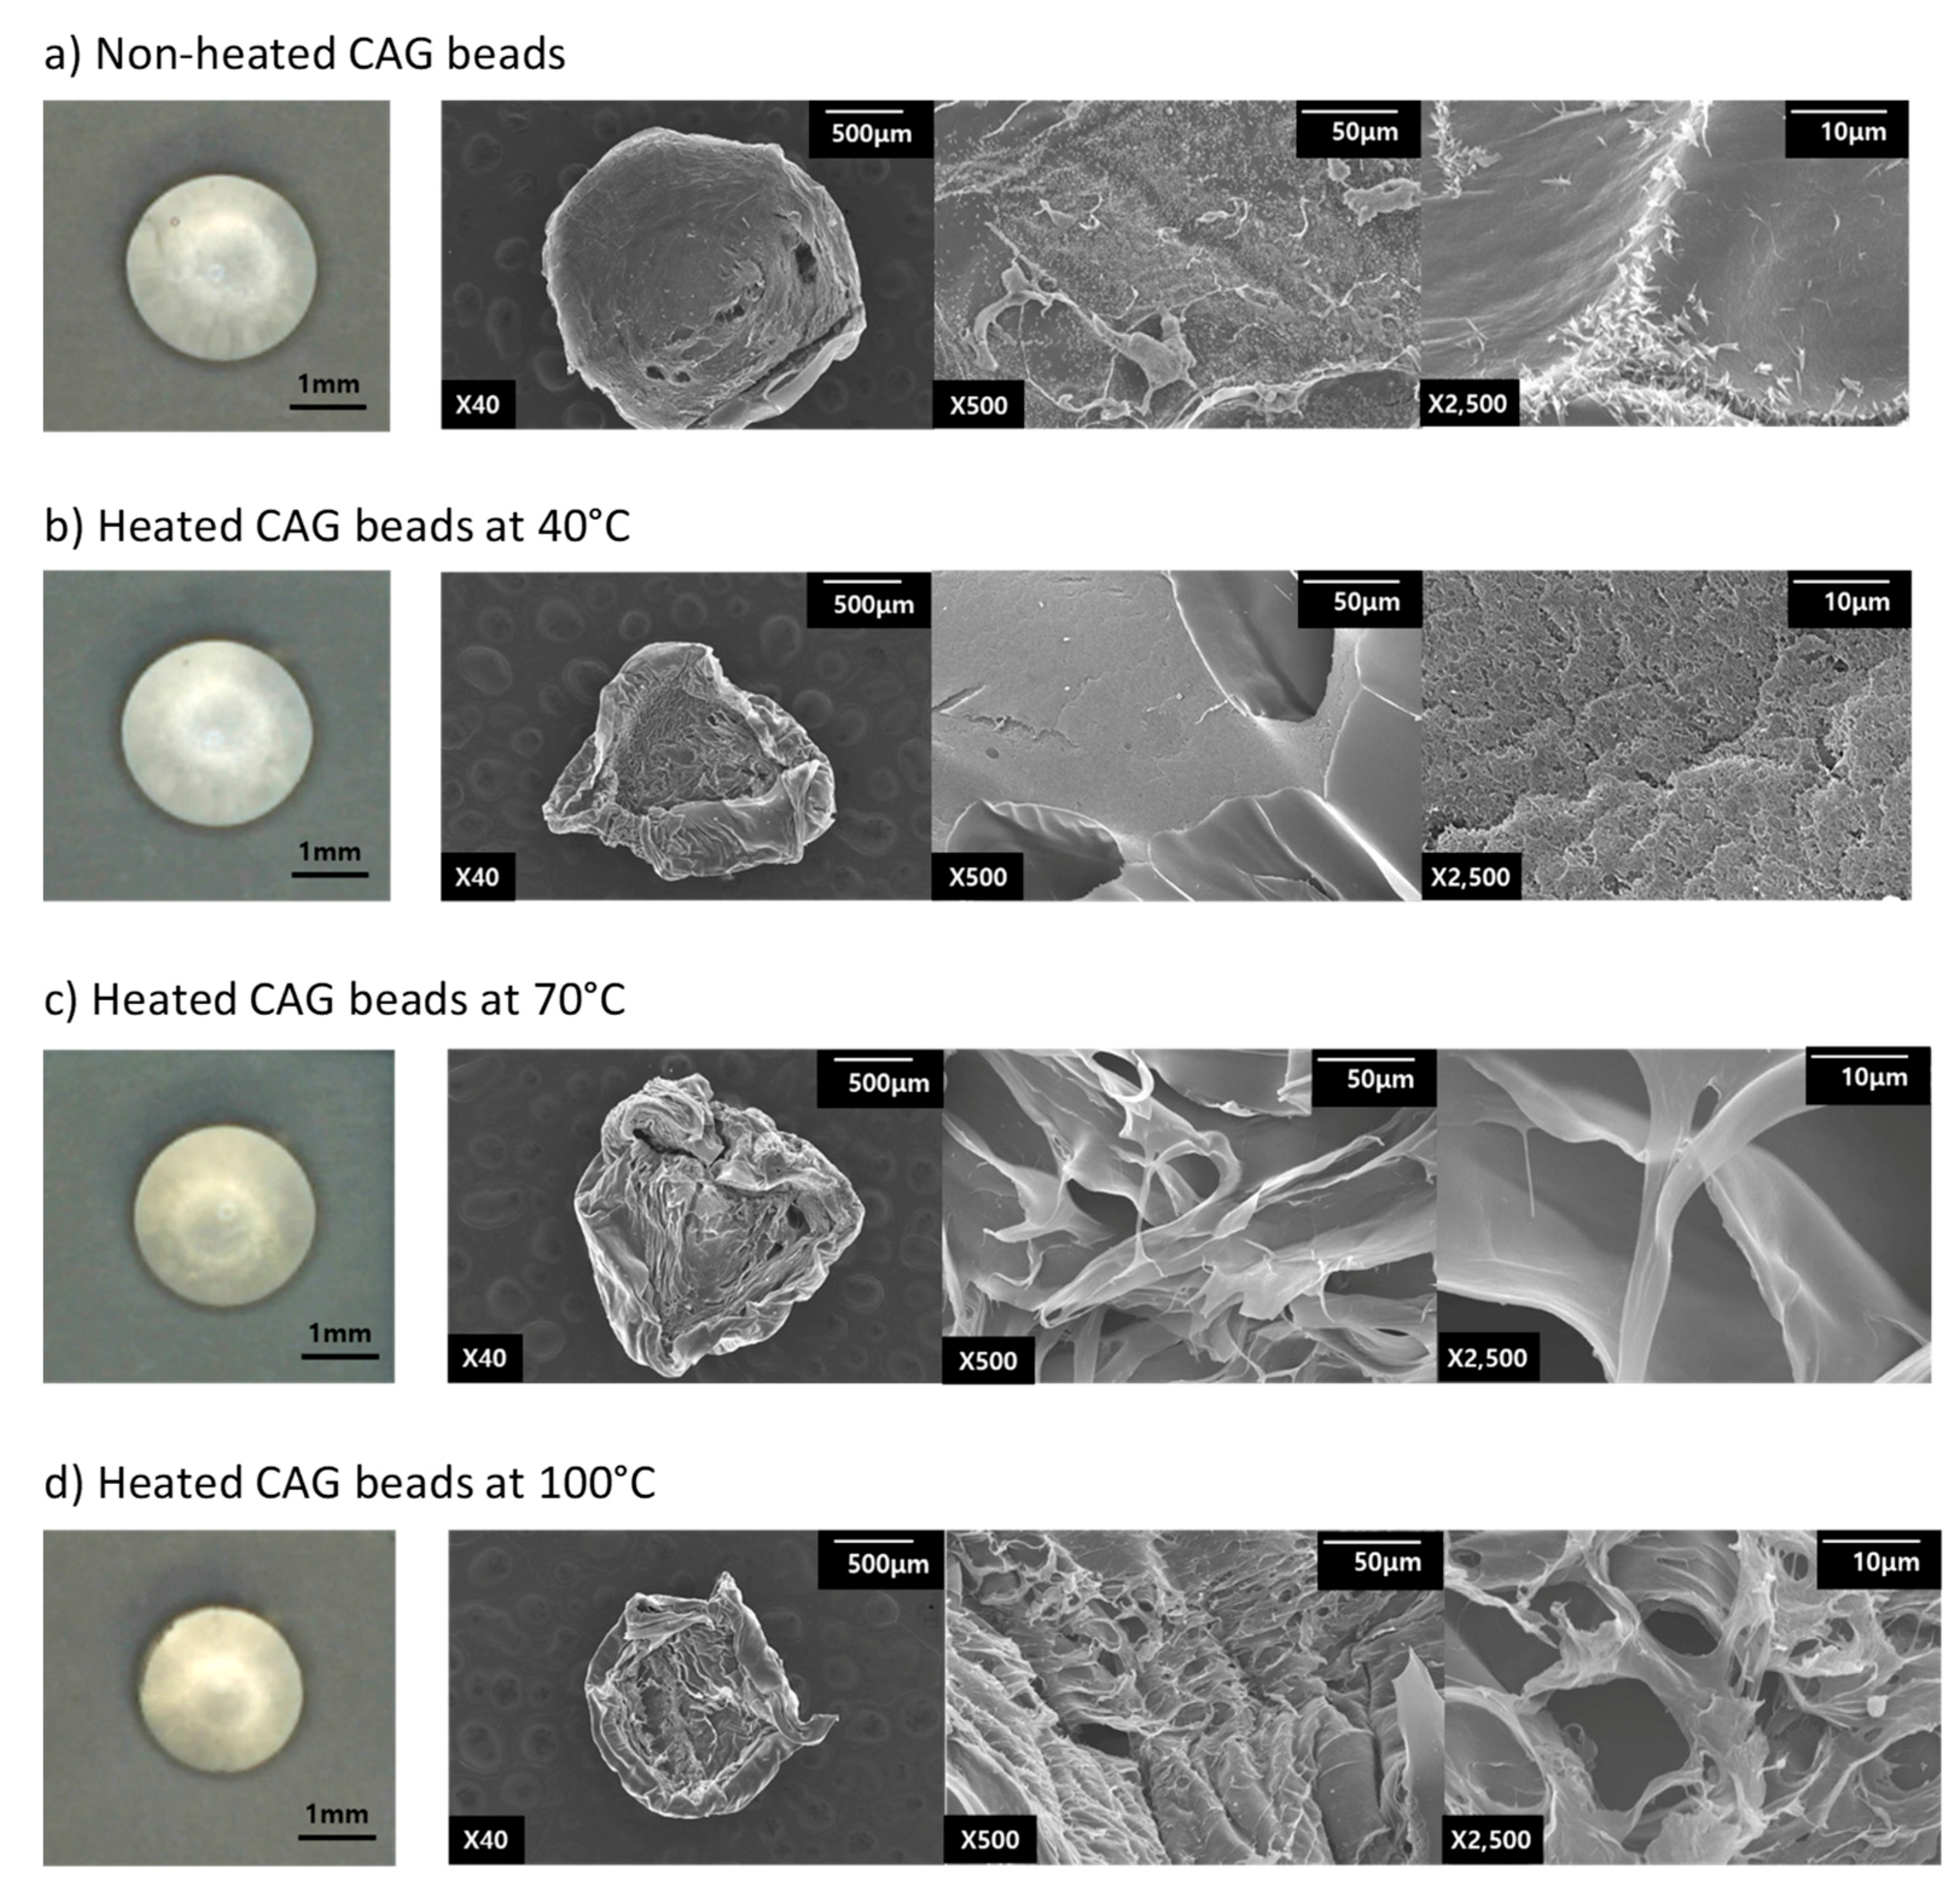
3.3. Microstructure
3.4. Optimal Conditions and Verification
4. Conclusions
Author Contributions
Funding
Conflicts of Interest
References
- Leong, J.Y.; Lam, W.H.; Ho, K.W.; Voo, W.P.; Lee, M.F.X.; Lim, H.P.; Lim, S.L.; Tey, B.T.; Poncelet, D.; Chan, E.S. Advances in Fabricating Spherical Alginate Hydrogels with Controlled Particle Designs by Ionotropic Gelation as Encapsulation Systems. Particuology 2016, 24, 44–60. [Google Scholar] [CrossRef]
- Tavassoli-Kafrani, E.; Shekarchizadeh, H.; Masoudpour-Behabadi, M. Development of Edible Films and Coatings from Alginates and Carrageenans. Carbohydr. Polym. 2016, 137, 360–374. [Google Scholar] [CrossRef] [PubMed]
- Yang, J.S.; Xie, Y.J.; He, W. Research Progress on Chemical Modification of Alginate: A Review. Carbohydr. Polym. 2011, 84, 33–39. [Google Scholar] [CrossRef]
- Lopez-Sanchez, P.; Fredriksson, N.; Larsson, A.; Altskär, A.; Ström, A. High Sugar Content Impacts Microstructure, Mechanics and Release of Calcium-Alginate Gels. Food Hydrocoll. 2018, 84, 26–33. [Google Scholar] [CrossRef]
- Zactiti, E.M.; Kieckbusch, T.G. Potassium Sorbate Permeability in Biodegradable Alginate Films: Effect of the Antimicrobial Agent Concentration and Crosslinking Degree. J. Food Eng. 2006, 77, 462–467. [Google Scholar] [CrossRef]
- Lee, K.Y.; Mooney, D.J. Alginate: Properties and Biomedical Applications. Prog. Polym. Sci. 2012, 37, 106–126. [Google Scholar] [CrossRef]
- Ji, C.; Cho, S.; Gu, Y.; Kim, S. The Processing Optimization of Caviar Analogs Encapsulated by Calcium-Alginate Gel Membranes. Food Sci. Biotechnol. 2007, 16, 557–564. [Google Scholar]
- Ha, B.B.; Jo, E.H.; Cho, S.; Kim, S.B. Production Optimization of Flying Fish Roe Analogs Using Calcium Alginate Hydrogel Beads. Fish. Aquat. Sci. 2016, 19, 1–7. [Google Scholar] [CrossRef]
- Roh, H.-J.; Jo, E.-H.; Kim, H.-D.; Kim, S.-B. Effects of Physicochemical Parameters on Production of Cooked Rice Analogs by Calcium Alginate Gels. Korean J. Fish. Aquat. Sci. 2016, 49, 20–25. [Google Scholar] [CrossRef]
- Madoumier, M.; Trystram, G.; Sébastian, P.; Collignan, A. Towards a holistic approach for multi-objective optimization of food processes: A critical review. Trends Food Sci. Tech. 2019, 86, 1–15. [Google Scholar] [CrossRef]
- Ching, S.H.; Bansal, N.; Bhandari, B. Alginate gel particles–A review of production techniques and physical properties. Crit. Rev. Food Sci. Nutr. 2017, 57, 1133–1152. [Google Scholar] [CrossRef]
- Erbay, Z.; Icier, F. Optimization of hot air drying of olive leaves using response surface methodology. J. Food Eng. 2009, 91, 533–541. [Google Scholar] [CrossRef]
- Jancy, S.; Shruthy, R.; Preetha, R. Fabrication of packaging film reinforced with cellulose nanoparticles synthesised from jack fruit non-edible part using response surface methodology. Int. J. Biol. Macromol. 2019, in press. [Google Scholar] [CrossRef]
- Said, K.A.M.; Amin, M.A.M. Overview on the response surface methodology (RSM) in extraction processes. J. Appl. Sci. Process Eng. 2015, 2. [Google Scholar]
- Bezerra, M.A.; Santelli, R.E.; Oliveira, E.P.; Villar, L.S.; Escaleira, L.A. Response Surface Methodology (RSM) as a Tool for Optimization in Analytical Chemistry. Talanta 2008, 76, 965–977. [Google Scholar] [CrossRef] [PubMed]
- Ba, D.; Boyaci, I.H. Modeling and Optimization i: Usability of Response Surface Methodology. J. Food Eng. 2007, 78, 836–845. [Google Scholar]
- Cho, S.M.; Gu, Y.S.; Kim, S.B. Extracting Optimization and Physical Properties of Yellowfin Tuna ( Thunnus Albacares ) Skin Gelatin Compared to Mammalian Gelatins. Food Hydrocoll. 2005, 19, 221–229. [Google Scholar] [CrossRef]
- Shishir, M.R.I.; Taip, F.S.; Aziz, N.A.; Talib, R.A.; Sarker, M.S.H. Optimization of spray drying parameters for pink guava powder using RSM. Food Sci. Biotechnol. 2016, 25, 461–468. [Google Scholar] [CrossRef]
- Noshadi, I.; Amin, N.A.S.; Parnas, R.S. Continuous production of biodiesel from waste cooking oil in a reactive distillation column catalyzed by solid heteropolyacid: Optimization using response surface methodology (RSM). Fuel 2012, 94, 156–164. [Google Scholar] [CrossRef]
- Isa, K.M.; Daud, S.; Hamidin, N.; Ismail, K.; Saad, S.A.; Kasim, F.H. Thermogravimetric Analysis and the Optimisation of Bio-Oil Yield from Fixed-Bed Pyrolysis of Rice Husk Using Response Surface Methodology (RSM). Ind. Crops. Prod. 2011, 33, 481–487. [Google Scholar] [CrossRef]
- Bimakr, M.; Rahman, R.A.; Ganjloo, A.; Taip, F.S.; Salleh, L.M.; Sarker, M.Z.I. Optimization of Supercritical Carbon Dioxide Extraction of Bioactive Flavonoid Compounds from Spearmint (Mentha Spicata L.) Leaves by Using Response Surface Methodology. Food Bioprocess Tech. 2012, 5, 912–920. [Google Scholar] [CrossRef]
- Bahrani, S.; Razmi, Z.; Ghaedi, M.; Asfaram, A.; Javadian, H. Ultrasound-accelerated synthesis of gold nanoparticles modified choline chloride functionalized graphene oxide as a novel sensitive bioelectrochemical sensor: Optimized meloxicam detection using CCD-RSM design and application for human plasma sample. Ultrason. Sonochem. 2018, 42, 776–786. [Google Scholar] [CrossRef] [PubMed]
- Serp, D.; Mueller, M.; Von Stockar, U.; Marison, I.W. Low-Temperature Electron Microscopy for the Study of Polysaccharide Ultrastructures in Hydrogels. II. Effect of Temperature on the Structure of Ca2+-Alginate Beads. Biotechnol. Bioeng. 2002, 79, 253–259. [Google Scholar] [CrossRef] [PubMed]
- Mousavi, S.M.R.; Rafe, A.; Yeganehzad, S. Textural, Mechanical, and Microstructural Properties of Restructured Pimiento Alginate-Guar Gels. J. Texture Stud. 2019, 50, 155–164. [Google Scholar] [CrossRef] [PubMed]
- Woo, J.W.; Roh, H.J.; Park, H.D.; Lee, Y.B.; Kim, S.B.; Ji, C.I. Sphericity Optimization of Calcium Alginate Gel Beads and the Effects of Processing Conditions on Their Physical Properties. Food Sci. Biotechnol. 2007, 16, 715–721. [Google Scholar]
- Singh, D.; Tripathi, A.; Zo, S.M.; Singh, D.; Han, S.S. Synthesis of Composite Gelatin-Hyaluronic Acid-Alginate Porous Scaffold and Evaluation for in Vitro Stem Cell Growth and in Vivo Tissue Integration. Colloids Surf. B 2014, 116, 502–509. [Google Scholar] [CrossRef] [PubMed]
- Zohuriaan, M.J.; Shokrolahi, F. Thermal Studies on Natural and Modified Gums. Polym. Test. 2004, 23, 575–579. [Google Scholar] [CrossRef]
- Yang, H.; Li, H.; Zhai, J.; Sun, L.; Zhao, Y.; Yu, H. Magnetic Prussian Blue/Graphene Oxide Nanocomposites Caged in Calcium Alginate Microbeads for Elimination of Cesium Ions from Water and Soil. Chem. Eng. J. 2014, 246, 10–19. [Google Scholar] [CrossRef]
- Vargas, P.O.; Pereira, N.R.; Guimarães, A.O.; Waldman, W.R.; Pereira, V.R. Shrinkage and Deformation during Convective Drying of Calcium Alginate. LWT Food Sci. Technol. 2018, 97, 213–222. [Google Scholar] [CrossRef]
- Sun-Waterhouse, D.; Wang, W.; Waterhouse, G.I. Canola oil encapsulated by alginate and its combinations with starches of low and high amylose content: Effect of quercetin on oil stability. Food Bioprocess Tech. 2014, 7, 2159–2177. [Google Scholar] [CrossRef]
- Mishyna, M.; Martinez, J.J.I.; Chen, J.; Davidovich-Pinhas, M.; Benjamin, O. Heat-Induced Aggregation and Gelation of Proteins from Edible Honey Bee Brood (Apis Mellifera) as a Function of Temperature and PH. Food Hydrocoll. 2019, 91, 117–126. [Google Scholar] [CrossRef]
- Roopa, B.S.; Bhattacharya, S. Alginate Gels: Ii. Stability at Different Processing Conditions. J. Food Process Eng. 2010, 33, 466–480. [Google Scholar] [CrossRef]
- Malakar, J.; Nayak, A.K.; Pal, D. Development of cloxacillin loaded multiple-unit alginate-based floating system by emulsion–gelation method. Int. J. Biol. Macromol. 2015, 50, 138–147. [Google Scholar] [CrossRef] [PubMed]


| Independent Variables | Symbol | Range and Levels | ||||
|---|---|---|---|---|---|---|
| –1.414 | –1 | 0 | +1 | +1.414 | ||
| Heating temperature (°C) | X1 | 40 | 49 | 70 | 91 | 100 |
| Heating time (min) | X2 | 5 | 13 | 33 | 52 | 60 |
| Run No. | Independent Variables | Dependent Variables * | ||||||
|---|---|---|---|---|---|---|---|---|
| Coded Values | Uncoded Values | |||||||
| X1 | X2 | X1 | X2 | Y1 | Y2 | Y3 | ||
| Factorial portions | 1 | –1 | –1 | 49 | 13.1 | 2658 | 2.73 | 96.6 |
| 2 | 1 | –1 | 91 | 13.1 | 3692 | 2.31 | 95.6 | |
| 3 | –1 | 1 | 49 | 52 | 2243 | 2.73 | 96.6 | |
| 4 | 1 | 1 | 91 | 52 | 3516 | 2.28 | 95.5 | |
| Axial portions | 5 | –1.414 | 0 | 40 | 32.5 | 2597 | 2.62 | 96.0 |
| 6 | 1.414 | 0 | 100 | 32.5 | 3408 | 2.28 | 95.4 | |
| 7 | 0 | –1.414 | 70 | 5 | 3244 | 2.46 | 97.6 | |
| 8 | 0 | 1.414 | 70 | 60 | 2773 | 2.44 | 96.7 | |
| Center points | 9 | 0 | 0 | 70 | 32.5 | 3060 | 2.48 | 98.0 |
| 10 | 0 | 0 | 70 | 32.5 | 3177 | 2.43 | 98.2 | |
| 11 | 0 | 0 | 70 | 32.5 | 3032 | 2.49 | 98.7 | |
| Quadratic Polynomial Model Equations | R2 | Adj R2 | S | p-Value |
|---|---|---|---|---|
| Y1 = 3090 + 431.7 X1 – 157.1 X2 – 38.1 X12 – 35.1 X22 + 59.8 X1X2 | 0.904 | 0.808 | 190.633 | 0.014 |
| Y2 = 2.34667 – 0.1689 X1 – 0.0073 X2 – 0.0073 X12 – 0.0073 X22 – 0.0075 X1X2 | 0.888 | 0.777 | 0.0759091 | 0.020 |
| Y3 = 98.300 – 0.369 X1 – 0.172 X2 – 1.388 X12 – 0.663 X22 – 0.025 X1X2 | 0.935 | 0.870 | 0.417781 | 0.005 |
| Dependent Variables | Sources | DF | SS | MS | F-Value | p-Value |
|---|---|---|---|---|---|---|
| Y1 Rupture strength (kPa) | Regression | |||||
| Linear | 2 | 1688737 | 84436 | 23.23 | 0.003 * | |
| Square | 2 | 11756 | 5878 | 0.16 | 0.855 | |
| Interaction | 1 | 14280 | 14280 | 0.39 | 0.558 | |
| Residual | ||||||
| Lack of fit | 3 | 169872 | 56624 | 9.57 | 0.096 | |
| Pure error | 2 | 11833 | 5916 | |||
| Total | 10 | 1896479 | ||||
| Y2 Size (mm) | Regression | |||||
| Linear | 2 | 0.228518 | 0.114259 | 19.83 | 0.004 * | |
| Square | 2 | 0.000464 | 0.000232 | 0.04 | 0.961 | |
| Interaction | 1 | 0.000225 | 0.000225 | 0.04 | 0.851 | |
| Residual | ||||||
| Lack of fit | 3 | 0.026744 | 0.008915 | 8.63 | 0.106 | |
| Pure error | 2 | 0.002067 | 0.001033 | |||
| Total | 10 | 0.258018 | ||||
| Y3 Sphericity (%) | Regression | |||||
| Linear | 2 | 1.3223 | 0.6611 | 3.79 | 0.100 | |
| Square | 2 | 11.2716 | 5.6358 | 32.29 | 0.001 * | |
| Interaction | 1 | 0.0025 | 0.0025 | 0.01 | 0.909 | |
| Residual | ||||||
| Lack of fit | 3 | 0.6127 | 0.2042 | 1.57 | 0.412 | |
| Pure error | 2 | 0.2600 | 0.1300 | |||
| Total | 10 | 13.4691 |
| Parameters | Y1 Rupture Strength (kPa) | |||
| Coefficient | Square Error | t-Value | p-Value | |
| Constant | 3090 | 110 | 28.07 | 0.001 |
| X1 | 431.7 | 67.4 | 6.41 | 0.001 * |
| X2 | –157.1 | 67.4 | –2.33 | 0.067 |
| X1X1 | –38.1 | 80.2 | -0.48 | 0.654 |
| X2X2 | –35.1 | 80.2 | –0.44 | 0.680 |
| X1X2 | 59.8 | 95.3 | 0.63 | 0.558 |
| Parameters | Y2 Size (mm) | |||
| Coefficient | Square Error | t-Value | p-Value | |
| Constant | 2.4667 | 0.0438 | 56.28 | 0.001 |
| X1 | –0.1689 | 0.0268 | –6.29 | 0.001 * |
| X2 | –0.0073 | 0.0268 | –0.27 | 0.797 |
| X1X1 | 0.0073 | 0.0319 | 0.23 | 0.828 |
| X2X2 | 0.0073 | 0.0319 | 0.23 | 0.828 |
| X1X2 | –0.0075 | 0.0380 | –0.20 | 0.851 |
| Parameters | Y3 Sphericity (%) | |||
| Coefficient | Square Error | t-Value | p-Value | |
| Constant | 98.300 | 0.241 | 407.54 | 0.001 |
| X1 | –0.369 | 0.148 | –2.50 | 0.055 |
| X2 | –0.172 | 0.148 | –1.16 | 0.298 |
| X1X1 | –1.388 | 0.176 | –7.89 | 0.001 * |
| X2X2 | –0.663 | 0.176 | –3.77 | 0.013 * |
| X1X2 | –0.025 | 0.209 | –0.12 | 0.909 |
| Heating Temperature (°C) | Before Heat Treatment | 40 °C | 70 °C | 100 °C |
|---|---|---|---|---|
| Density (g/cm3) | 1.17 ± 0.07 | 1.02 ± 0.03 * | 1.04 ± 0.04 * | 1.26 ± 0.05 |
| Y1 Rupture Strength (kPa) | Y2 Size (mm) | Y3 Sphericity (%) | |
|---|---|---|---|
| Before heat treatment | 3450 ± 112.50 | 2.60 ± 0.05 | 96.5 ± 2.15 |
| Optimal Conditions | X1 Heating Temperature (°C) | X2 Heating Time (min) | |||
|---|---|---|---|---|---|
| Coded Value | Actual Value | Coded Value | Actual Value | ||
| –0.665 | 56.0 | –1.414 | 5 | ||
| Y1 Rupture strength (kPa) | Target value |  | 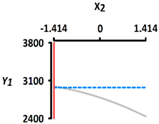 | ||
| 3450 | |||||
| Y2 Size (mm) | Target value |  | 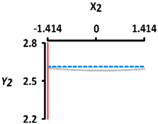 | ||
| 2.60 | |||||
| Y3 Sphericity (%) | Target value | 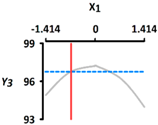 | 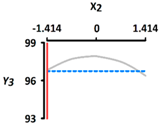 | ||
| 96.5 | |||||
| Y1 Rupture Strength (kPa) | Y2 Size (mm) | Y3 Sphericity (%) | |
|---|---|---|---|
| Predicted values | 2993 | 2.60 | 96.8 |
| Experimental values | 2844 ± 66.64 | 2.55 ± 0.02 | 96.0 ± 2.25 |
| Error (%) | 4.98 | 1.92 | 0.83 |
© 2019 by the authors. Licensee MDPI, Basel, Switzerland. This article is an open access article distributed under the terms and conditions of the Creative Commons Attribution (CC BY) license (http://creativecommons.org/licenses/by/4.0/).
Share and Cite
Kim, S.; Jeong, C.; Cho, S.; Kim, S.-B. Effects of Thermal Treatment on the Physical Properties of Edible Calcium Alginate Gel Beads: Response Surface Methodological Approach. Foods 2019, 8, 578. https://doi.org/10.3390/foods8110578
Kim S, Jeong C, Cho S, Kim S-B. Effects of Thermal Treatment on the Physical Properties of Edible Calcium Alginate Gel Beads: Response Surface Methodological Approach. Foods. 2019; 8(11):578. https://doi.org/10.3390/foods8110578
Chicago/Turabian StyleKim, Seonghui, Chungeun Jeong, Suengmok Cho, and Seon-Bong Kim. 2019. "Effects of Thermal Treatment on the Physical Properties of Edible Calcium Alginate Gel Beads: Response Surface Methodological Approach" Foods 8, no. 11: 578. https://doi.org/10.3390/foods8110578
APA StyleKim, S., Jeong, C., Cho, S., & Kim, S.-B. (2019). Effects of Thermal Treatment on the Physical Properties of Edible Calcium Alginate Gel Beads: Response Surface Methodological Approach. Foods, 8(11), 578. https://doi.org/10.3390/foods8110578