Effects of Lintnerization, Autoclaving, and Freeze-Thaw Treatments on Resistant Starch Formation and Functional Properties of Pathumthani 80 Rice Starch


Abstract
1. Introduction
2. Materials and Methods
2.1. Materials
2.2. Extraction of Native Rice Starch
2.3. Preparation of Lintnerized Rice Starch
2.4. Preparation of Autoclaved and Lintnerized-Autoclaved Rice Starch
2.5. Preparation of Freeze-Thawed Rice Starch
2.6. Determination of the Amylose Content
2.7. Determination of Resistant Starch, Non-Resistant Starch, and Total Starch
2.8. Determination of Glycemic Index (GI)
2.9. Determination of Antioxidant Activity
2.10. Determination of Pasting Properties
2.11. Determination of Swelling Power and Solubility
2.12. Determination of Water Holding Capacity (WHC)
2.13. Scanning Electron Microscopy
2.14. Chemical Finger Printing of Produced Starch by Fourier Transform Infrared (FTIR) Spectroscopy
2.15. Color
2.16. Statistical Analysis
3. Results and Discussion
3.1. Chemical Composition
3.2. Glycemic Index
3.3. Antioxidant Properties
3.4. Pasting Properties
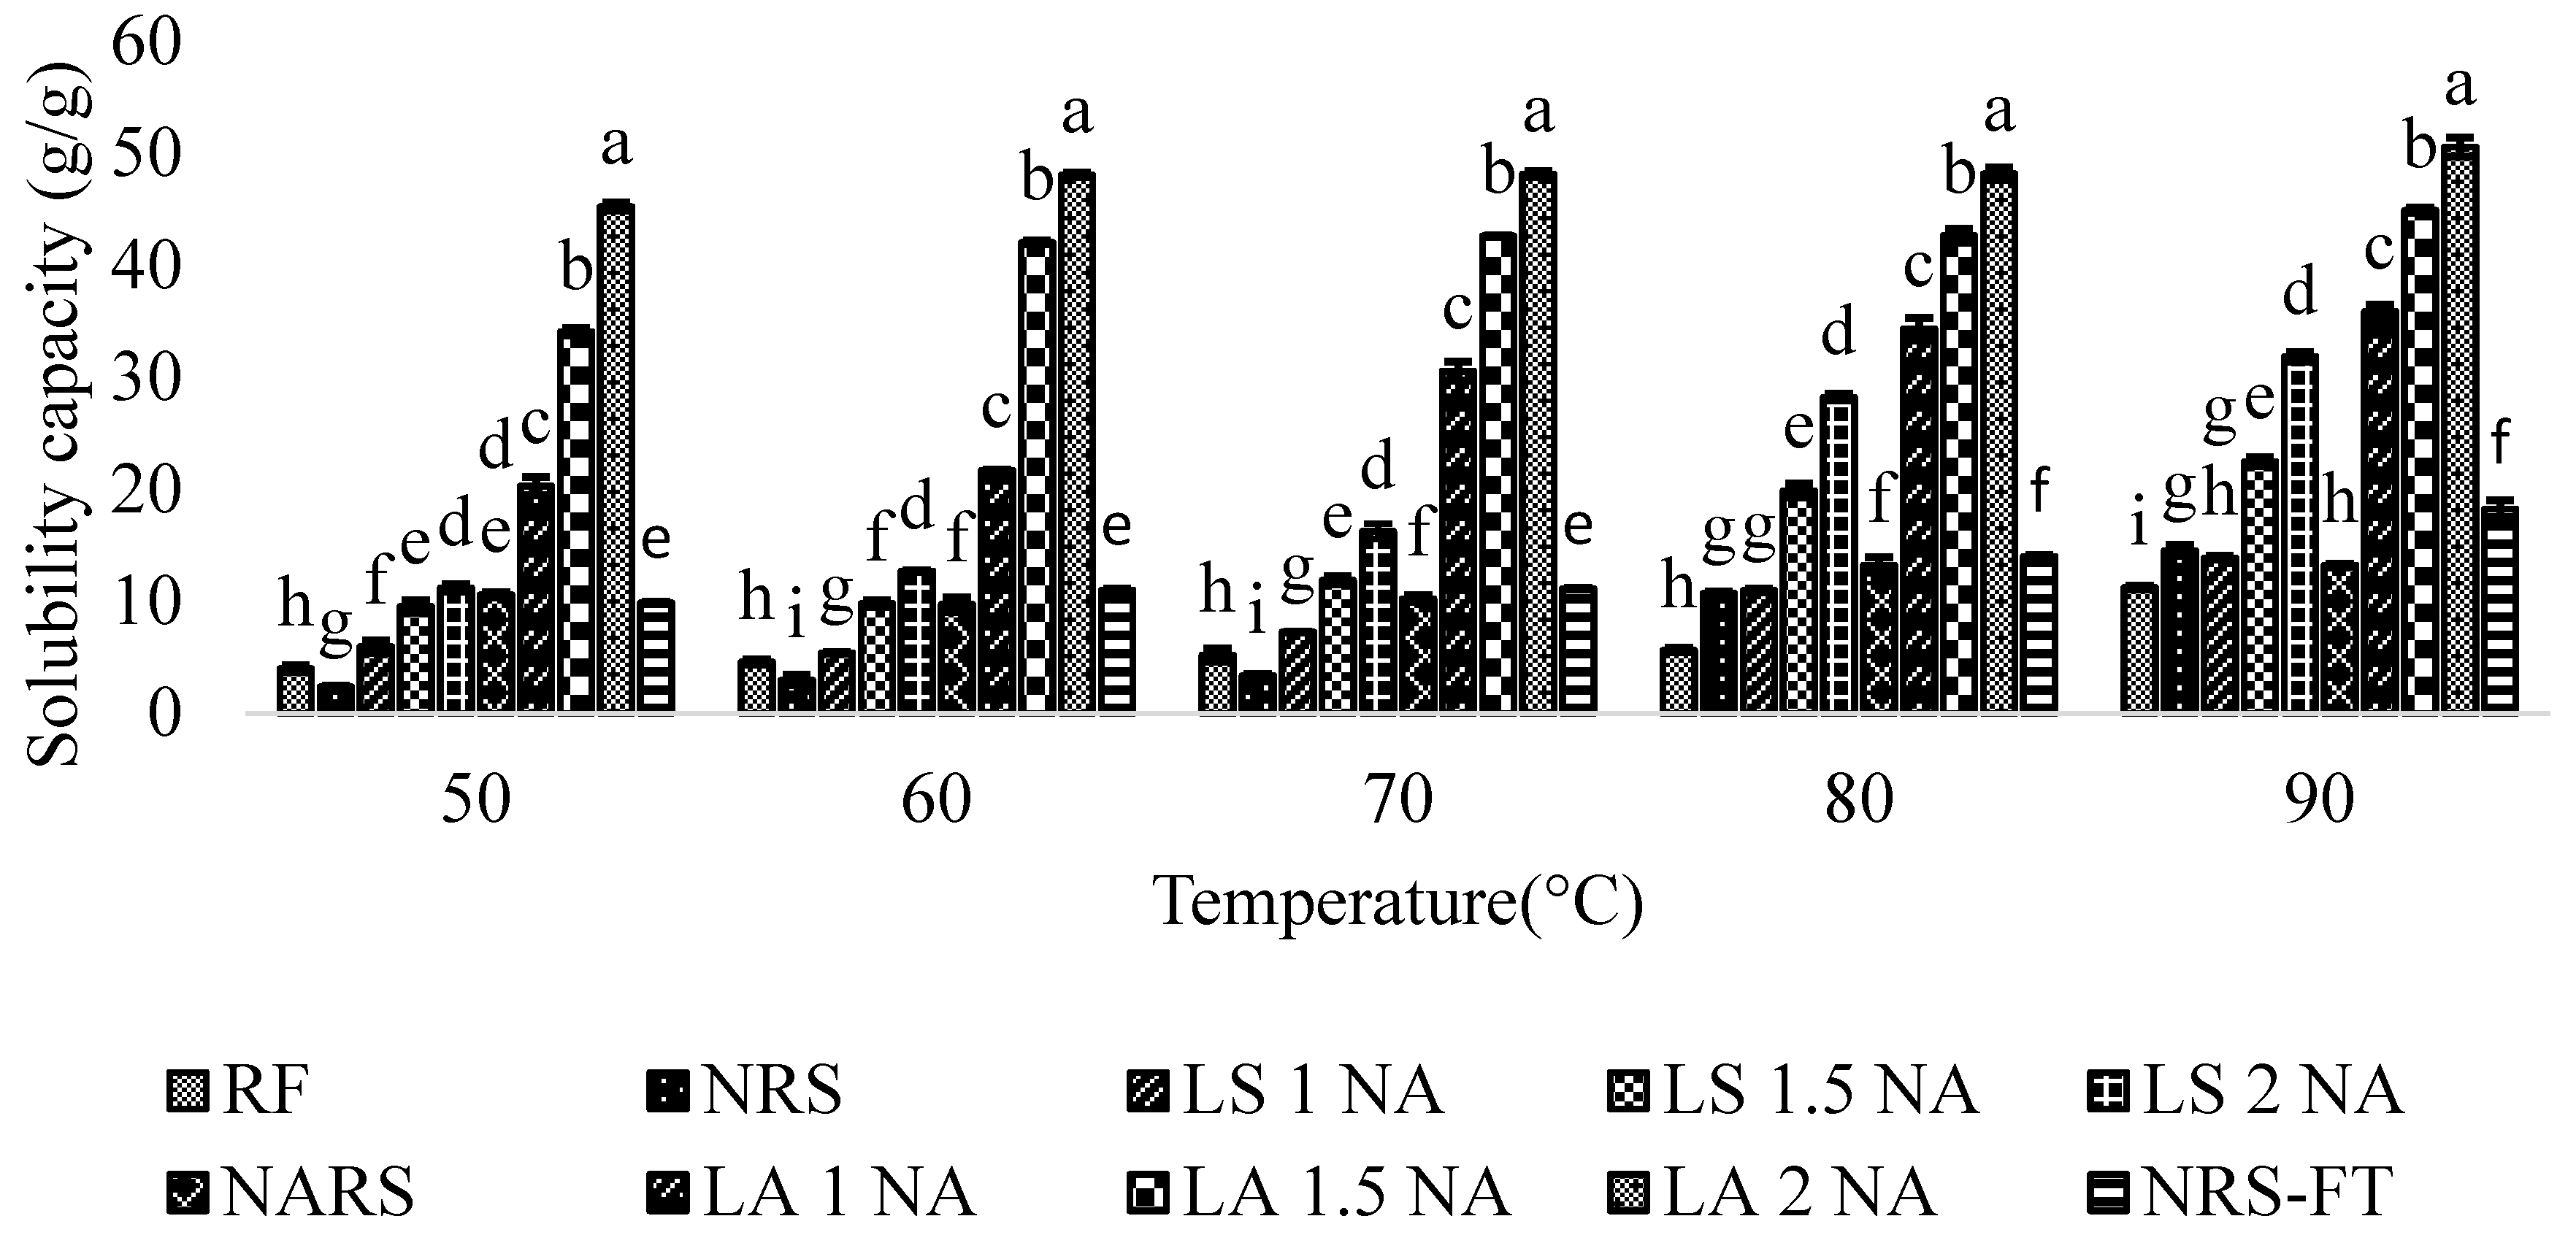
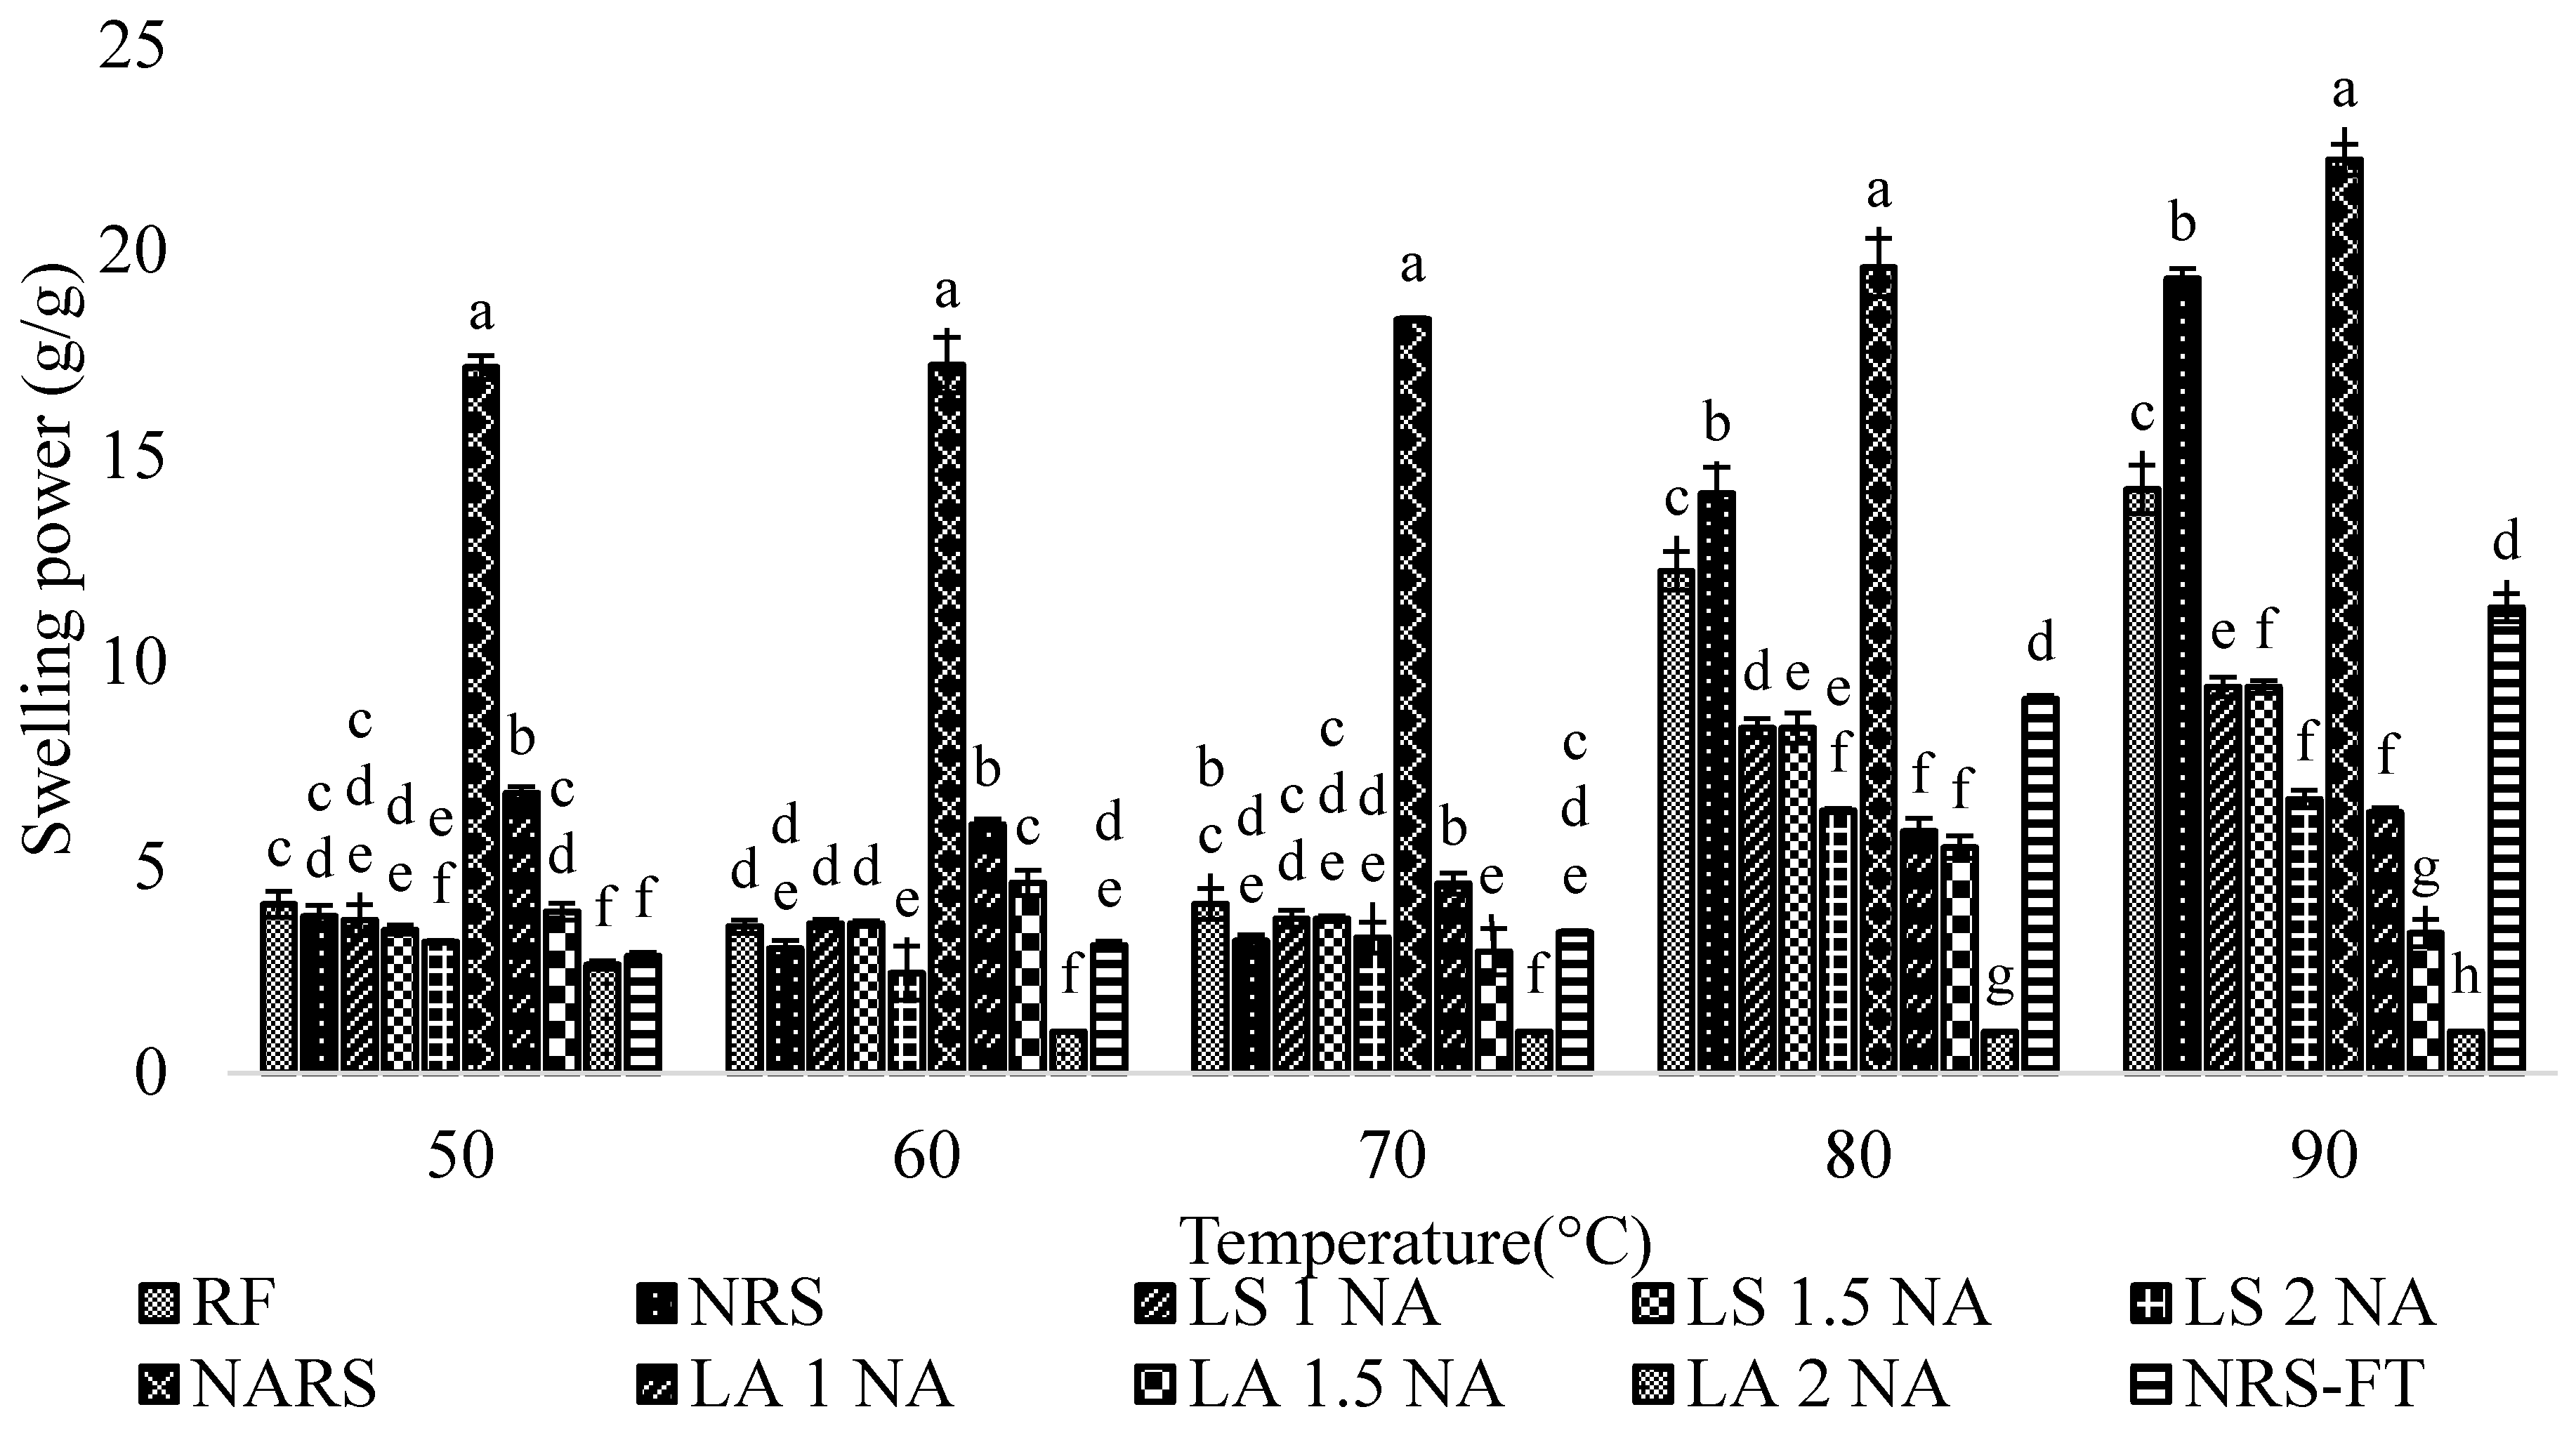
3.5. Solubility, Swelling Power, and Water Holding Capacity
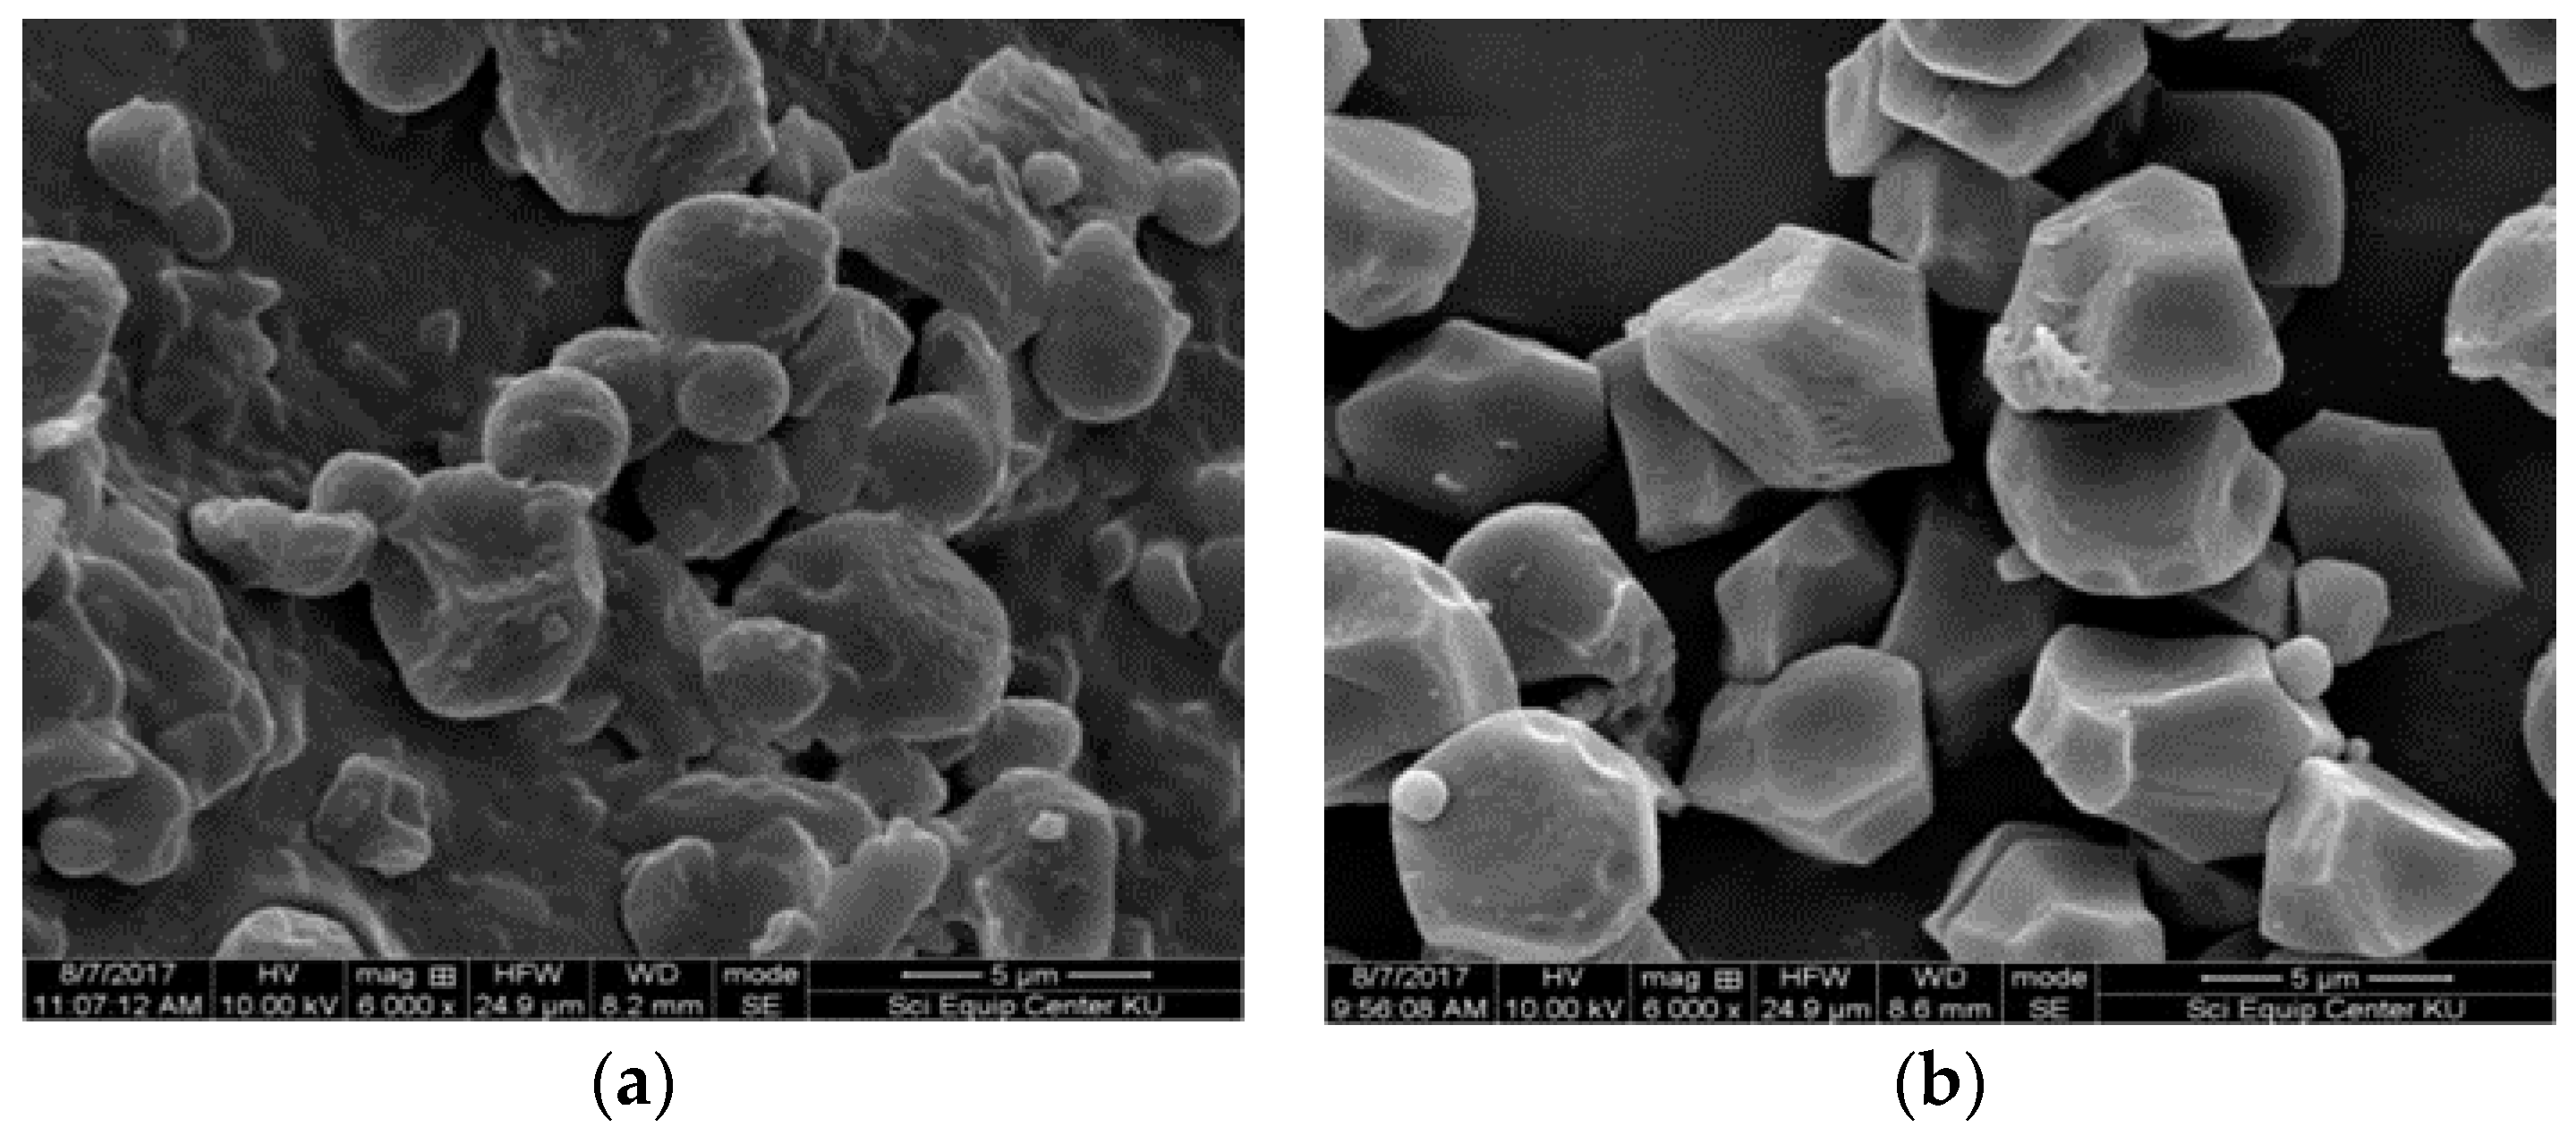
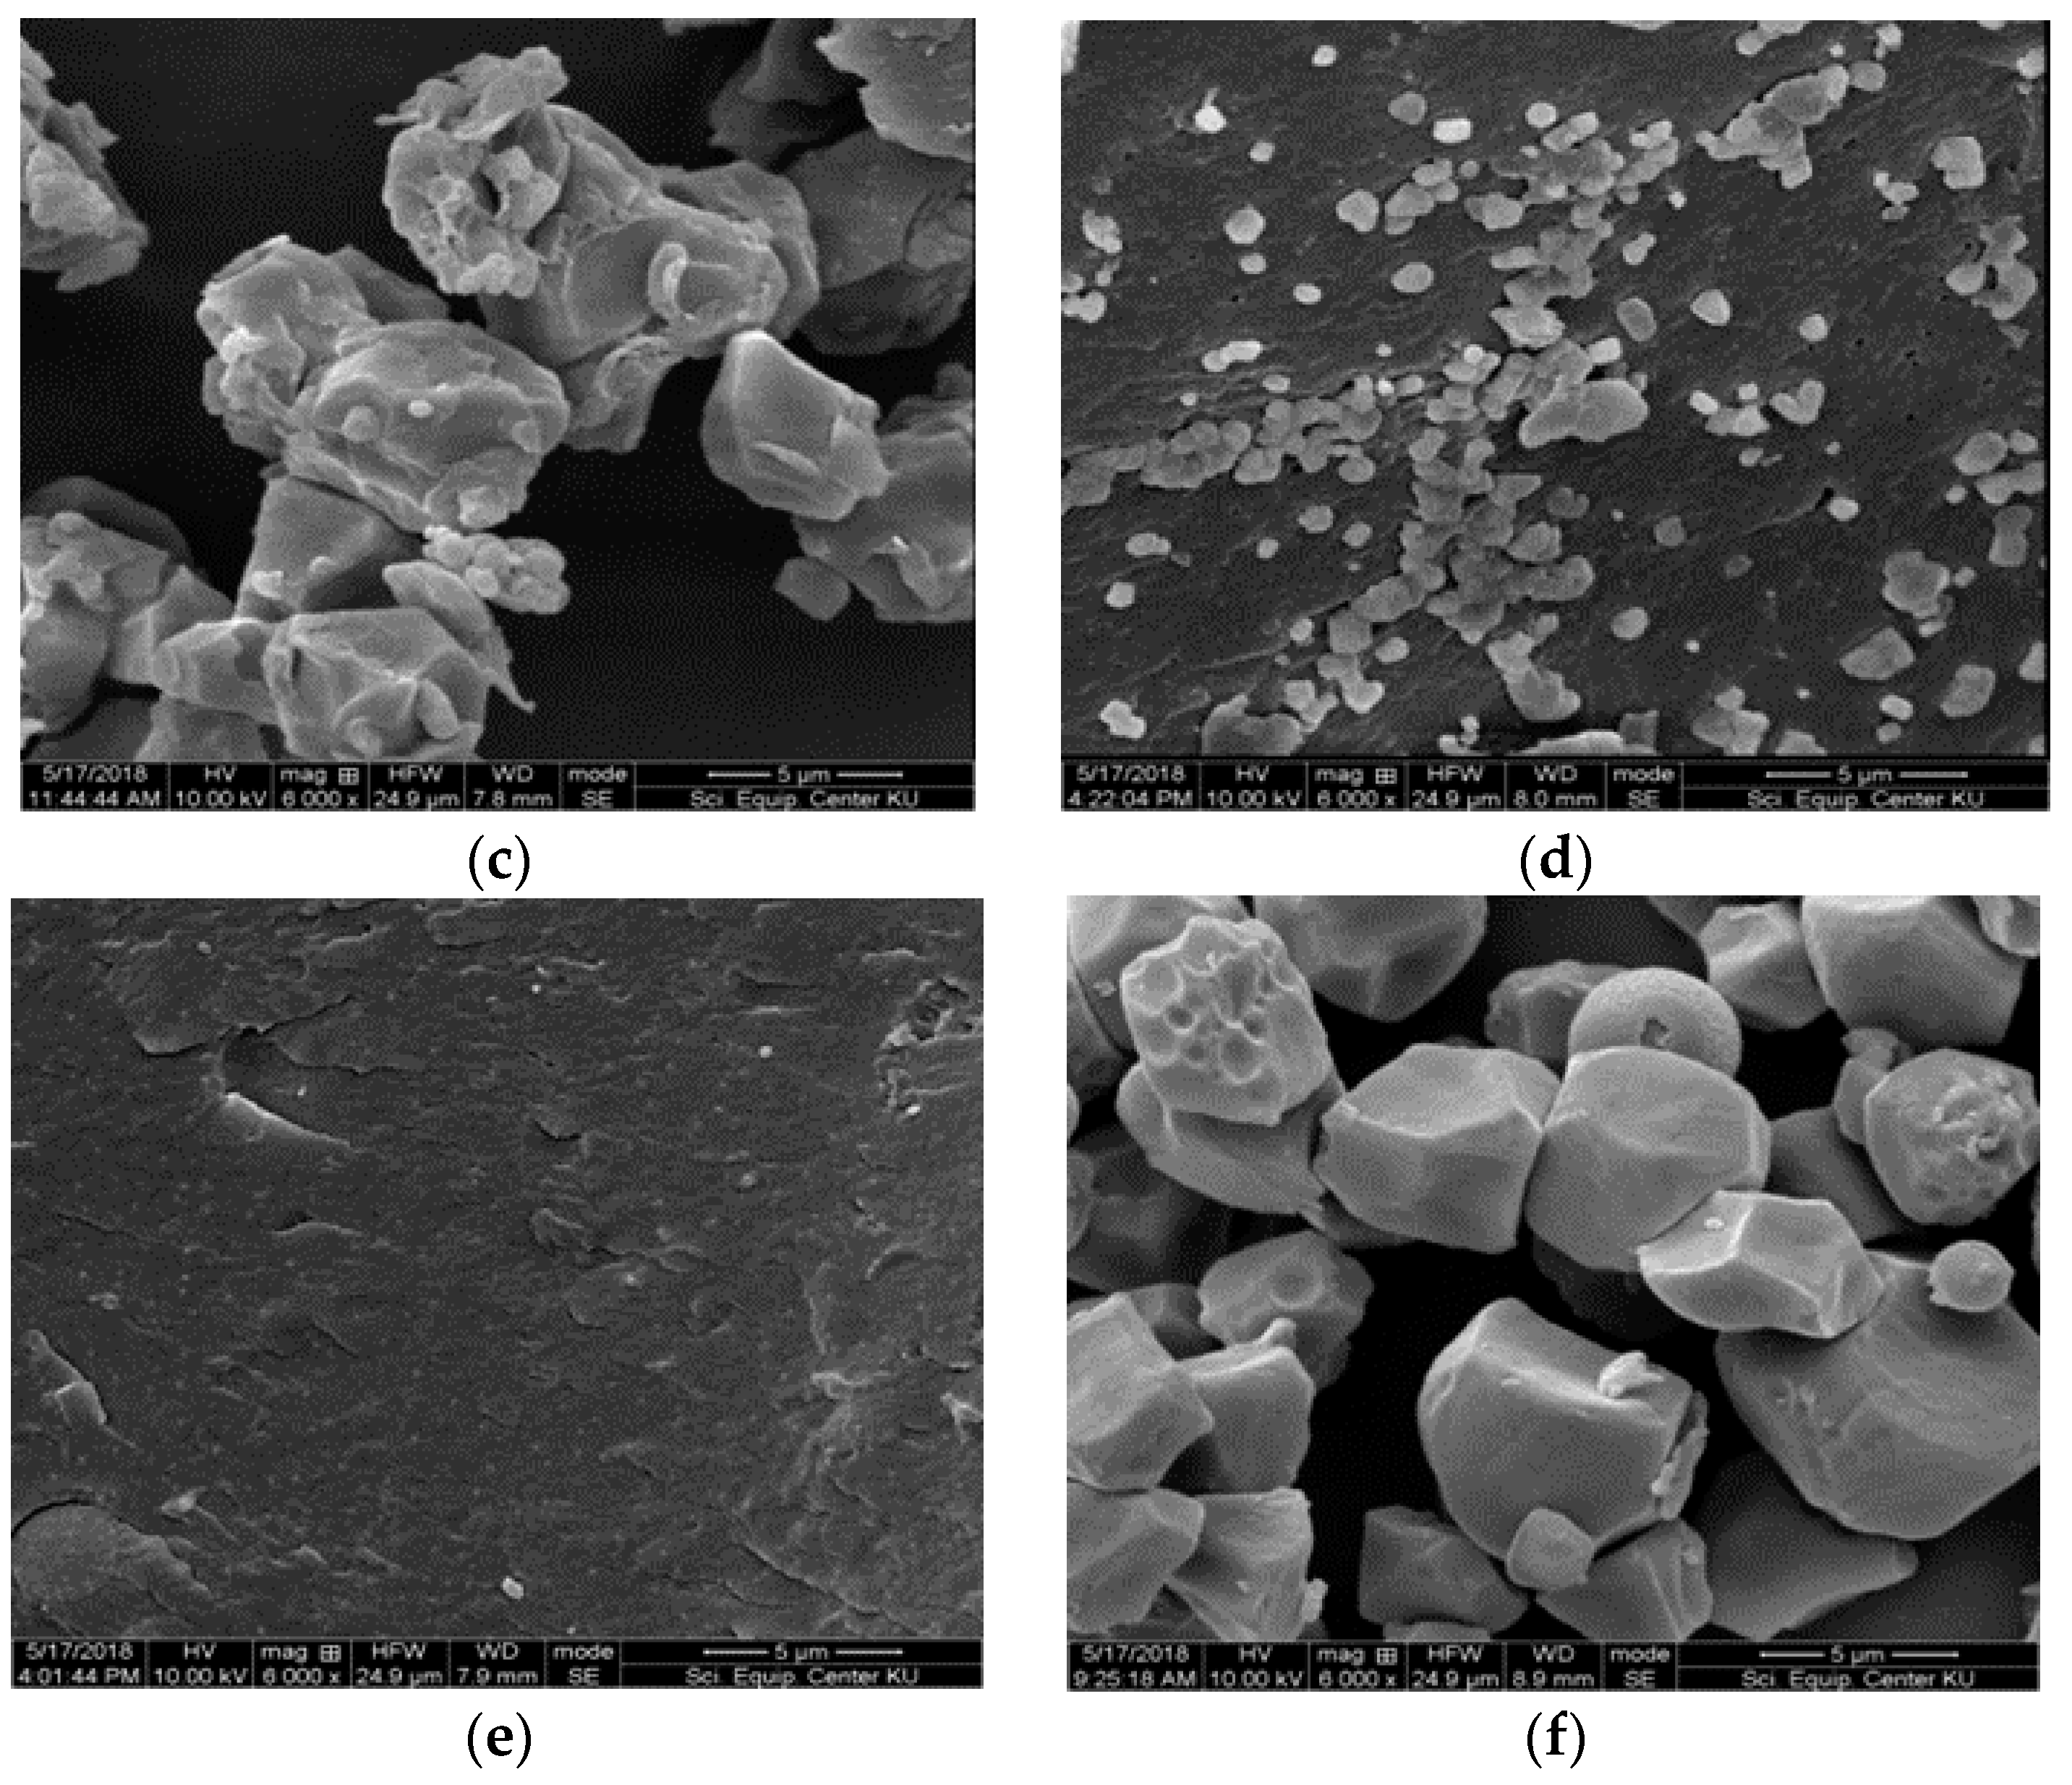
3.6. Morphology of Starch Granules
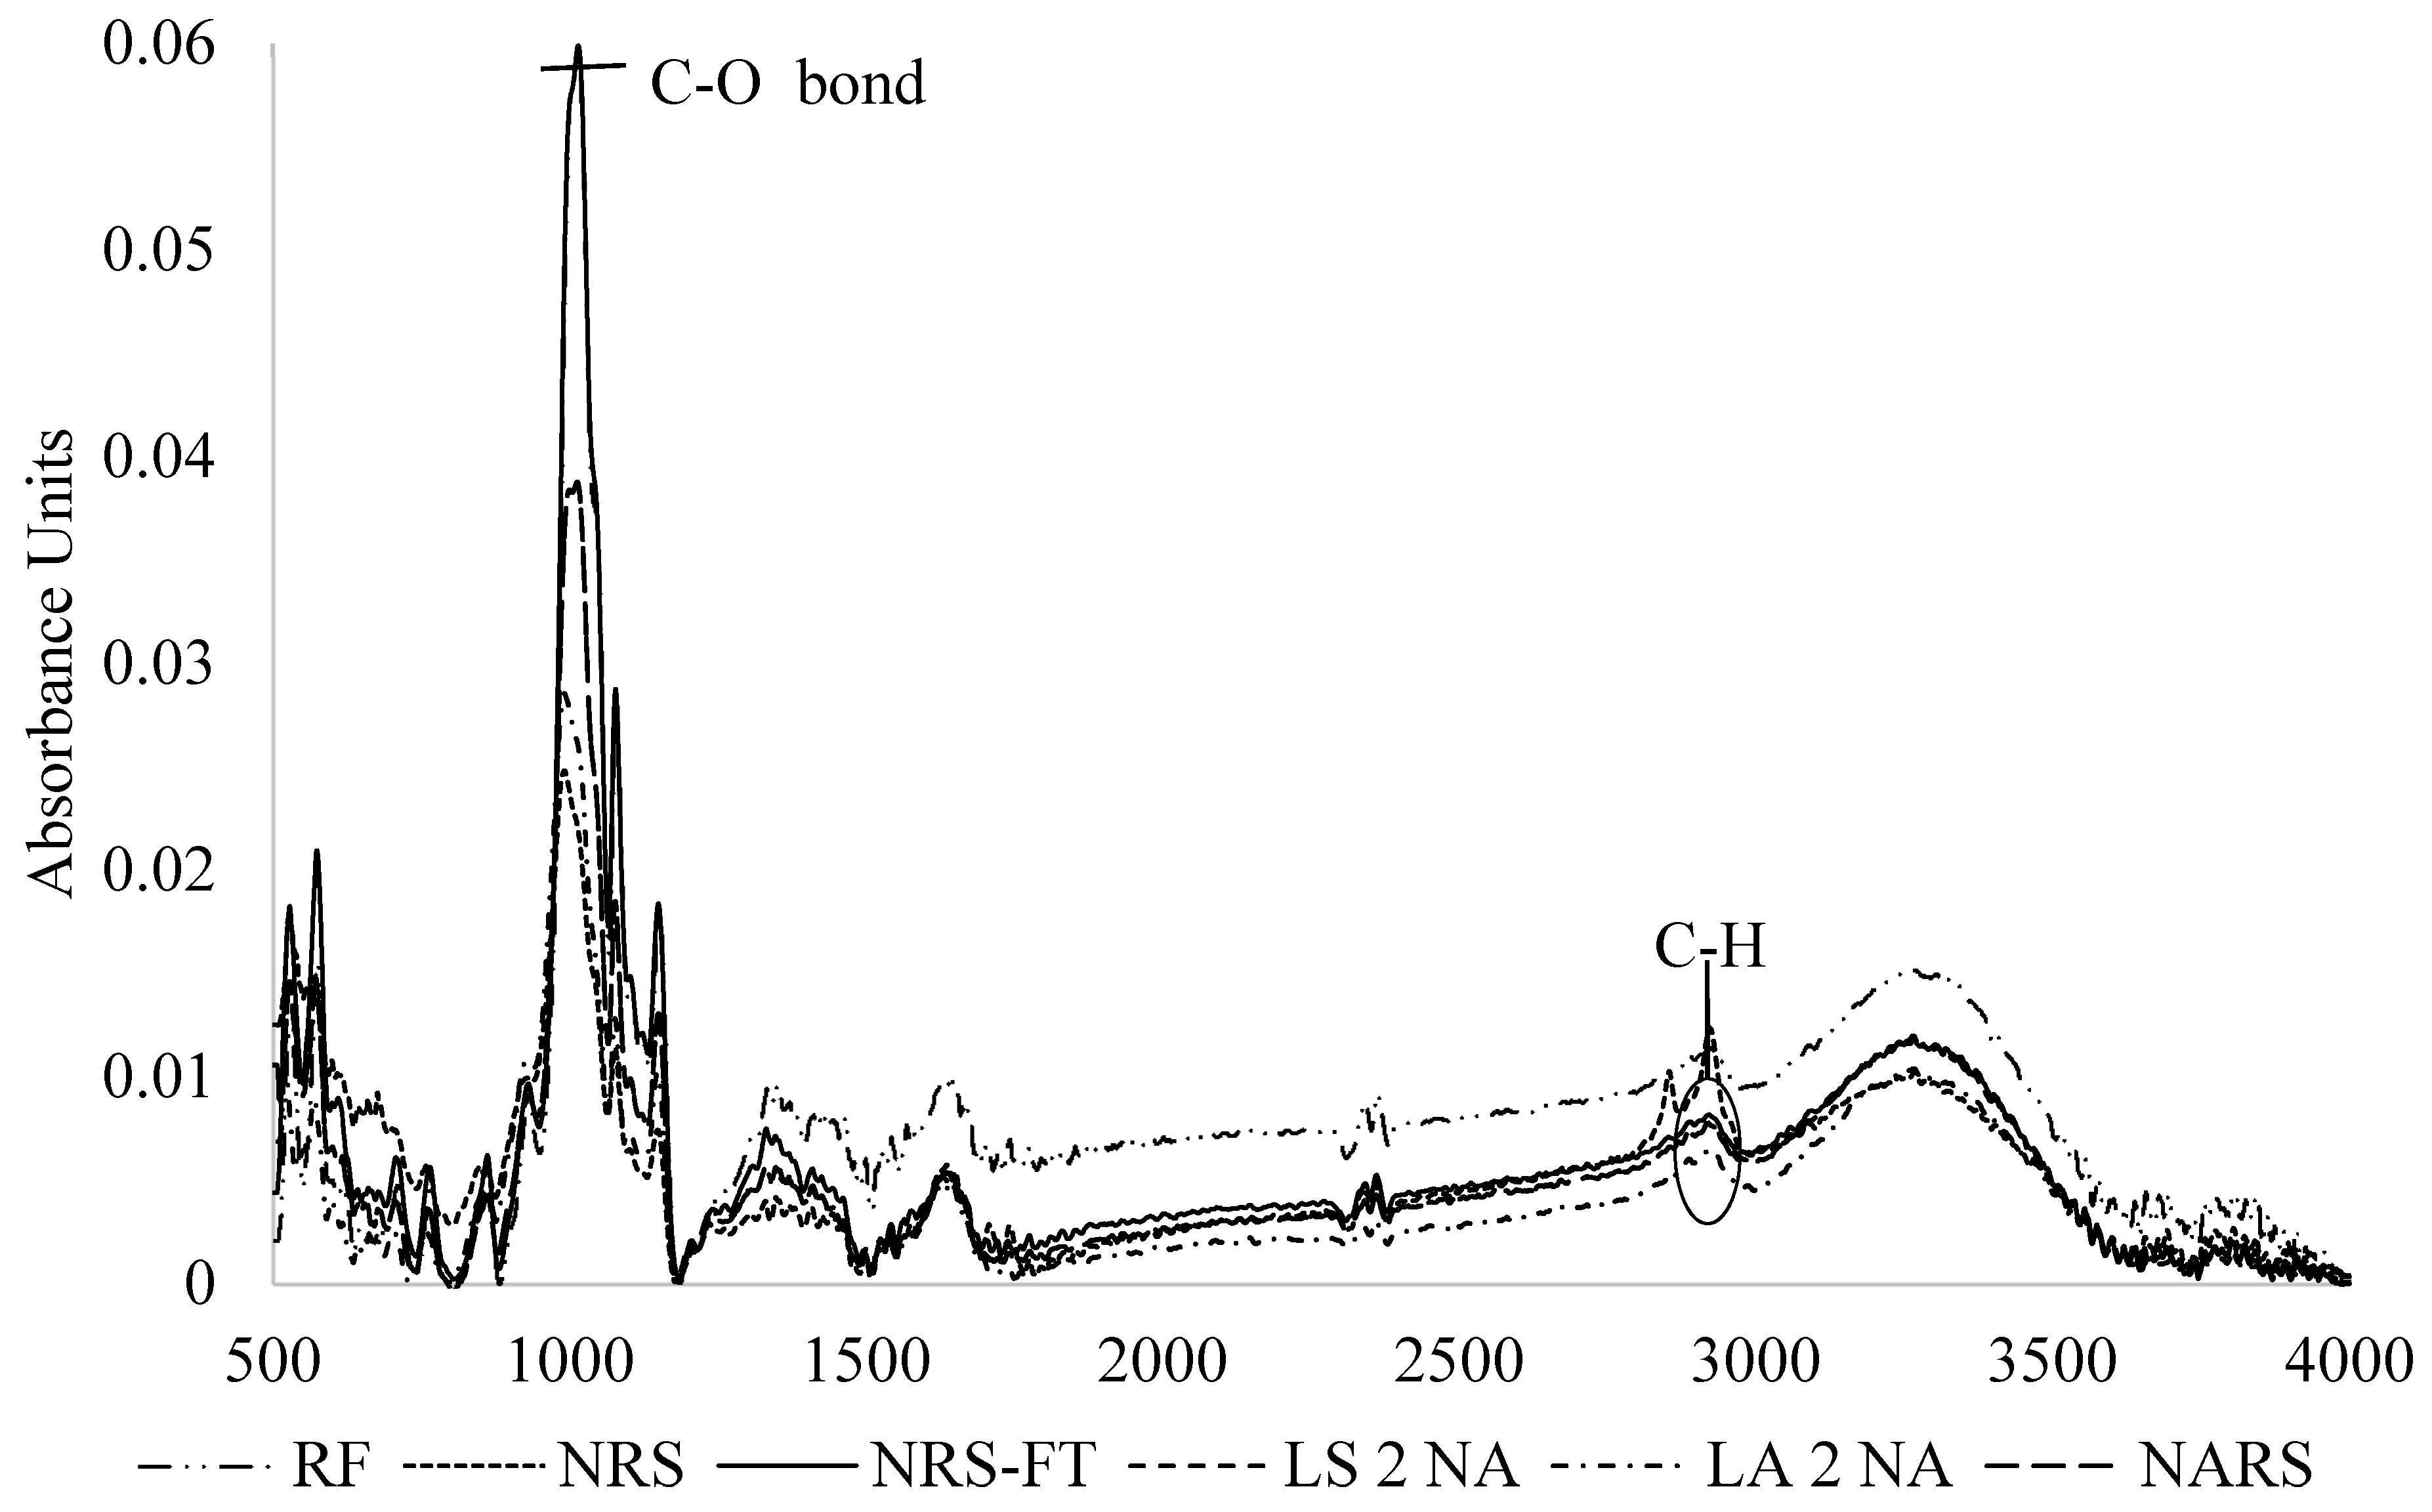
3.7. FTIR Analysis
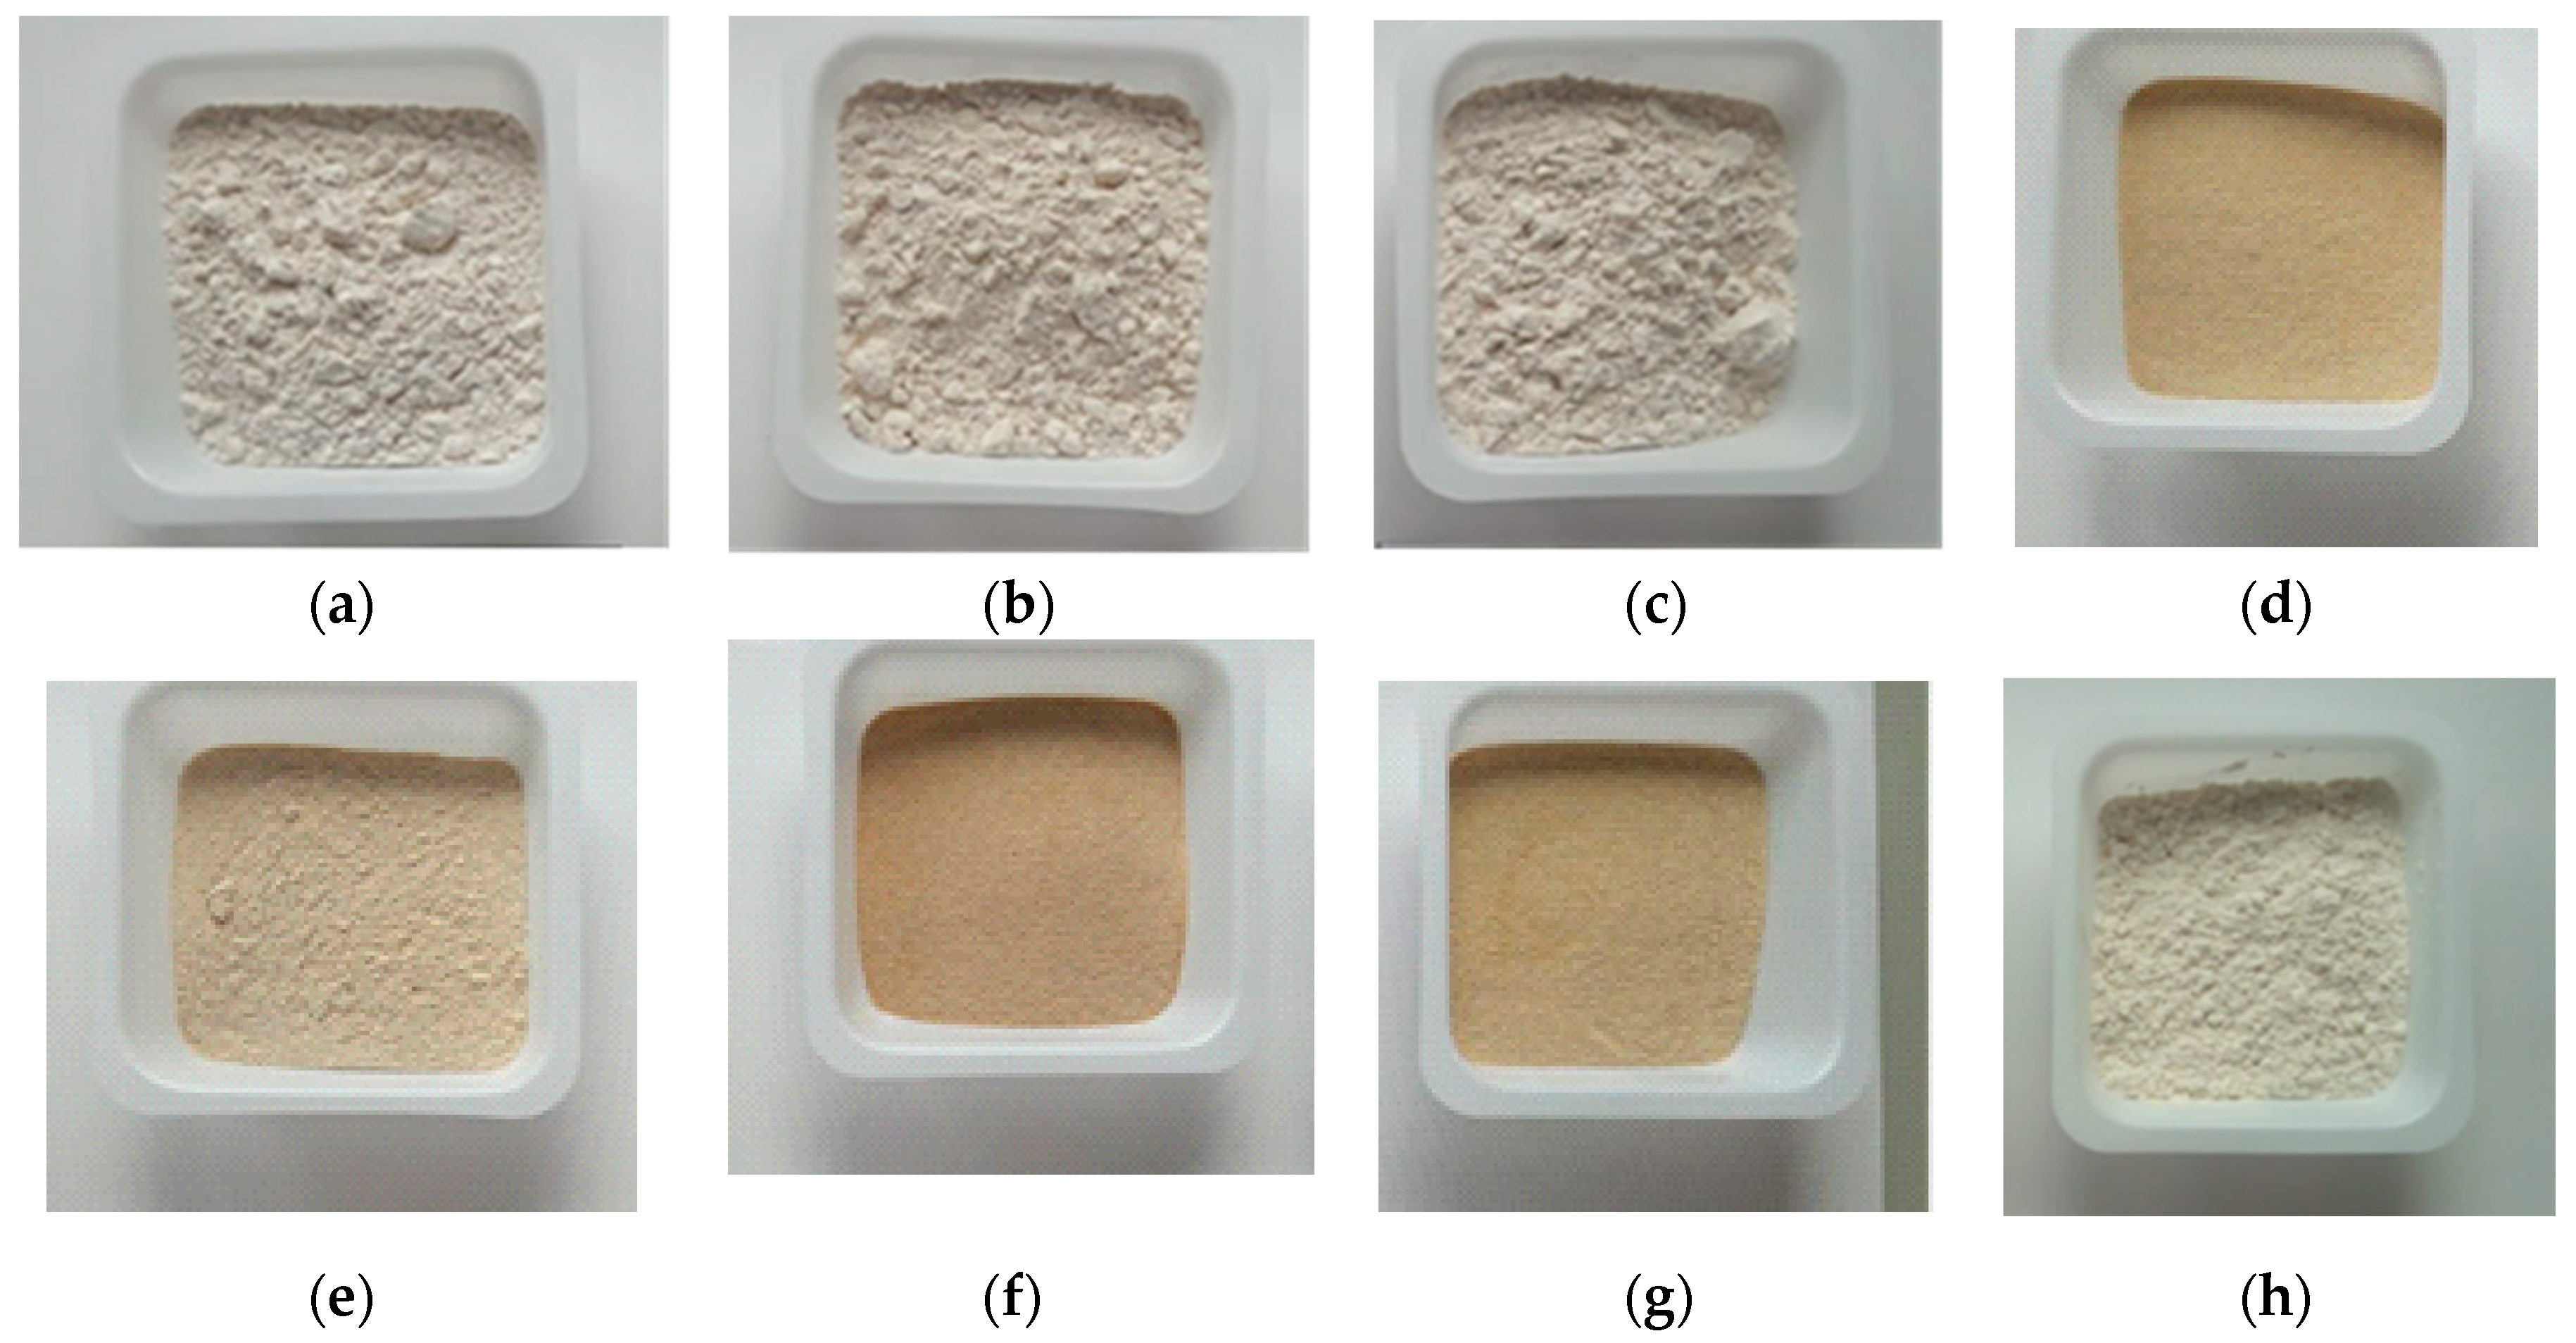
3.8. Color Value
4. Conclusions
Author Contributions
Funding
Conflicts of Interest
References
- Hatekar, M.S.; GHodKE, S.K. Glycemic index an overview. Metabolism 2009, 2, 30–32. [Google Scholar]
- Rizkalla, S.W.; Bellisle, F.; Slama, G. Health benefits of low glycaemic index foods, such as pulses, in diabetic patients and healthy individuals. Br. J. Nutr. 2002, 88, 255–262. [Google Scholar] [CrossRef] [PubMed]
- Birt, D.F.; Boylston, T.; Hendrich, S.; Jane, J.L.; Hollis, J.; Li, L.; McClelland, J.; Moore, S.; Phillips, G.J.; Rowling, M.; et al. Resistant starch: Promise for improving human health. Adv. Nutr. 2013, 4, 587–601. [Google Scholar] [CrossRef] [PubMed]
- Ratnaningsih, N.; Harmayani, E.; Marsono, Y. Physicochemical properties, in vitro starch digestibility, and estimated glycemic index of resistant starch from cowpea (Vigna unguiculata) starch by autoclaving-cooling cycles. Int. J. Biol. Macromol. 2019, 1–40. [Google Scholar] [CrossRef] [PubMed]
- Dundar, A.N.; Gocmen, D. Effects of autoclaving temperature and storing time on resistant starch formation and its functional and physicochemical properties. Carbohydr. Polym. 2013, 97, 764–771. [Google Scholar] [CrossRef] [PubMed]
- Nasrin, T.A.A.; Anal, A.K. Resistant starch III from culled banana and its functional properties in fish oil emulsion. Food Hydrocoll. 2014, 35, 403–409. [Google Scholar] [CrossRef]
- Pratiwi, W.S.W.; Anal, A.K.; Putra, S.R. Production by Lintnerization-Autoclaving and Physicochemical Characterization of Resistant Starch III from Sago Palm (Metroxylon sagu rottb). Indones. J. Chem. 2015, 15, 295–304. [Google Scholar] [CrossRef]
- Shrestha, S.; Sadiq, M.B.; Anal, A.K. Culled banana resistant starch-soy protein isolate conjugate based emulsion enriched with astaxanthin to enhance its stability. Int. J. Biol. Macromol. 2018, 120, 449–459. [Google Scholar] [CrossRef]
- Liu, Y.; Gao, J.; Wu, H.; Gou, M.; Jing, L.; Zhao, K.; Zhang, B.; Zhang, G.; Li, W. Molecular, crystal and physicochemical properties of granular waxy corn starch after repeated freeze-thaw cycles at different freezing temperatures. Int. J. Biol. Macromol. 2019, 133, 346–353. [Google Scholar] [CrossRef]
- Kumar, A.; Sahoo, U.; Baisakha, B.; Okpani, O.A.; Ngangkham, U.; Parameswaran, C.; Basak, N.; Kumar, G.; Sharma, S.G. Resistant starch could be decisive in determining the glycemic index of rice cultivars. J. Cereal Sci. 2018, 79, 348–353. [Google Scholar] [CrossRef]
- Lin, D.; Xiao, M.; Zhao, J.; Li, Z.; Xing, B.; Li, X.; Kong, M.; Li, L.; Zhang, Q.; Liu, Y.; et al. An overview of Plant phenolic compounds and their importance in human nutrition and management of type 2 diabetes. Molecules 2016, 21, 1374. [Google Scholar] [CrossRef] [PubMed]
- Qin, Y.; Liu, C.; Jiang, S.; Xiong, L.; Sun, Q. Characterization of starch Nanoparticles prepared by nanoprecipitation: Influence of amylose content and starch type. Ind. Crops Prod. 2016, 87, 182–190. [Google Scholar] [CrossRef]
- Wang, L.; Xie, B.; Xiong, G.; Wu, W.; Wang, J.; Qiao, Y.; Liao, L. The effect of freeze–thaw cycles on microstructure and physicochemical properties of four starch gels. Food Hydrocoll. 2013, 31, 61–67. [Google Scholar] [CrossRef]
- Juliano, B.O. A simplified assay for milled rice amylose. Cereal Sci. Today 1971, 16, 334–360. [Google Scholar]
- Goñi, I.; Garcia-Alonso, A.; Saura-Calixto, F. A starch hydrolysis procedure to estimate glycemic index. Nutr. Res. 1997, 17, 427–437. [Google Scholar] [CrossRef]
- Sadiq, M.B.; Hanpithakpong, W.; Tarning, J.; Anal, A.K. Screening of phytochemicals and in vitro evaluation of antibacterial and antioxidant activities of leaves, pods and bark extracts of Acacia nilotica (L.) Del. Ind. Crops Prod. 2015, 77, 873–882. [Google Scholar] [CrossRef]
- Sadiq, M.B.; Tharaphan, P.; Chotivanich, K.; Tarning, J.; Anal, A.K. In vitro antioxidant and antimalarial activities of leaves, pods and bark extracts of Acacia nilotica (L.) Del. BMC Complement. Altern. Med. 2017, 17, 1–8. [Google Scholar] [CrossRef]
- Folin, O.; Ciocalteu, V. On tyrosine and tryptophane determinations in proteins. J. Biol. Chem. 1927, 73, 627–650. [Google Scholar]
- Rodríguez-Ambriz, S.L.; Islas-Hernández, J.J.; Agama-Acevedo, E.; Tovar, J.; Bello-Pérez, L.A. Characterization of a fibre-rich powder prepared by liquefaction of unripe banana flour. Food Chem. 2008, 107, 1515–1521. [Google Scholar] [CrossRef]
- Gavahian, M.; Chu, Y.H.; Farahnaky, A. Effects of ohmic and microwave cooking on textural softening and physical properties of rice. J. Food Eng. 2019, 243, 114–124. [Google Scholar] [CrossRef]
- Juliano, B.O.; Tuaño, A.P.P. Gross structure and composition of the rice grain. In Rice; AACC International Press: St. Paul, MN, USA, 2019; pp. 31–53. [Google Scholar]
- Qin, Y.; Zhang, H.; Dai, Y.; Hou, H.; Dong, H. Effect of Alkali Treatment on Structure and Properties of High Amylose Corn Starch Film. Materials 2019, 12, 1705. [Google Scholar] [CrossRef] [PubMed]
- Chatterjee, L.; Das, P. Study on amylose content of ten rice varieties recommended for Assam. In. J. Pureand Appl. Biosci. 2018, 6, 1230–1233. [Google Scholar] [CrossRef]
- Sandhu, K.S.; Singh, N.; Lim, S.T. A comparison of native and acid thinned normal and waxy corn starches: Physicochemical, thermal, morphological and pasting properties. LWT-Food Sci. Technol. 2007, 40, 1527–1536. [Google Scholar] [CrossRef]
- Atichokudomchai, N.; Shobsngob, S.; Varavinit, S. Morphological properties of acid-modified tapioca starch. Starch-Stärke 2000, 52, 283–289. [Google Scholar] [CrossRef]
- Dupuis, J.H.; Liu, Q.; Yada, R.Y. Methodologies for increasing the resistant starch content of food starches: A review. Compr. Rev. Food Sci. Food Safety 2014, 13, 1219–1234. [Google Scholar] [CrossRef]
- Srikaeo, K.; Arranz-Martínez, P. Formulating low glycaemic index rice flour to be used as a functional ingredient. J. Cereal Sci. 2015, 61, 33–40. [Google Scholar] [CrossRef]
- Khoozani, A.A.; Birch, J.; Bekhit, A.E. Production, application and health effects of banana pulp and peel flour in the food industry. J. Food Sci. Technol. 2019, 56, 548–559. [Google Scholar] [CrossRef] [PubMed]
- Vatanasuchart, N.; Niyomwit, B.; Wongkrajang, K. Resistant starch contents and the in vitro starch digestibility of Thai starchy foods. Kaset. J. Nat. Sci. 2009, 43, 178–186. [Google Scholar]
- Roman, L.; Martinez, M.M. Structural Basis of Resistant Starch (RS) in Bread: Natural and Commercial Alternatives. Foods 2019, 8, 267. [Google Scholar] [CrossRef] [PubMed]
- Nissar, J.; Ahad, T.; Naik, H.; Hussain, S. Resistant starch: Chemistry and nutritional properties. Int. J. Food Sci. Nutr. 2017, 2, 95–108. [Google Scholar]
- Kannan, A.; Hettiarachchy, N.; Narayan, S. Colon and breast anti-cancer effects of peptide hydrolysates derived from rice bran. Open Bioactive Compd. J. 2009, 2, 17–20. [Google Scholar] [CrossRef]
- Smrčková, P.; Saglamtas, M.; Hofmanová, T.; Koláček, J.; Chena, D.; Šárka, E. Effect of process parameters on slowly digestible and resistant starch content in extrudates. Czech. J. Food Sci. 2014, 32, 503–508. [Google Scholar] [CrossRef]
- Denardin, C.C.; Boufleur, N.; Reckziegel, P.; Silva, L.P.D.; Walter, M. Amylose content in rice (Oryza sativa) affects performance, glycemic and lipidic metabolism in rats. Ciência Rural 2012, 42, 381–387. [Google Scholar] [CrossRef]
- Zhang, F.; Hu, L.; Xu, G.; Chen, Q. Changes of some chemical substances and antioxidant capacity of mandarin orange segments during can processing. Procedia Environ. Sci. 2011, 11, 1260–1266. [Google Scholar]
- Horvathova, J.; Suhaj, M.; Šimko, P. Effect of thermal treatment and storage on antioxidant activity of some spices. J. Food Nutr. Res. 2007, 46, 20–27. [Google Scholar]
- Bet, C.D.; Cordoba, L.P.; Ribeiro, L.S.; Schnitzler, E. Effect of acid modification on the thermal, morphological and pasting properties of starch from mango kernel (Mangifera indica L.) of Palmer variety. Int. Food Res. J. 2017, 24, 1967–1974. [Google Scholar]
- Moin, A.; Ali, T.M.; Hasnain, A. Influence of different molar concentrations of acid on morphological, physicochemical and pasting properties of Pakistani Basmati and Irri rice starches. Int. J. Macromol. 2017, 101, 214–221. [Google Scholar] [CrossRef] [PubMed]
- Kaur, R.; Gill, B.S.; Sogi, D.S. Studies on the effect of aqueous hydrochloric acid on properties of wheat starch. J. Food Sci. Technol. 2007, 44, 386–390. [Google Scholar]
- Babu, A.S.; Parimalavalli, R. Effect of Autoclaving on functional, chemical, pasting and morphological properties of root crop starch. J. Root Crops 2014, 39, 78–83. [Google Scholar]
- Lawal, M.V. Modified Starches as Direct Compression Excipients–Effect of Physical and Chemical Modifications on Tablet Properties: A Review. Starch-Stärke 2019, 71. [Google Scholar] [CrossRef]
- Aparicio-Saguilán, A.; Flores-Huicochea, E.; Tovar, J.; García-Suárez, F.; Gutiérrez-Meraz, F.; Bello-Pérez, L.A. Resistant starch-rich powders prepared by autoclaving of native and lintnerized banana starch: Partial characterization. Starch-Stärke 2005, 57, 405–412. [Google Scholar] [CrossRef]
- Köksel, H.; Basman, A.; Kahraman, K.; Ozturk, S. Effect of acid modification and heat treatments on resistant starch formation and functional properties of corn starch. Int. J. Food Prop. 2007, 10, 691–702. [Google Scholar] [CrossRef]
- Ozturk, S.; Koksel, H.; Kahraman, K.; Ng, P.K. Effect of debranching and heat treatments on formation and functional properties of resistant starch from high-amylose corn starches. Eur. Food Res. Technol. 2009, 229, 115–125. [Google Scholar] [CrossRef]
- Winarti, C.; Sunarti, T.C.; Mangunwidjaja, D.; Richana, N. Preparation of arrowroot starch nanoparticles by butanol-complex precipitation, and its application as bioactive encapsulation matrix. Int. Food Res. J. 2014, 21, 2207–2213. [Google Scholar]
- Ogunmolasuyi, A.M.; Egwim, E.C.; Adewoyin, M.A.; Nkop, J.E. Effect of phosphoric acid treatment on physicochemical, functional, and structural properties of starch extracted from yam (Dioscorea rotundata). Int. J. Food Prop. 2017, 20, 1062–1073. [Google Scholar] [CrossRef]
- Babu, A.S.; Parimalavalli, R.; Jagannadham, K.; Rao, J.S. Chemical and structural properties of sweet potato starch treated with organic and inorganic acid. J. Food Sci. Technol. 2015, 52, 5745–5753. [Google Scholar] [CrossRef] [PubMed]
- Kim, J.Y.; Lee, Y.K.; Chang, Y.H. Structure and digestibility properties of resistant rice starch cross-linked with citric acid. Int. J. Food Prop. 2017, 20, 2166–2177. [Google Scholar] [CrossRef]
- Wang, L.; Yin, Z.; Wu, J.; Sun, Z.; Xie, B. A study on freeze–thaw characteristics and microstructure of Chinese water chestnut starch gels. J. Food Eng. 2008, 88, 186–192. [Google Scholar] [CrossRef]
- Yu, H.; Cao, Y.; Fang, Q.; Liu, Z. Effects of treatment temperature on properties of starch-based adhesives. BioResources 2015, 10, 3520–3530. [Google Scholar] [CrossRef]
- Nasrin, T.A.A.; Noomhorm, A.; Anal, A.K. Physico-chemical characterization of culled plantain pulp starch, peel starch and flour. Int. J. Food Prop. 2015, 18, 165–177. [Google Scholar] [CrossRef]
- Ashwar, B.A.; Gani, A.; Wani, I.A.; Shah, A.; Masoodi, F.A.; Saxena, D.C. Production of resistant starch from rice by dual autoclaving-retrogradation treatment: Invitro digestibility, thermal and structural characterization. Food Hydrocoll. 2016, 56, 108–117. [Google Scholar] [CrossRef]
- Basilio-Cortés, U.A.; González-Cruz, L.; Velazquez, G.; Teniente-Martínez, G.; Gómez-Aldapa, C.A.; Castro-Rosas, J.; Bernardino-Nicanor, A. Effect of dual modification on the spectroscopic, calorimetric, viscosimetric and morphological characteristics of corn starch. Polymers 2019, 11, 333. [Google Scholar] [CrossRef] [PubMed]
- Balasubramanian, S.; Sharma, R.; Kaur, J.; Bhardwaj, N. Characterization of modified pearl millet (Pennisetum typhoides) starch. J. Food Sci. Technol. 2014, 51, 294–300. [Google Scholar] [CrossRef] [PubMed]


| Type of Starch | Amylose Content (%) | Resistant Starch (%) | Non-Resistant Starch (%) | Total Starch (%) |
|---|---|---|---|---|
| RF | 33.92 ± 0.15 e | 3.84 ± 1.01 j | 74.96 ± 2.67 bc | 86.81 ± 0.70 cd |
| NRS | 45.17 ± 1.54 ab | 8.44 ± 0.51 i | 87.62 ± 0.20 a | 96.05 ± 0.72 bcd |
| LS 1 NA | 41.48 ± 0.48 c | 13.73 ± 0.48 h | 83.92 ± 2.67 a | 97.65 ± 0.31 ab |
| LS 1.5 NA | 35.57 ± 0.73 de | 22.99 ± 0.48 f | 70.66 ± 2.23 c | 93.65 ± 0.13 d |
| LS 2 NA | 36.48 ± 0.55 d | 40.19 ± 2.96 d | 56.94 ± 1.58 d | 97.12 ± 1.38 abc |
| NARS | 45.97 ± 0.79 a | 64.95 ± 0.26 a | 32.31 ± 0.98 g | 97.26 ± 0.62 abc |
| LA 1 NA | 28.96 ± 0.26 f | 35.70 ± 0.56 e | 58.82 ± 0.75 d | 94.51 ± 0.24 cd |
| LA 1.5 NA | 25.31 ±0.59 g | 49.08 ± 0.04 c | 50.52 ± 0.24 e | 99.60 ± 0.27 a |
| LA 2 NA | 21.70 ± 0.66 h | 54.95 ± 0.60 b | 44.65 ± 0.28 f | 99.60 ± 0.34 a |
| NRS - FT | 43.59 ± 0.34 b | 18.00 ± 0.30 g | 77.49 ± 1.48 b | 95.49 ± 0.17 bcd |
| Type of Starch | HI | GI |
|---|---|---|
| RF | 38.98 ± 0.04 b | 61.10 ± 0.02 b |
| NRS | 48.48 ± 0.06 a | 66.32 ± 0.04 a |
| LS 1 NA | 35.03 ± 0.13 d | 58.94 ± 0.07 d |
| LS 1.5 NA | 27.60 ± 0.22 f | 54.86 ± 0.11 f |
| LS 2 NA | 22.29 ± 0.01 g | 51.94 ± 0.01 g |
| NARS | 11.68 ± 0.04 i | 46.12 ± 0.01 i |
| LA 1 NA | 30.91 ± 0.49 e | 56.83 ± 0.07 e |
| LA 1.5 NA | 12.50 ± 0.40 h | 46.57 ± 0.22 h |
| LA 2 NA | 12.21 ± 0.17 h | 46.41 ± 0.09 hi |
| NRS - FT | 37.36 ± 0.27 c | 60.22±0.14 c |
| Type of Starch | TPC (mg GAE/100 g Sample) | DPPH (mg Trolox/100 g Sample) | FRAP (FeSO4/100 g Sample) |
|---|---|---|---|
| RF | 100.03 ± 1.92 a | 38.75 ± 0.04 a | 192.17 ± 0.54 a |
| NRS | 95.63 ± 1.40 b | 29.95 ± 0.41 b | 88.66 ± 0.97 b |
| LS 1 NA | 51.00 ± 0.96 d | 27.35 ± 0.23 c | 53.85 ± 3.19 cd |
| LS 1.5 NA | 45.41 ± 2.09 e | 27.37 ± 0.05 c | 51.50 ± 0.53 d |
| LS 2 NA | 43.84 ± 0.90 e | 26.43 ± 0.45 d | 21.62 ± 1.39 ef |
| NARS | 56.44 ± 0.92 c | 24.31 ± 0.16 e | 56.25 ± 1.39 c |
| LA 1 NA | 36.19 ± 0.42 f | 24.59 ± 0.26 e | 22.51 ± 0.80 e |
| LA 1.5 NA | 36.52 ± 0.69 f | 24.28 ± 0.22 e | 19.34 ± 2.12 fg |
| LA 2 NA | 35.07 ± 1.00 f | 23.48 ± 0.38 f | 16.54 ± 0.35 g |
| NRS - FT | 60.02±1.17 c | 27.77 ± 0.06 c | 56.26 ± 0.39 c |
| Type of Starch | Viscosity | |||||
|---|---|---|---|---|---|---|
| Peak 1 | Trough 1 | Breakdown | Final Viscosity | Setback | Peak Time | |
| RF | 142.00 ± 0.00 a | 96.50 ± 0.71 a | 45.00 ± 0.00 b | 308.50 ± 2.92 a | 212.00 ± 2.82 a | 5.60 ± 0.00 b |
| NRS | 133.50 ± 2.12 b | 72.00 ± 0.00 c | 67.50 ± 6.50 a | 217.00 ± 0.00 b | 145.50 ± 0.71 b | 4.90 ± 0.04 cd |
| LS 1 NA | 25.79 ± 0.06 d | 11.92 ± 0.47 d | 13.88 ± 0.42 c | 16.21 ± 0.41 d | 4.29 ± 0.06 d | 5.37 ± 0.05 bc |
| LS 1.5 NA | 3.75 ± 0.00 f | 1.21 ± 0.06 f | 2.54 ± 0.06 cd | 4.58 ± 0.00 f | 3.38 ± 0.06 de | 4.73 ± 0.00 d |
| LS 2 NA | 2.54 ± 0.04 fg | 1.38 ± 0.06 f | 1.17 ± 0.12 d | 4.38 ± 0.06 f | 3.00 ± 0.00 de | 4.90 ± 0.04 cd |
| NARS | 8.00 ± 0.11 e | 8.05 ± 0.18 e | 0.04 ± 0.06 d | 11.34 ± 0.12 e | 3.29 ± 0.06 de | 6.77 ± 0.05 a |
| LA 1 NA | 0.79 ± 0.04 g | 0.58 ± 0.00 f | 0.21 ± 0.06 d | 0.84 ± 0.12 g | 0.25 ± 0.11 e | 1.20 ± 0.10 f |
| LA 1.5 NA | 1.17 ± 0.00 fg | 1.04 ± 0.06 f | 0.13 ± 0.06 d | 1.46 ± 0.06 g | 0.42 ± 0.00 e | 1.07 ± 0.00 f |
| LA 2 NA | 1.09 ± 0.12 fg | 1.04 ± 0.06 f | 0.04 ± 0.06 d | 1.42 ± 0.12 g | 0.38 ± 0.06 e | 2.94 ± 0.27 e |
| NRS - FT | 80.71 ± 0.06 c | 74.67 ± 0.23 b | 6.05 ± 0.18 cd | 105.92 ± 0.47 c | 31.25 ± 0.71 c | 7.00 ± 0.00 a |
| Type of Starch | L* | a* | b* | Color Intensity |
|---|---|---|---|---|
| RF | 88.68 ± 0.09 d | 0.38 ± 0.03 e | 9.02 ± 0.04 d | 9.03 ± 0.04 d |
| NRS | 92.87 ± 0.17 a | −0.20 ± 0.15 f | 4.38 ± 0.31 g | 4.39 ± 0.31 g |
| LS 1 NA | 91.13 ± 0.01 bc | 1.28 ± 0.02 d | 5.75 ± 0.01 f | 5.88 ± 0.12 f |
| LS 1.5 NA | 90.61 ± 0.31 bc | 1.41 ± 0.07 d | 7.21 ± 0.21 e | 7.35 ± 0.22 e |
| LS 2 NA | 90.13 ± 0.02 cd | 1.49 ± 0.03 d | 6.55 ± 0.03 ef | 6.71 ± 0.02 ef |
| NARS | 74.01 ± 1.04 f | 4.49 ± 0.28 b | 19.51 ± 0.91 a | 20.38 ± 0.9 a |
| LA 1 NA | 80.52 ± 0.03 e | 2.63 ± 0.03 c | 15.06 ± 0.05 c | 15.29 ± 0.06 c |
| LA 1.5 NA | 72.32 ± 0.39 g | 5.15 ± 0.04 a | 17.91 ± 0.16 b | 18.64 ± 0.14 b |
| LA 2 NA | 75.33 ± 0.23 f | 4.69 ± 0.02 b | 19.68 ± 0.14 a | 20.23 ± 0.23 a |
| NRS - FT | 91.99 ± 1.40 ab | 0.07 ± 0.01 f | 6.05 ± 0.16 fg | 6.05 ± 0.16 f |
© 2019 by the authors. Licensee MDPI, Basel, Switzerland. This article is an open access article distributed under the terms and conditions of the Creative Commons Attribution (CC BY) license (http://creativecommons.org/licenses/by/4.0/).
Share and Cite
Raungrusmee, S.; Anal, A.K. Effects of Lintnerization, Autoclaving, and Freeze-Thaw Treatments on Resistant Starch Formation and Functional Properties of Pathumthani 80 Rice Starch. Foods 2019, 8, 558. https://doi.org/10.3390/foods8110558
Raungrusmee S, Anal AK. Effects of Lintnerization, Autoclaving, and Freeze-Thaw Treatments on Resistant Starch Formation and Functional Properties of Pathumthani 80 Rice Starch. Foods. 2019; 8(11):558. https://doi.org/10.3390/foods8110558
Chicago/Turabian StyleRaungrusmee, Sujitta, and Anil Kumar Anal. 2019. "Effects of Lintnerization, Autoclaving, and Freeze-Thaw Treatments on Resistant Starch Formation and Functional Properties of Pathumthani 80 Rice Starch" Foods 8, no. 11: 558. https://doi.org/10.3390/foods8110558
APA StyleRaungrusmee, S., & Anal, A. K. (2019). Effects of Lintnerization, Autoclaving, and Freeze-Thaw Treatments on Resistant Starch Formation and Functional Properties of Pathumthani 80 Rice Starch. Foods, 8(11), 558. https://doi.org/10.3390/foods8110558