Investigating Alcohol Sweetspot Phenomena in Reduced Alcohol Red Wines

 , ,
, , 
Abstract
1. Introduction
2. Materials and Methods
2.1. Wine Samples
2.2. Sensory Analysis of Wines
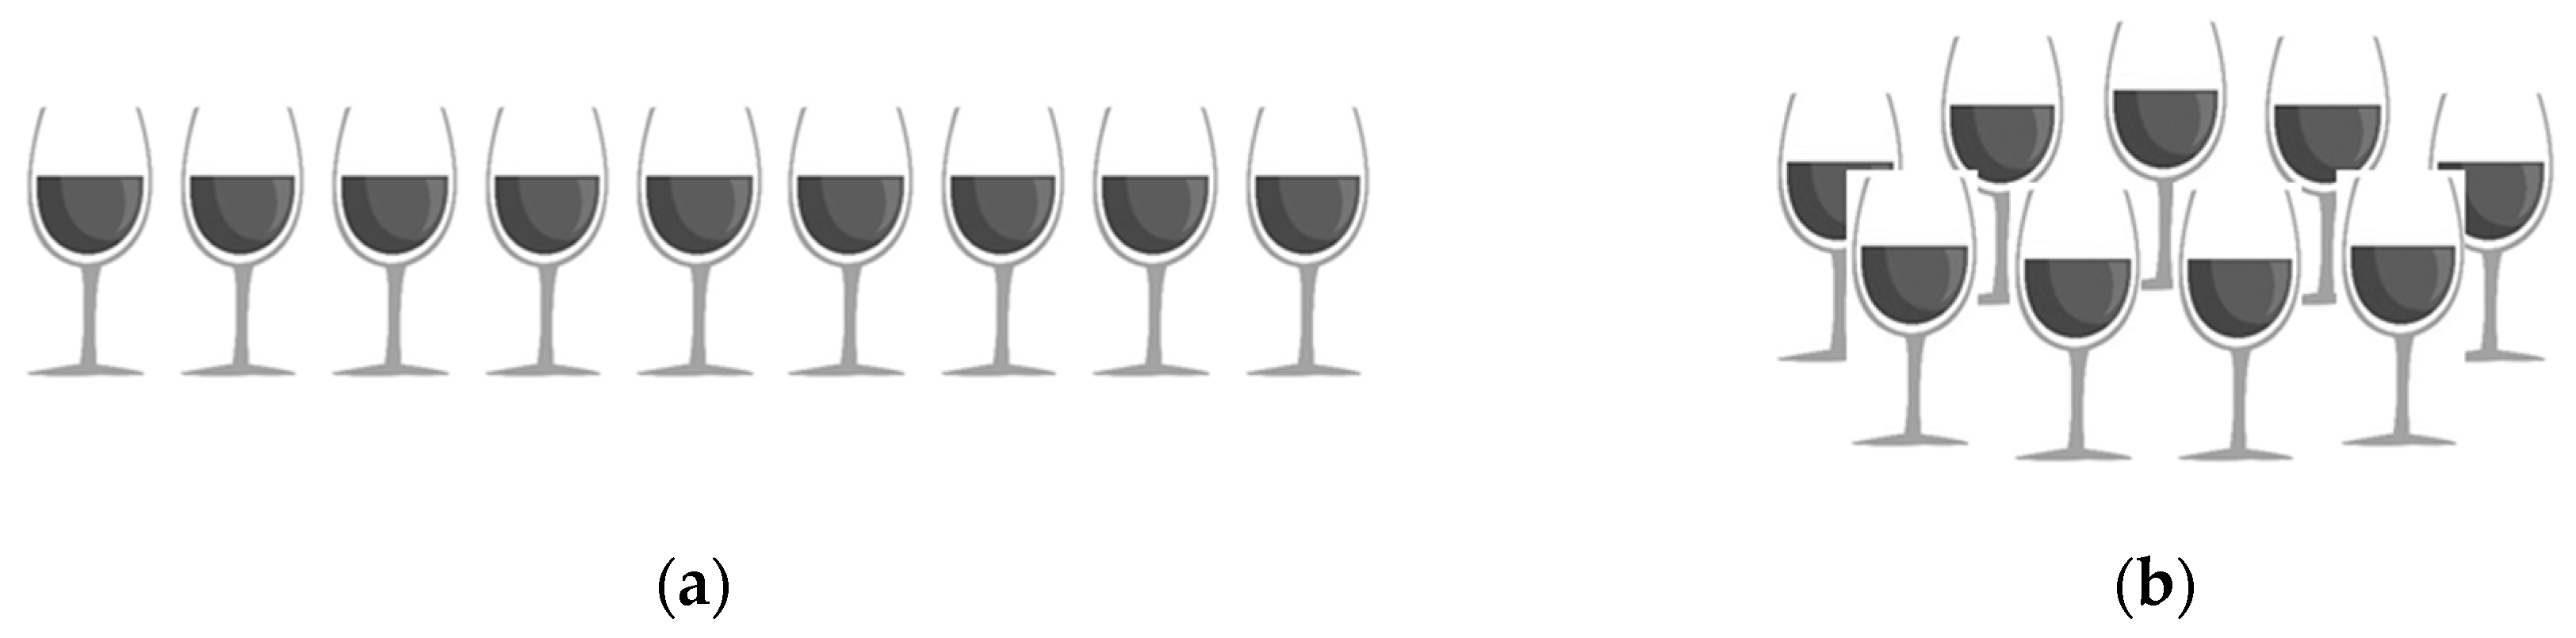
2.2.1. Alcohol Sweetspotting Trials
2.2.2. Difference Tests
2.3. Chemical Analysis of Wines
2.4. Statistical Analysis
3. Results and Discussion
3.1. Influence of Partial Dealcoholization by Ro-Ep on Wine Composition
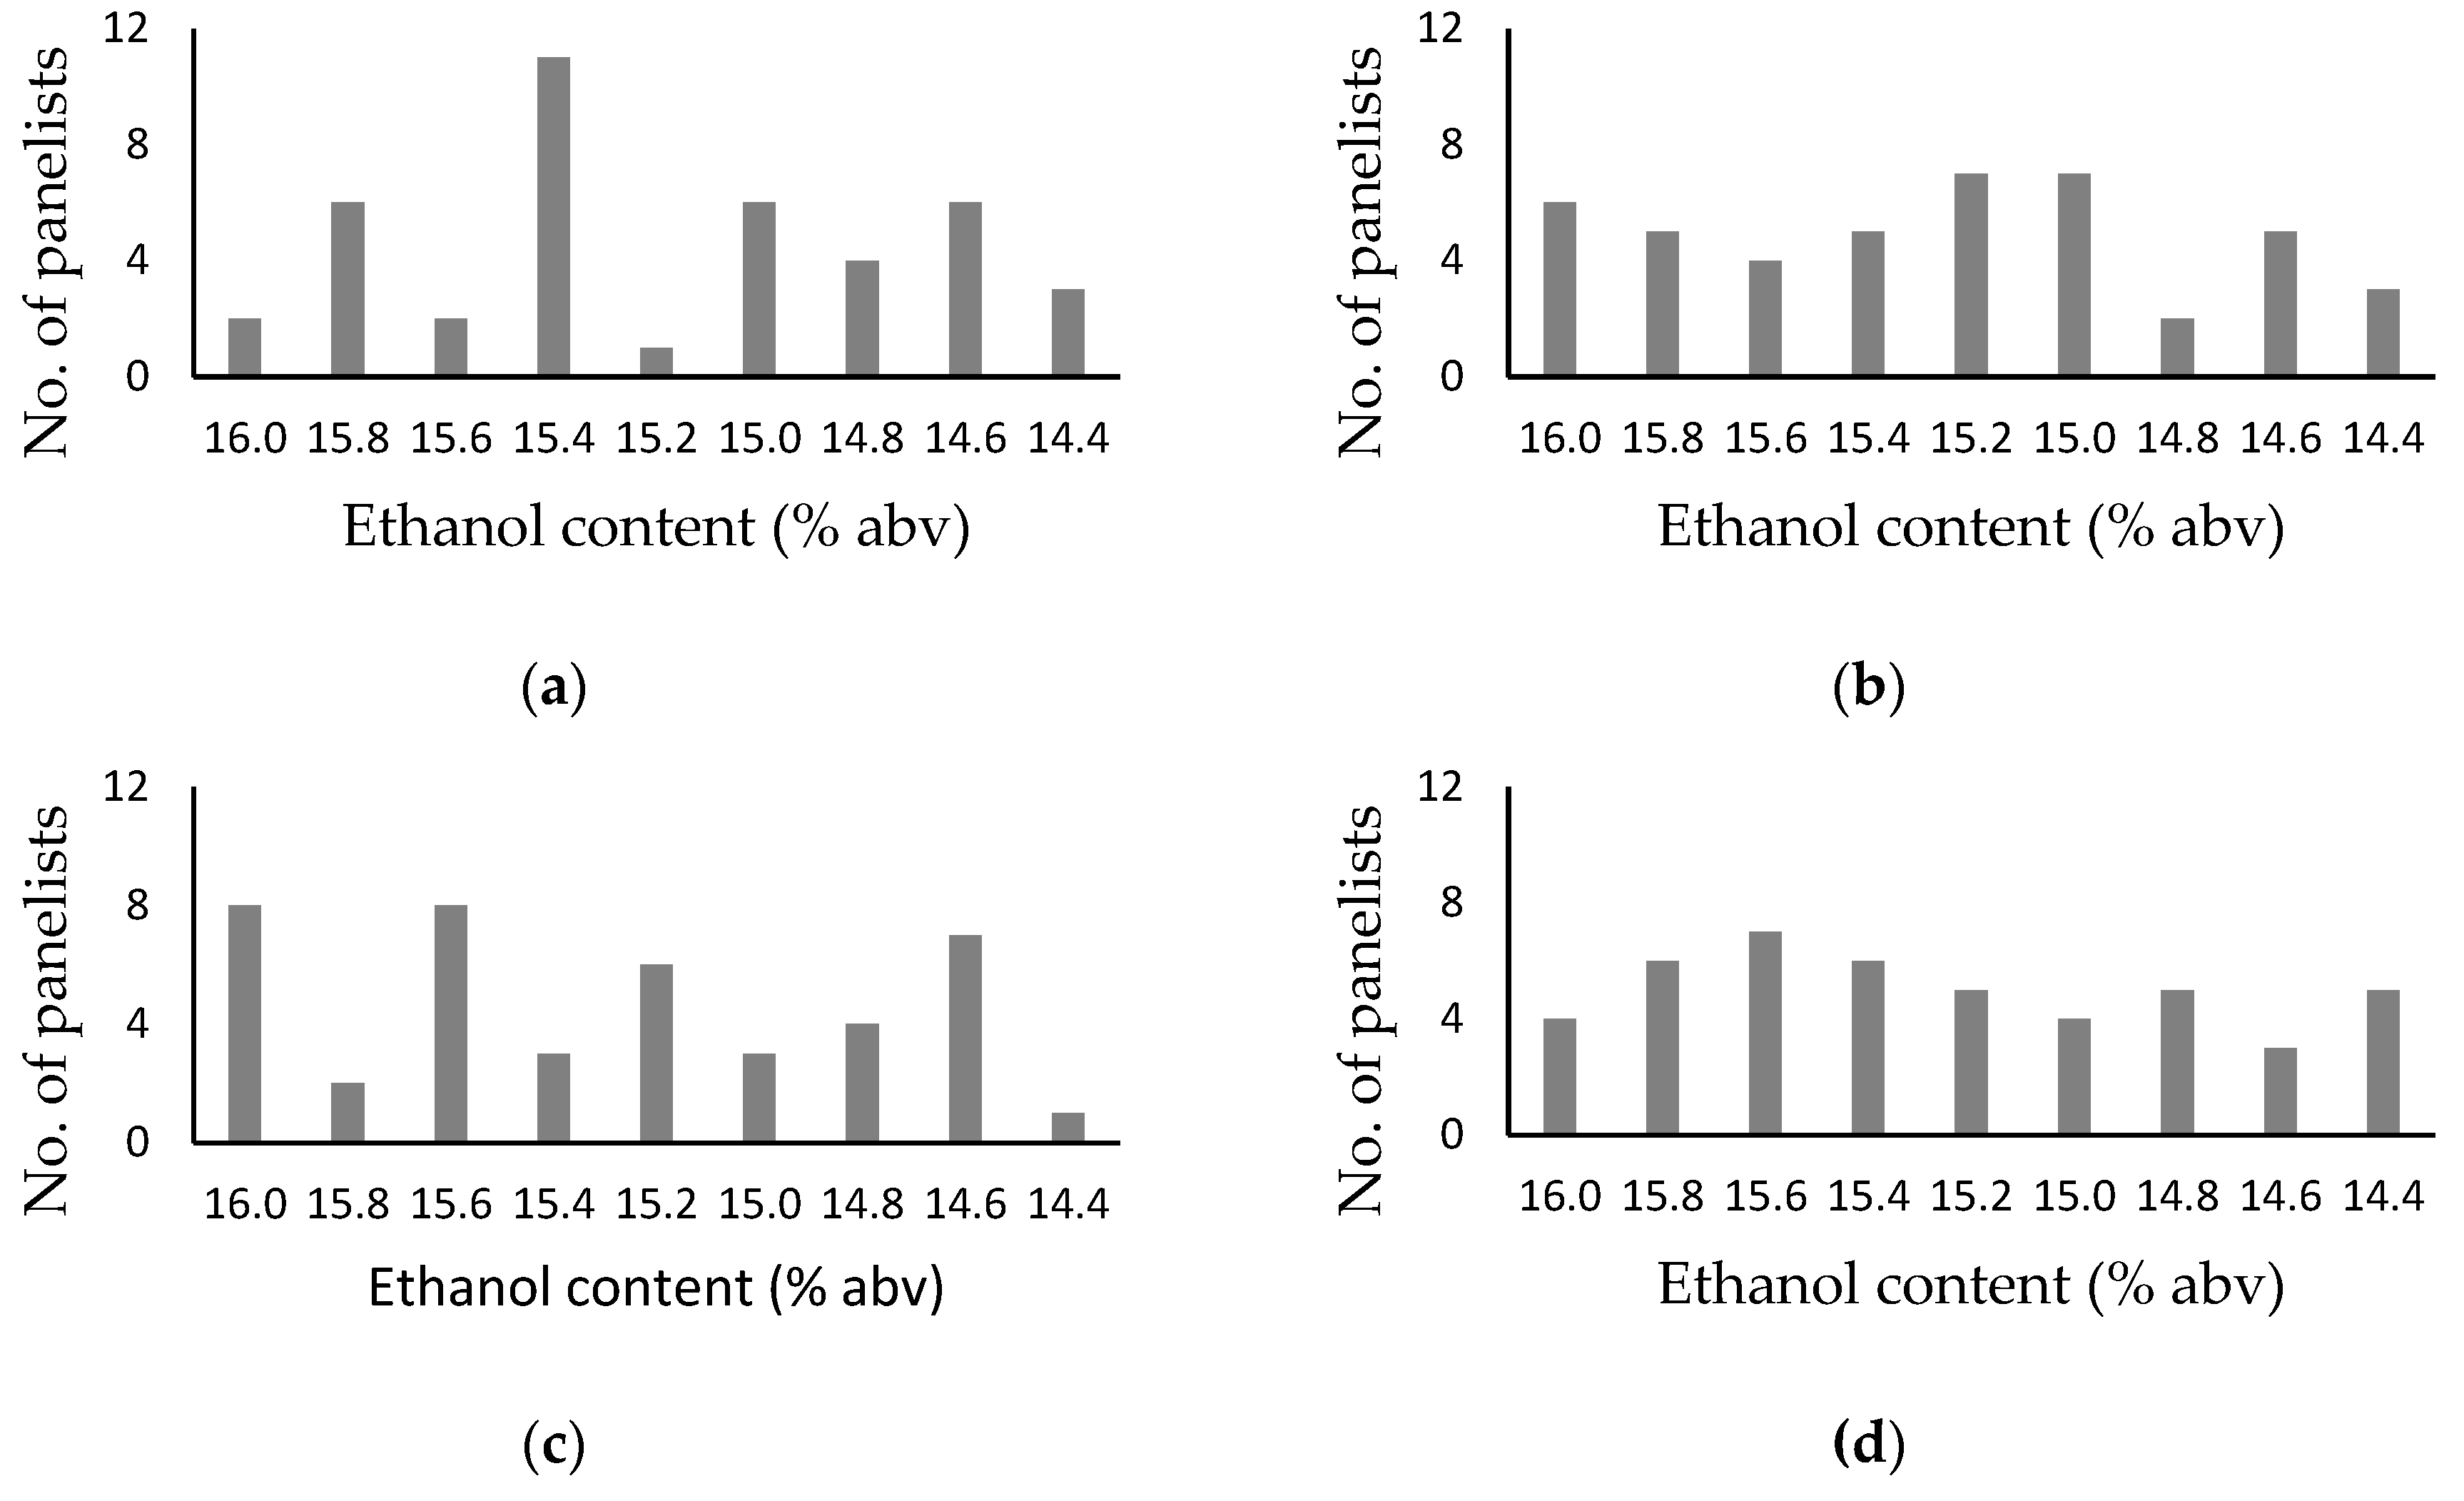
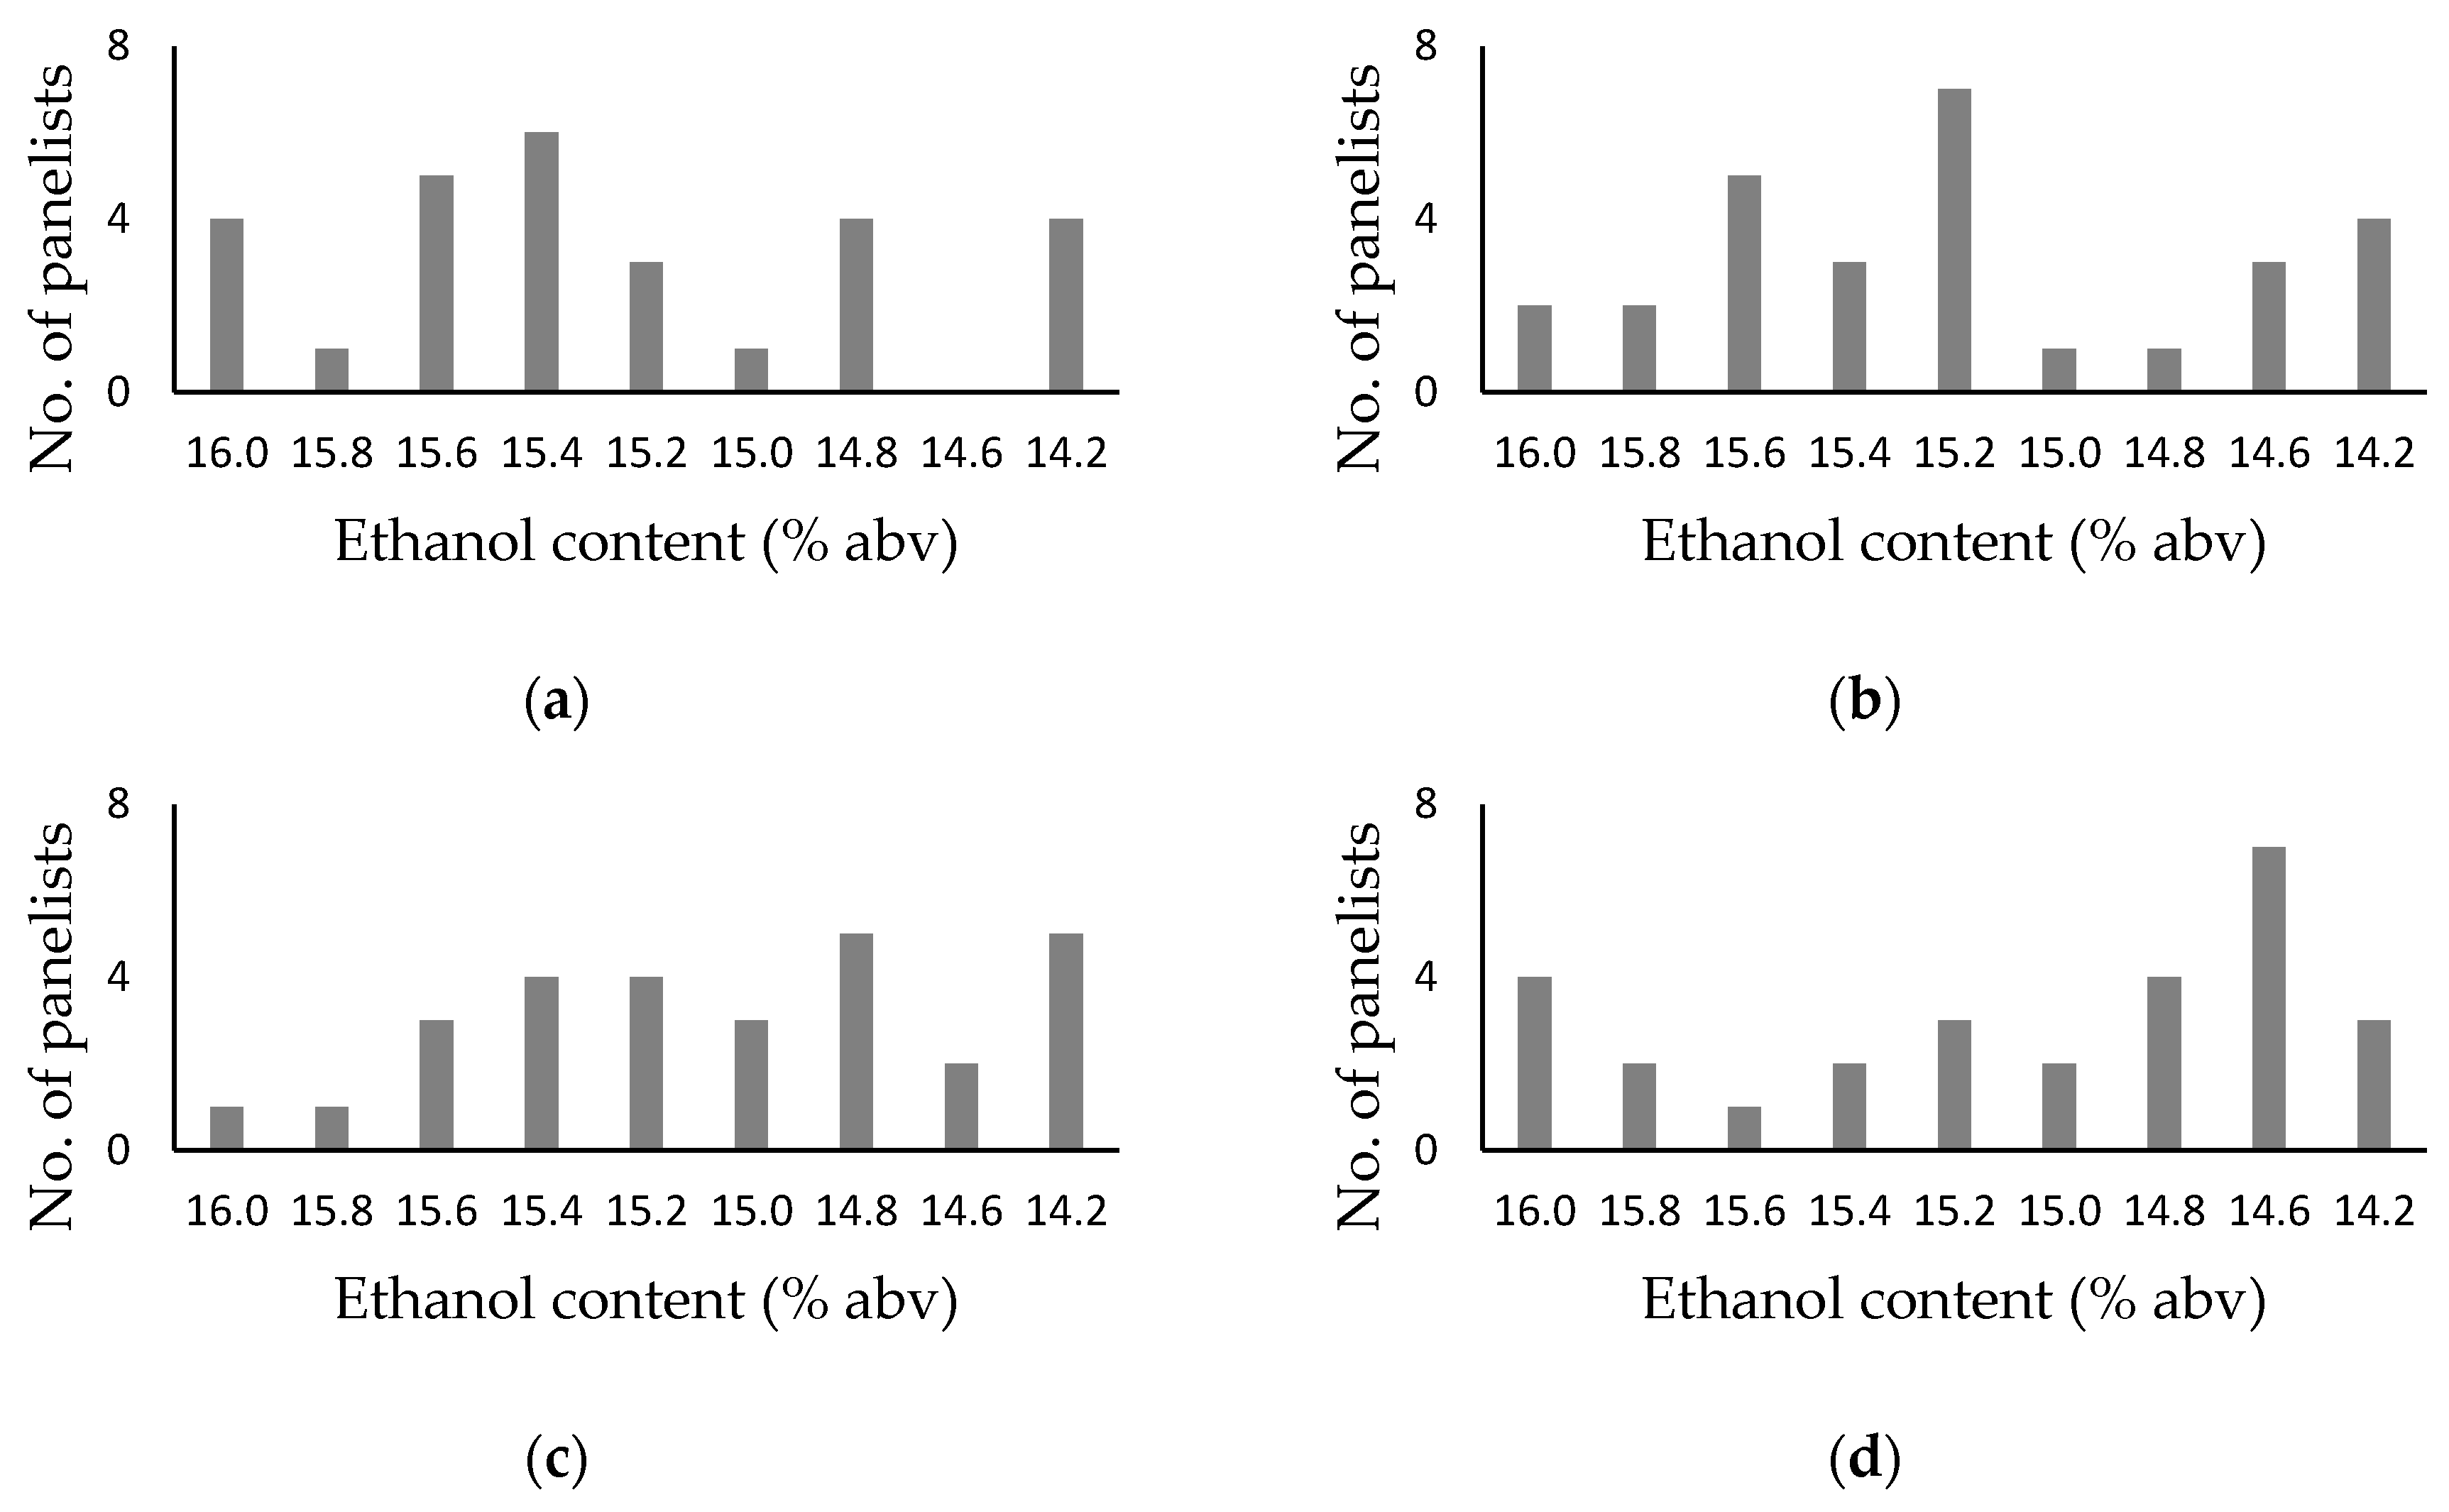
3.2. Influence of Presentation Order on the Outcomes of Alcohol Sweetspotting Trials
3.3. Influence of Ethanol Content on the Outcomes of Difference Tests
4. Conclusions
Supplementary Materials
Author Contributions
Funding
Acknowledgments
Conflicts of Interest
References
- Godden, P.; Muhlack, R. Trends in the composition of Australian wine. Aust. N. Z. Grapegrow. Winemak. 2010, 558, 47–61. [Google Scholar]
- Zamora, F. Dealcoholised wines. In Wine Safety, Consumer Preference, and Human Health; Moreno-Arribas, M., Bartolomé Suáldea, B., Eds.; Springer: Cham, Switzerland, 2016; pp. 163–182. [Google Scholar] [CrossRef]
- Pham, D.-T.; Stockdale, V.J.; Wollan, D.; Jeffery, D.W.; Wilkinson, K.L. Compositional consequences of partial dealcoholization of red wine by reverse osmosis-evaporative perstraction. Molecules 2019, 24, 1404. [Google Scholar] [CrossRef] [PubMed]
- Takács, L.; Vatai, G.; Korány, K. Production of alcohol free wine by pervaporation. J. Food Eng. 2007, 78, 136–146. [Google Scholar] [CrossRef]
- Schmidtke, L.M.; Blackman, J.W.; Agboola, S.O. Production technologies for reduced alcoholic wines. J. Food Sci. 2012, 77, R25–R41. [Google Scholar] [CrossRef] [PubMed]
- Wollan, D. Alcohol sweet spot seminars in McLaren Vale. Aust. N. Z. Grapegrow. Winemak. 2005, 502, 70–71. [Google Scholar]
- Martin, S.; Pangborn, R.M. Taste interaction of ethyl alcohol with sweet, salty, sour and bitter compounds. J. Sci. Food Agric. 1970, 21, 653–655. [Google Scholar] [CrossRef]
- Fischer, U.; Noble, A.C. The effect of ethanol, catechin, and pH on sourness and bitterness of wine. Am. J. Enol. Vitic. 1994, 45, 6–10. [Google Scholar]
- Mattes, R.D.; DiMeglio, D. Ethanol perception and ingestion. Physiol. Behav. 2001, 72, 217–229. [Google Scholar] [CrossRef]
- Fontoin, H.; Saucier, C.; Teissedre, P.-L.; Glories, Y. Effect of pH, ethanol and acidity on astringency and bitterness of grape seed tannin oligomers in model wine solution. Food Qual. Pref 2008, 19, 286–291. [Google Scholar] [CrossRef]
- Jones, P.R.; Gawel, R.; Francis, I.L.; Waters, E. The influence of interactions between major white wine components on the aroma, flavour and texture of model white wine. Food Qual. Pref 2008, 19, 596–607. [Google Scholar] [CrossRef]
- Yu, P.; Pickering, G.J. Ethanol difference thresholds in wine and the influence of mode of evaluation and wine style. Am. J. Enol. Vitic. 2008, 59, 146–152. [Google Scholar]
- Tsachaki, M.; Linforth, R.S.T.; Taylor, A.J. Dynamic headspace analysis of the release of volatile organic compounds from ethanolic systems by direct APCI-MS. J. Agric. Food Chem. 2005, 53, 8328–8333. [Google Scholar] [CrossRef] [PubMed]
- Robinson, A.L.; Ebeler, S.E.; Heymann, H.; Boss, P.K.; Solomon, P.S.; Trengove, R.D. Interactions between wine volatile compounds and grape and wine matrix components influence aroma compounds headspace partitioning. J. Agric. Food Chem. 2009, 57, 10313–10322. [Google Scholar] [CrossRef] [PubMed]
- Schmitt, M.; Christmann, M.; Jung, R.; Schübler, C. Enological/technical approaches to reduce elevated alcohol levels in wine (alcohol management) – Sensory results. Bull. de l’OIV 2013, 86, 485–492. [Google Scholar]
- King, E.S.; Heymann, H. The effect of reduced alcohol on the sensory profiles and consumer preferences of white wine. J. Sens. Stud. 2014, 29, 33–42. [Google Scholar] [CrossRef]
- Meilgaard, M.C.; Carr, B.T.; Civille, G.V. Sensory Evaluation Techniques, 4th ed.; CRC Press: Boca Raton, FL, USA, 2007. [Google Scholar]
- Frayne, R.F. Direct analysis of the major organic components in grape must and wine using high performance liquid chromatography. Am. J. Enol. Vitic. 1986, 37, 281–287. [Google Scholar]
- Cliff, M.A.; King, M.C.; Schlosser, J. Anthocyanin, phenolic composition, colour measurement and sensory analysis of BC commercial red wines. Food Res. Int. 2007, 40, 92–100. [Google Scholar] [CrossRef]
- Siebert, T.E.; Smyth, H.E.; Capone, D.L.; Neuwohner, C.; Pardon, K.H.; Skouroumounis, G.K.; Herderich, M.J.; Sefton, M.A.; Pollnitz, A.P. Stable isotope dilution analysis of wine fermentation products by HS-SPME-GC-MS. Anal. Bioanal. Chem. 2005, 381, 937–947. [Google Scholar] [CrossRef]
- Kuznetsova, A.; Brockhoff, P.B.; Christensen, R.H.B. lmerTest package: Tests in linear mixed effects models. J. Stat. Softw. 2017, 82, 1–26. [Google Scholar] [CrossRef]
- Bates, D.; Maechler, M.; Bolker, B.; Walker, S. Fitting linear mixed-effects models using lme4. J. Stat. Softw. 2015, 67, 1–48. [Google Scholar] [CrossRef]
- Dartiguenave, C.; Jeandet, P.; Maujean, A. Study of the contribution of the major organic acids of wine to the buffering capacity of wine in model solutions. Am. J. Enol. Vitic. 2000, 51, 352–356. [Google Scholar]
- Torija, M.J.; Beltran, G.; Novo, M.; Poblet, M.; Rozes, N.; Mas, A.; Guillamon, J.M. Effect of organic acids and nitrogen source on alcohol fermentation: Study of their buffering capacity. J. Agric. Food Chem. 2003, 51, 916–922. [Google Scholar] [CrossRef] [PubMed]
- Gonzalez-Manzano, S.; Dueñas, M.; Rivasgonzalo, J.; Escribano-Bailón, M.; Santos-Buelga, C. Studies on the copigmentation between anthocyanins and flavan-3-ols and their influence in the colour expression of red wine. Food Chem. 2009, 114, 649–656. [Google Scholar] [CrossRef]
- Gonçalves, F.; Ribeiro, R.; Neves, L.; Lemperle, T.; Lança, M.; Ricardo da Silva, J.; Laureano, O. Alcohol reduction in wine by nanofiltration. Some comparisons with reverse osmosis technique. In Proceedings of the 1st Oenoviti International Symposium—Alcohol Level Reduction in Wine, Bordeaux, France, 6 September 2013; VIGNE et vin Publications Internationales: Bordeaux, France, 2013; pp. 64–67. [Google Scholar]
- Longo, R.; Blackman, J.W.; Torley, P.J.; Rogiers, S.Y.; Schmidtke, L.M. Changes in volatile composition and sensory attributes of wines during alcohol content reduction. J. Sci. Food Agric. 2016, 97, 8–16. [Google Scholar] [CrossRef] [PubMed]
- Rayess, Y.E.; Mietton-Peuchot, M. Membrane technologies in wine industry: An overview. Crit. Rev. Food Sci. Nutr. 2016, 56, 2005–2020. [Google Scholar] [CrossRef] [PubMed]
- Francis, I.L.; Newton, J. Determining wine aroma from compositional data. Aust. J. Grape Wine Res. 2005, 11, 114–126. [Google Scholar] [CrossRef]
- King, E.S.; Dunn, R.L.; Heymann, H. The influence of alcohol on the sensory perception of red wines. Food Qual Pref. 2013, 28, 235–243. [Google Scholar] [CrossRef]


| Parameter | Wine A | RAW A | p | Wine B | RAW B | p |
|---|---|---|---|---|---|---|
| alcohol (% abv) | 16.0 a | 14.4 b | <0.01 | 16.0 a | 14.2 b | <0.01 |
| residual sugar (g/L) | 0.56 a | 0.68 b | <0.01 | 0.5 a | 1.1 b | <0.01 |
| density (g/mL) | 0.993 | 0.995 | ns | 0.993 a | 0.996 a | <0.01 |
| glycerol (g/L) | 10.7 | 11.1 | ns | 10.9 b | 11.6 a | 0.01 |
| pH | 3.7 | 3.7 | – | 3.6 | 3.6 | – |
| TA (g/L) | 6.8 | 6.8 | – | 6.8 | 6.9 | – |
| VA (g/L) | 0.7 | 0.8 | – | 0.7 | 0.7 | – |
| succinic acid (g/L) | 1.4 | 1.5 | ns | 1.5 | 1.5 | ns |
| lactic acid (g/L) | 1.9 | 2.0 | ns | 1.9 b | 2.4 a | 0.01 |
| malic acid (g/L) | 0.20 | 0.23 | ns | 0.15 | 0.10 | ns |
| tartaric acid (g/L) | 2.6 | 2.8 | ns | 2.8 | 2.7 | ns |
| wine color density (au) | 12.4 a | 12.6 b | <0.01 | 15.4 | 15.4 | ns |
| wine hue | 0.7 | 0.7 | – | 0.7 | 0.7 | – |
| L* | 62.3 a | 61.8 b | <0.01 | 55.7 | 55.7 | ns |
| a* | 35.5 a | 35.9 b | <0.01 | 41.4 | 41.4 | ns |
| b* | 2.77 a | 2.89 b | 0.05 | 4.6 | 4.5 | ns |
| Presentation Order | Goodness of Fit Test | One Proportion Test | ||
|---|---|---|---|---|
| Trial 1 | Trial 2 | Trial 1 | Trial 2 | |
| row, randomized | 0.033 | 0.227 | 0.004 (11/41) | 0.083 (6/28) |
| row, ordered | 0.791 | 0.270 | 0.212 (7/44) | 0.030 (7/28) |
| circular, randomized | 0.966 | 0.434 | 0.089 (8/42) | 0.194 (5/28) |
| circular, ordered | 0.151 | 0.639 | 0.229 (7/45) | 0.030 (7/28) |
| Ethanol Concentration (% Abv) of Samples Evaluated in Difference Tests | ||||||
|---|---|---|---|---|---|---|
| 16.3 v 16.1 (0.2%) | 16.3 v 15.5 (0.5%) | 16.3 v 15.3 (1.0%) | 15.0 v 14.0 (1.0%) | 14.5 v 14.0 (0.5%) | 14.2 v 14.0 (0.2%) | |
| correct responses | 5/18 | 7/18 | 9/18 | 5/18 | 6/18 | 5/18 |
| Volatile Compound | Descriptors | Threshold | Wine A | RAW A | Wine B | RAW B | p | SD |
|---|---|---|---|---|---|---|---|---|
| ethyl propanoate | fruity | 1840 | 170 | 75 | 251 | 88 | ns | 3 |
| ethyl butanoate | acid fruit | 20 | 94 | 21 | 136 | 32 | ns | 1 |
| ethyl hexanoate | green apple | 5 | 11 | 3 | 13 | 5 | <0.01 | 6 |
| ethyl octanoate | sweet, soap | 2 | 7 | 3 | 8 | 6 | ns | 3 |
| ethyl decanoate | soap | 200 | 2 | 1 | 2 | 2 | ns | 5 |
| 1-hexanol | green, grass | 4000 | 1950 | 2265 | 2132 | 2096 | ns | 10 |
| 2-phenylethanol | roses | 10 | 381 | 399 | 376 | 399 | ns | 0.7 |
| ethyl 2-methylpropanoate | fruity | 15 | 115 | 14 | 95 | 40 | <0.05 | 4 |
| ethyl 2-methylbutanoate | sweet fruit | 1 | 13 | 2 | 14 | 5 | ns | 1 |
| ethyl 3-methylbutanoate | berry | 3 | 20 | 4 | 22 | 8 | <0.05 | 0.3 |
| 2-methylpropyl acetate | banana, fruity | 1600 | 27 | 5 | 38 | 11 | ns | 2 |
| 3-methylbutyl acetate | banana | 30 | 255 | 110 | 723 | 136 | ns | 20 |
| 2-methylbutyl acetate | banana, fruity | 1600 | 93 | 35 | 231 | 46 | ns | 5 |
| 2-phenylethyl acetate | floral | 250 | 247 | 739 | 698 | 439 | ns | 1 |
| hexyl acetate | sweet, perfume | 670 | 1 | 1 | 7 | 1 | ns | 0.1 |
© 2019 by the authors. Licensee MDPI, Basel, Switzerland. This article is an open access article distributed under the terms and conditions of the Creative Commons Attribution (CC BY) license (http://creativecommons.org/licenses/by/4.0/).
Share and Cite
Pham, D.-T.; Stockdale, V.J.; Jeffery, D.W.; Tuke, J.; Wilkinson, K.L. Investigating Alcohol Sweetspot Phenomena in Reduced Alcohol Red Wines. Foods 2019, 8, 491. https://doi.org/10.3390/foods8100491
Pham D-T, Stockdale VJ, Jeffery DW, Tuke J, Wilkinson KL. Investigating Alcohol Sweetspot Phenomena in Reduced Alcohol Red Wines. Foods. 2019; 8(10):491. https://doi.org/10.3390/foods8100491
Chicago/Turabian StylePham, Duc-Truc, Vanessa J. Stockdale, David W. Jeffery, Jonathan Tuke, and Kerry L. Wilkinson. 2019. "Investigating Alcohol Sweetspot Phenomena in Reduced Alcohol Red Wines" Foods 8, no. 10: 491. https://doi.org/10.3390/foods8100491
APA StylePham, D.-T., Stockdale, V. J., Jeffery, D. W., Tuke, J., & Wilkinson, K. L. (2019). Investigating Alcohol Sweetspot Phenomena in Reduced Alcohol Red Wines. Foods, 8(10), 491. https://doi.org/10.3390/foods8100491