Quality Assessment of Pork and Turkey Hams Using FT-IR Spectroscopy, Colorimetric, and Image Analysis


 and
and 
Abstract
:1. Introduction
2. Materials and Methods
2.1. Ham Samples
2.2. Color Measurement
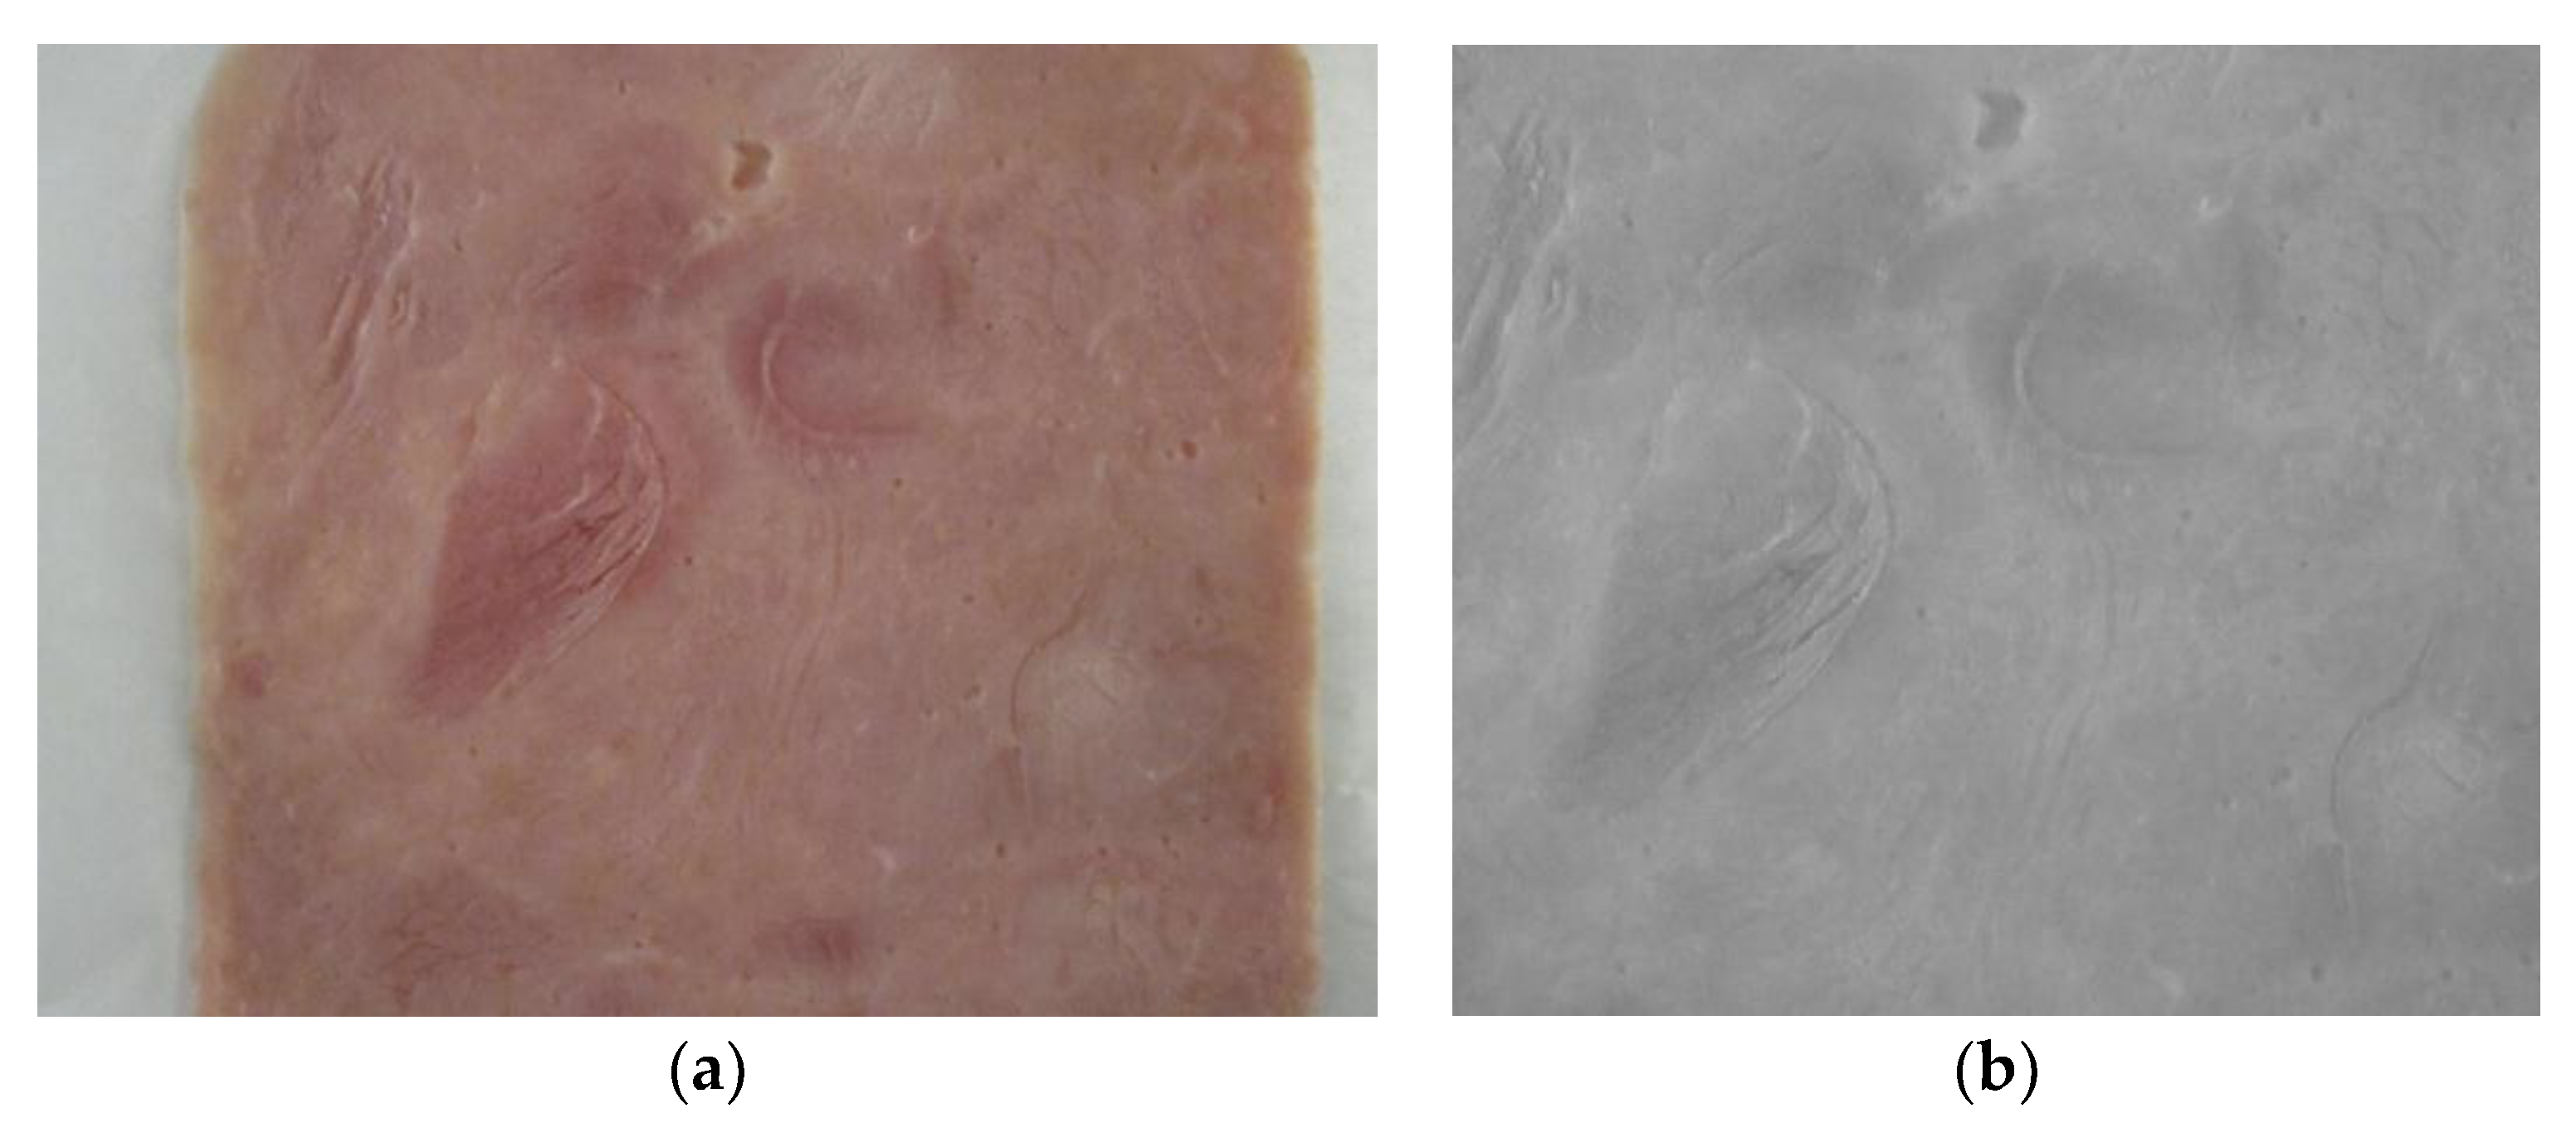
2.3. Image Acquisition
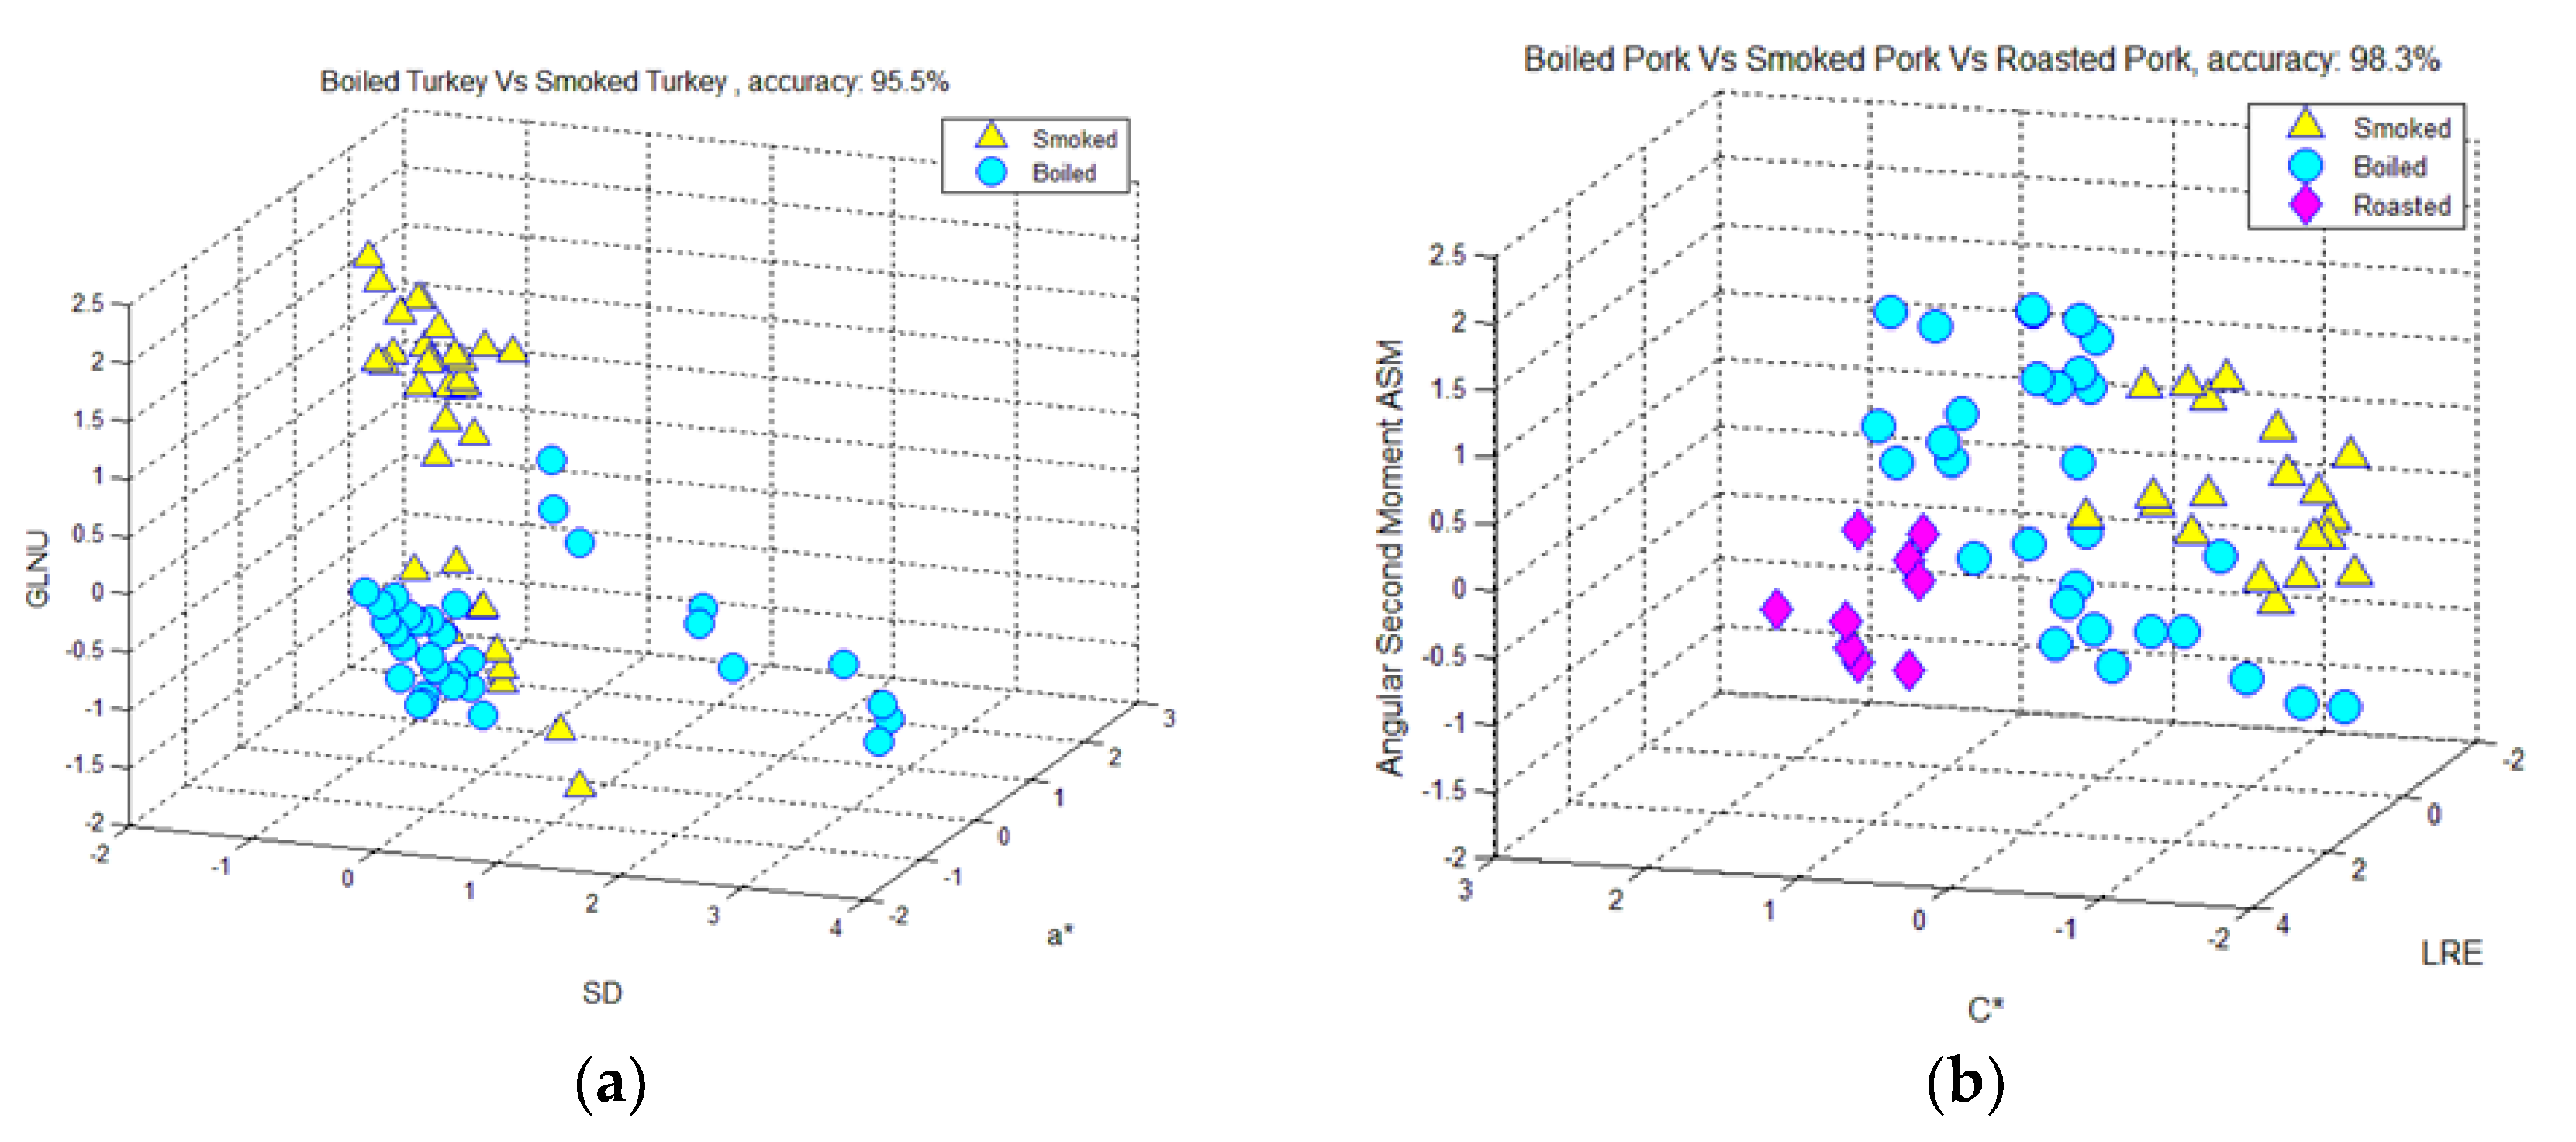
2.4. Discriminant Analysis
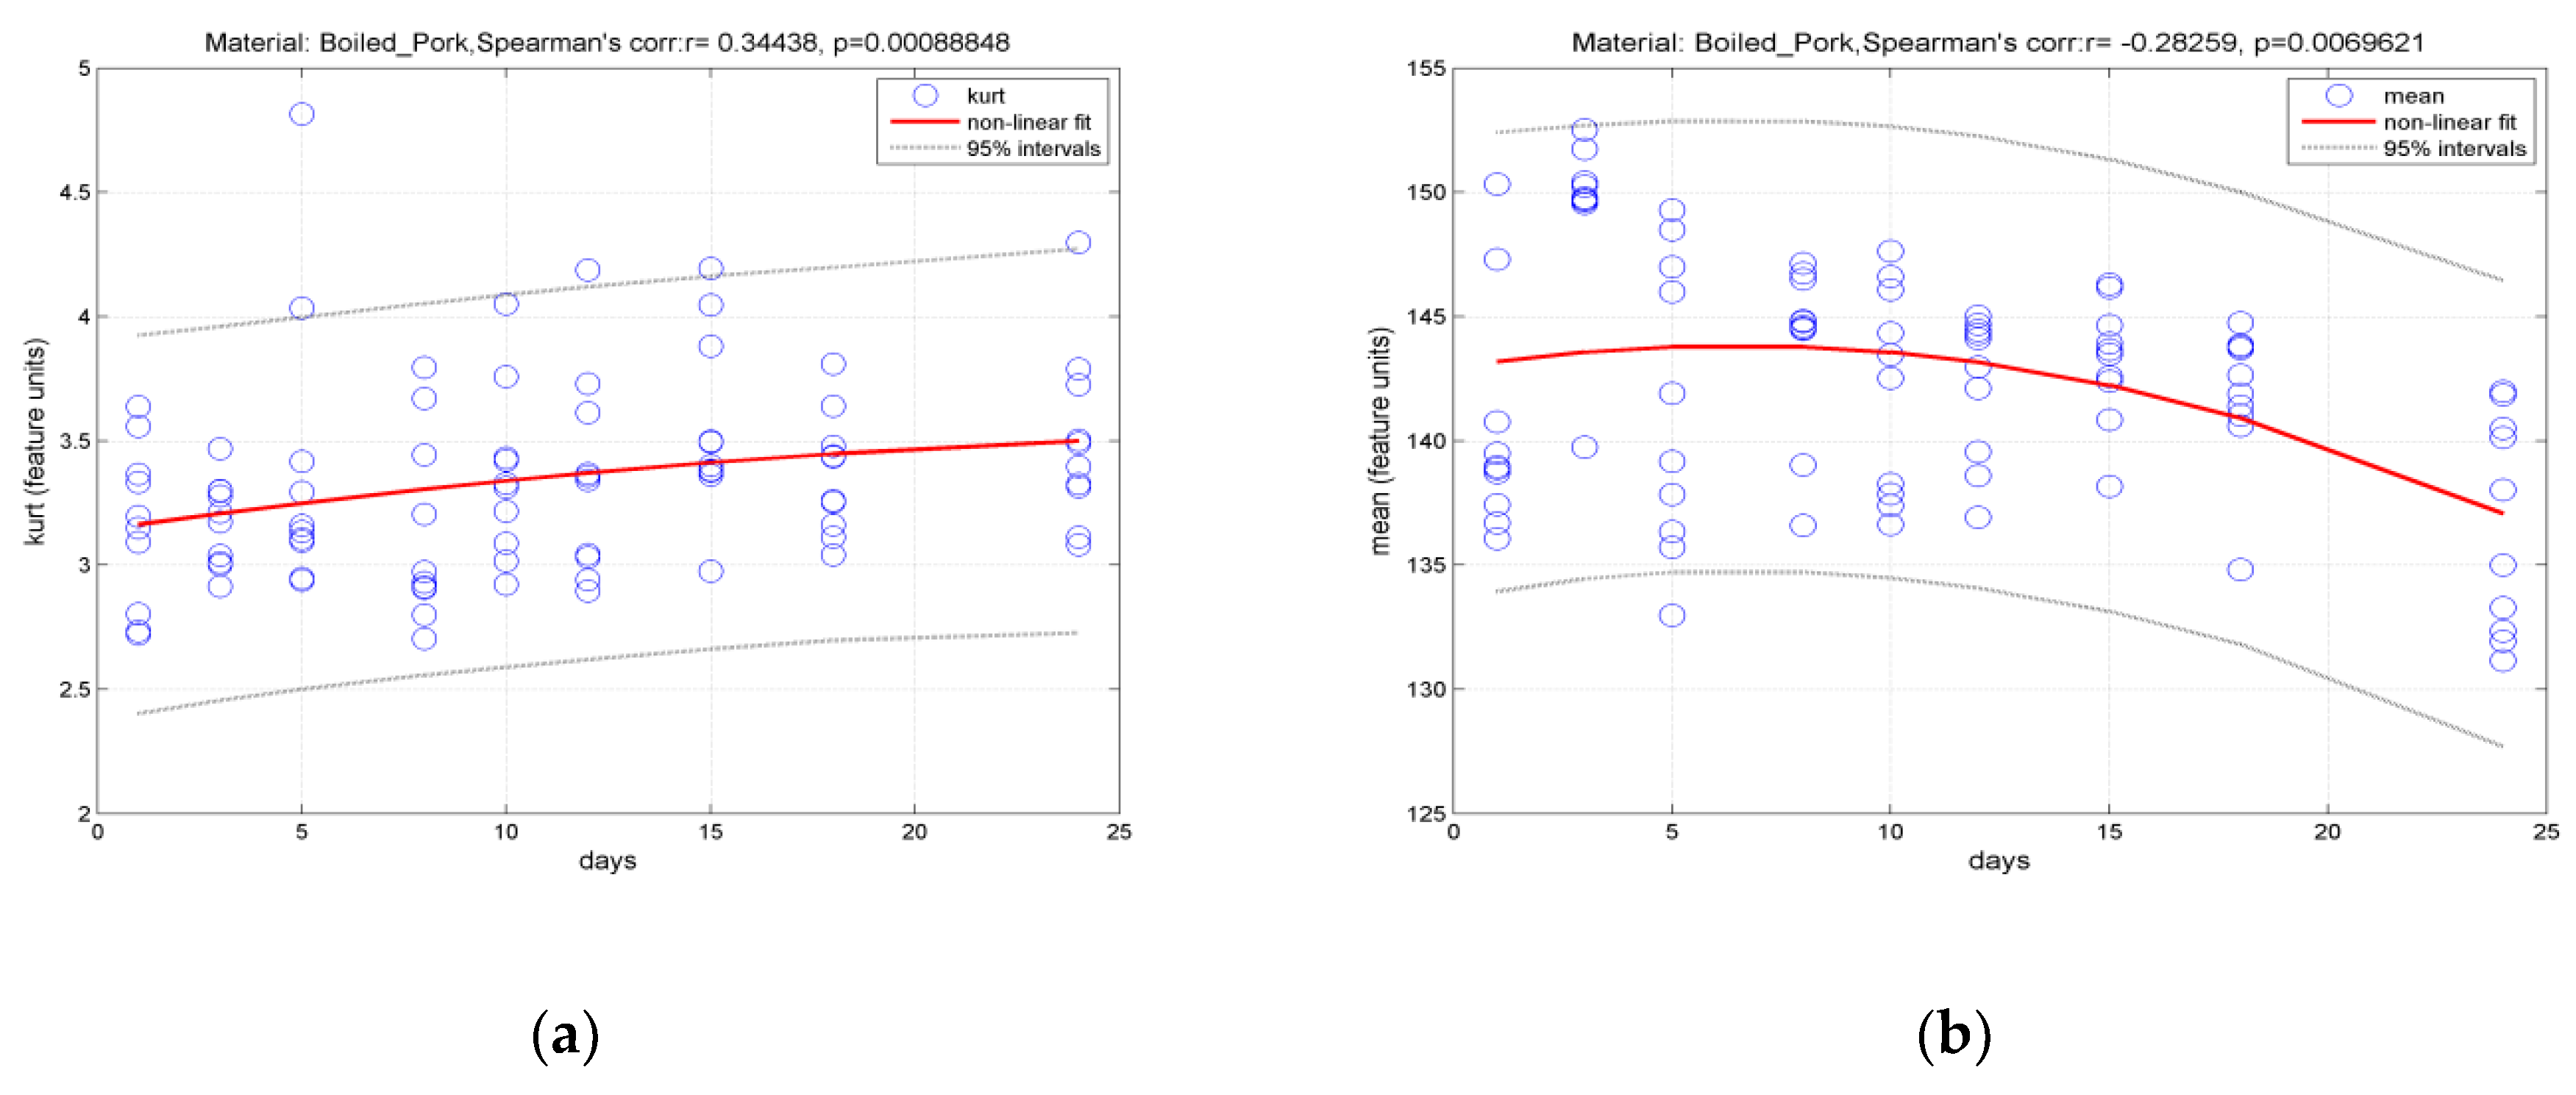
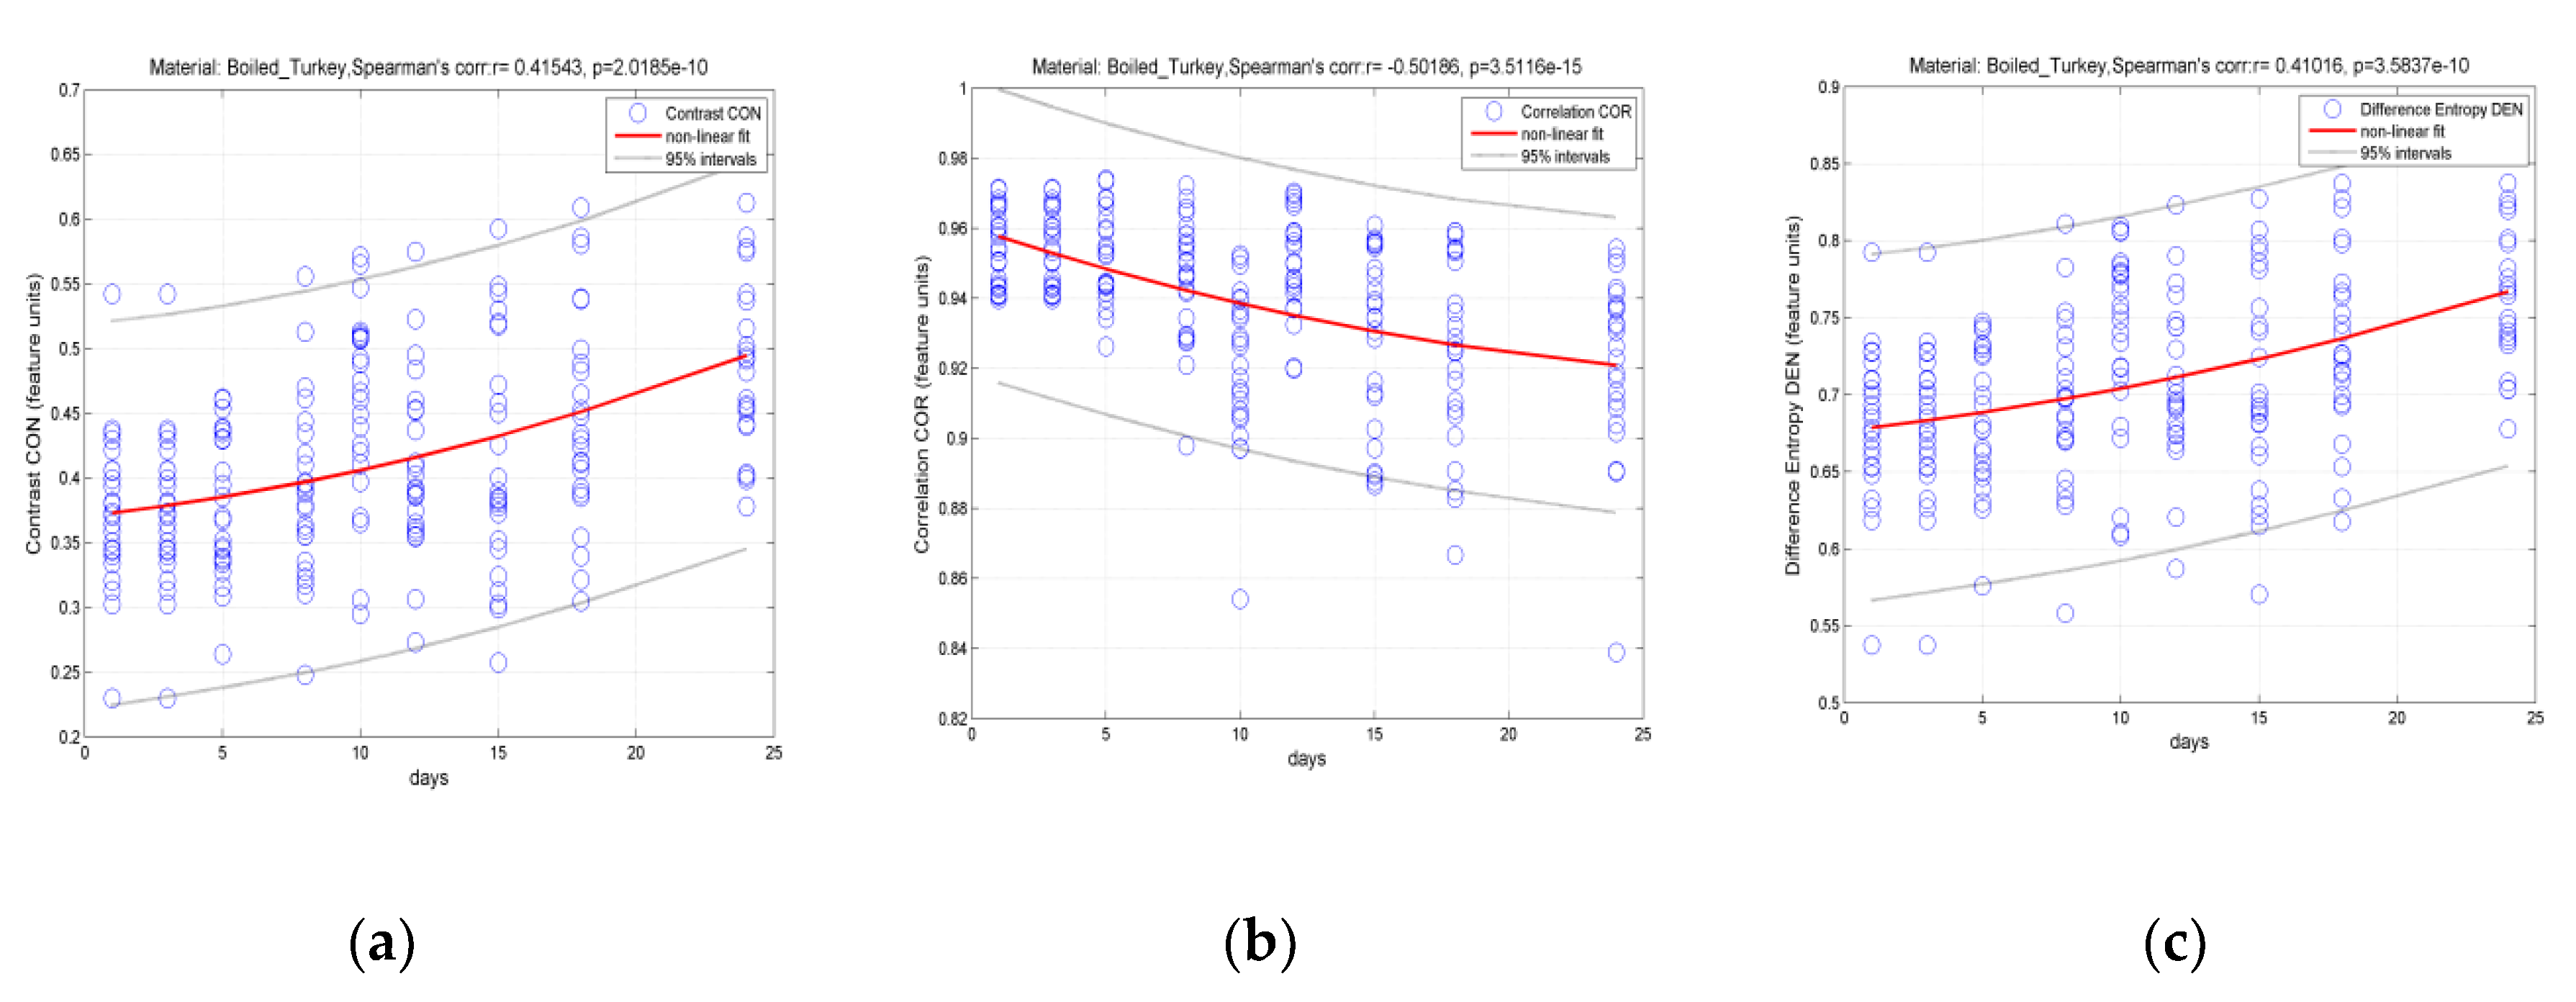
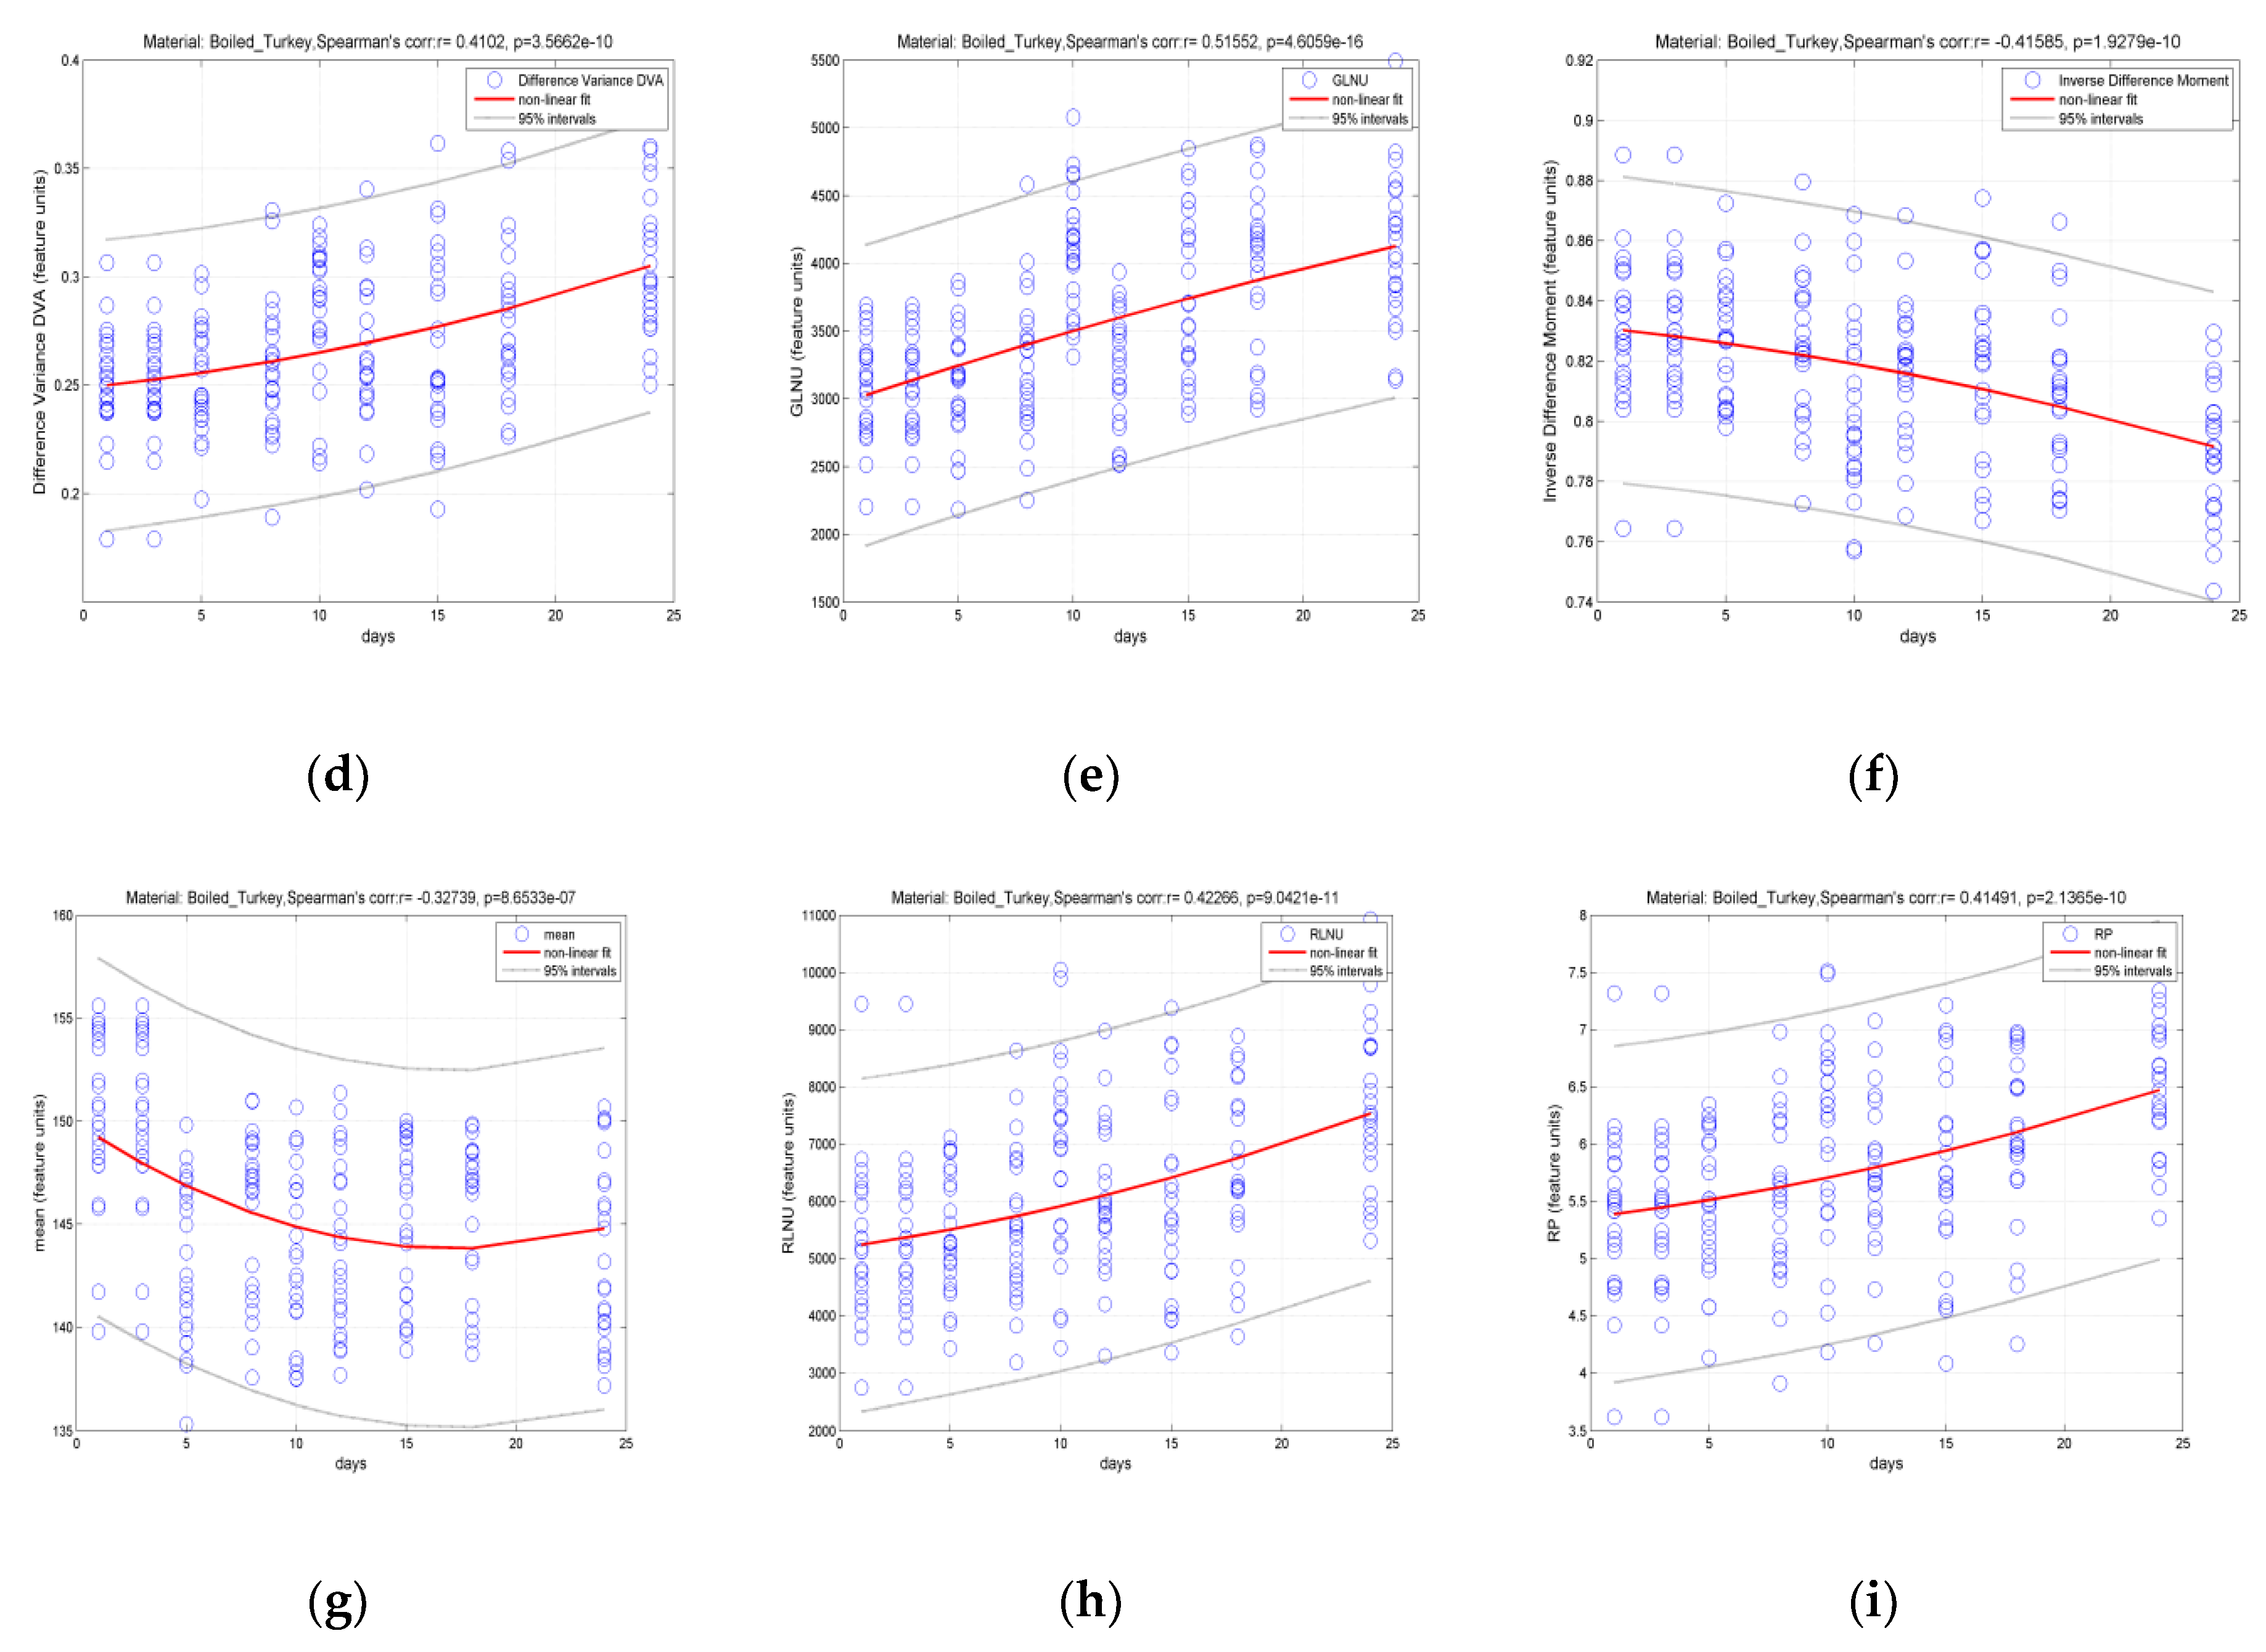
2.5. Nonlinear Regression Analysis
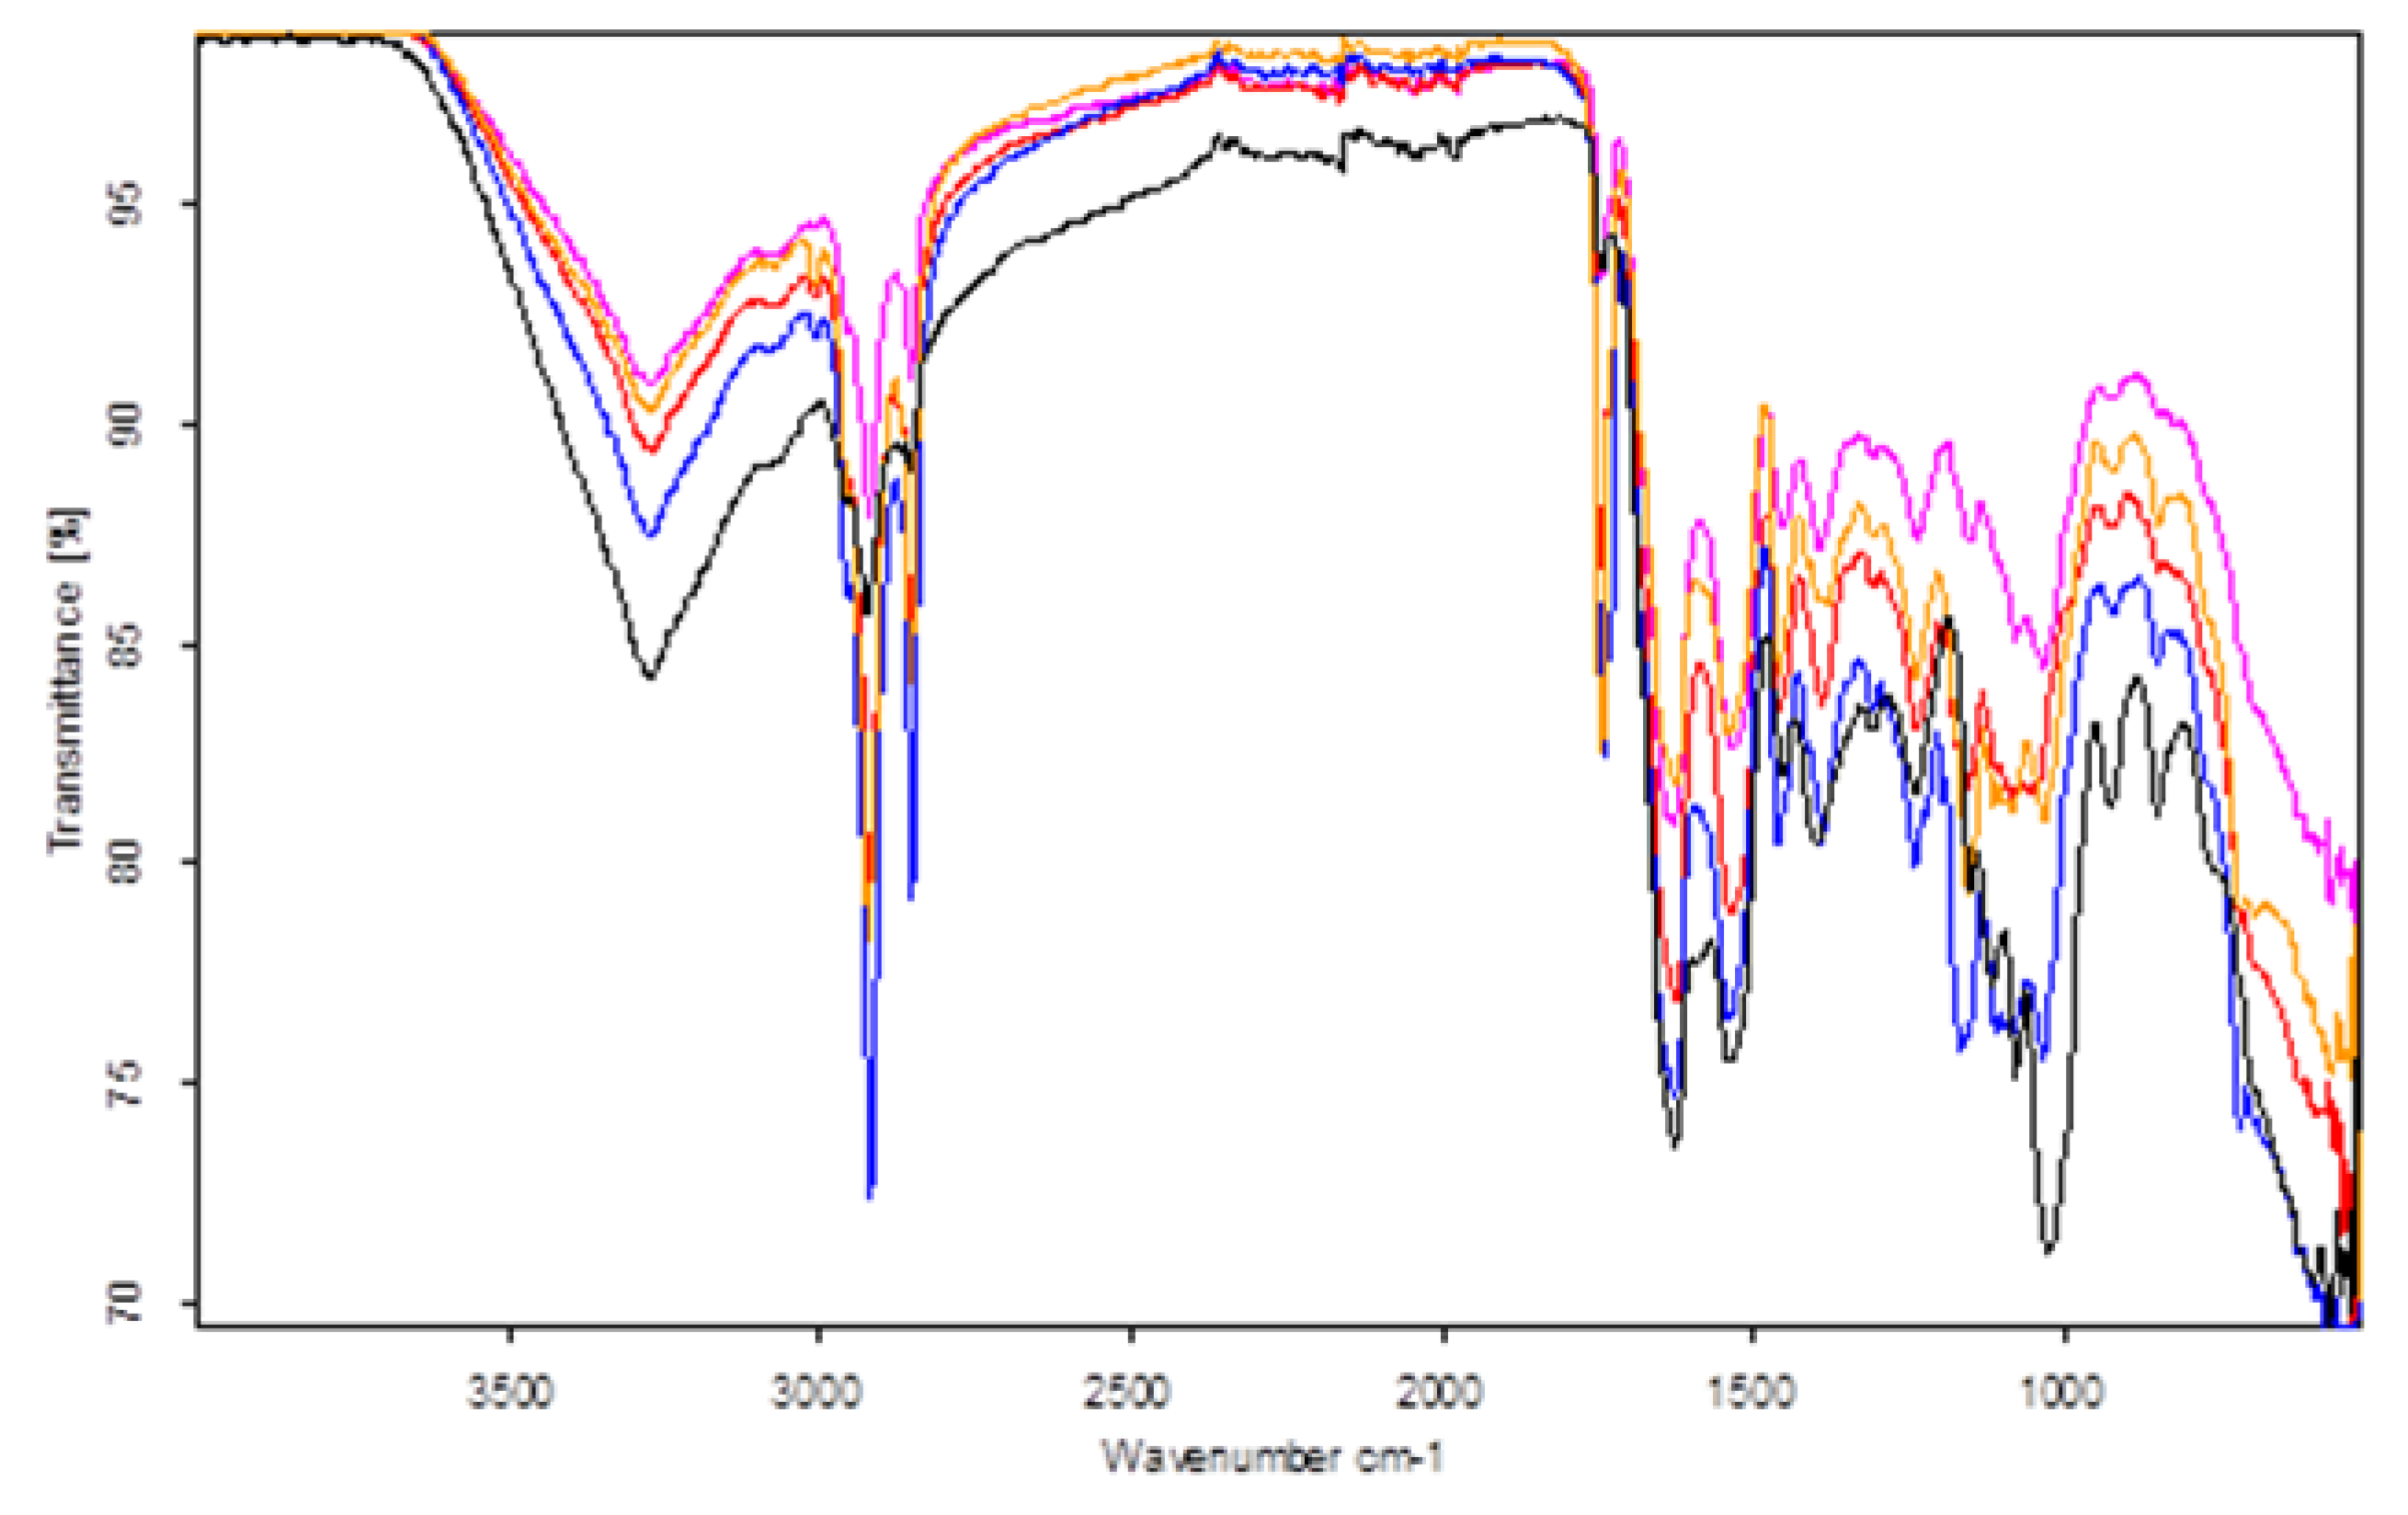
2.6. FT-IR Spectra Acquisition
2.7. Statistical Analysis
3. Results and Discussion
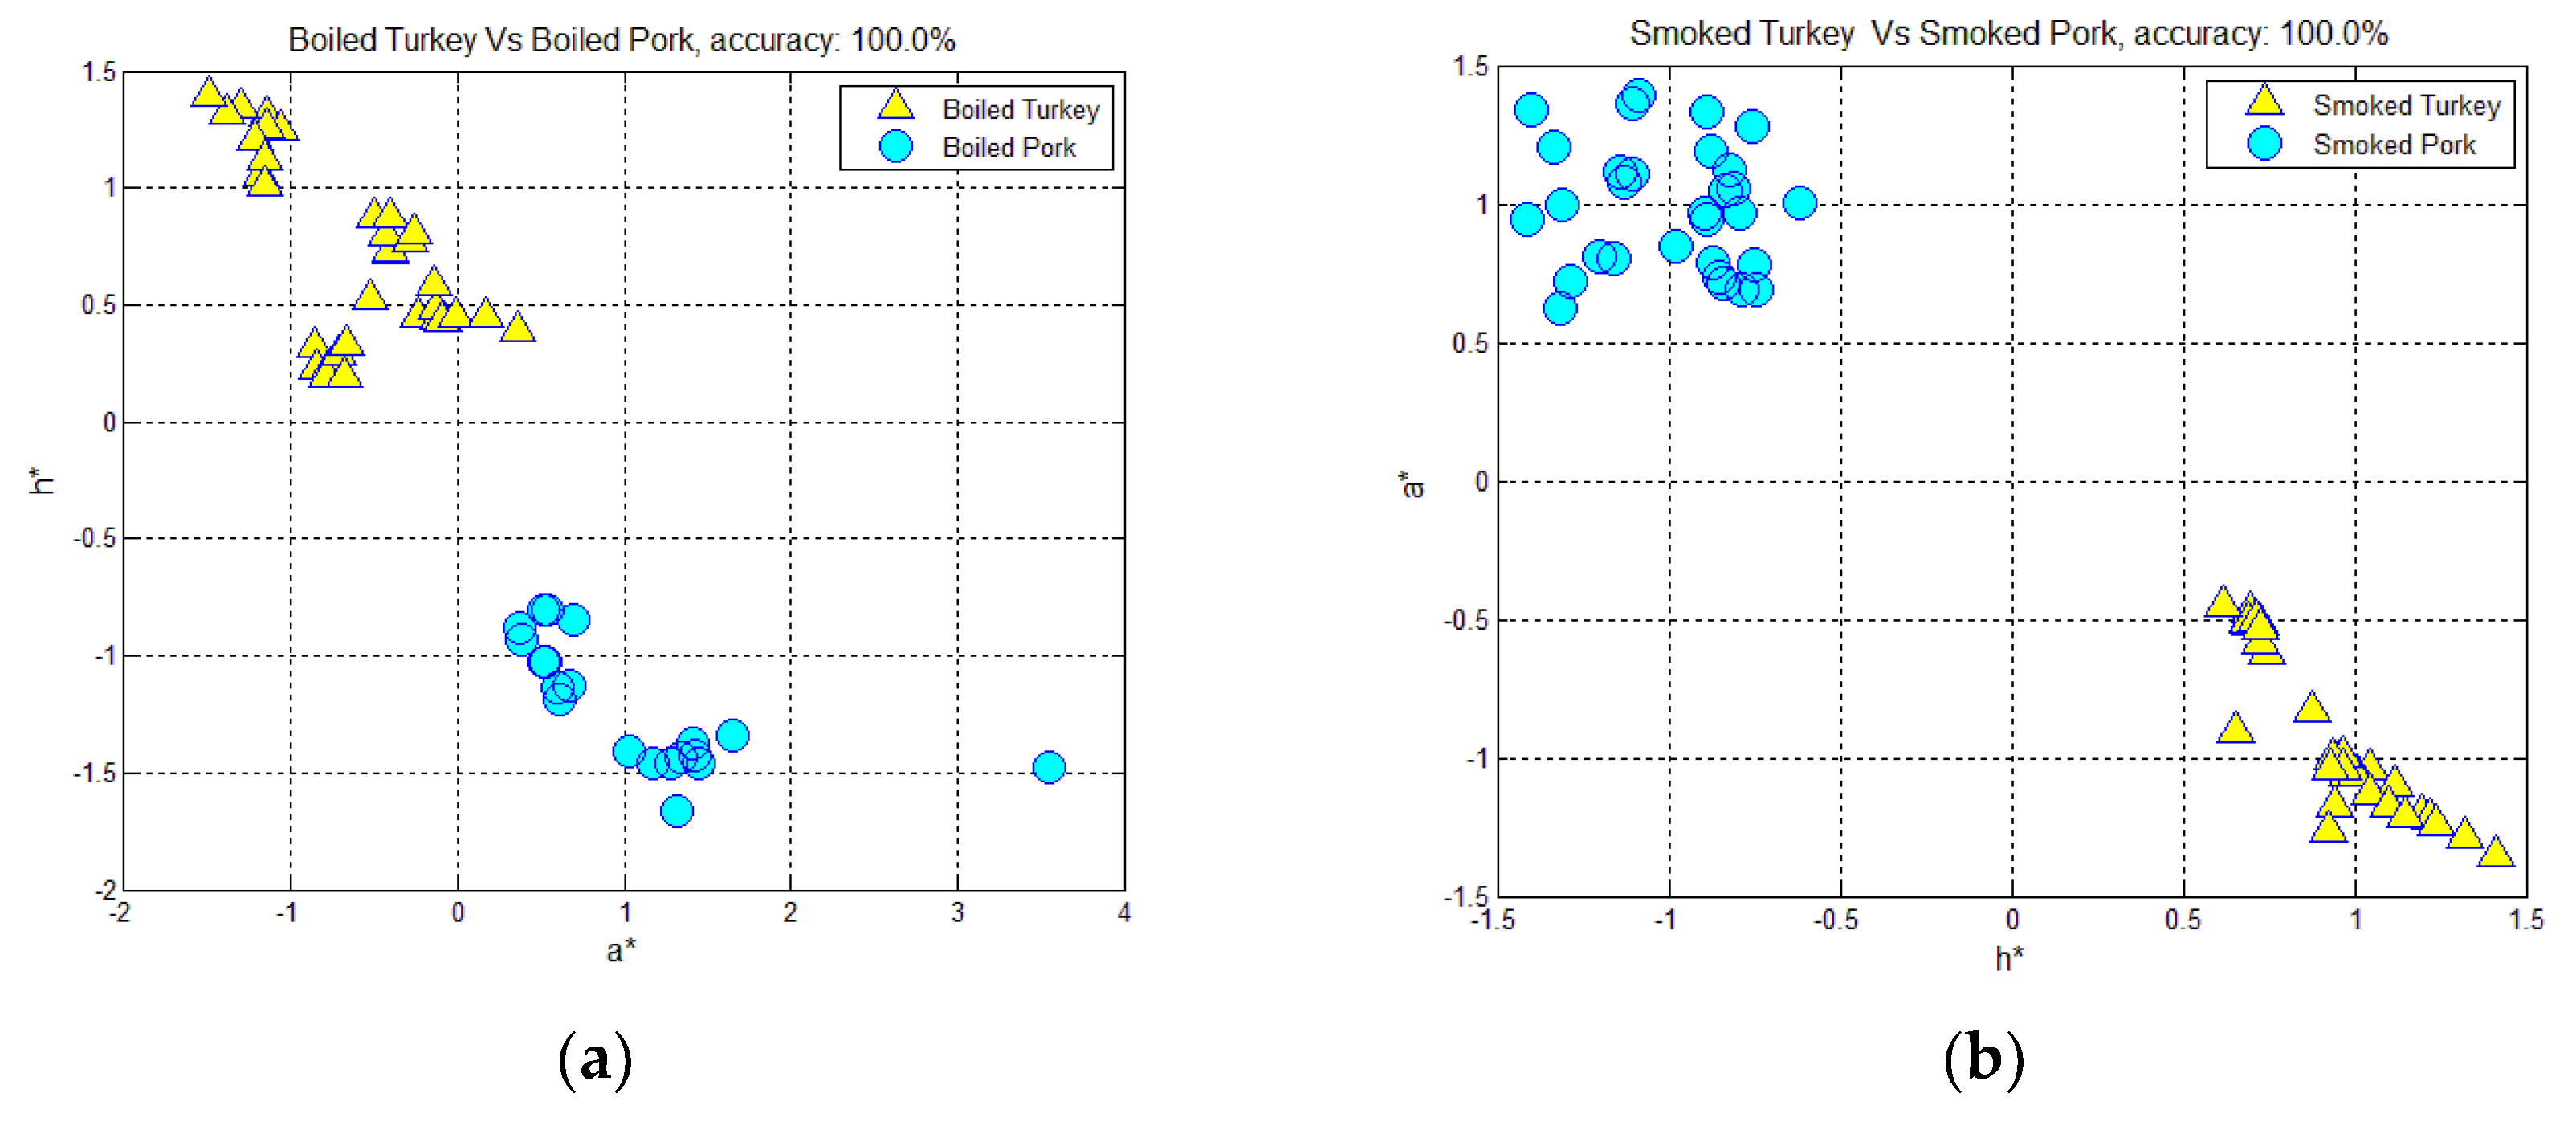
3.1. Classification of Hams According to Meat Type and Processing, Using Color-Measurement, FT-IR Spectra-Interpretation, and Textural-Image Analysis Methods
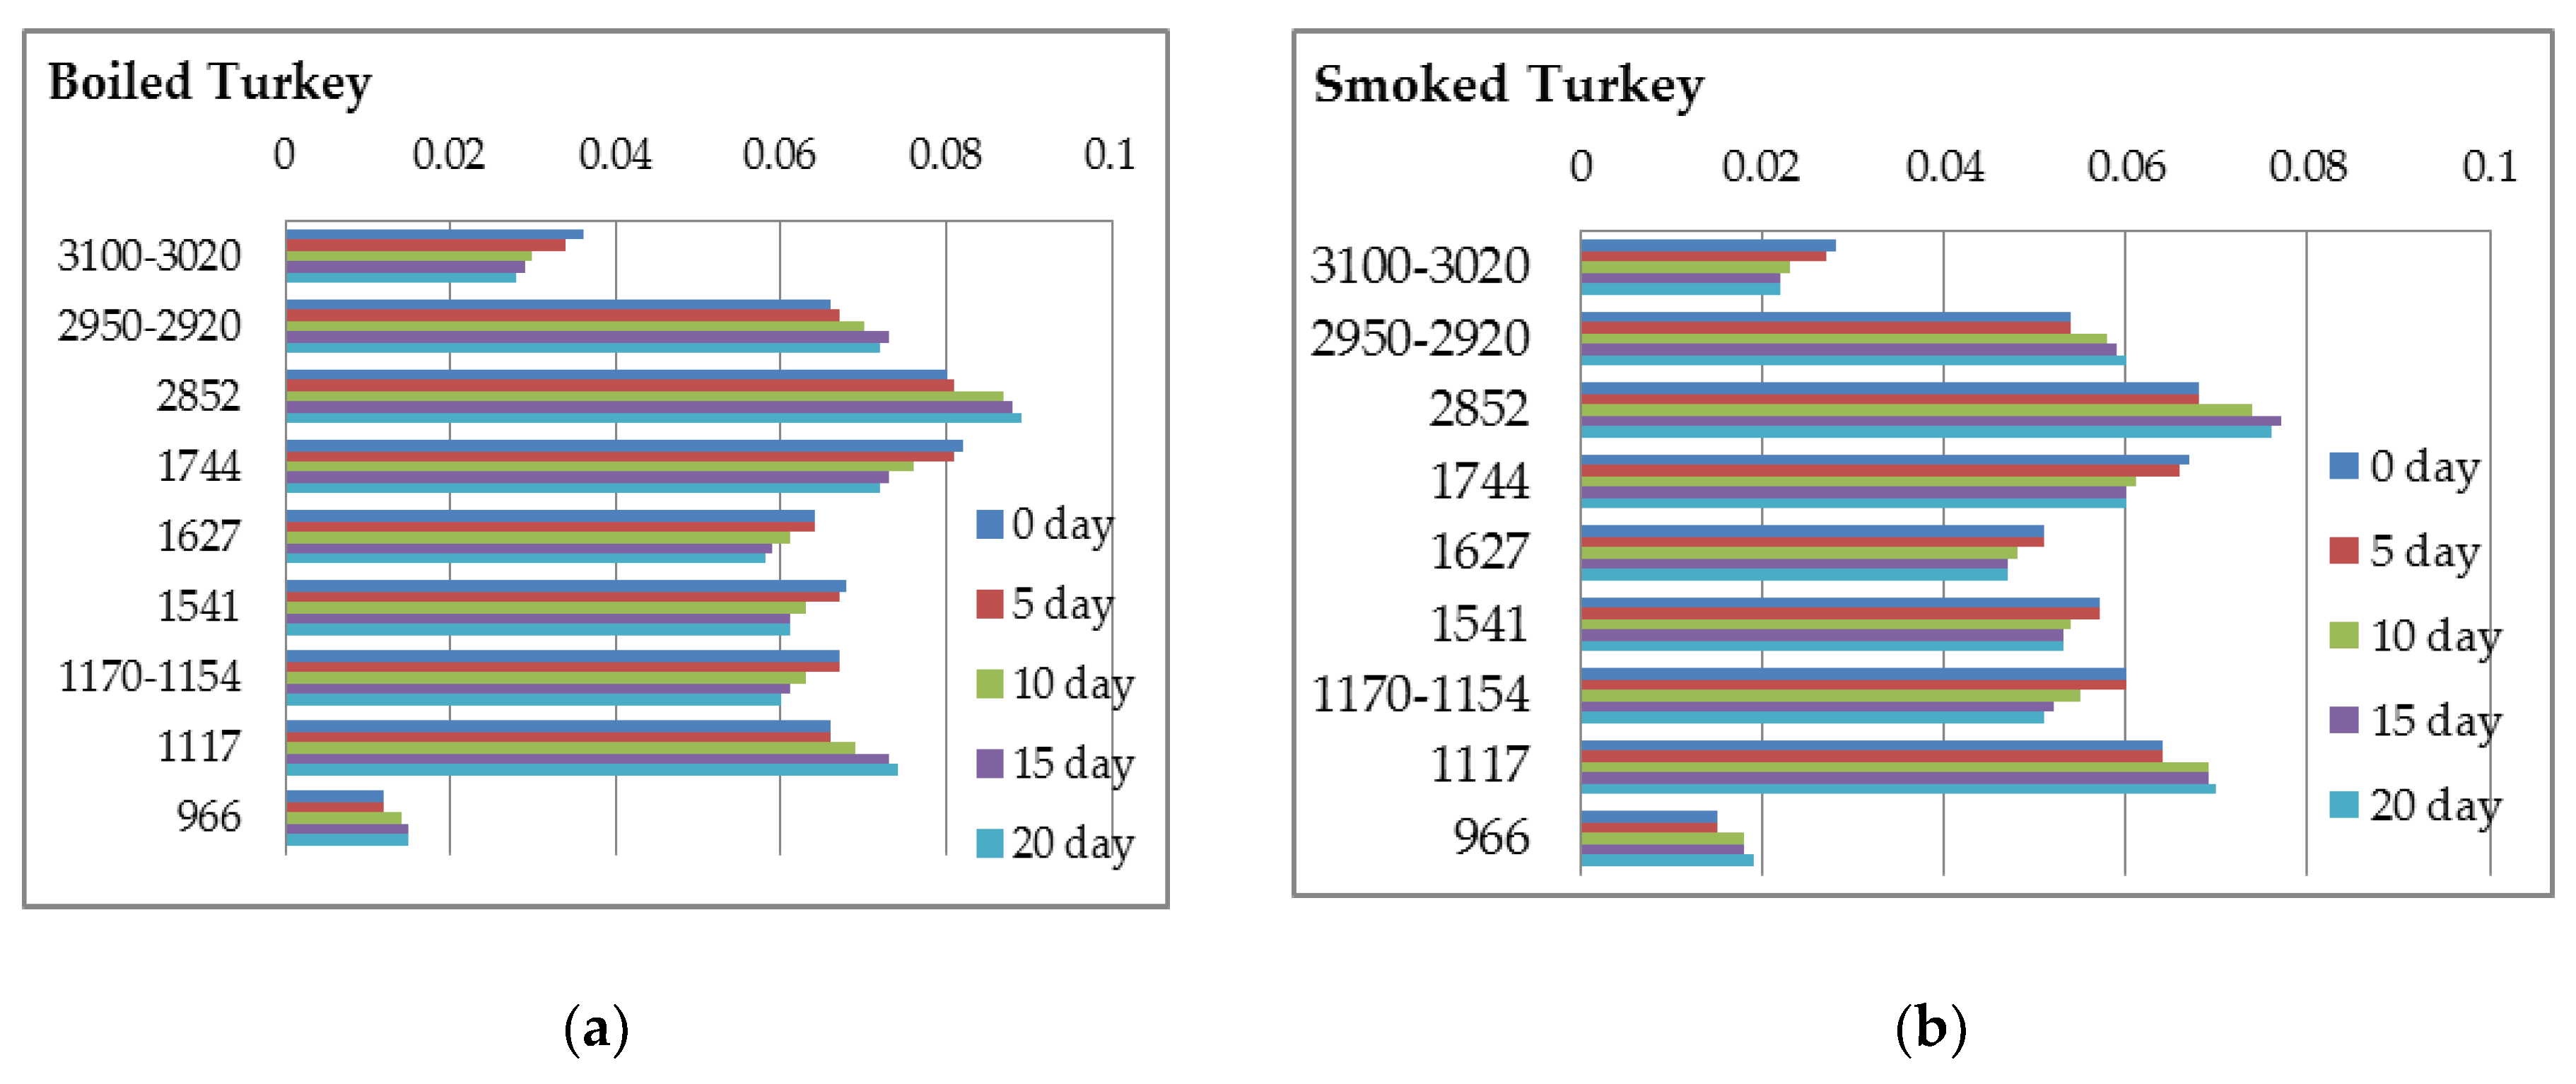
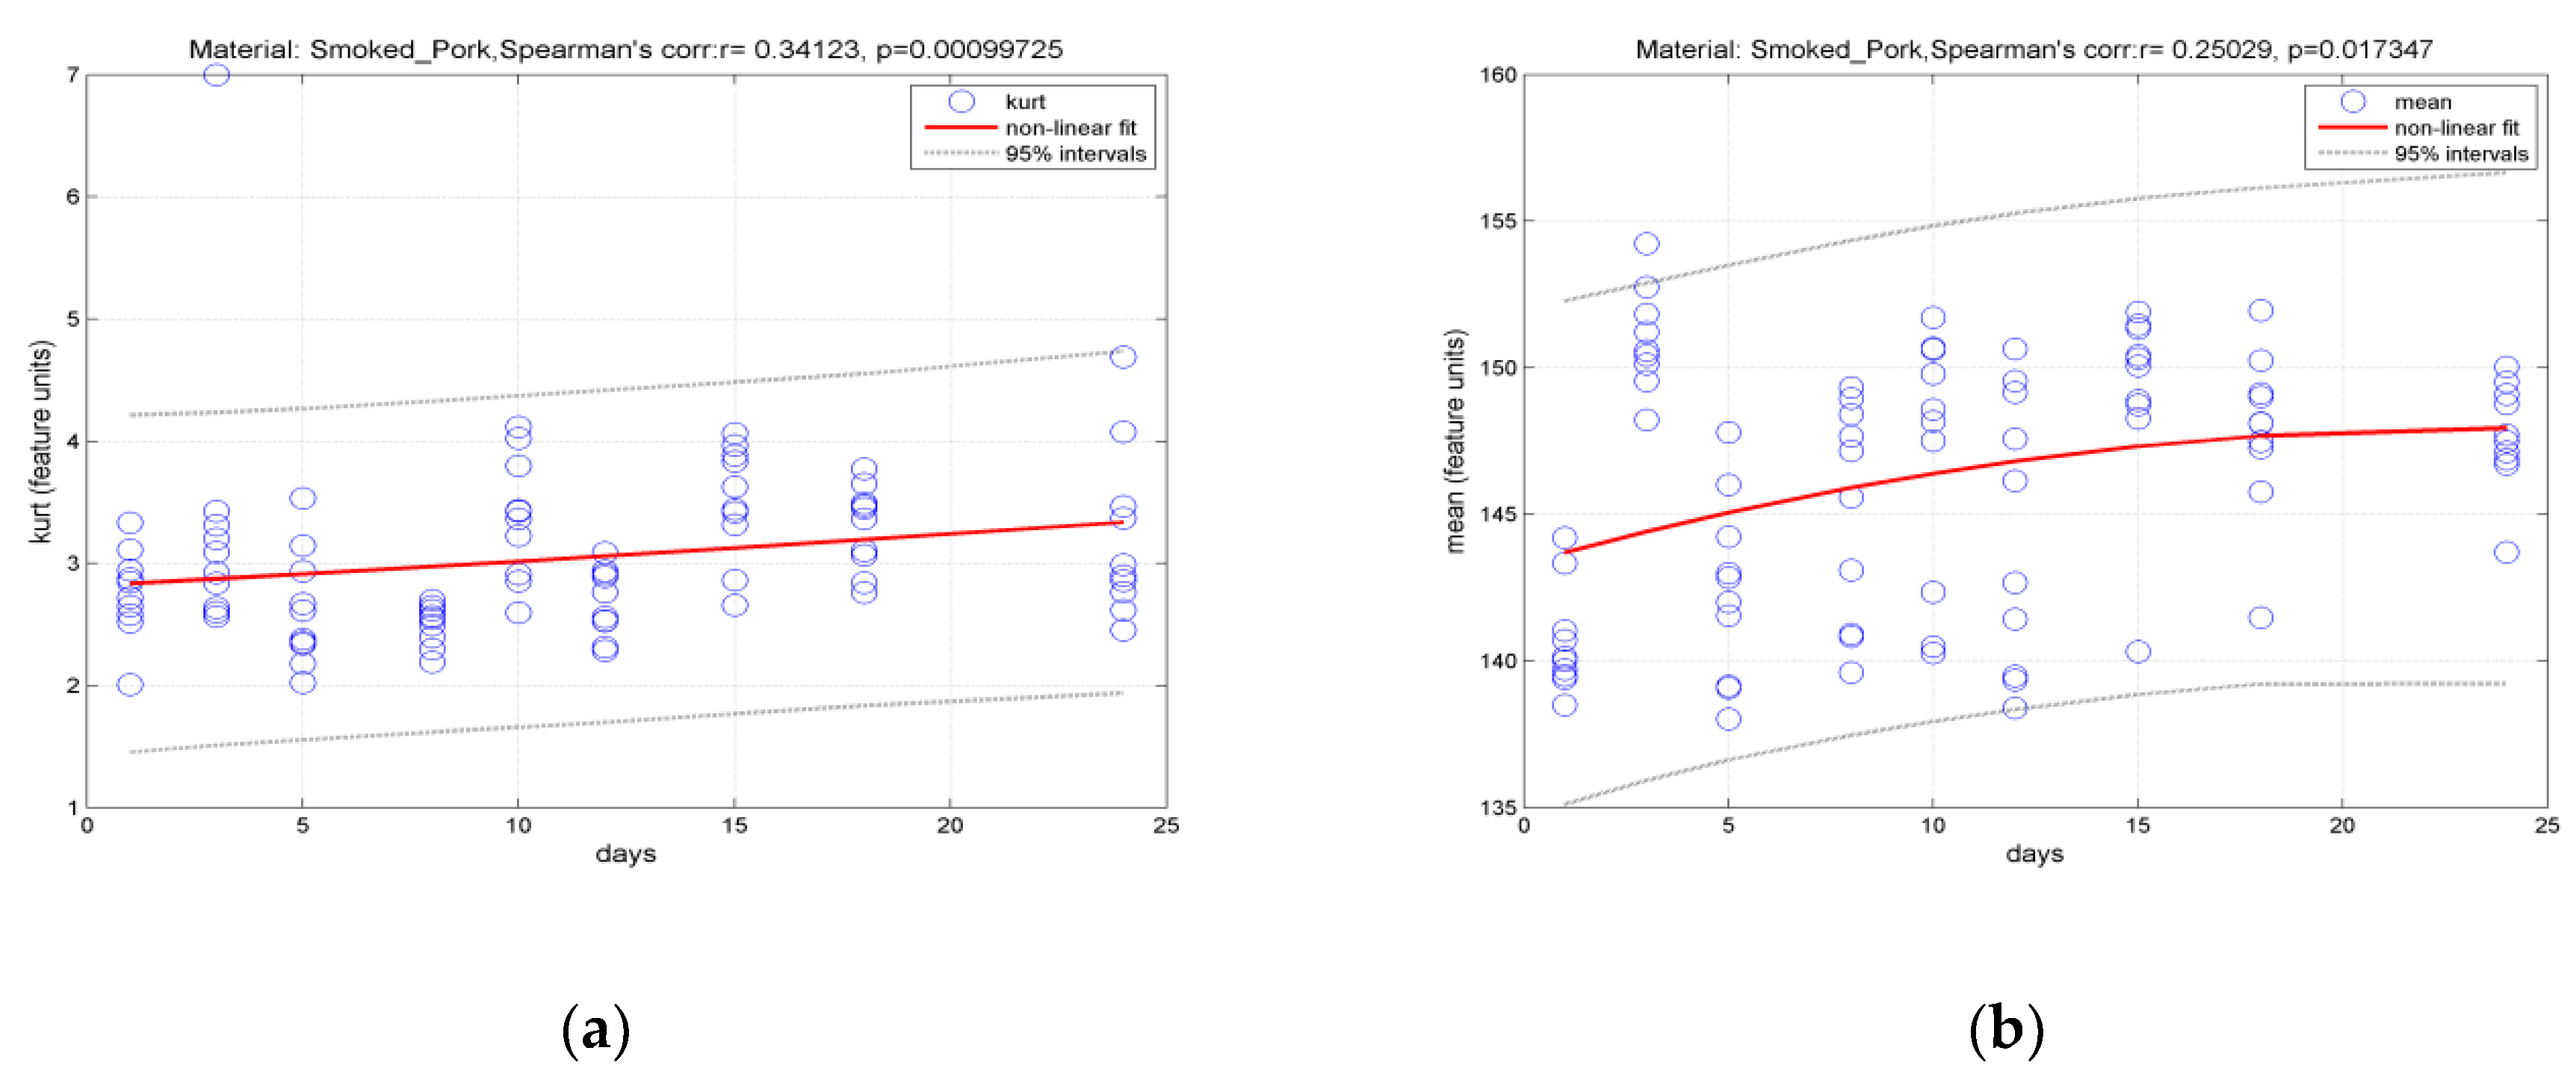
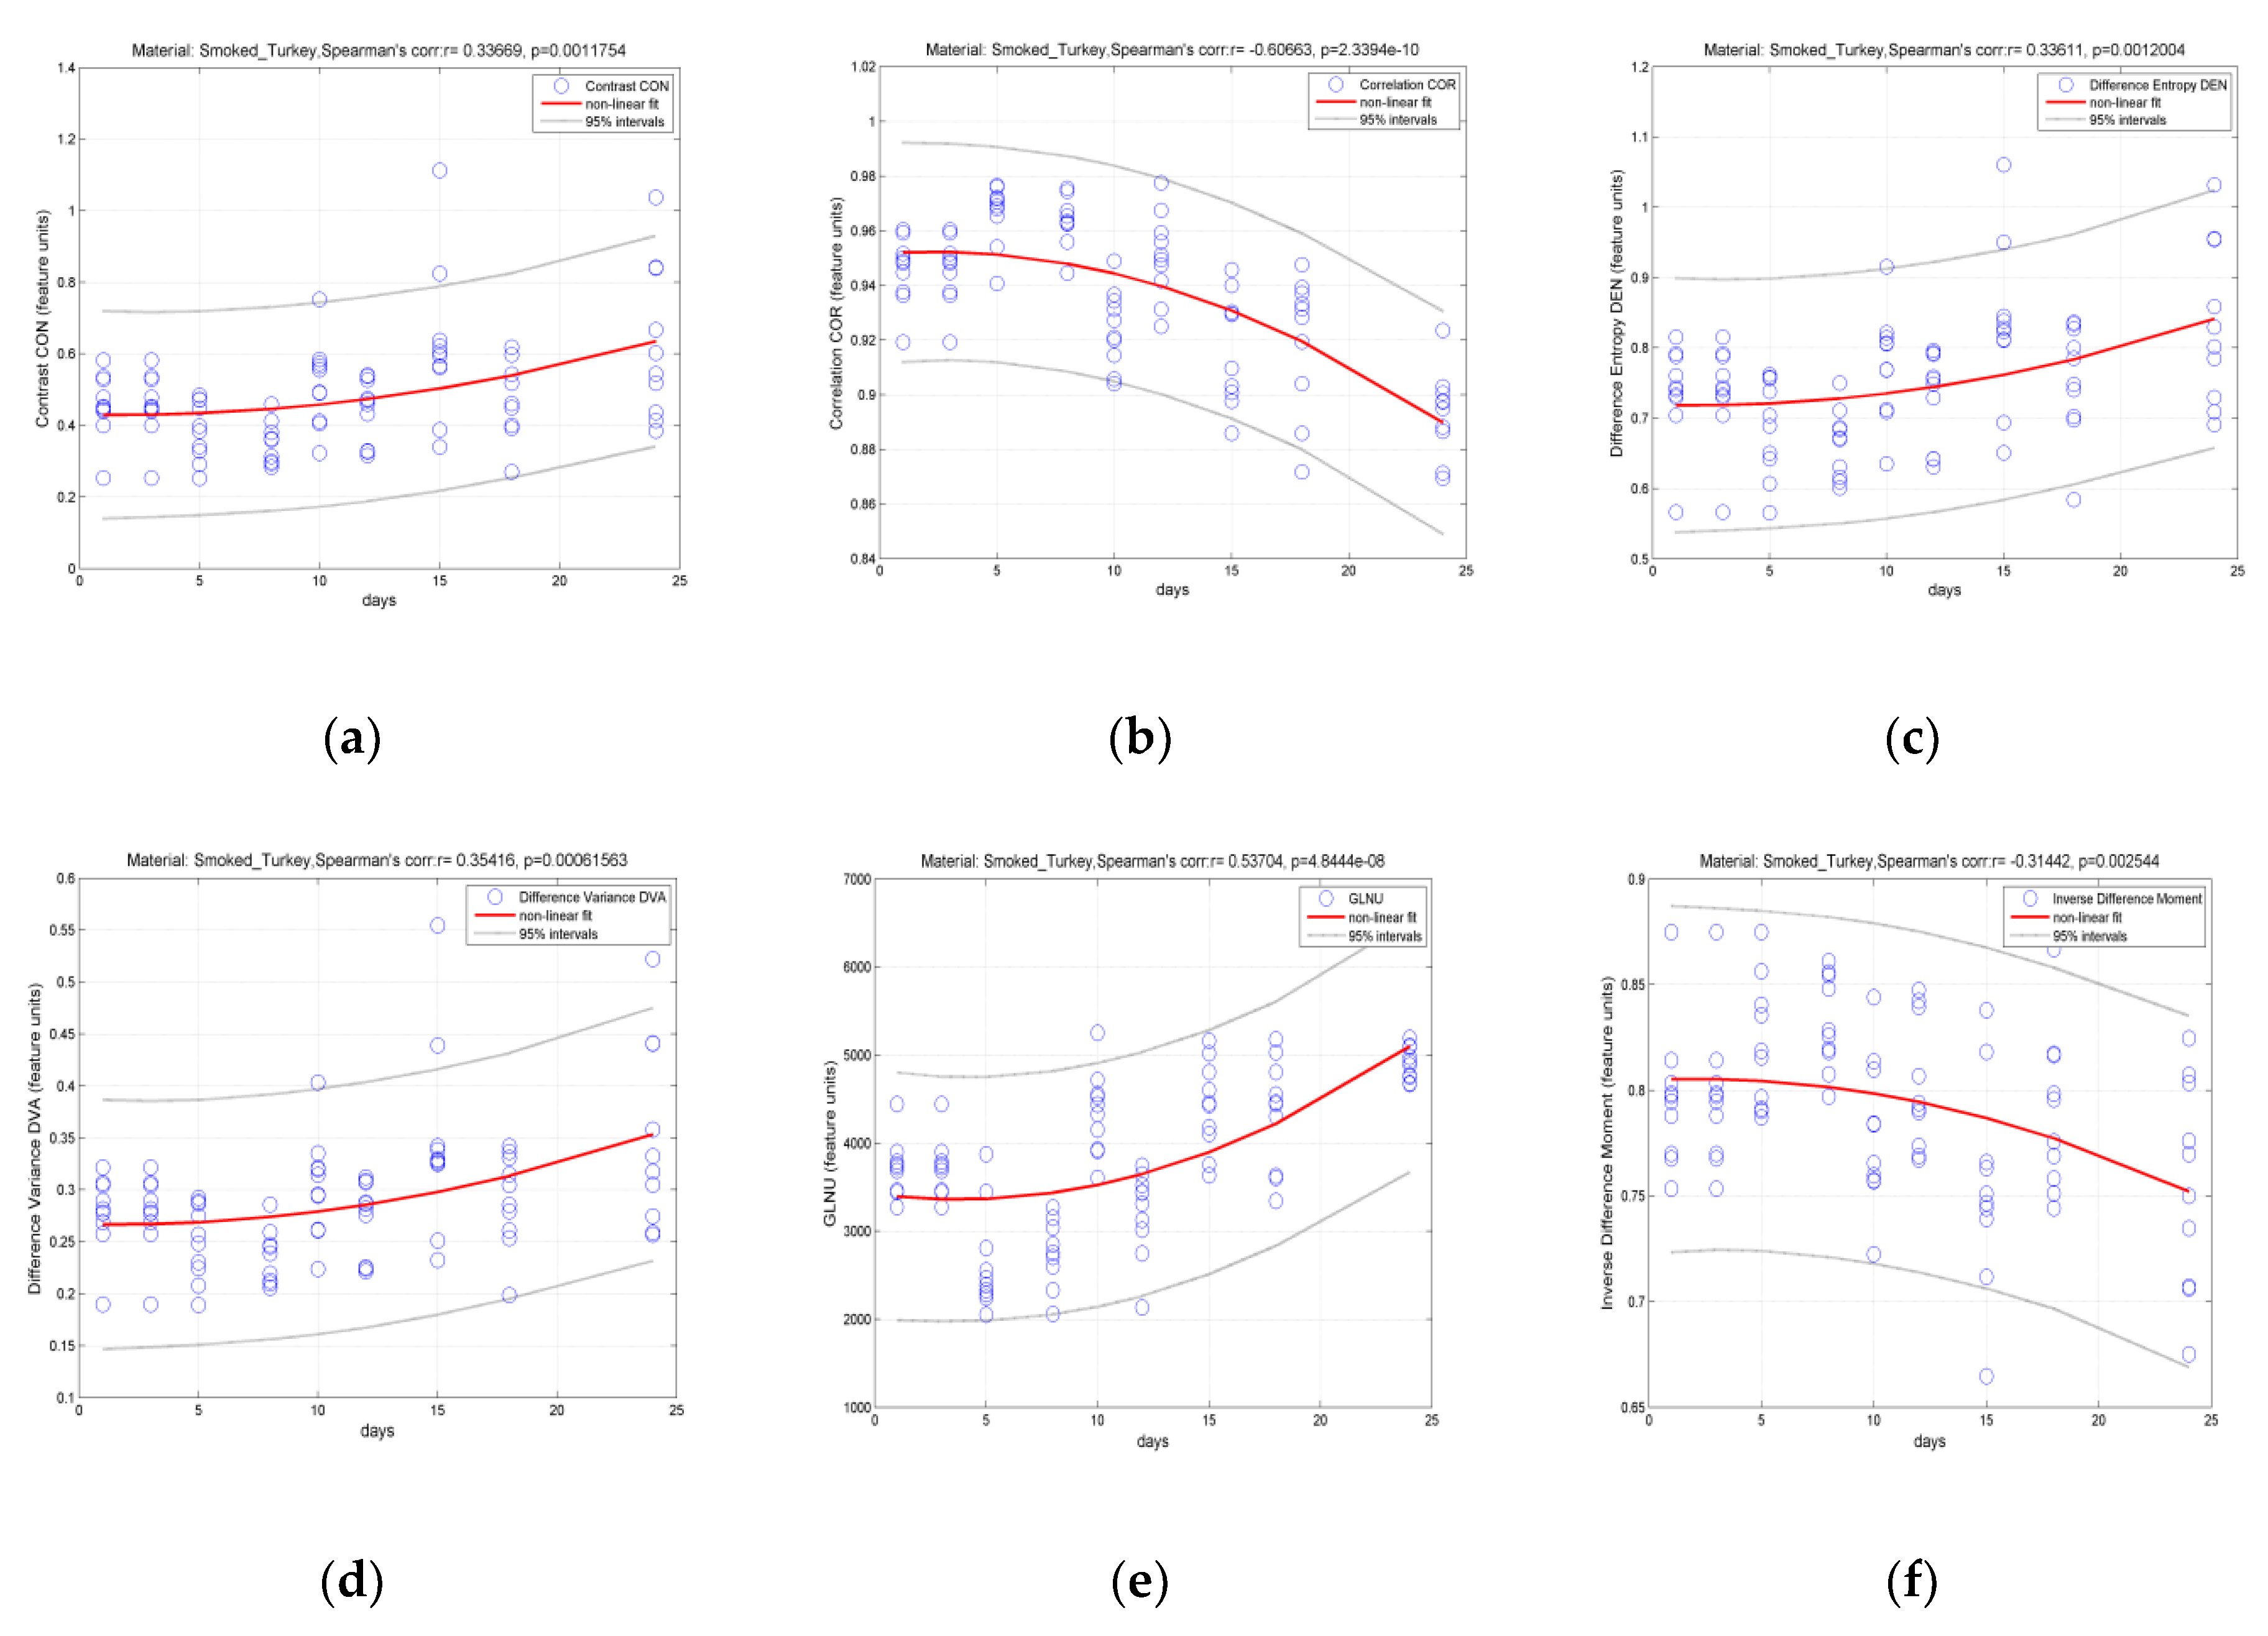
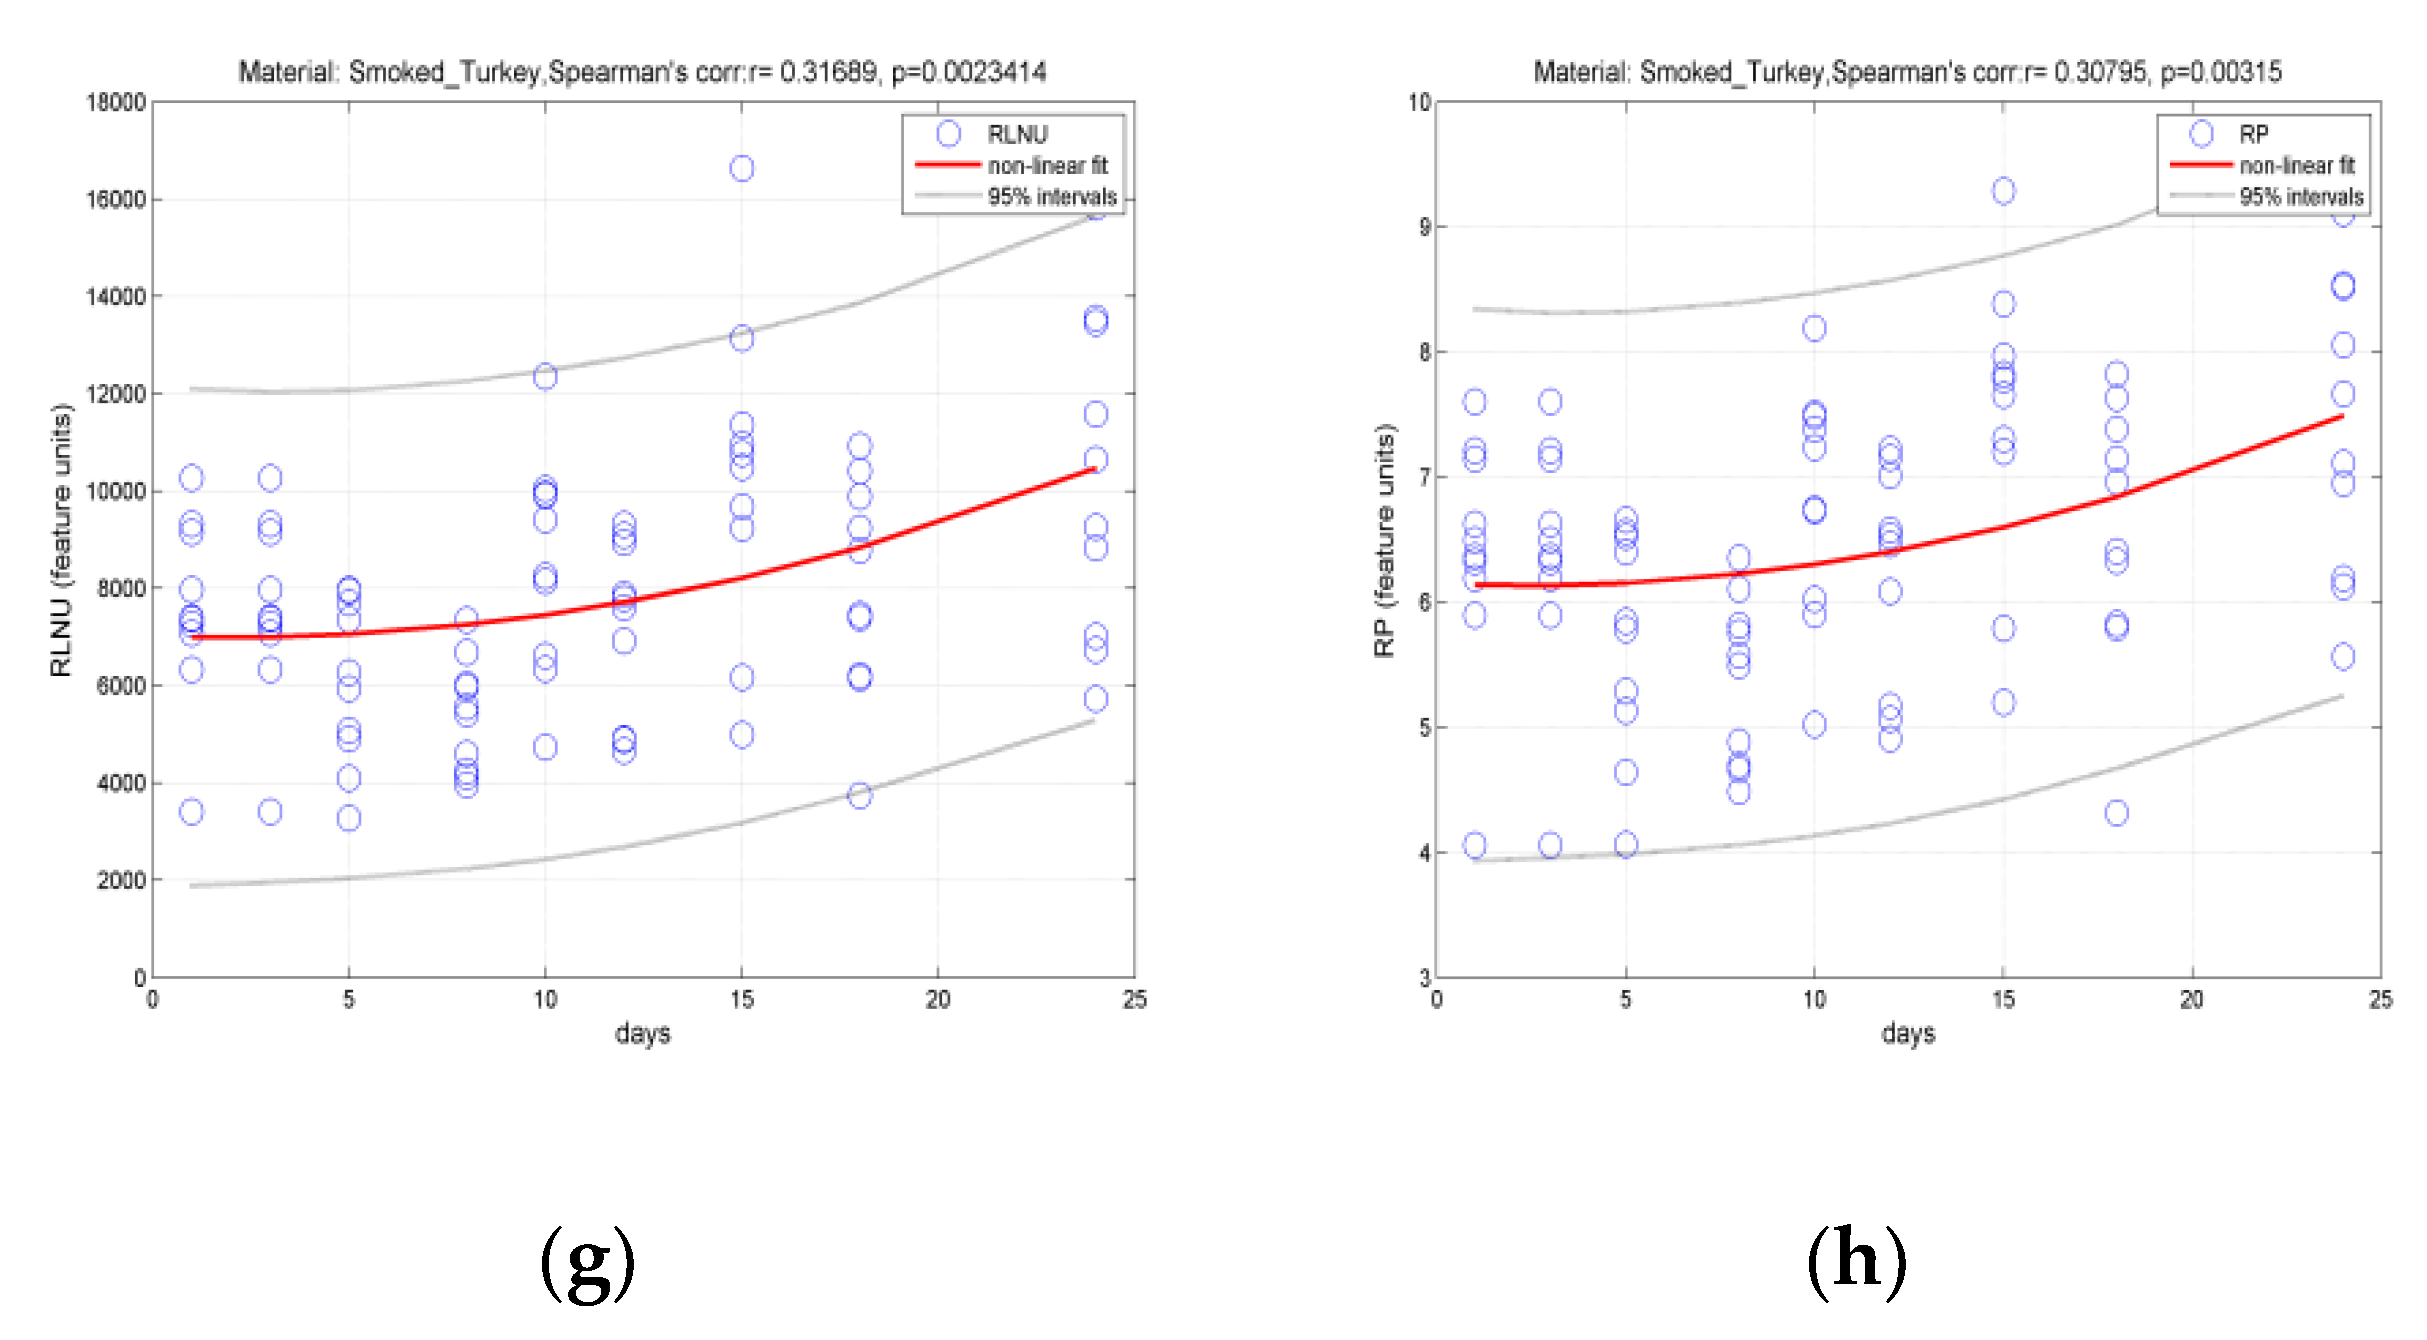
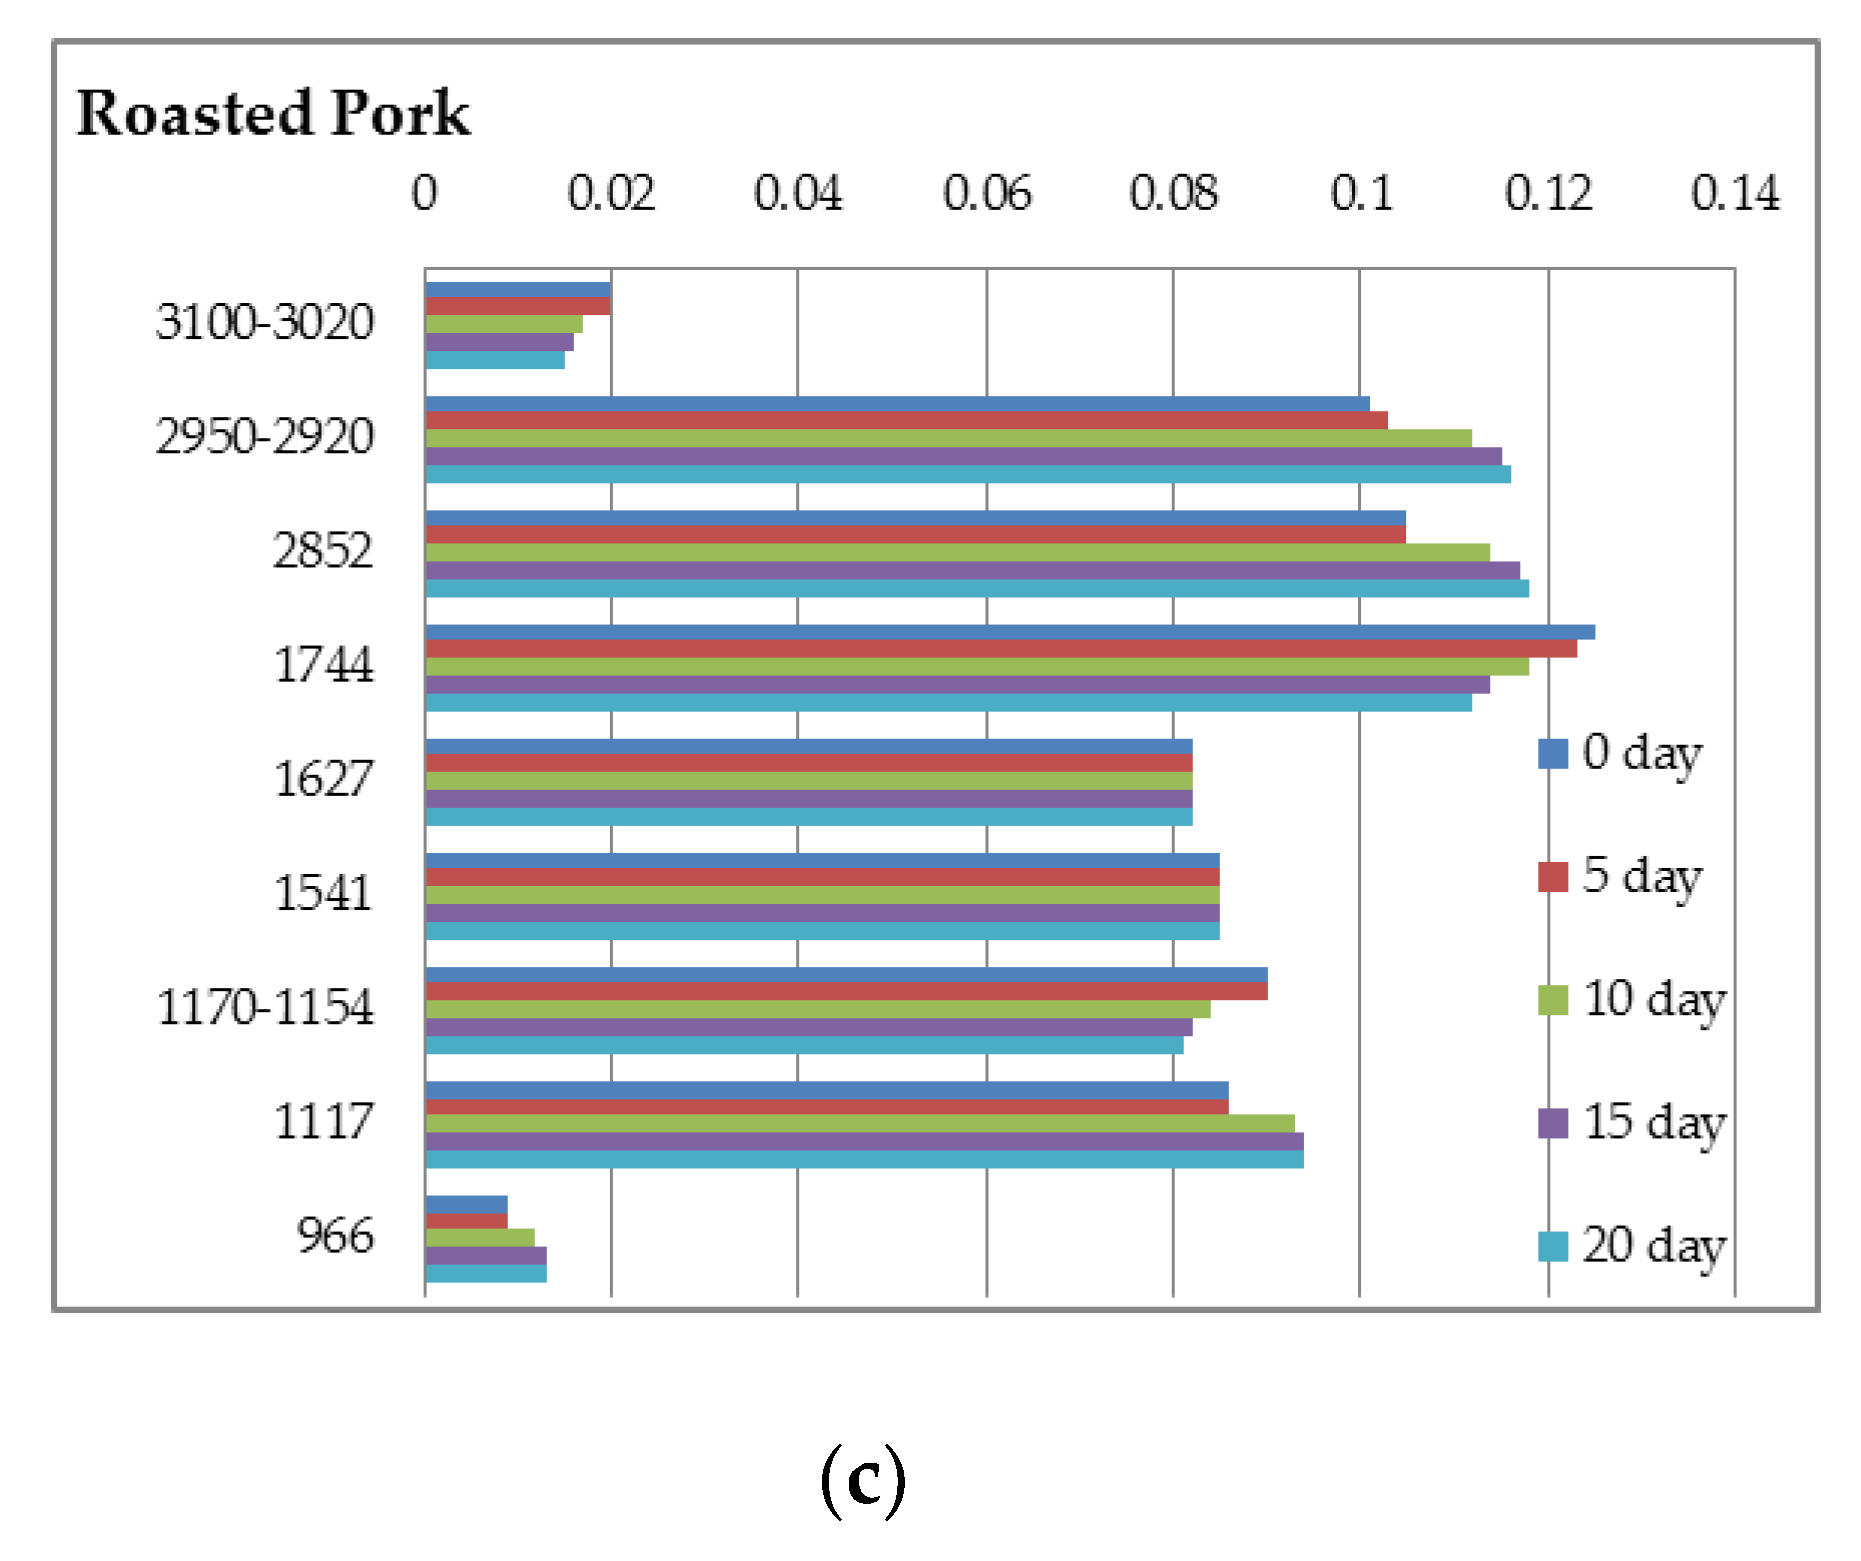
3.2. Classification of Hams According to Shelf Life Using Color Measurement, FT-IR Spectra Interpretation, and Image-Texture Analysis Methods
4. Conclusions
Author Contributions
Funding
Acknowledgments
Conflicts of Interest
Appendix A

| Days | L* | h | a* | b* |
|---|---|---|---|---|
| 0 | 66.76 ± 3.36 a | 60.27 ± 2.24 a | 6.33 ± 0.48 a | 11.18 ± 1.16 a |
| 3 | 64.22 ± 3.30 a | 60.62 ± 2.11 a | 6.32 ± 0,63 a | 10.92 ± 1.32 a |
| 6 | 61.99 ± 1.65 ab | 58.85 ± 1.45 ab | 6.21 ± 0,46 a | 11.06 ± 0.87 a |
| 9 | 58.37 ± 1.28 b | 57.09 ± 1.22 ab | 6.21 ± 0,38 a | 11.88 ± 0.61 ab |
| 12 | 55.95 ± 1.16 b | 56.75 ± 1.03 b | 6.13 ± 0.22 a | 12.75 ± 0.72 ab |
| 15 | 53.55 ± 1.07 c | 56.39 ± 0.68 b | 6.79 ± 0.31 a | 12.98 ± 0.60 b |
| 18 | 52.08 ± 0.73 c | 56.11 ± 1.34 b | 6.94 ± 0.29 a | 13.29 ± 0.57 b |
| 20 | 51.76 ± 0.81 c | 55.76 ± 1.06 b | 7.01 ± 0.36 a | 13.31 ± 0.49 b |
| Days | L* | h | a* | b* |
|---|---|---|---|---|
| 0 | 62.99 ± 3.24 a | 66.08 ± 3.43 a | 4.77 ± 0.82 a | 10.91 ± 0.94 ab |
| 3 | 57.87 ± 1.56 a | 64.39 ± 2.12 a | 5.82 ± 0.67 ab | 10.65 ± 0.54 a |
| 6 | 54.75 ± 1.23 b | 64.34 ± 1.43 a | 5.72 ± 0.61 ab | 10.94 ± 0.68 ab |
| 9 | 54.49 ± 1.17 b | 62.75 ± 1.78 ab | 5.83 ± 0.39 ab | 11.86 ± 0.37 b |
| 12 | 54.34 ± 1.31 b | 62.73 ± 1.23 ab | 5.99 ± 0.44 ab | 12.75 ± 0.66 bc |
| 15 | 50.23 ± 1.06 c | 61.28 ± 0.56 b | 6.21 ± 0.26 b | 13.16 ± 0.58 c |
| 18 | 49.47 ± 0.82 c | 61.33 ± 0.45 b | 6.29 ± 0.29 b | 13.25 ± 0.41 c |
| 20 | 49.12 ± 1.28 c | 61.23 ± 0.71 b | 6.24 ± 0.32 b | 13.38 ± 0.52 c |
| Days | L* | h | a* | b* |
|---|---|---|---|---|
| 0 | 54.41 ± 3.31 a | 36.66 ± 3.30 a | 12.08 ± 0.89 a | 7.74 ± 0.42 a |
| 3 | 52.11 ± 1.34 a | 36.54 ± 2.79 a | 11.84 ± 0.59 a | 7.98 ± 0.51 a |
| 6 | 51.38 ± 1.13 a | 38.72 ± 1.75 a | 11.04 ± 0.28 a | 7.55 ± 0.61 a |
| 9 | 50.82 ± 1.08 a | 38.99 ± 1.58 a | 10.65 ± 0.75 ab | 7.92 ± 0.48 a |
| 12 | 48.81 ± 0.76 b | 39.11 ± 1.23 a | 10.65 ± 0.10 ab | 8.86 ± 0.33 b |
| 15 | 48.31 ± 0.85 b | 41.52 ± 1.02 b | 10.34 ± 0.28 b | 9.39 ± 0.71 b |
| 18 | 46.56 ± 0.68 c | 44.85 ± 1.31 c | 10.14 ± 0.19 b | 10.67 ± 0.64 c |
| 20 | 46.12 ± 0.89 c | 44.81 ± 0.69 c | 10.18 ± 0.22 b | 10.69 ± 0.46 c |
| Days | L* | h | a* | b* |
|---|---|---|---|---|
| 0 | 56.51 ± 4.48 a | 34.76 ± 3.66 a | 11.98 ± 0.85 a | 8.33 ± 1.08 a |
| 3 | 51.86 ± 2.47 ab | 34.57 ± 2.35 a | 11.03 ± 0.78 ab | 8.21 ± 0.78 a |
| 6 | 49.02 ± 1.54 b | 35.31 ± 2.01 a | 10.92 ± 0.66 ab | 8.85 ± 0.91 a |
| 9 | 48.64 ± 1.28 b | 39.31 ± 1.69 b | 10.82 ± 0.37 ab | 8.99 ± 0.76 a |
| 12 | 48.08 ± 1.72 b | 42.62 ± 1.32 c | 10.69 ± 0.65 ab | 9.38 ± 0.59 a |
| 15 | 47.97 ± 1.61 b | 44.27 ± 1.28 c | 10.11 ± 0.51 bc | 9.89 ± 0.80 ab |
| 18 | 42.94 ± 1.17 c | 47.34 ± 0.85 d | 9.47 ± 0.29 c | 10.85 ± 0.63 b |
| 20 | 42.97 ± 0.78 c | 47.31 ± 0.74 d | 9.49 ± 0.42 c | 10.95 ± 0.71 b |


References
- Iqbal, A.; Valous, N.A.; Mendoza, F.; Sun, D.-W.; Allen, P. Classification of pre-sliced pork and Turkey ham qualities based on image colour and textural features and their relationships with consumer responses. Meat Sci. 2010, 84, 455–465. [Google Scholar] [CrossRef] [PubMed]
- Mendoza, F.; Valous, N.A.; Allen, P.; Kenny, T.A.; Ward, P.; Sun, D.W. Analysis and classification of commercial ham slice images using directional fractal dimension features. Meat Sci. 2009, 81, 313–320. [Google Scholar] [CrossRef] [PubMed]
- Toldra, F.; Mora, L.; Flores, M. Cooked ham. In Handbook of Meat Processing; Toldrá, F., Ed.; A John Wiley and Sons, Inc.: New York, NY, USA, 2010; pp. 299–311. ISBN 9780813820897. [Google Scholar]
- Heinz, G.; Hautzinger, P. Meat Processing Technology. For Small- To Medium-Scale Producers; FAO: Rome, Italy, 2007; ISBN 978-974-7946-99-4. [Google Scholar]
- Zapotoczny, P.; Szczypiński, P.M.; Daszkiewicz, T. Evaluation of the quality of cold meats by computer-assisted image analysis. LWT-Food Sci. Technol. 2016, 67, 37–49. [Google Scholar] [CrossRef]
- Gajewska-Szczerbal, H.; Krzywdzinska-Bartkowiak, M.; Korbik, T. Analysis of changes of the histological structure of ham muscles as affected by curing and thermal treatment. Pol. J. Food Nutr. Sci. 2007, 57, 227–232. [Google Scholar]
- Jackman, P.; Sun, D.-W.; Allen, P. Recent advances in the use of computer vision technology in the quality assessment of fresh meats. Trends Food Sci. Technol. 2011, 22, 185–197. [Google Scholar] [CrossRef]
- Feiner, G. Colour in fresh meat and in cured meat products. In Meat Products Handbook: Practical Science and Technology; Woodhead Publishing Ltd.: Cambridge, England, 2006; pp. 142–156. [Google Scholar]
- Meza-Márquez, O.G.; Gallardo-Velázquez, T.; Osorio-Revilla, G. Application of mid-infrared spectroscopy with multivariate analysis and soft independent modeling of class analogies (SIMCA) for the detection of adulterants in minced beef. Meat Sci. 2010, 86, 511–519. [Google Scholar] [CrossRef] [PubMed]
- Rohman, A.; Erwanto, Y.; Man, Y.B.C. Analysis of pork adulteration in beef meatball using Fourier transform infrared (FTIR) spectroscopy. Meat Sci. 2011, 88, 91–95. [Google Scholar] [CrossRef] [PubMed]
- Lamyaa, M.A. Discrimination of pork content in mixtures with raw minced camel and buffalo meat using FTIR spectroscopic technique. Int. Food Res. J. 2013, 20, 1389–1394. [Google Scholar]
- Tenyang, N.; Womeni, H.M.; Tiencheu, B.; Villeneuve, P.; Linder, M. Effect of refrigeration time on the lipid oxidation and fatty acid profiles of catfish (Arius maculatus) commercialized in Cameroon. Grasas y Aceites 2017, 68, 1–9. [Google Scholar] [CrossRef]
- Konstandinou, C.; Glotsos, D.; Kostopoulos, S.; Kalatzis, I.; Ravazoula, P.; Michail, G.; Lavdas, E.; Cavouras, D.; Sakellaropoulos, G. Multifeature quantification of nuclear properties from images of H and E-stained biopsy material for investigating changes in nuclear structure with advancing CIN grade. J. Healthc. Eng. 2018, 2018, 1–11. [Google Scholar] [CrossRef] [PubMed]
- Specht, D.F. Probabilistic neural networks. Neural Netw. 1990, 3, 109–118. [Google Scholar] [CrossRef]
- Leon, K.; Mery, D.; Pedreschi, F.; Leon, J. Color measurement in L* a* b* units from RGB digital images. Food Res. Int. 2006, 39, 1084–1091. [Google Scholar] [CrossRef]
- Dvorak, P.; Musilova, H.; Svarcova, I. On-line measurements of colour of pork. Fleischwirtschaft 2001, 81, 89–91. [Google Scholar]
- Garcίa-Esteban, M.; Ansorena, D.; Gimeno, O.; Astiasarán, I. Optimization of instrumental colour analysis in dry-cured ham. Meat Sci. 2003, 63, 287–292. [Google Scholar] [CrossRef]
- Haralick, R. Statistical and structural approaches to texture. Proc. IEEE 1979, 67, 786–804. [Google Scholar] [CrossRef]
- Guillen, M.D.; Cabo, N. Characterization of edible oils and lard by Fourier transform infrared spectroscopy. Relationships between composition and frequency of concrete bands in the fingerprint region. J. Am. Oil Chem. Soc. 1997, 74, 1281–1286. [Google Scholar] [CrossRef]
- Man, Y.C.; Mirghani, M.E.S. Detection of lard mixed with body fats of chicken, lamb and cow by fourier transform infrared spectroscopy. J. Am. Oil Chem. Soc. 2001, 78, 753–761. [Google Scholar] [CrossRef]
- Yu, P. Protein secondary structures (α-helix and β-sheet) at a cellular level and protein fractions in relation to rumen degradation behaviors of protein: A new approach. Br. J. Nutr. 2005, 94, 655–665. [Google Scholar] [CrossRef] [PubMed]
- Guntarti, A.; Martono, S.; Yuswanto, A.; Rohman, A. FTIR spectroscopy in combination with chemometrics for analysis of wild boar meat in meatball formulation. Asian J. Biochem. 2015, 10, 165–172. [Google Scholar]
- Wong, P.T.; Papavassiliou, E.D.; Rigas, B. Phosphodiesters stretching bands in the infrared spectra of human tissues and culture cells. Appl. Spectrosc. 1991, 45, 1563–1567. [Google Scholar] [CrossRef]
- Liu, X.; Kokare, C. Microbial enzymes of use in industry. In Biotechnology of Microbial Enzymes, 1st ed.; Brahmachari, G., Ed.; Elsevier: New York, NY, USA, 2016; pp. 267–298. ISBN 9780128037461. [Google Scholar]
- Marina, A.M.; Rosli, W.I.; Noorhidayah, M. Quantitative analysis of peroxide value in virgin coconut oil by ATRFTIR spectroscopy. Open Conf. Proc. J. 2013, 4, 53–56. [Google Scholar] [CrossRef]
- Leygonie, C.; Britz, T.J.; Hoffman, L.C. Impact of freezing and thawing on the quality of meat: Review. Meat Sci. 2012, 91, 93–98. [Google Scholar] [CrossRef]


| Turkey Boiled | Turkey Smoked | Pork Boiled | Pork Smoked | Pork Roasted | |
|---|---|---|---|---|---|
| L* | 66.76 ± 3.36 a | 62.99 ± 3.24 b | 54.41 ± 3.31 c | 56.51 ± 4.48 c | 58.20 ± 1.33 c |
| C* | 12.78 ± 1.80 ab | 11.92 ± 1.29 a | 13.02 ± 0.98 b | 14.67 ± 1.09 b | 17.42 ± 0.57 c |
| h | 60.27 ± 2.24 a | 66.08 ± 3.43 b | 36.66 ± 3.30 c | 34.76 ± 3.66 c | 35.85 ± 1.46 c |
| ΔE* | 45.59 ± 4.40 a | 41.63 ± 2.99 b | 34.88 ± 2.75 c | 37.76 ± 3.89 c | 40.03 ± 1.31 b |
| a* | 6.33 ± 0.48 a | 4.77 ± 0.82 b | 12.08 ± 0.89 c | 11.98 ± 0.85 c | 14.11 ± 0.44 d |
| b* | 11.12 ± 1.16 a | 10.91 ± 0.94 a | 7.74 ± 0.42 b | 8.33 ± 1.08 b | 10.19 ± 0.58 a |
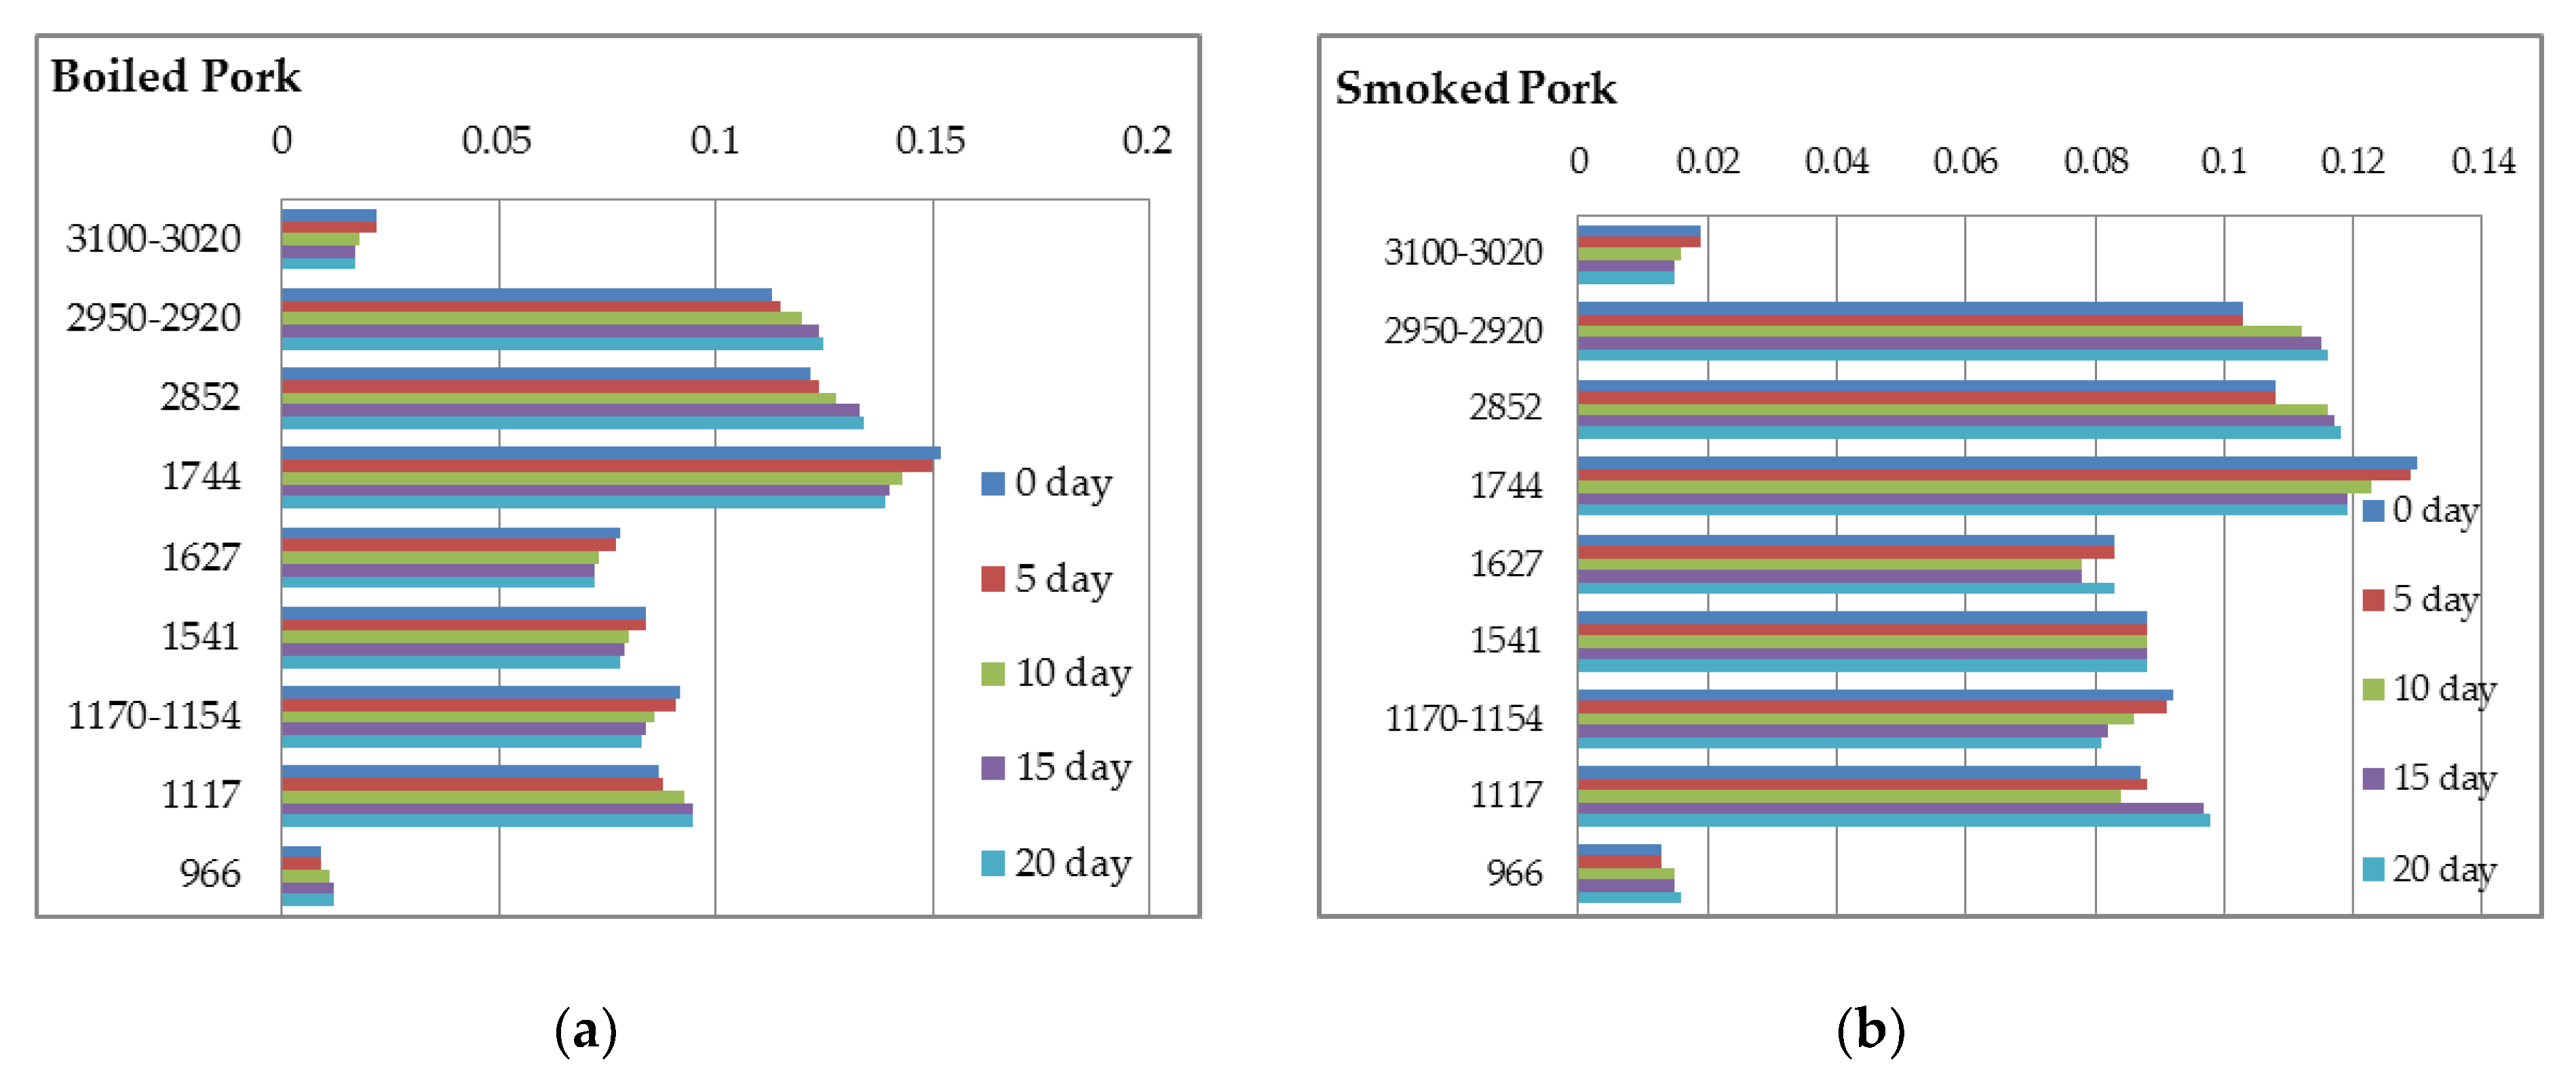
| Regions | Turkey Boiled | Turkey Smoked | Pork Boiled | Pork Smoked | Pork Roasted |
|---|---|---|---|---|---|
| 3500–3200 | 0.094 ± 0.002 a | 0.087 ± 0.003 b | 0.107 ± 0.002 c | 0.110 ± 0.004 c | 0.105 ± 0.003 c |
| 3100–3020 | 0.036 ± 0.002 a | 0.028 ± 0.003 b | 0.022 ± 0.002 c | 0.019 ± 0.002 c | 0.020 ± 0.002 c |
| 2950–2920 | 0.066 ± 0.002 a | 0.054 ± 0.001 b | 0.113 ± 0.004 c | 0.103 ± 0.002 d | 0.101 ± 0.002 d |
| 2852 | 0.080 ± 0.002 a | 0.068 ± 0.001 b | 0.122 ± 0.002 c | 0.108 ± 0.003 d | 0.105 ± 0.001 d |
| 1744 | 0.082 ± 0.003 a | 0.067 ± 0.003 b | 0.152 ± 0.004 c | 0.130 ± 0.003 d | 0.125 ± 0.002 d |
| 1627 | 0.064 ± 0.002 a | 0.051 ± 0.002 b | 0.078 ± 0.003 c | 0.083 ± 0.002 c | 0.082 ± 0.003 c |
| 1541 | 0.068 ± 0.003 a | 0.057 ± 0.001 b | 0.084 ± 0.004 c | 0.088 ± 0.002 c | 0.085 ± 0.005 c |
| 1450 | 0.077 ± 0.004 a | 0.064 ± 0.002 b | 0.098 ± 0.005 c | 0.099 ± 0.002 c | 0.097 ± 0.002 c |
| 1395 | 0.078 ± 0.001 a | 0.069 ± 0.003 b | 0.094 ± 0.003 c | 0.096 ± 0.003 c | 0.096 ± 0.002 c |
| 1240 | 0.056 ± 0.002 a | 0.051 ± 0.002 b | 0.096 ± 0.003 c | 0.092 ± 0.004 c | 0.091 ± 0.004 c |
| 1170–1154 | 0.067 ± 0.002 a | 0.060 ± 0.002 b | 0.092 ± 0.003 c | 0.092 ± 0.001 c | 0.090 ± 0.004 c |
| 1117 | 0.066 ± 0.003 a | 0.064 ± 0.001 a | 0.087 ± 0.002 b | 0.087 ± 0.004 b | 0.086 ± 0.002 b |
| 1040–1020 | 0.082 ± 0.001 a | 0.080 ± 0.001 a | 0.068 ± 0.001 b | 0.065 ± 0.003 b | 0.066 ± 0.003 b |
| 966 | 0.012 ± 0.001 a | 0.015 ± 0.001 b | 0.009 ± 0.001 c | 0.013 ± 0.001 ab | 0.009 ± 0.001 c |
| 870 | 0.032 ± 0.002 a | 0.031 ± 0.001 a | 0.048 ± 0.002 b | 0.049 ± 0.001 b | 0.049 ± 0.002 b |
© 2018 by the authors. Licensee MDPI, Basel, Switzerland. This article is an open access article distributed under the terms and conditions of the Creative Commons Attribution (CC BY) license (http://creativecommons.org/licenses/by/4.0/).
Share and Cite
Sinanoglou, V.J.; Cavouras, D.; Xenogiannopoulos, D.; Proestos, C.; Zoumpoulakis, P. Quality Assessment of Pork and Turkey Hams Using FT-IR Spectroscopy, Colorimetric, and Image Analysis. Foods 2018, 7, 152. https://doi.org/10.3390/foods7090152
Sinanoglou VJ, Cavouras D, Xenogiannopoulos D, Proestos C, Zoumpoulakis P. Quality Assessment of Pork and Turkey Hams Using FT-IR Spectroscopy, Colorimetric, and Image Analysis. Foods. 2018; 7(9):152. https://doi.org/10.3390/foods7090152
Chicago/Turabian StyleSinanoglou, Vassilia J., Dionisis Cavouras, Dimitrios Xenogiannopoulos, Charalampos Proestos, and Panagiotis Zoumpoulakis. 2018. "Quality Assessment of Pork and Turkey Hams Using FT-IR Spectroscopy, Colorimetric, and Image Analysis" Foods 7, no. 9: 152. https://doi.org/10.3390/foods7090152
APA StyleSinanoglou, V. J., Cavouras, D., Xenogiannopoulos, D., Proestos, C., & Zoumpoulakis, P. (2018). Quality Assessment of Pork and Turkey Hams Using FT-IR Spectroscopy, Colorimetric, and Image Analysis. Foods, 7(9), 152. https://doi.org/10.3390/foods7090152