Optimization of Ultrasonic-Assisted Extraction of Major Phenolic Compounds from Olive Leaves (Olea europaea L.) Using Response Surface Methodology


Abstract
:
1. Introduction
2. Materials and Methods
2.1. Plant Material
2.2. Chemicals
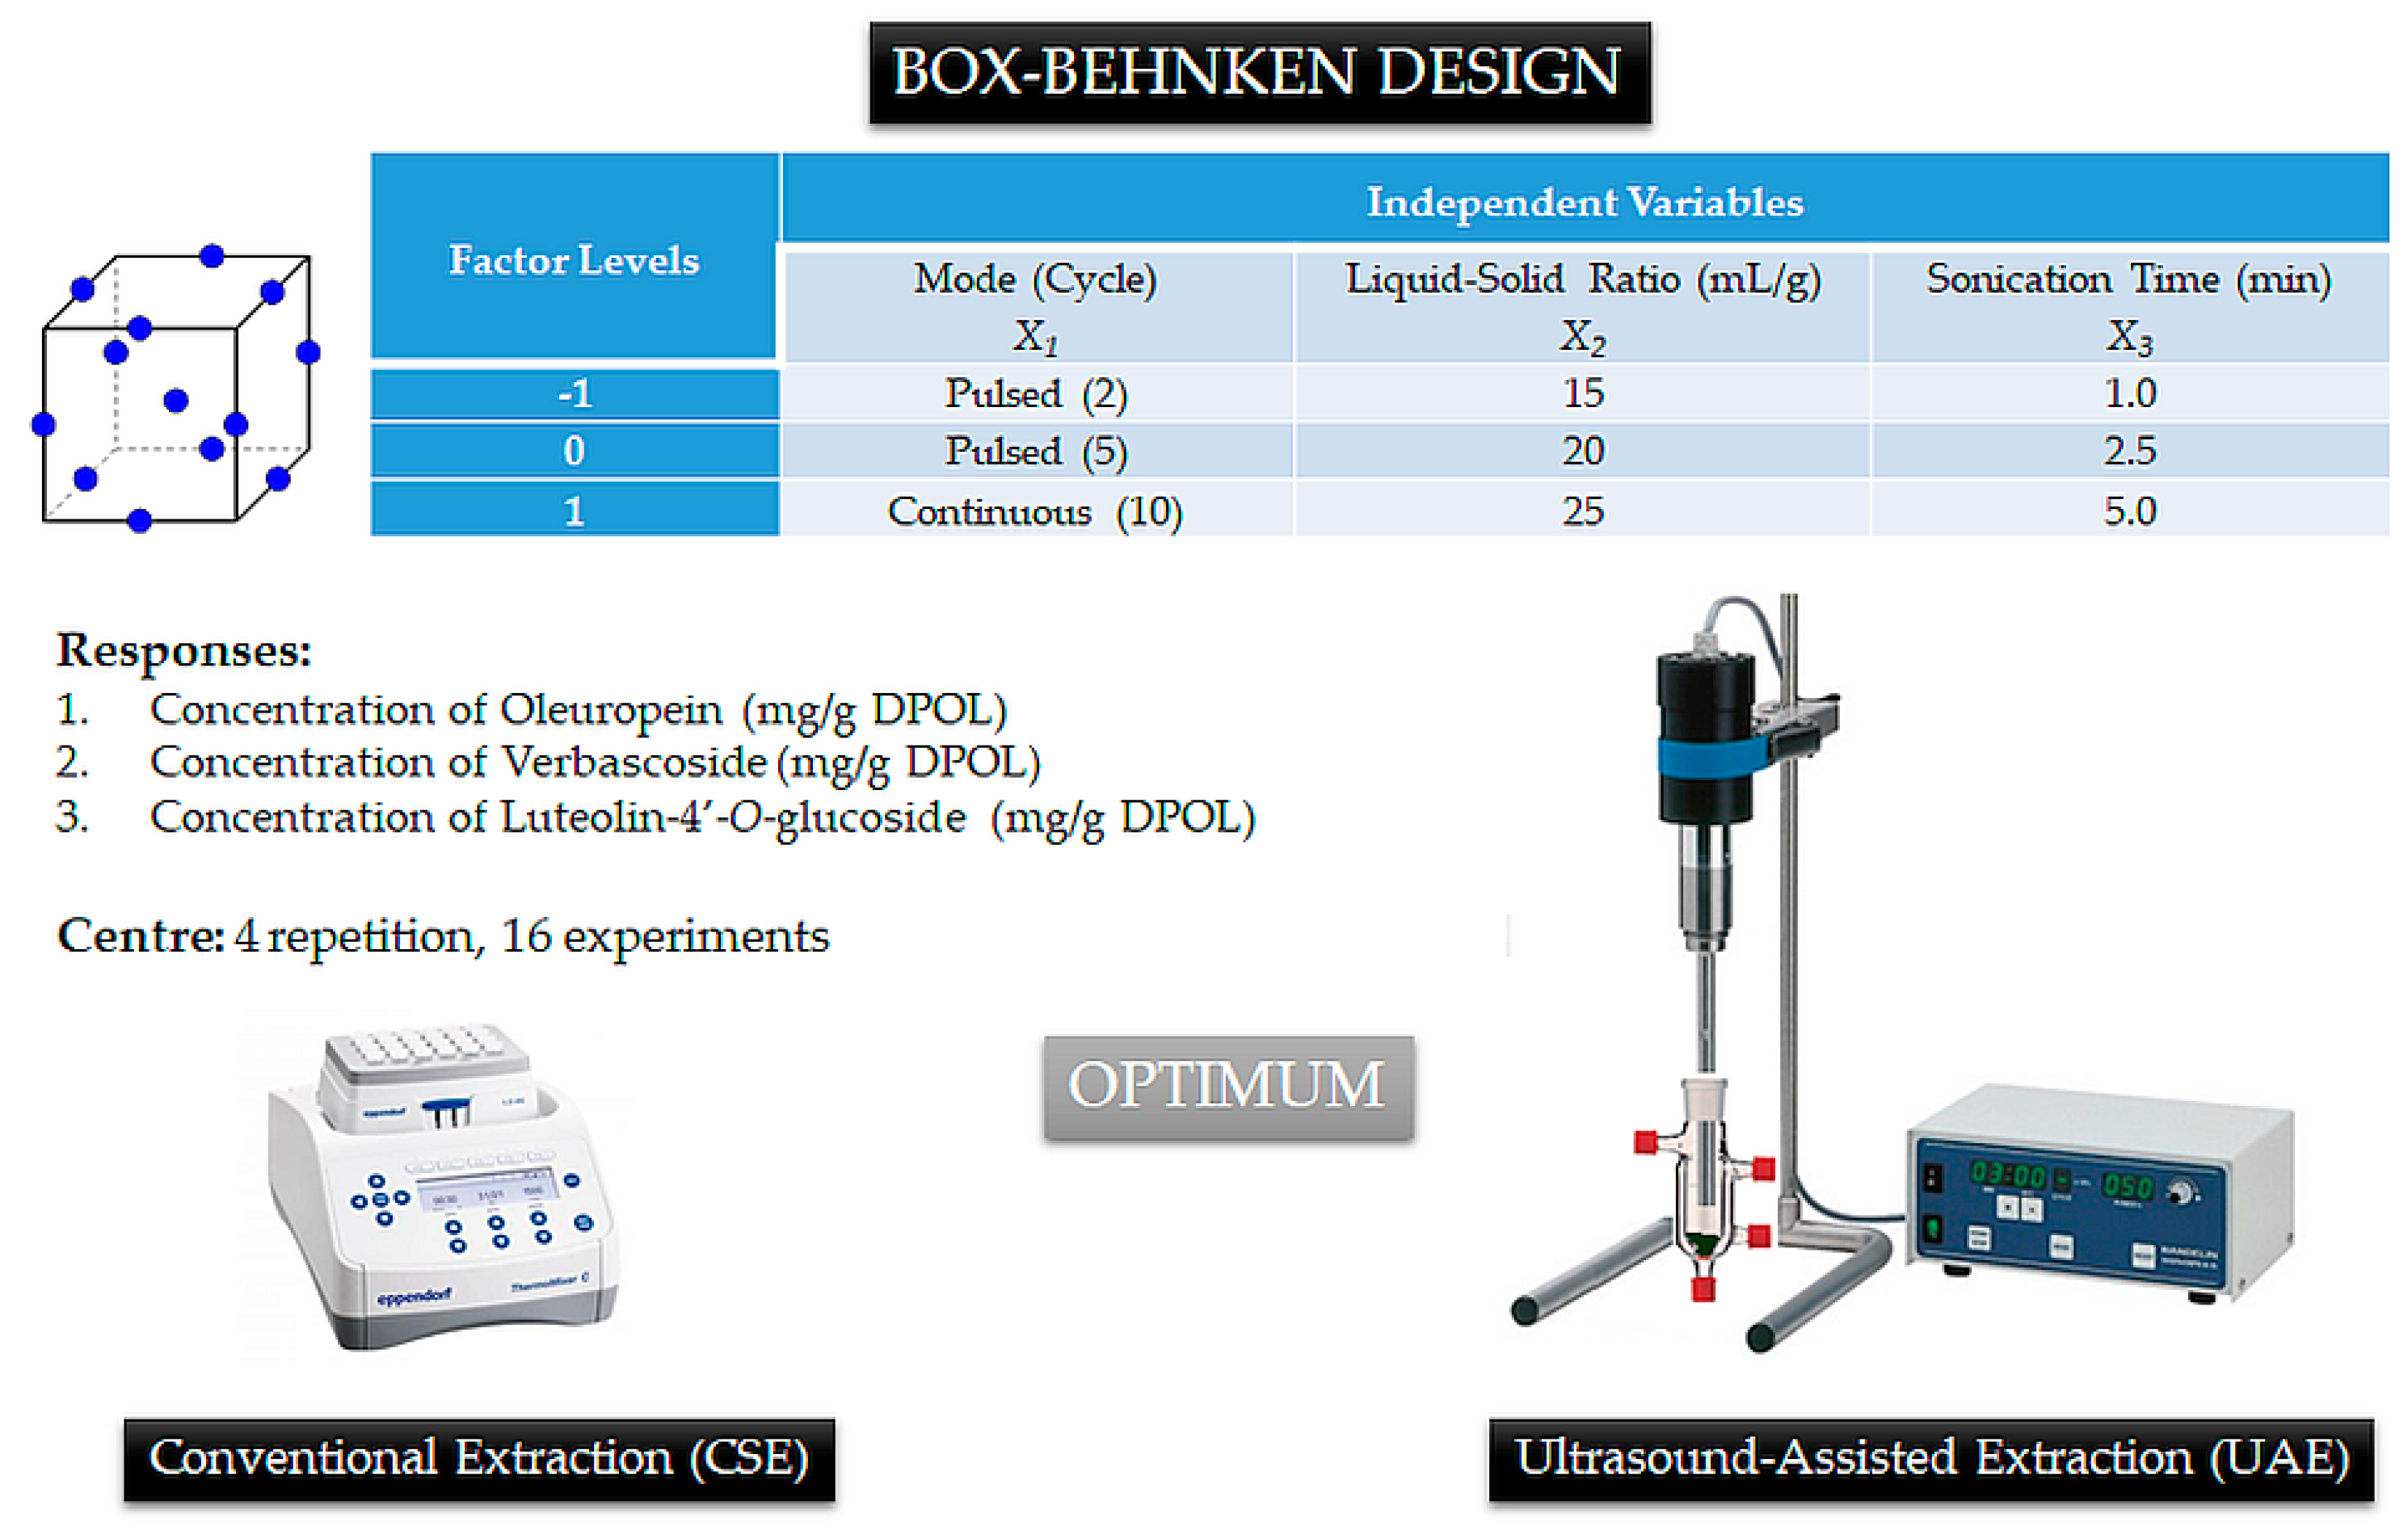
2.3. Apparatus and Extraction
2.3.1. Extraction Yield
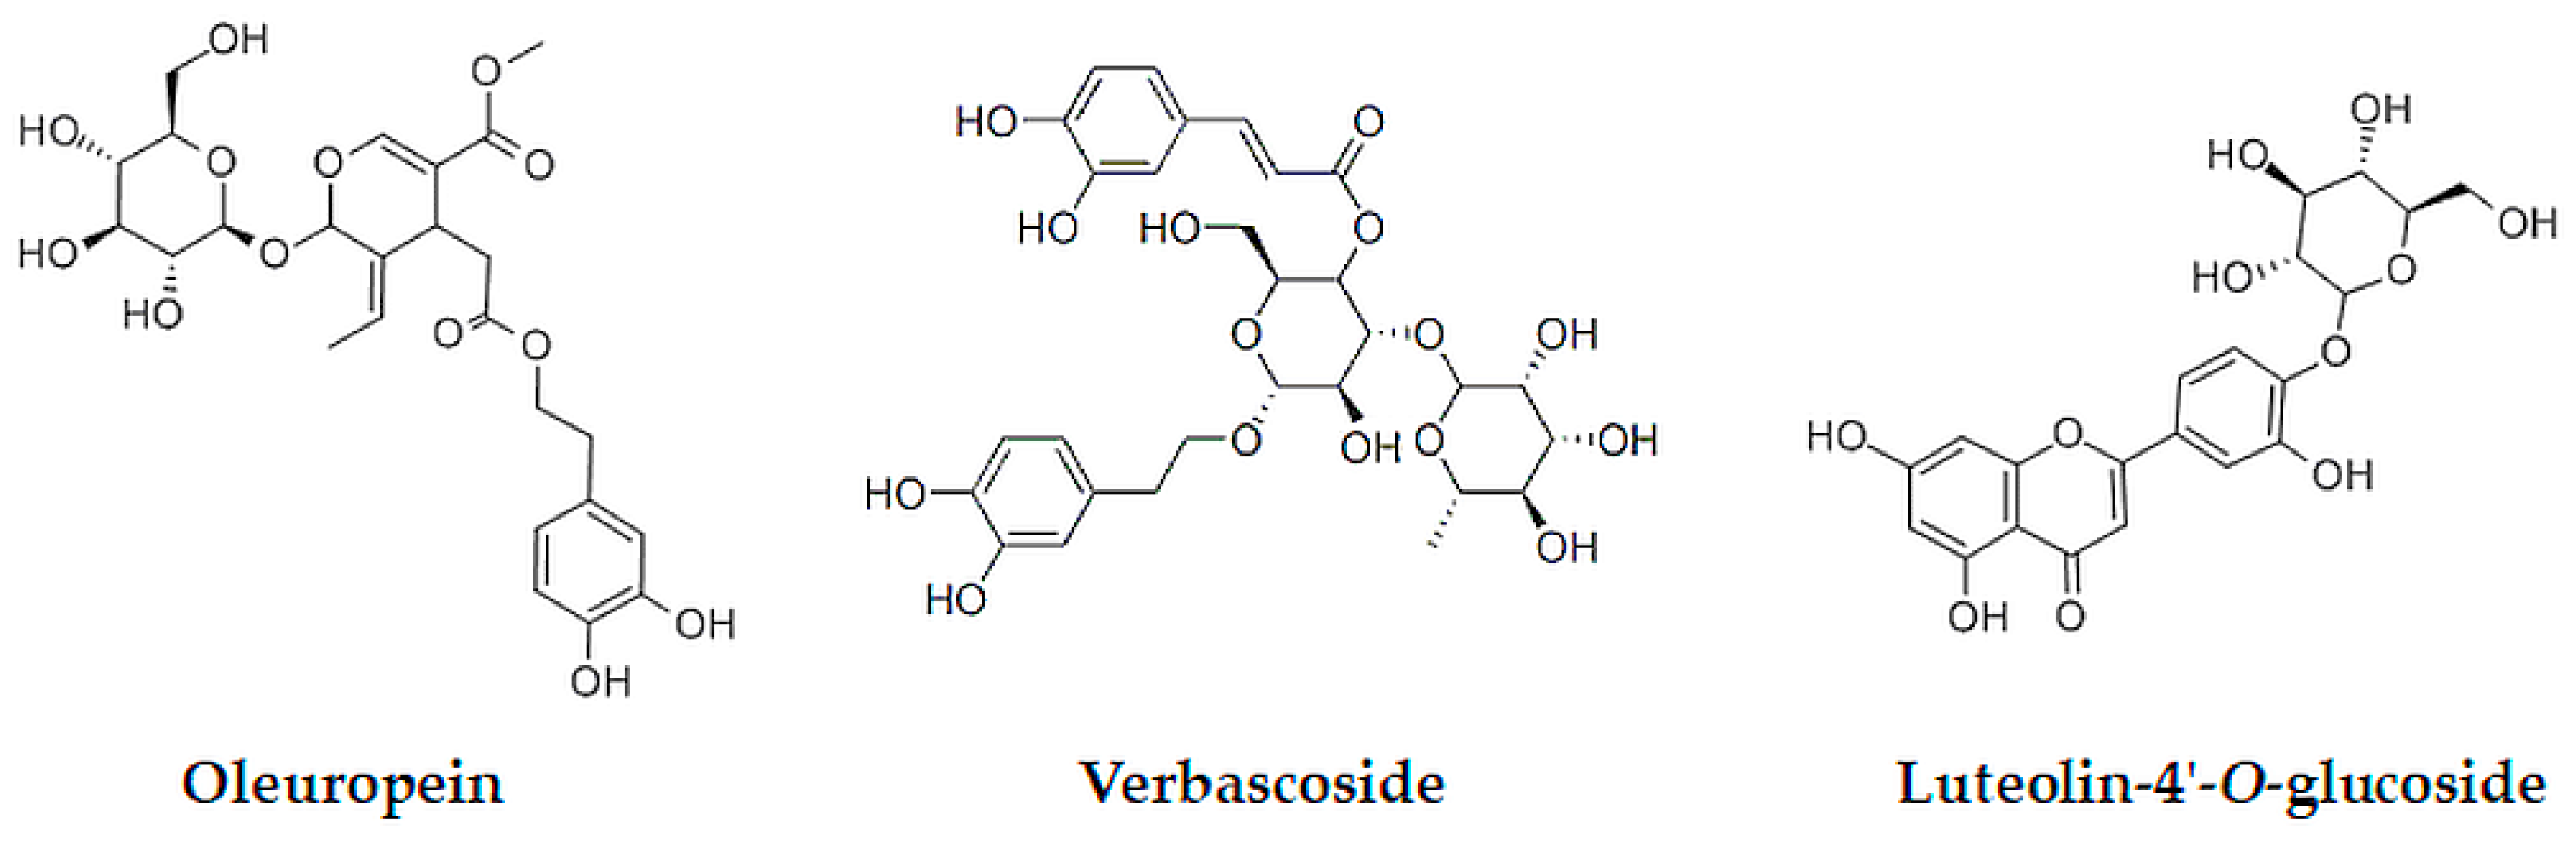
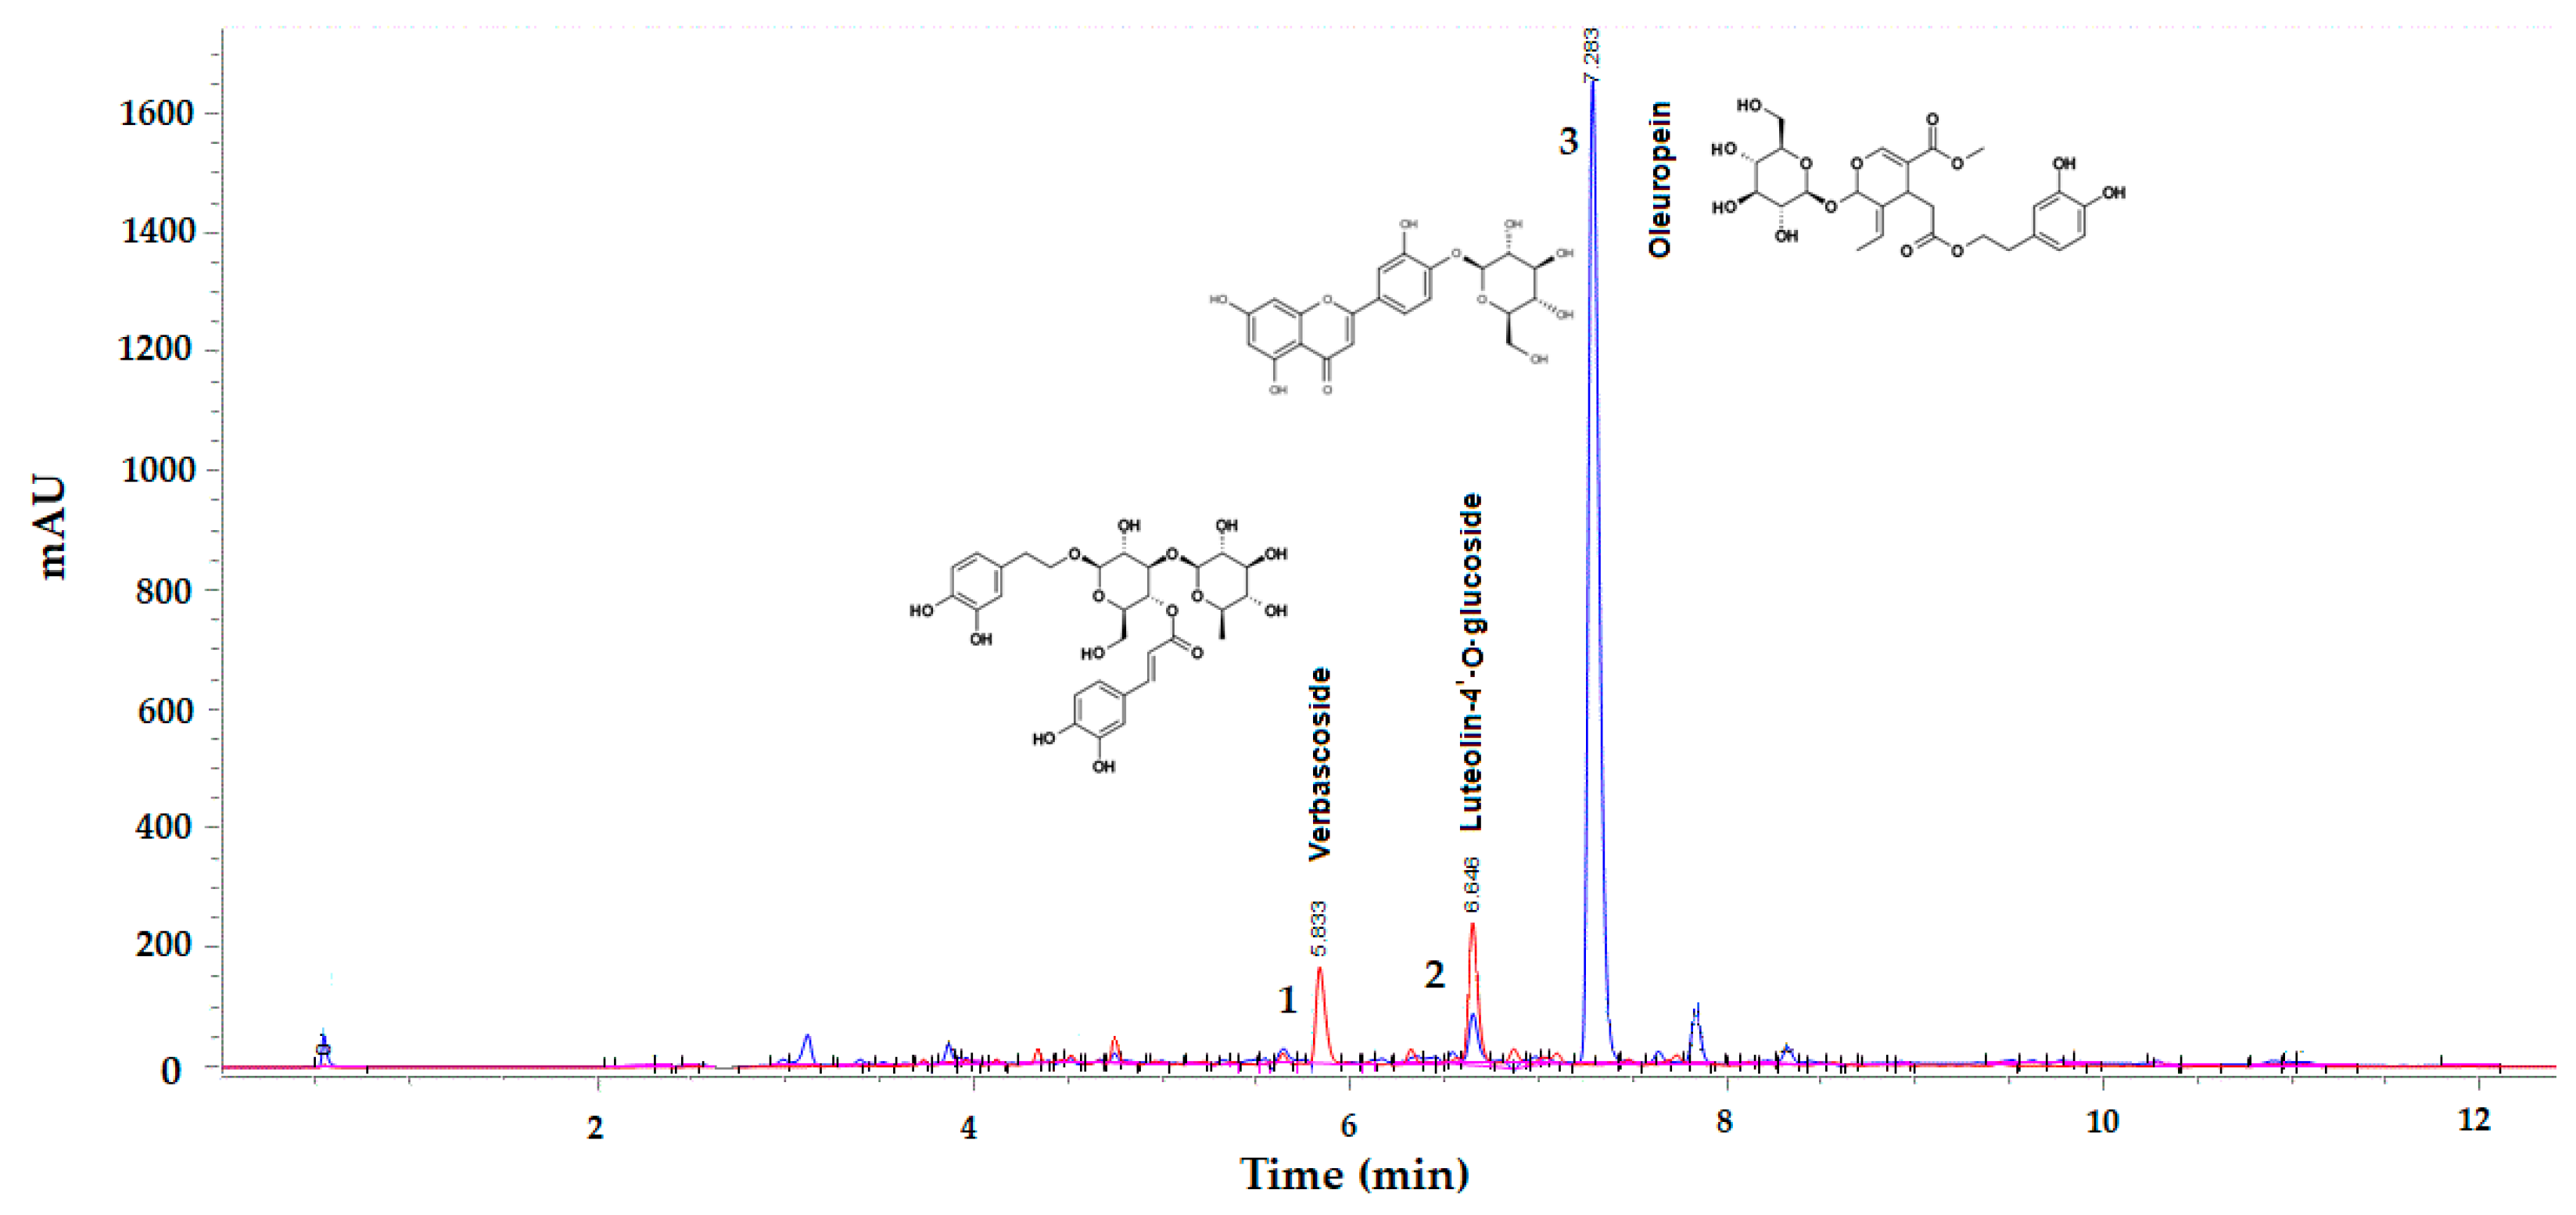
2.3.2. UHPLC-DAD Analysis of Oleuropein, Verbascoside, and Luteolin-4′-O-Glucoside
2.4. Experimental Design
2.5. Statistical Analysis
3. Results and Discussion
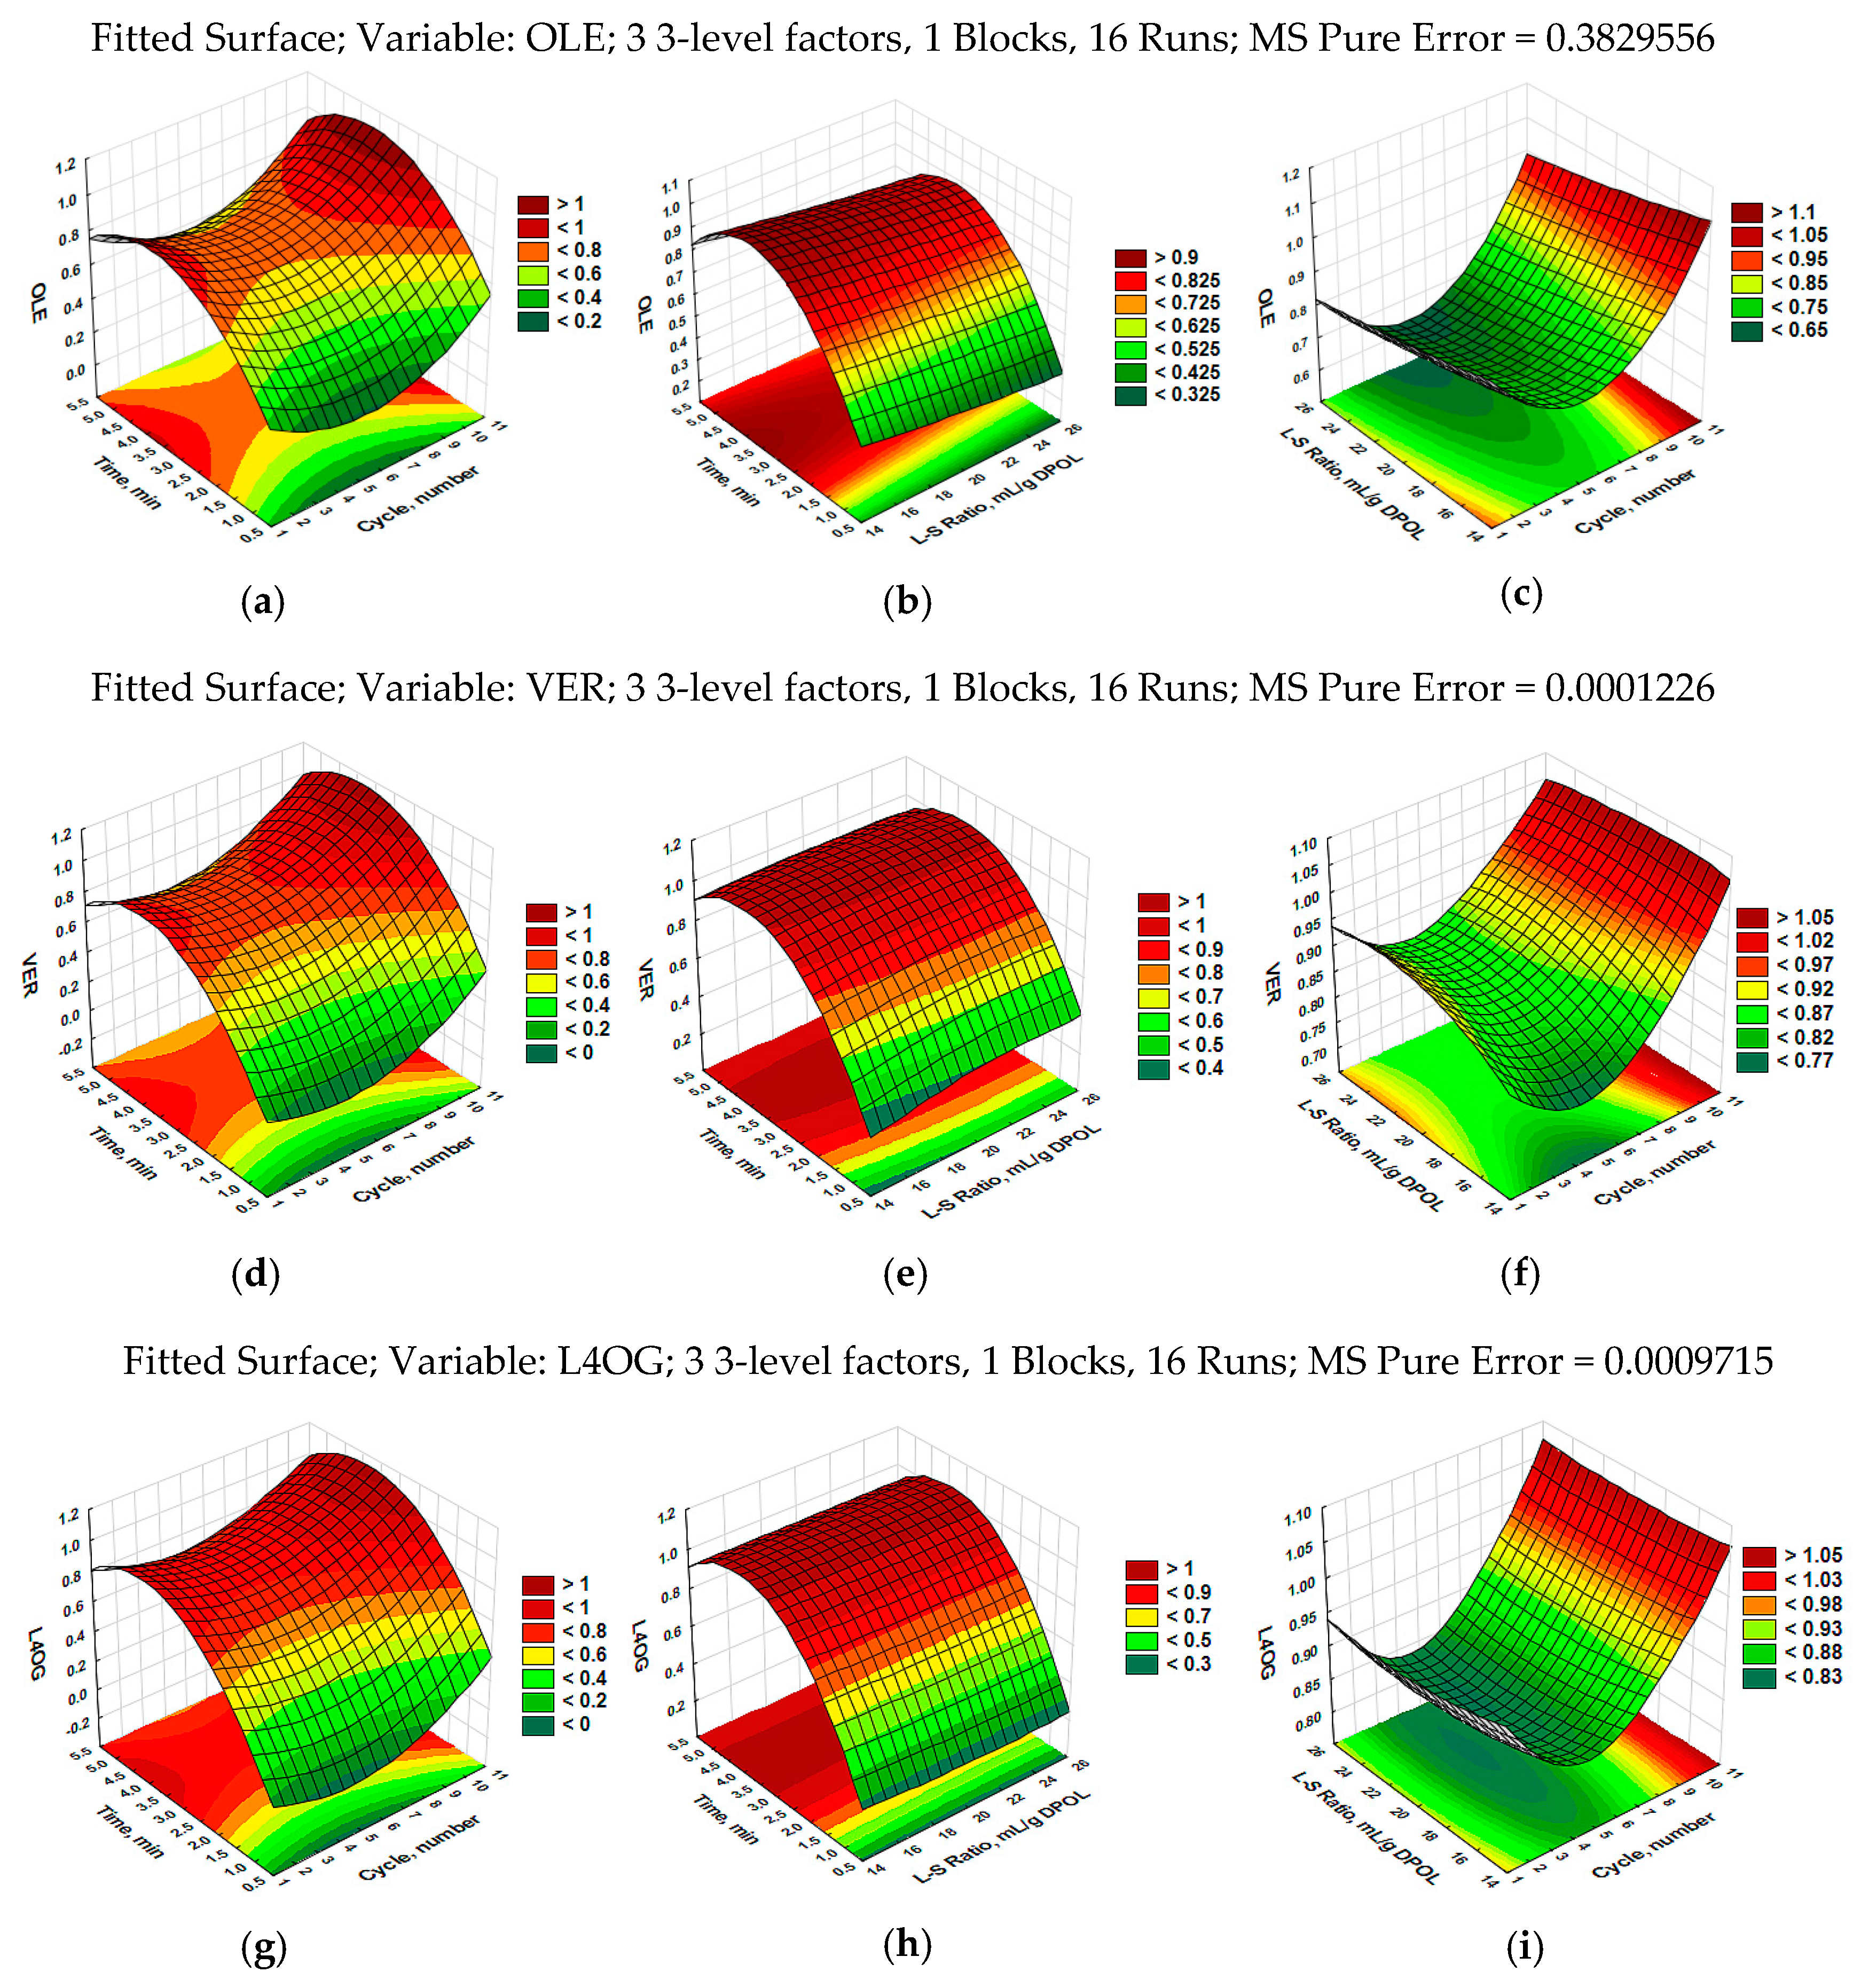
3.1. Modeling of Ultrasound-Assisted Extraction Using RSM
3.2. Comparison of Conventional (CSE) and Ultrasound-Assisted Extraction (UAE) Methods
4. Conclusions
Supplementary Materials
Author Contributions
Funding
Acknowledgments
Conflicts of Interest
References
- Balasundram, N. Phenolic compounds in plants and agri-industrial by-products: Antioxidant activity, occurrence, and potential uses. Food Chem. 2006, 99, 191–203. [Google Scholar] [CrossRef]
- Roselló-Soto, E.; Koubaa, M.; Moubarik, A.; Lopes, R.P.; Saraiva, J.A.; Boussetta, N.; Grimi, N.; Barba, F.J. Emerging opportunities for the effective valorization of wastes and by-products generated during olive oil production process: Non-conventional methods for the recovery of high-added value compounds. Trends Food Sci. Technol. 2015, 45, 296–310. [Google Scholar] [CrossRef]
- El, N.S.; Karakaya, S. Olive tree (Olea europaea) leaves: Potential beneficial effects on human health. Nutr. Rev. 2009, 67, 632–638. [Google Scholar] [CrossRef] [PubMed]
- Benavente-García, O.; Castillo, J.; Lorente, J.; Ortuño, A.; Rio, J.D. Antioxidant activity of phenolics extracted from Olea europaea L. leaves. Food Chem. 2000, 68, 457–462. [Google Scholar] [CrossRef]
- Ranalli, A.; Contento, S.; Lucera, L.; Febo, M.D.; Marchegiani, D.; Fonzo, V.D. Factors Affecting the Contents of Iridoid Oleuropein in Olive Leaves (Olea europaea L.). J. Agric. Food Chem. 2006, 54, 434–440. [Google Scholar] [CrossRef] [PubMed]
- Ryan, D.; Prenzler, P.D.; Lavee, S.; Antolovich, M.; Robards, K. Quantitative Changes in Phenolic Content during Physiological Development of the Olive (Olea europaea L.) Cultivar Hardy’s Mammoth. J. Agric. Food Chem. 2003, 51, 2532–2538. [Google Scholar] [CrossRef] [PubMed]
- Malik, N.S.; Bradford, J.M. Changes in oleuropein levels during differentiation and development of floral buds in ‘Arbequina’ olives. Sci. Hortic. 2006, 110, 274–278. [Google Scholar] [CrossRef]
- Boss, A.; Kao, C.; Murray, P.; Marlow, G.; Barnett, M.; Ferguson, L. Human Intervention Study to Assess the Effects of Supplementation with Olive Leaf Extract on Peripheral Blood Mononuclear Cell Gene Expression. Int. J. Mol. Sci. 2016, 17, 2019. [Google Scholar] [CrossRef] [PubMed]
- De Bock, M.; Thorstensen, E.B.; Derraik, J.G.B.; Henderson, H.V.; Hofman, P.L.; Cutfield, W.S. Human absorption and metabolism of oleuropein and hydroxytyrosol ingested as olive (Olea europaea L.) leaf extract. Mol. Nutr. Food Res. 2013, 57, 2079–2085. [Google Scholar] [CrossRef] [PubMed]
- Kikusato, M.; Muroi, H.; Uwabe, Y.; Furukawa, K.; Toyomizu, M. Oleuropein induces mitochondrial biogenesis and decreases reactive oxygen species generation in cultured avian muscle cells, possibly via an up-regulation of peroxisome proliferator-activated receptor γ coactivator-1α. Anim. Sci. J. 2016, 87, 1371–1378. [Google Scholar] [CrossRef] [PubMed]
- Dai, J.; Mumper, R.J. Plant phenolics: Extraction, analysis and their antioxidant and anticancer properties. Molecules 2010, 15, 7313–7352. [Google Scholar] [CrossRef] [PubMed]
- Giacometti, J.; Bursać Kovačević, D.; Putnik, P.; Gabrić, D.; Bilušić, T.; Krešić, G.; Stulić, V.; Barba, F.J.; Chemat, F.; Barbosa-Cánovas, G.; et al. Extraction of bioactive compounds and essential oils from mediterranean herbs by conventional and green innovative techniques: A review. Food Res. Int. 2018, 113, 245–262. [Google Scholar] [CrossRef]
- Chemat, F.; Zill-E-Huma; Khan, M.K. Applications of ultrasound in food technology: Processing, preservation and extraction. Ultrason. Sonochem. 2011, 18, 813–835. [Google Scholar] [CrossRef] [PubMed]
- Chemat, F.; Rombaut, N.; Sicaire, A.-G.; Meullemiestre, A.; Fabiano-Tixier, A.-S.; Abert-Vian, M. Ultrasound assisted extraction of food and natural products. Mechanisms, techniques, combinations, protocols and applications. A review. Ultrason. Sonochem. 2017, 34, 540–560. [Google Scholar] [CrossRef] [PubMed]
- Vilkhu, K.; Mawson, R.; Simons, L.; Bates, D. Applications and opportunities for ultrasound assisted extraction. Innov. Food Sci. Emerg. Technol. 2008, 9, 161–169. [Google Scholar] [CrossRef]
- Pan, Z.; Qu, W.; Ma, H.; Atungulu, G.G.; McHugh, T.H. Continuous and pulsed ultrasound-assisted extractions of antioxidants from pomegranate peel. Ultrason. Sonochem. 2011, 18, 1249–1257. [Google Scholar] [CrossRef] [PubMed]
- Bezerra, M.A.; Santelli, R.E.; Oliveira, E.P.; Villar, L.S.; Escaleira, L.A. Response surface methodology (RSM) as a tool for optimization in analytical chemistry. Talanta 2008, 76, 965–977. [Google Scholar] [CrossRef] [PubMed]
- Ramić, M.; Vidović, S.; Zeković, Z.; Vladić, J.; Cvejin, A.; Pavlić, B. Modeling and optimization of ultrasound-assisted extraction of polyphenolic compounds from Aronia melanocarpa by-products from filter-tea factory. Ultrason. Sonochem. 2015, 23, 360–368. [Google Scholar] [CrossRef] [PubMed]
- Şahin, S.; Şamli, R. Optimization of olive leaf extract obtained by ultrasound-assisted extraction with response surface methodology. Ultrason. Sonochem. 2013, 20, 595–602. [Google Scholar] [CrossRef] [PubMed]
- Giacometti, J.; Muhvić, D.; Pavletić, A.; Dudarić, L. Cocoa polyphenols exhibit antioxidant, anti-inflammatory, anticancerogenic, and anti-necrotic activity in carbon tetrachloride-intoxicated mice. J. Funct. Foods 2016, 23, 177–187. [Google Scholar] [CrossRef]
- Ilbay, Z.; Şahin, S.; Büyükkabasakal, K. A novel approach for olive leaf extraction through ultrasound technology: Response surface methodology versus artificial neural networks. Korean J. Chem. Eng. 2014, 31, 1661–1667. [Google Scholar] [CrossRef]
- Japon-Lujan, R.; Luque-Rodrıguez, J.; Luque de Castro, M.D. Dynamic ultrasound-assisted extraction of oleuropein and related biophenols from olive leaves. J. Chromatogr. A 2006, 1108, 76–82. [Google Scholar] [CrossRef] [PubMed]
- Khemakhem, I.; Ahmad-Qasem, M.H.; Catalán, E.B.; Micol, V.; García-Pérez, J.V.; Ayadi, M.A.; Bouaziz, M. Kinetic improvement of olive leaves’ bioactive compounds extraction by using power ultrasound in a wide temperature range. Ultrason. Sonochem. 2017, 34, 466–473. [Google Scholar] [CrossRef] [PubMed]


| Runs | Extraction Conditions | Analytical Results (mg/g DPOL) | |||||||
|---|---|---|---|---|---|---|---|---|---|
| Uncoded Values | Coded Values | ||||||||
| Cycle X1 | L–S Ratio a X2 | Time X3 | Oleuropein | Verbascoside | Luteolin-4′-O-Glucoside | ||||
| 1 | 5 | 20 | 2.5 | 0 | 0 | 0 | 11.284 ± 0.14 | 0.306 ± 0.00 | 0.432 ± 0.01 |
| 2 | 10 | 25 | 2.5 | 1 | 1 | 0 | 12.261 ± 0.05 | 0.351 ± 0.00 | 0.484 ± 0.00 |
| 3 | 5 | 20 | 2.5 | 0 | 0 | 0 | 11.181 ± 0.00 | 0.298 ± 0.00 | 0.422 ± 0.00 |
| 4 | 10 | 15 | 2.5 | 1 | −1 | 0 | 13.517 ± 0.10 | 0.349 ± 0.01 | 0.493 ± 0.01 |
| 5 | 5 | 25 | 5 | 0 | 1 | 1 | 11.792 ± 0.04 | 0.322 ± 0.01 | 0.448 ± 0.01 |
| 6 | 10 | 20 | 5 | 1 | 0 | 1 | 12.120 ± 0.11 | 0.349 ± 0.00 | 0.490 ± 0.01 |
| 7 | 5 | 20 | 2.5 | 0 | 0 | 0 | 10.523 ± 0.01 | 0.288 ± 0.00 | 0.393 ± 0.02 |
| 8 | 5 | 25 | 1 | 0 | 1 | −1 | 8.995 ± 1.56 | 0.220 ± 0.04 | 0.264 ± 0.05 |
| 9 | 5 | 15 | 1 | 0 | −1 | −1 | 7.789 ± 0.00 | 0.178 ± 0.00 | 0.234 ± 0.01 |
| 10 | 5 | 20 | 2.5 | 0 | 0 | 0 | 12.034 ± 0.00 | 0.314 ± 0.00 | 0.363 ± 0.00 |
| 11 | 2 | 20 | 5 | −1 | 0 | 1 | 10.122 ± 0.03 | 0.288 ± 0.00 | 0.402 ± 0.01 |
| 12 | 2 | 15 | 2.5 | −1 | −1 | 0 | 12.271 ± 0.18 | 0.302 ± 0.01 | 0.427 ± 0.01 |
| 13 | 2 | 25 | 2.5 | −1 | 1 | 0 | 11.144 ± 0.14 | 0.305 ± 0.00 | 0.408 ± 0.01 |
| 14 | 2 | 20 | 1 | −1 | 0 | −1 | 12.165 ± 0.11 | 0.271 ± 0.00 | 0.349 ± 0.00 |
| 15 | 5 | 15 | 5 | 0 | −1 | 1 | 12.822 ± 2.51 | 0.323 ± 0.07 | 0.469 ± 0.09 |
| 16 | 10 | 20 | 1 | 1 | 0 | −1 | 10.894 ± 0.00 | 0.281 ± 0.00 | 0.350 ± 0.00 |
| Factor | Oleuropein (Y1) | Verbascoside (Y2) | Luteolin-4′-O-Glucoside (Y3) | ||||||||||||
|---|---|---|---|---|---|---|---|---|---|---|---|---|---|---|---|
| SS | dF | MS | F | P | SS | dF | MS | F | P | SS | dF | MS | F | P | |
| Model | 31.135 | 15 | 0.031 | 15 | 0.086 | 15 | <0.001 | ||||||||
| Linear (L) | |||||||||||||||
| X1 | 1.193 | 1 | 1.193 | 3.114 | 0.176 | 0.003 | 1 | 0.003 | 27.143 | 0.014 * | 0.007 | 1 | 0.007 | 6.864 | 0.079 |
| X2 | 0.610 | 1 | 0.610 | 1.591 | 0.296 | <0.001 | 1 | <0.001 | 2.215 | 0.233 | <0.001 | 1 | <0.001 | 0.040 | 0.853 |
| X3 | 6.149 | 1 | 6.149 | 16.057 | 0.028 * | 0.014 | 1 | 0.014 | 113.11 | 0.002 ** | 0.047 | 1 | 0.047 | 48.129 | 0.006 * |
| Quadratic (Q) | |||||||||||||||
| X12 | 3.230 | 1 | 3.230 | 8.436 | 0.062 | 0.003 | 1 | 0.003 | 20.882 | 0.002 ** | 0.006 | 1 | 0.006 | 6.471 | 0.084 |
| X22 | 0.004 | 1 | 0.004 | 0.012 | 0.921 | <0.001 | 1 | <0.001 | 1.049 | 0.381 | <0.001 | 1 | <0.001 | 0.044 | 0.848 |
| X32 | 5.208 | 1 | 5.208 | 13.600 | 0.035 * | 0.008 | 1 | 0.008 | 65.287 | 0.004 ** | 0.002 | 1 | 0.002 | 20.251 | 0.020 * |
| Sum of L and Q | |||||||||||||||
| X1+ X12 | 5.266 | 2 | 2.633 | 6.875 | 0.076 | 0.007 | 2 | 0.004 | 29.037 | 0.011 * | 0.016 | 2 | 0.008 | 8.073 | 0.062 |
| X2+ X22 | 0.614 | 2 | 0.307 | 0.802 | 0.526 | <0.001 | 2 | <0.001 | 1.632 | 0.331 | <0.001 | 2 | <0.001 | 0.042 | 0.959 |
| X3+ X22 | 9.680 | 2 | 4.840 | 12.639 | 0.034 * | 0.019 | 2 | 0.009 | 76.560 | 0.003 ** | 0.058 | 2 | 0.029 | 29.654 | 0.011 * |
| Lack of fit | 14.426 | 6 | 2.404 | 6.278 | 0.080 | 0.005 | 6 | <0.001 | 6.298 | 0.080 | 0.009 | 6 | 0.001 | 1.624 | 0.370 |
| Pure error | 1.148 | 3 | 0.383 | <0.001 | 3 | <0.001 | 0.003 | 3 | 0.001 | ||||||
| Total SS | 31.135 | 15 | 0.031 | 15 | 0.086 | 15 | |||||||||
| R2 | 0.500 | 0.840 | 0.856 | ||||||||||||
| Adj R2 | 0.166 | 0.734 | 0.759 | ||||||||||||
© 2018 by the authors. Licensee MDPI, Basel, Switzerland. This article is an open access article distributed under the terms and conditions of the Creative Commons Attribution (CC BY) license (http://creativecommons.org/licenses/by/4.0/).
Share and Cite
Giacometti, J.; Žauhar, G.; Žuvić, M. Optimization of Ultrasonic-Assisted Extraction of Major Phenolic Compounds from Olive Leaves (Olea europaea L.) Using Response Surface Methodology. Foods 2018, 7, 149. https://doi.org/10.3390/foods7090149
Giacometti J, Žauhar G, Žuvić M. Optimization of Ultrasonic-Assisted Extraction of Major Phenolic Compounds from Olive Leaves (Olea europaea L.) Using Response Surface Methodology. Foods. 2018; 7(9):149. https://doi.org/10.3390/foods7090149
Chicago/Turabian StyleGiacometti, Jasminka, Gordana Žauhar, and Marta Žuvić. 2018. "Optimization of Ultrasonic-Assisted Extraction of Major Phenolic Compounds from Olive Leaves (Olea europaea L.) Using Response Surface Methodology" Foods 7, no. 9: 149. https://doi.org/10.3390/foods7090149
APA StyleGiacometti, J., Žauhar, G., & Žuvić, M. (2018). Optimization of Ultrasonic-Assisted Extraction of Major Phenolic Compounds from Olive Leaves (Olea europaea L.) Using Response Surface Methodology. Foods, 7(9), 149. https://doi.org/10.3390/foods7090149