1. Introduction
It has been established that a plethora of secondary metabolites are synthesized by plants, which facilitate their growth and reproduction [
1]. These secondary metabolites encompass a wide range of chemical compounds, including alkaloids, phenols, steroids, glycosides, tannins, terpenes and antitoxins [
2]. Numerous studies have indicated that these secondary metabolites exhibit diverse biological activities, rendering them valuable in terms of their potential applications in the domains of human and animal health [
3]. In particular, alkaloids are an important class of secondary metabolites [
4], which are defined as organic compounds characterized by a cyclic structure incorporating one or more basic nitrogen atoms within their molecular framework [
5]. Furthermore, alkaloids demonstrate a range of pharmacological properties, encompassing anti-inflammatory, antioxidant, antiviral and antineoplastic activities. Valipour et al. [
6] found that isoquinoline alkaloids exhibited anti-inflammatory and antiviral effects, and these alkaloids can be used as powerful natural anti-SARS-CoV-2 drugs. Mombeini et al. [
7] reported that berberine had the antioxidant and prevention effect of cyclophosphamide nephropathy. These properties are mechanistically associated with their interactions with specific biomolecular targets [
8].
The
Cinnamomum camphora (L.) Presl., commonly known as the camphor tree, is a species of evergreen broad-leaved plant that is distributed extensively throughout Southern China, particularly in the southern area of the Yangtze River [
9]. It plays an important role in both the native flora and the art of landscaping in China [
10]. Notably, the annual yield of
C. camphora seeds is over 11 million tons in China. However,
C. camphora seeds have caused serious contamination in both urban and rural environment due to a lack of development [
11]. Our previous study showed that
C.
camphora seed kernels (CCSKs) contained 48–63% medium-chain oil and 18–19% protein [
12]. In addition, CCSK was found to be rich in bioactive substances, including alkaloids, phenols and steroids [
13,
14]. In particular, our previous research showed that magnoflorine, lindoldhamine and N,N-methyldomesticinium were the primary alkaloids in CCSK [
14]. These alkaloids exhibited various health benefits, including anti-diabetic, anti-inflammatory and antibacterial activities. For instance, Cherku et al. [
15] found that magnoflorine exhibited anti-diabetic properties and prevented weight loss in diabetic mice, producing effects comparable to those of metformin treatment. Guo et al. [
16] found that magnoflorine had an anti-inflammatory effect, reducing the expression of TNF-α, IL-6 and other pro-inflammatory cytokines. Osmakov et al. [
17] reported that lindoldhamine exhibited anti-inflammatory properties in mice. Taken together, these data suggest the significant potential application of CCSK alkaloids in functional foods and biological medicines. Therefore, the development of CCSK alkaloids is extremely important.
The most common methods currently used for extracting alkaloids include liquid–liquid extraction [
18], solid-phase extraction [
19] and precipitation at a basic pH [
20]. However, these methods have several disadvantages, including solvent consumption, high cost, and inapplicability to industrial processes. In contrast, macroporous resin (MAR) is well-suited to industrial production and has been employed to enrich alkaloids from plant-based ingredients, such as
Coptidis rhizoma,
Euodiae fructus [
21] and peony seed meal [
22]. The high selectivity and adsorption capacity of MAR make it potentially valuable for use in the pharmaceutical and food industries. Additionally, the unique chemical composition of CCSK means that the residual aqueous solution after CCSK oil extraction using the aqueous extraction (AE) method contains loads of nutrients, including proteins, polyphenols, alkaloids and polysaccharides [
23]. However, the refinement of alkaloids from the CCSK aqueous solution using MAR technology has yet to be reported.
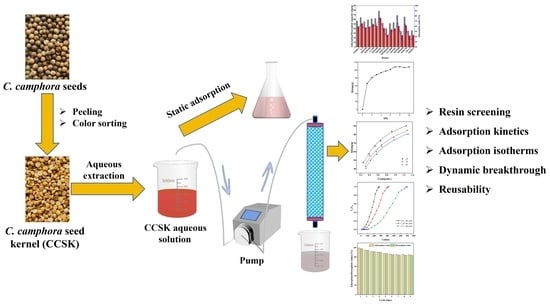
Therefore, this study aimed to enrich the alkaloids in the CCSK aqueous solution using MAR chromatography. Firstly, the adsorption and desorption behaviors of 16 commercial MARs with regard to CCSK alkaloids were compared. The optimum enrichment conditions were then determined. Eventually, the enrichment process was scaled up in the laboratory. This research supplies a foundation for the industrial enrichment of CCSK alkaloids.
2. Materials and Methods
2.1. Materials
Naturally mature
C. camphora seeds were collected from Nanchang University (Nanchang, China) in January 2025. Ten MARs (X-5, HPD-700, HPD-200, HPD-300, HPD-722, HPD-BJQH, HPD-400, HPD-450, HPD-750 and NKA-9) were purchased from Baoen Adsorption Material Technology Co., Ltd. (Cangzhou, China), two MARs (XR918C and XR930C) were purchased from Shanghai Xuner Chemical Industry Technology Co., Ltd. (Shanghai, China), two MARs (YKDH-2 and YKDH-9) were from Tianjin Yunkai Resin Technology Co., Ltd. (Tianjin, China), and two MARs (LS-300 and LS-300B) were from Xi’an Lan Shen New Material Technology Co., Ltd. (Xian, China), and their physical properties are shown in
Table S1. Magnoflorine, lindoldhamine and N,N-methyldomesticinium standards (HPLC ≥ 98%) were prepared in our laboratory (China patent number: ZL202510329638.8[P]). The NMR spectra of the three marker alkaloids are shown in
Supplementary Material (Figures S1–S3). Formic acid and methanol were obtained from Aladdin Biochemical Technology Co., Ltd. (Shanghai, China).
2.2. Pretreatment of MAR
The MAR was pretreated using the method reported by Wang et al. [
24]. In short, the MAR was first soaked in anhydrous ethanol for 24 h, after which the resin was washed with distilled water until the alcohol concentration measured by an alcoholometer was zero. It was sequentially soaked in solutions of 5% NaOH (
w/
v) for 6 h and 5% HCl (
v/
v) for 6 h. Then it was purged with distilled water until neutral. Finally, the MAR was soaked in absolute ethanol for later use.
2.3. Preparation of CCSK Aqueous Solution by AE Method
The AE method was used to treat the CCSK, as described by Zhu et al. [
11]. Briefly, to produce a slurry, the CCSK was combined with distilled water at a 1:4 (
w/
w) ratio, poured into a colloid mill for 5 min, and then centrifuged at 4800 rpm for 10 min to obtain the CCSK aqueous solution. The intermediate aqueous phase was collected and stored at 4 °C for later use.
2.4. Determination of Alkaloids Before and After MAR Enrichment
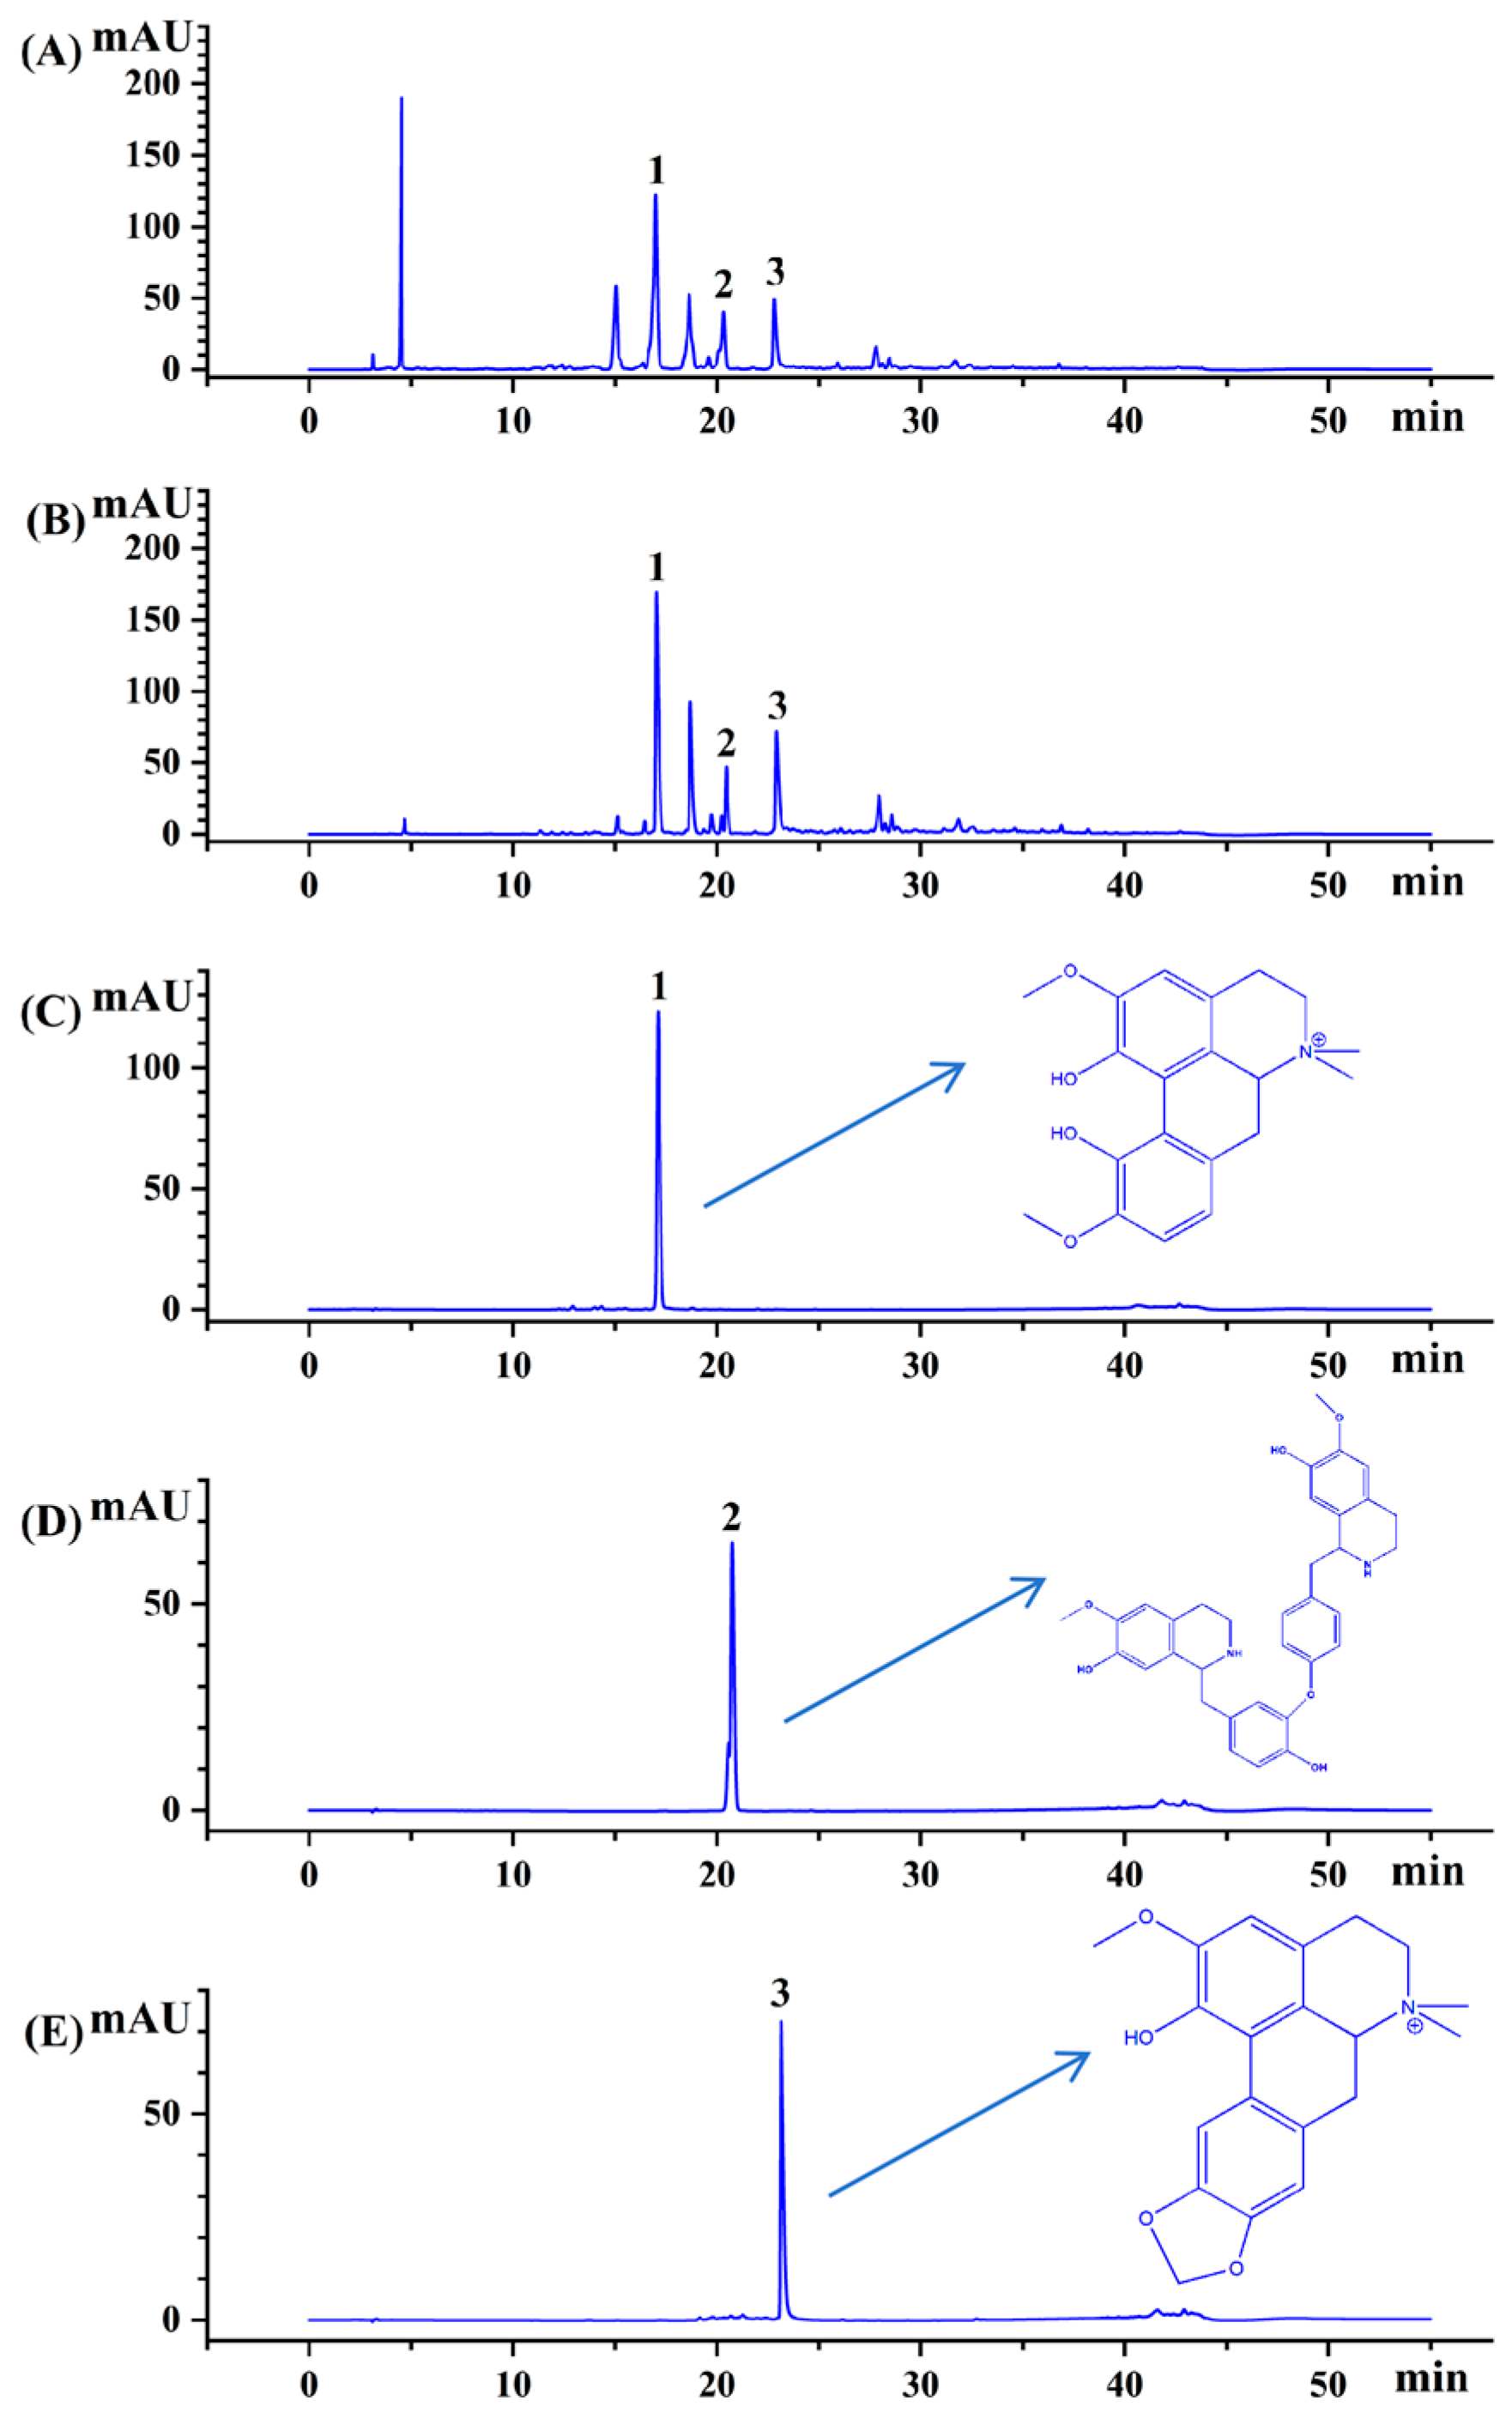
The alkaloids in the CCSK aqueous solution before and after MAR enrichment were quantitatively analyzed using an Agilent 1260 Infinity III LC system (Agilent Technologies, Inc., Santa Clara, CA, USA) equipped with a variable wavelength detector. Prior to analysis, the freeze-dried samples of CCSK aqueous solution before and after MAR enrichment were dissolved in HPLC-grade methanol at a concentration of 1 mg/mL, followed by filtration using a 0.22 μm organic membrane. The sample was then separated at 25 °C using a gradient elution procedure on an Amethyst C18-H reversed-phase column (4.6 × 250 mm, 5.0 μm; Sepax Technology Co., Ltd., Suzhou, China). The flow rate was 1.0 mL/min, and the mobile phase consisted of 0.1% (v/v) formic acid in water (A) and methanol (B). The elution procedure was as follows: 0–8 min, 5–20% B; 8–28 min, 20–50% B; 28–40 min, 50–85% B; 40–45 min, 85–5% B; and 45–55 min, 5% B. The alkaloids in the CCSK aqueous solution before and after MAR enrichment were detected at 280 nm and identified by comparing their retention times and UV spectra with those of the standard substances, magnoflorine, lindoldhamine and N,N-methyldomesticinium.
The external standard method was used to quantify the alkaloids. The equations of the calibration curves for magnoflorine, lindoldhamine and N,N-methyldomesticinium are shown below. They are as follows: Magnoflorine: Y = 6.5269x + 7.4868 (R2 = 0.9998, n = 6); Lindoldhamine: Y = 4.3462x − 1.2552 (R2 = 0.9996, n = 6); and N,N-Methyldomesticinium: Y = 4.1959x − 1.2136 (R2 = 0.9999, n = 6), where Y represents the area of the peak and x represents the concentration of the alkaloids. The content of alkaloids in the CCSK aqueous solution before and after MAR enrichment was calculated by summing the contents of magnoflorine, lindoldhamine and N,N-methyldomesticinium. The results were expressed on a dry weight basis to ensure consistency and comparability.
2.5. Resin Screening
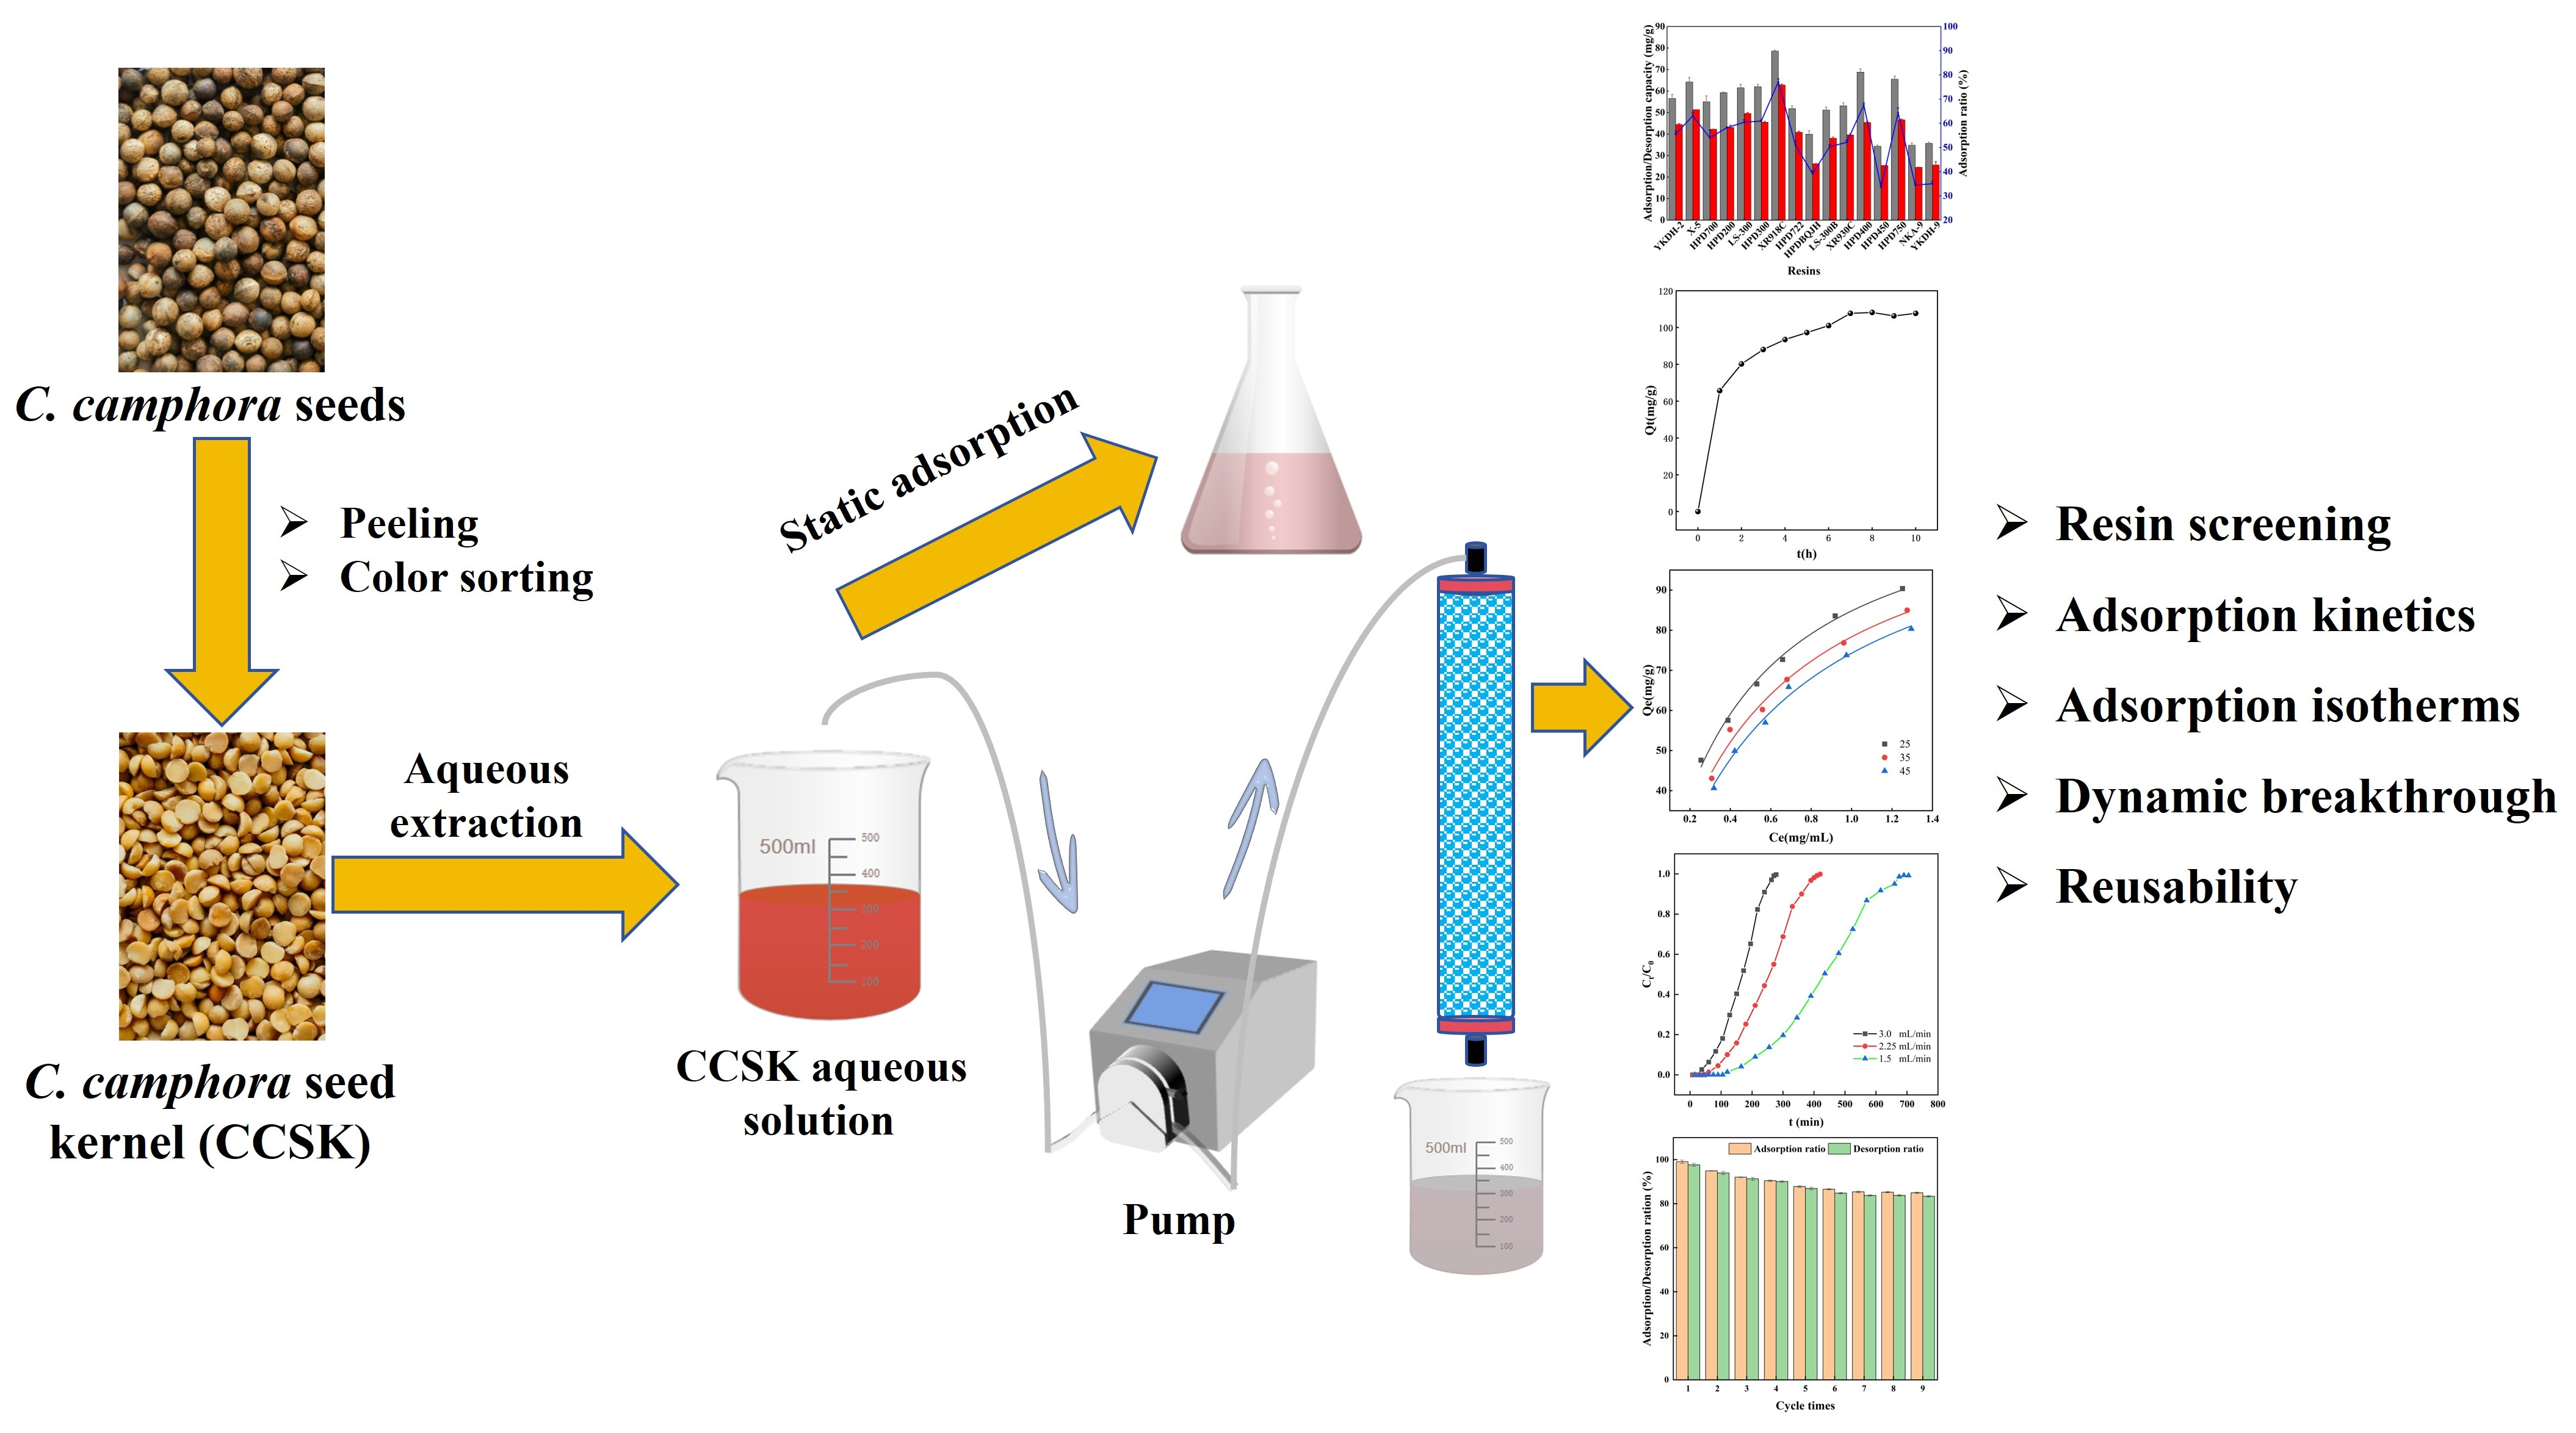
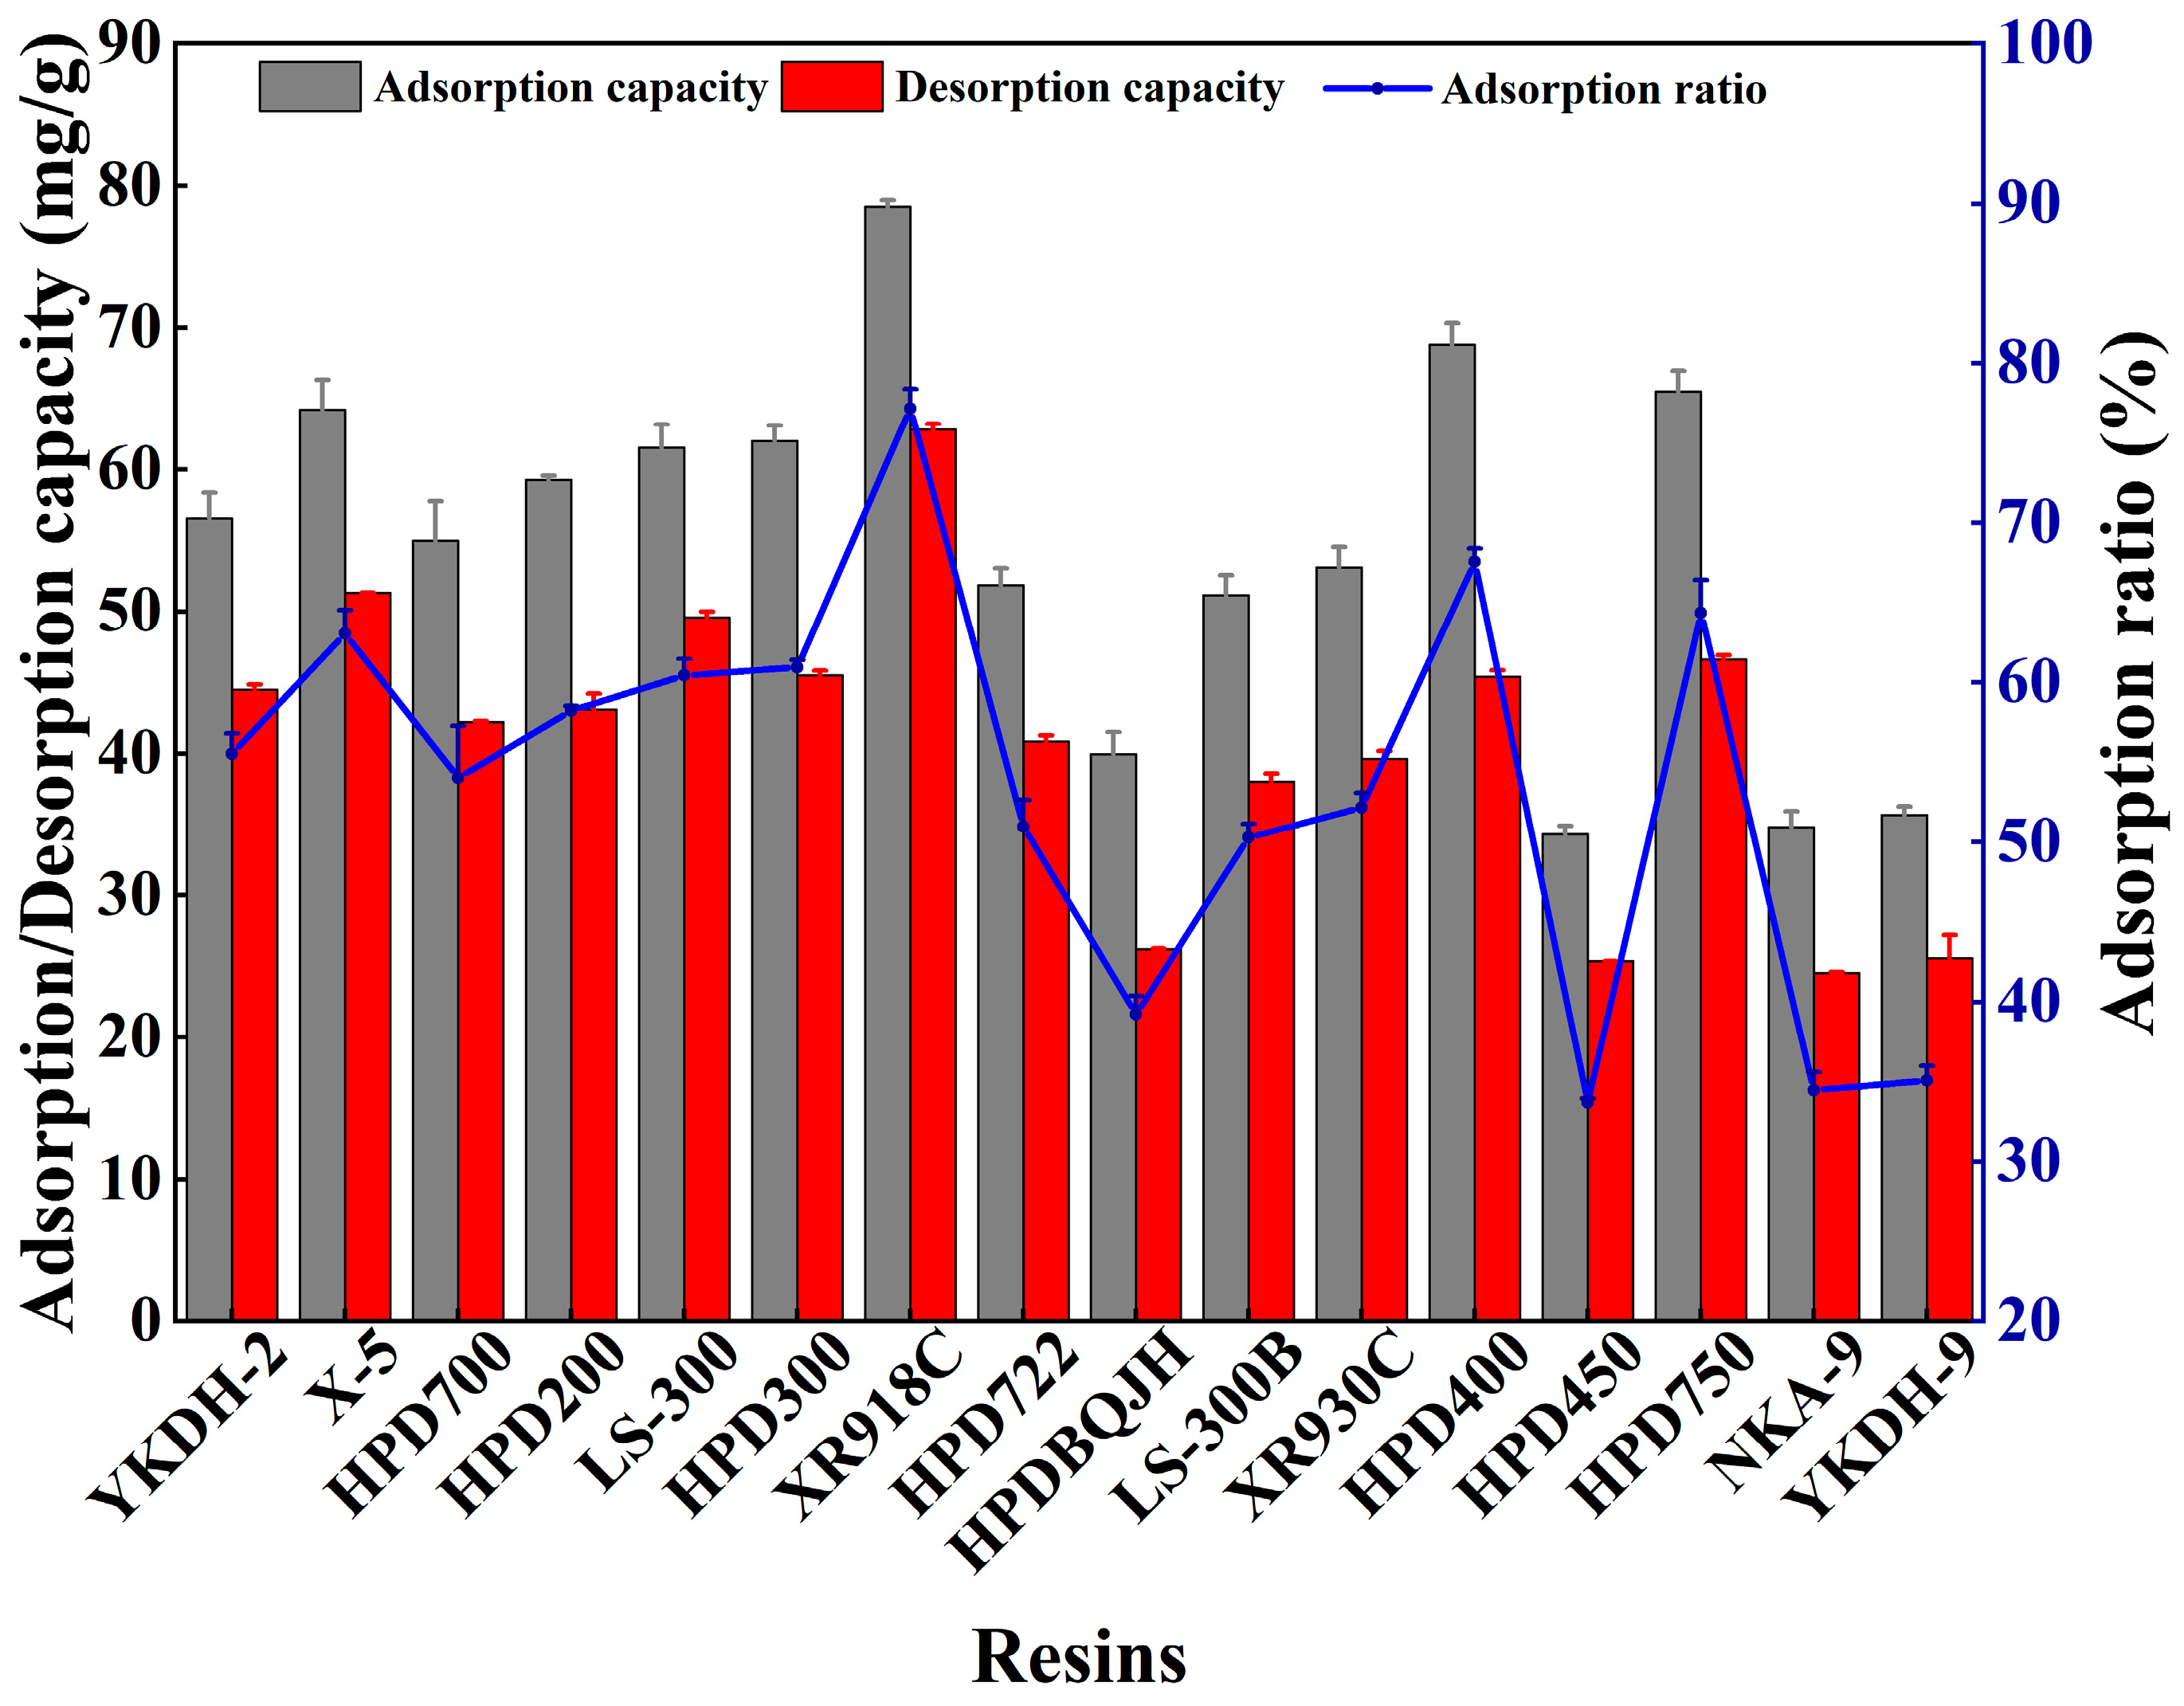
In a 50 mL conical flask, 40 mL of the CCSK aqueous solution and MAR (1.00 g) were combined. Then, the flask was shaken in the thermostat vibrator (ZWY-21-2C; Zhicheng Analysis Instrument Manufacturing Co., Ltd., Shanghai, China) at 180 rpm and 25 °C for 3 h. Subsequently, the MAR was cleaned with distilled water. Under the same conditions, the MAR was then desorbed with 40 mL of 80% ethanol. The most suitable MAR was selected, based on its adsorption and desorption capacity for CCSK alkaloids. The HPLC method described in
Section 2.4 was used to calculate its adsorption and desorption capacity. The relevant calculation formulas (
Equations (S1)–(S4)) are shown in the
Supplementary Materials. XR918C resin was chosen for the next experiment by analyzing the static tests results of 16 MARs.
2.6. Adsorption Kinetics
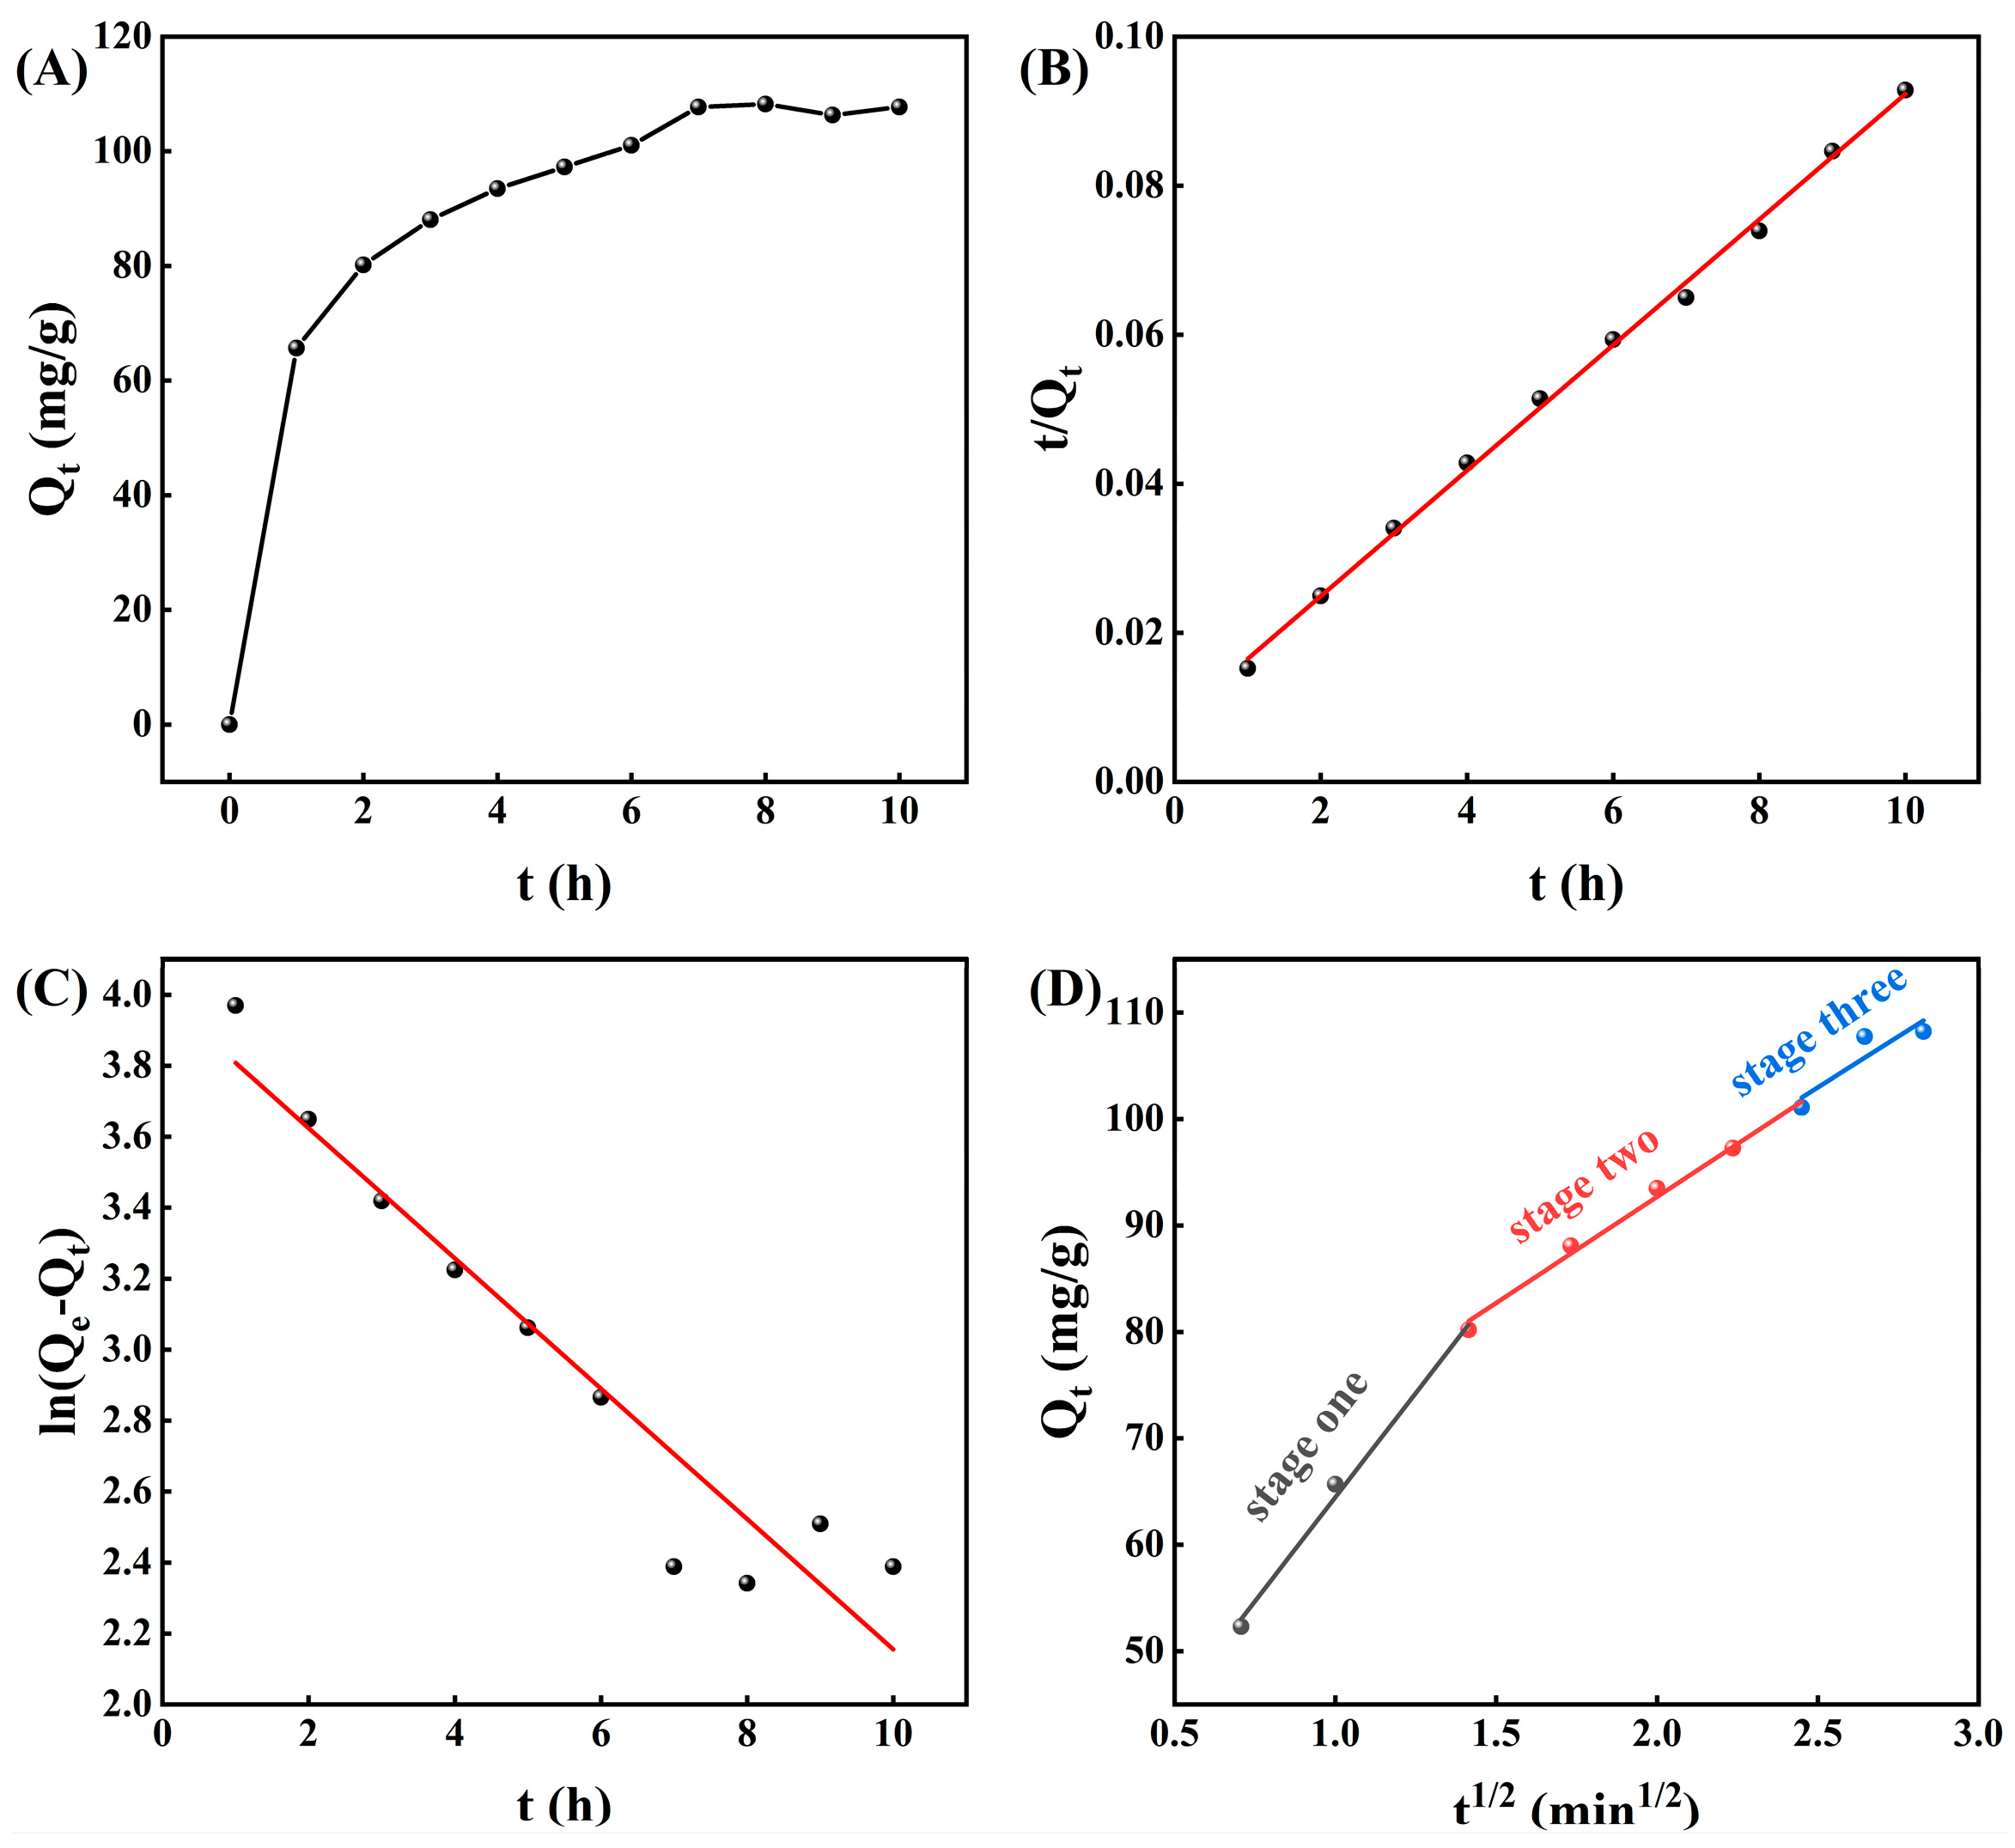
In a 100 mL conical flask, 60 mL of the CCSK aqueous solution was combined with the chosen XR918C resin. The mixture was then shaken at 180 rpm and 25 °C. The alkaloid concentration in the solution was measured using the HPLC method described in
Section 2.4 at the following time intervals: 0, 0.5, 1.0, 2.0, 3.0, 4.0, 5.0, 6.0, 7.0, 8.0, 9.0 and 10.0 h. The relevant calculation formulas (
Equations (S5)–(S7)) of the adsorption kinetic model are shown in the
Supplementary Materials.
2.7. Adsorption Isotherms
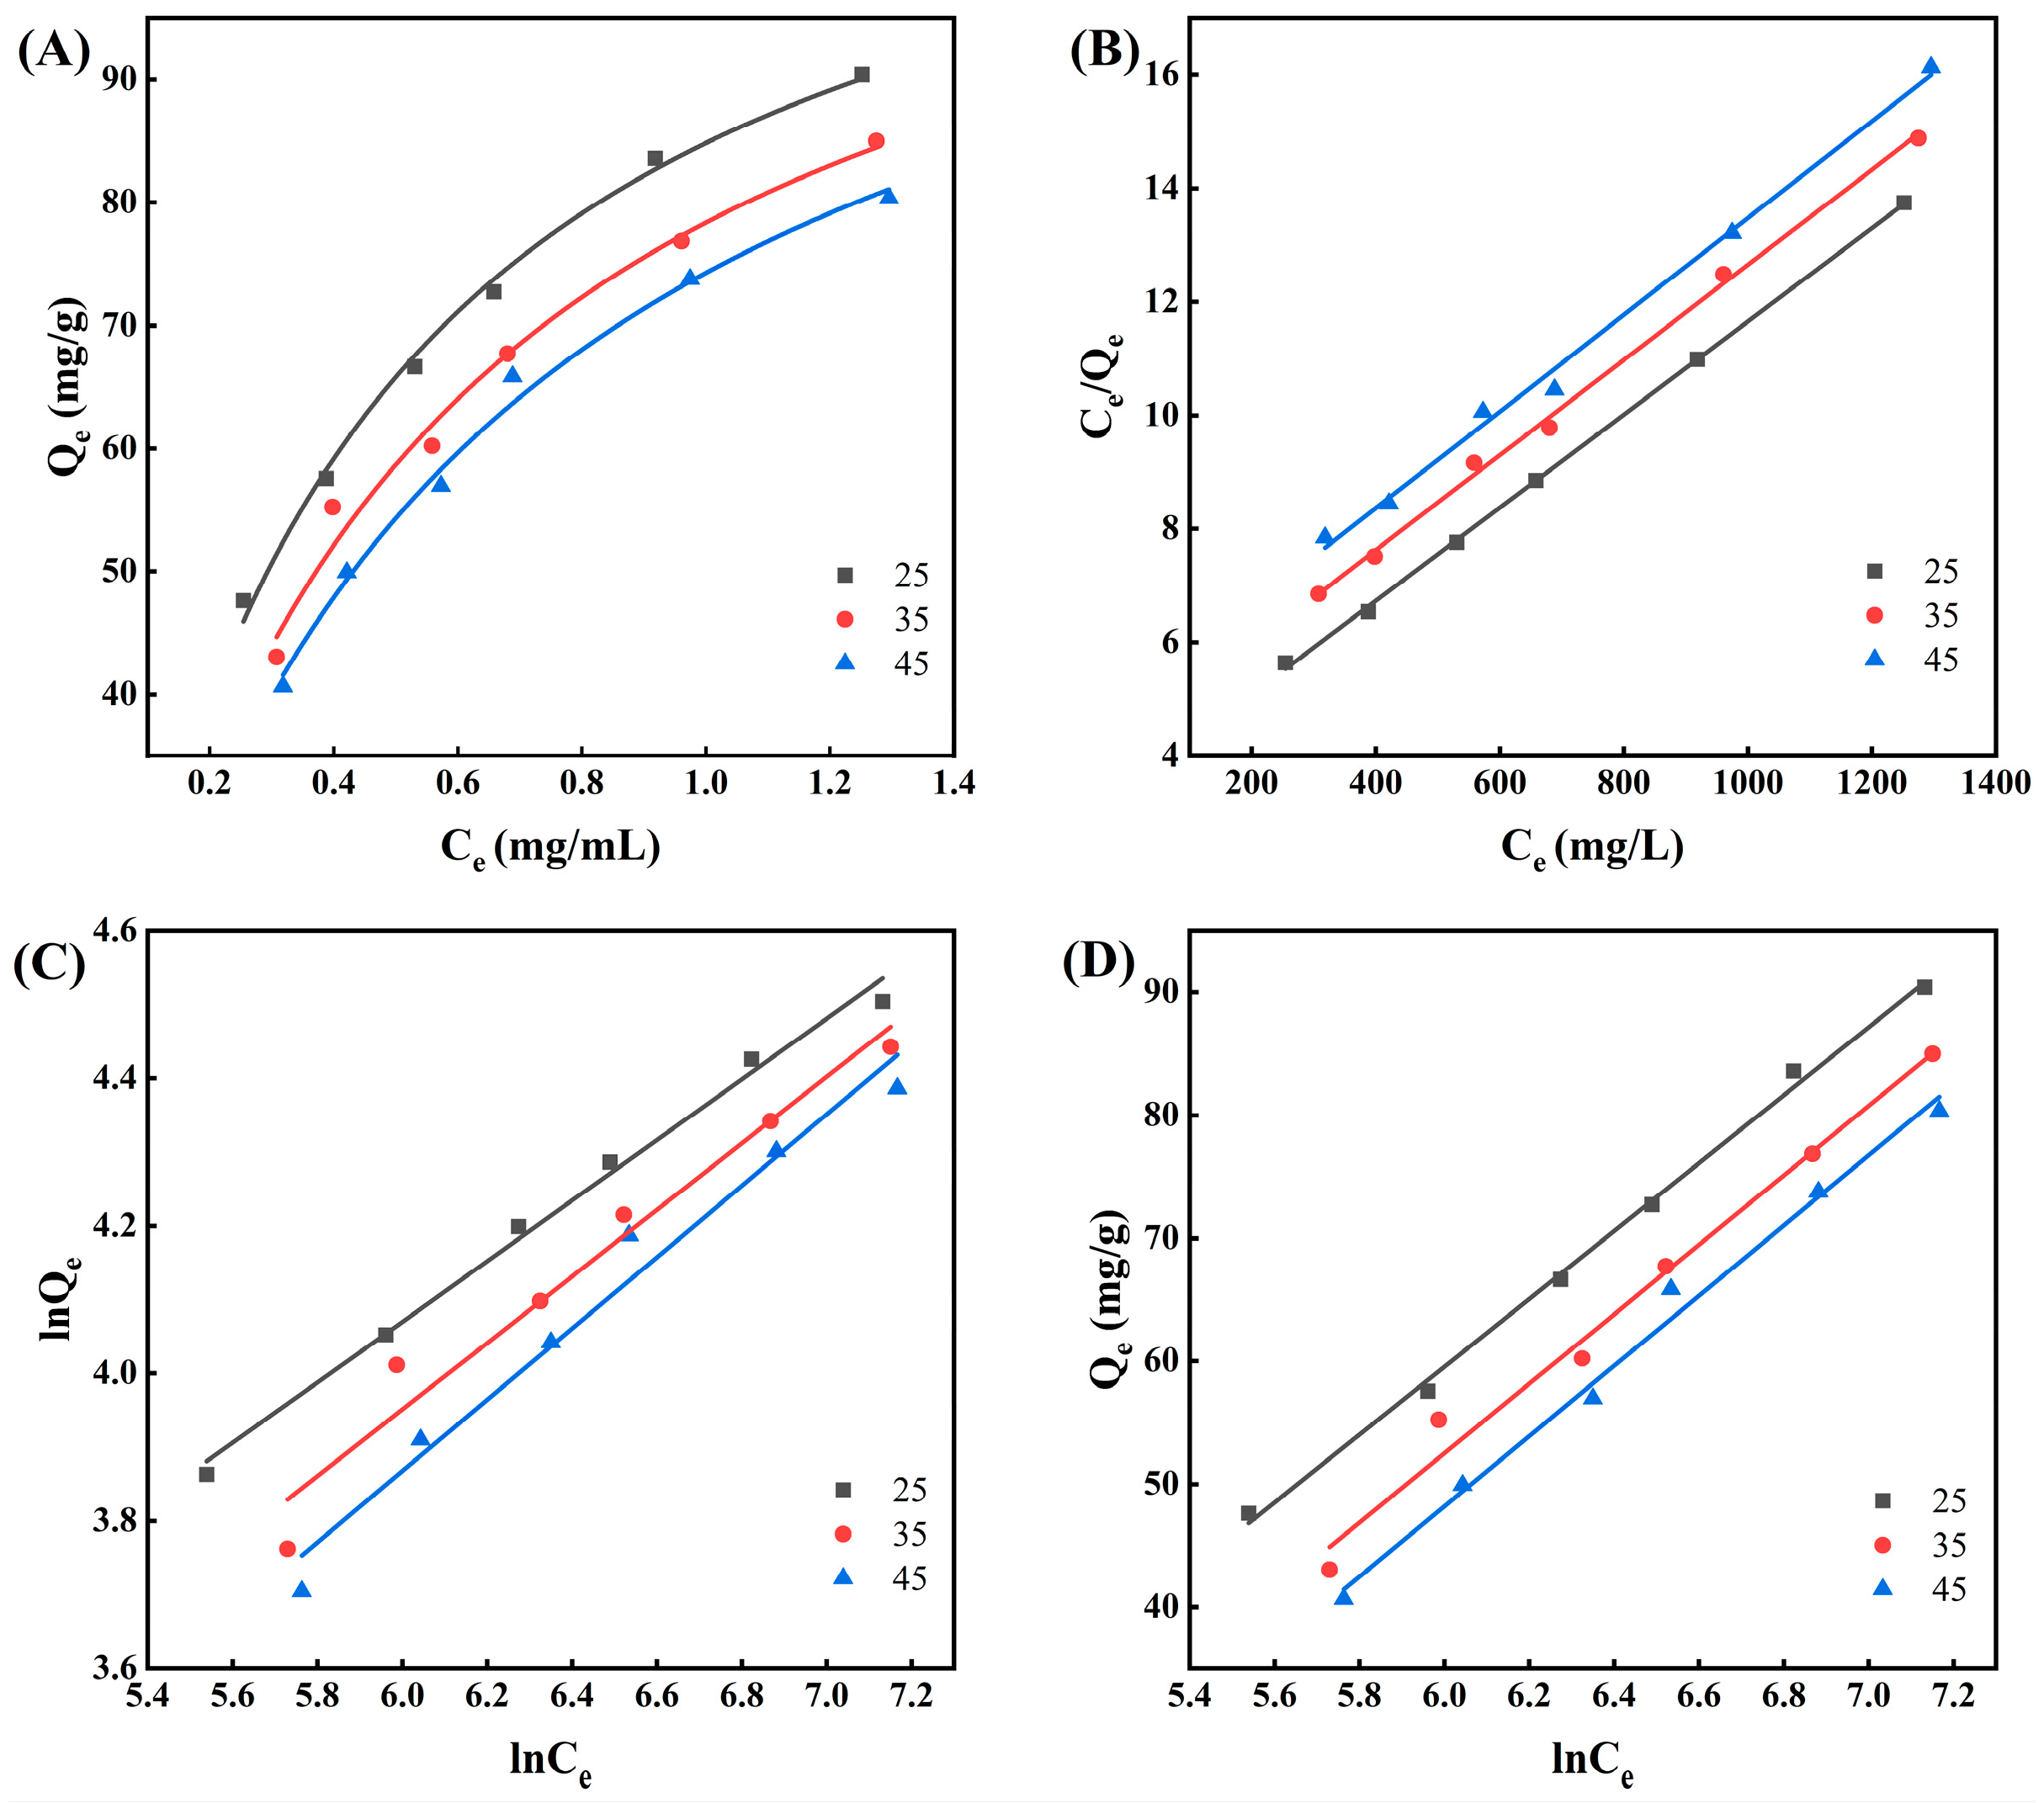
CCSK aqueous solutions (30 mL) with various doses of alkaloids (0.309, 0.638, 0.821, 0.975, 1.31 and 1.65 mg/mL) were combined with the chosen XR918C resin (0.5 g). The conical flasks were then shaken for 3 h at 180 rpm and different temperature (25, 35 and 45 °C). Subsequently, the resin adsorption capacity of alkaloids was calculated. The relevant calculation formulas (
Equations (S8)–(S10)) of the adsorption isotherms model are shown in the
Supplementary Materials.
2.8. Calculation of Adsorption Thermodynamic Parameters
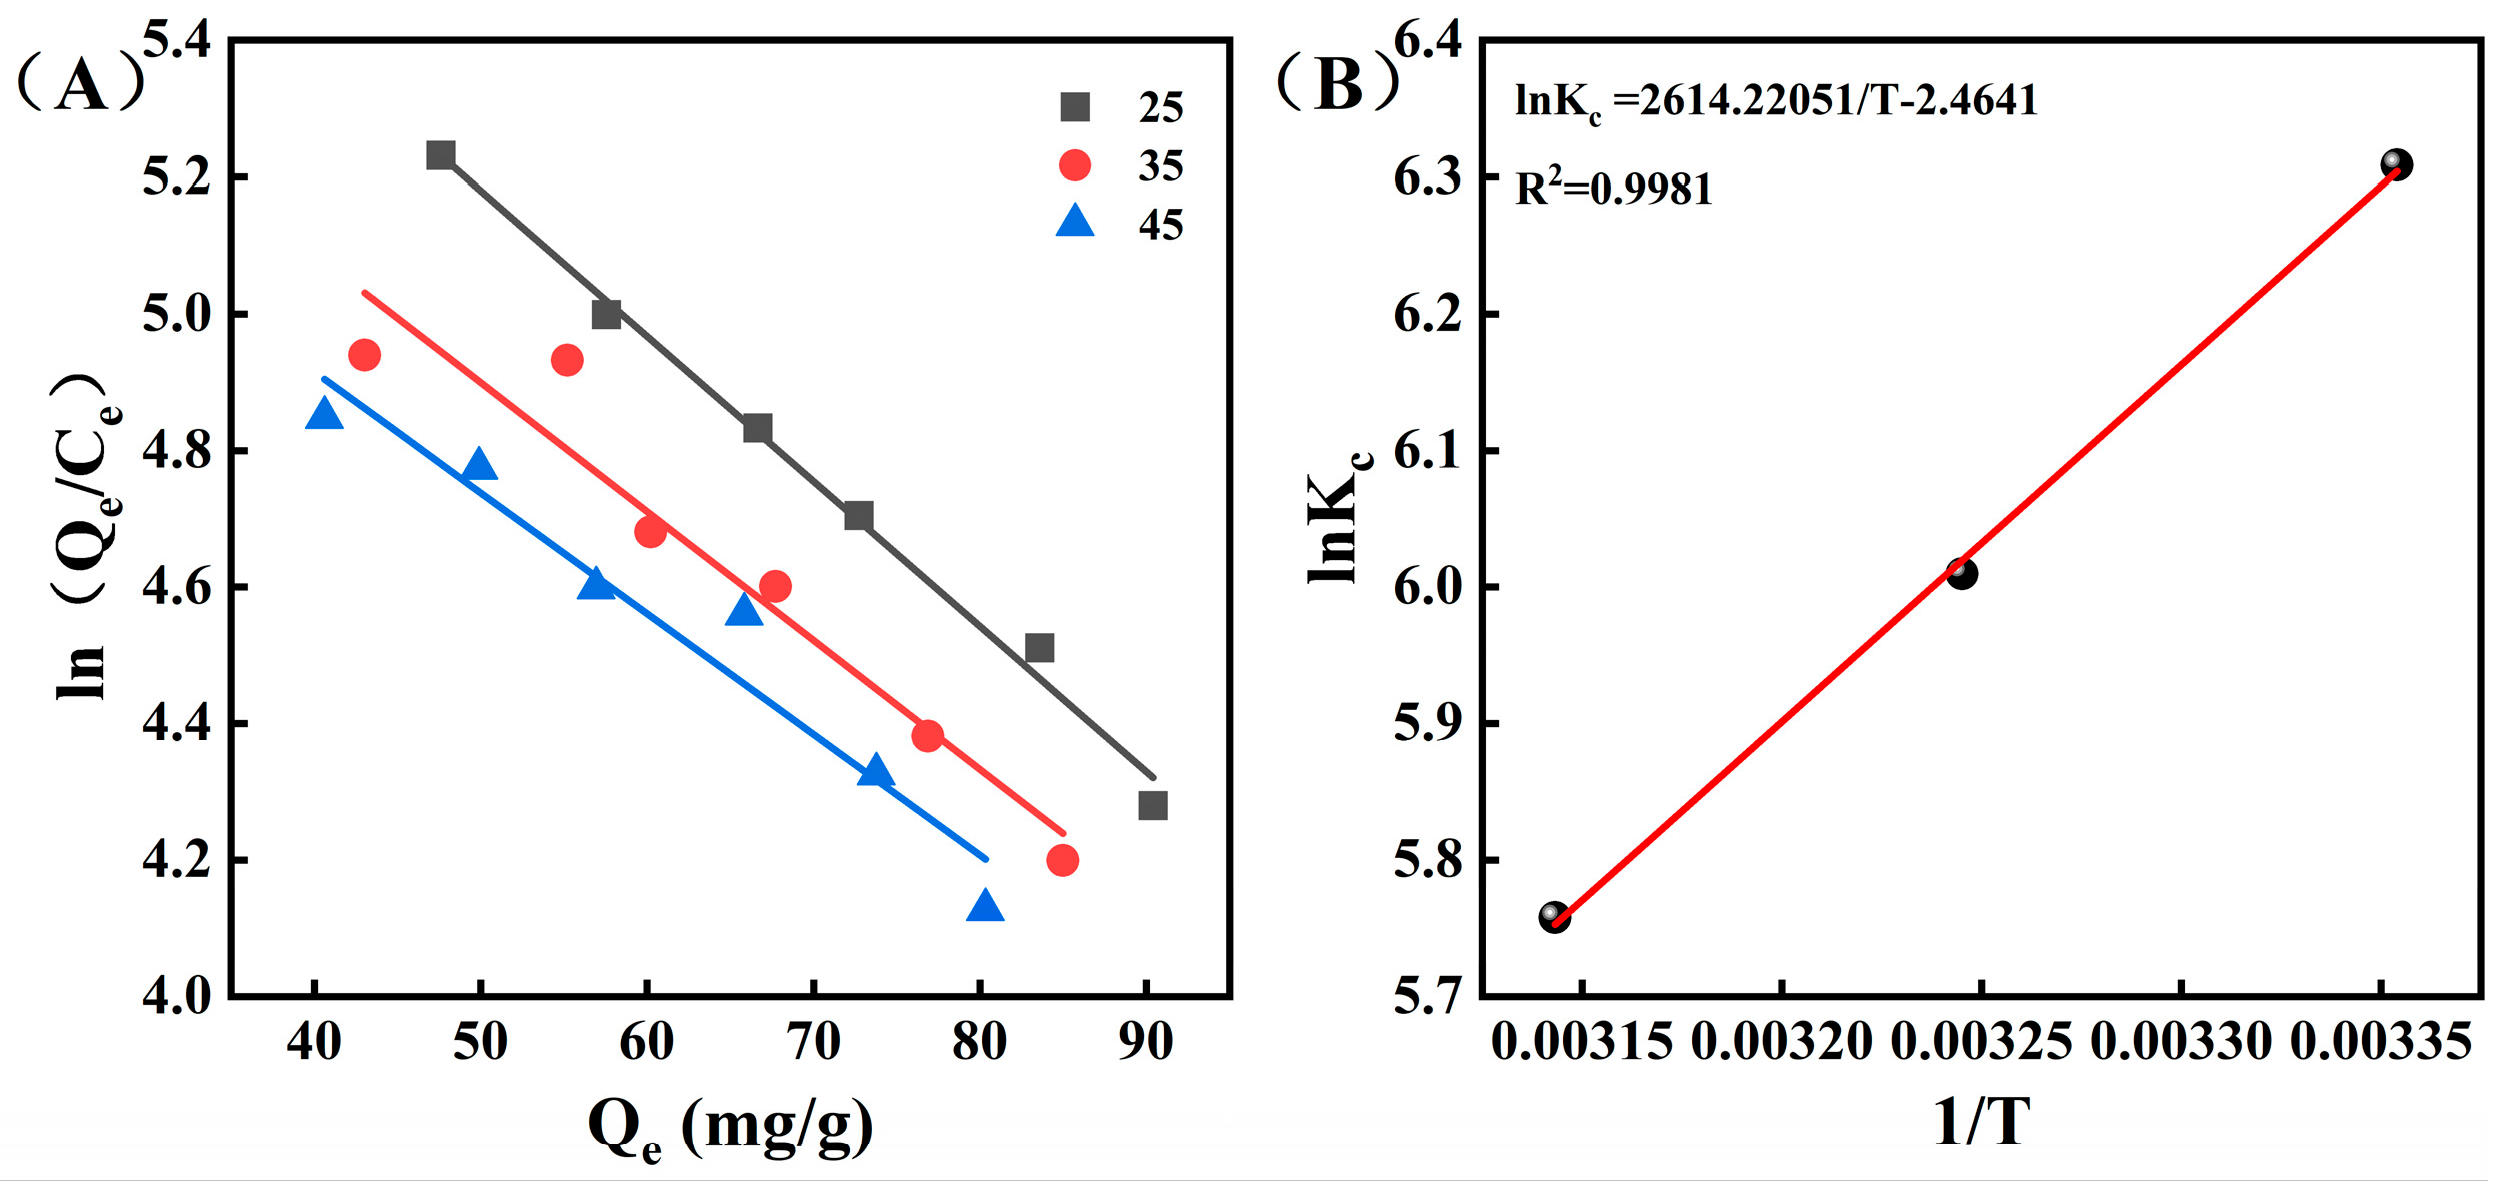
To analyze the adsorption process of CCSK alkaloids onto XR918C resin from a thermodynamic perspective, a comprehensive thermodynamic analysis was conducted, encompassing the calculation of three pivotal parameters (ΔG, ΔH and ΔS). The relevant calculation formulas (
Equations (S11) and (S12)) of adsorption thermodynamic parameters are shown in the
Supplementary Materials.
2.9. Dynamic Adsorption/Desorption Tests
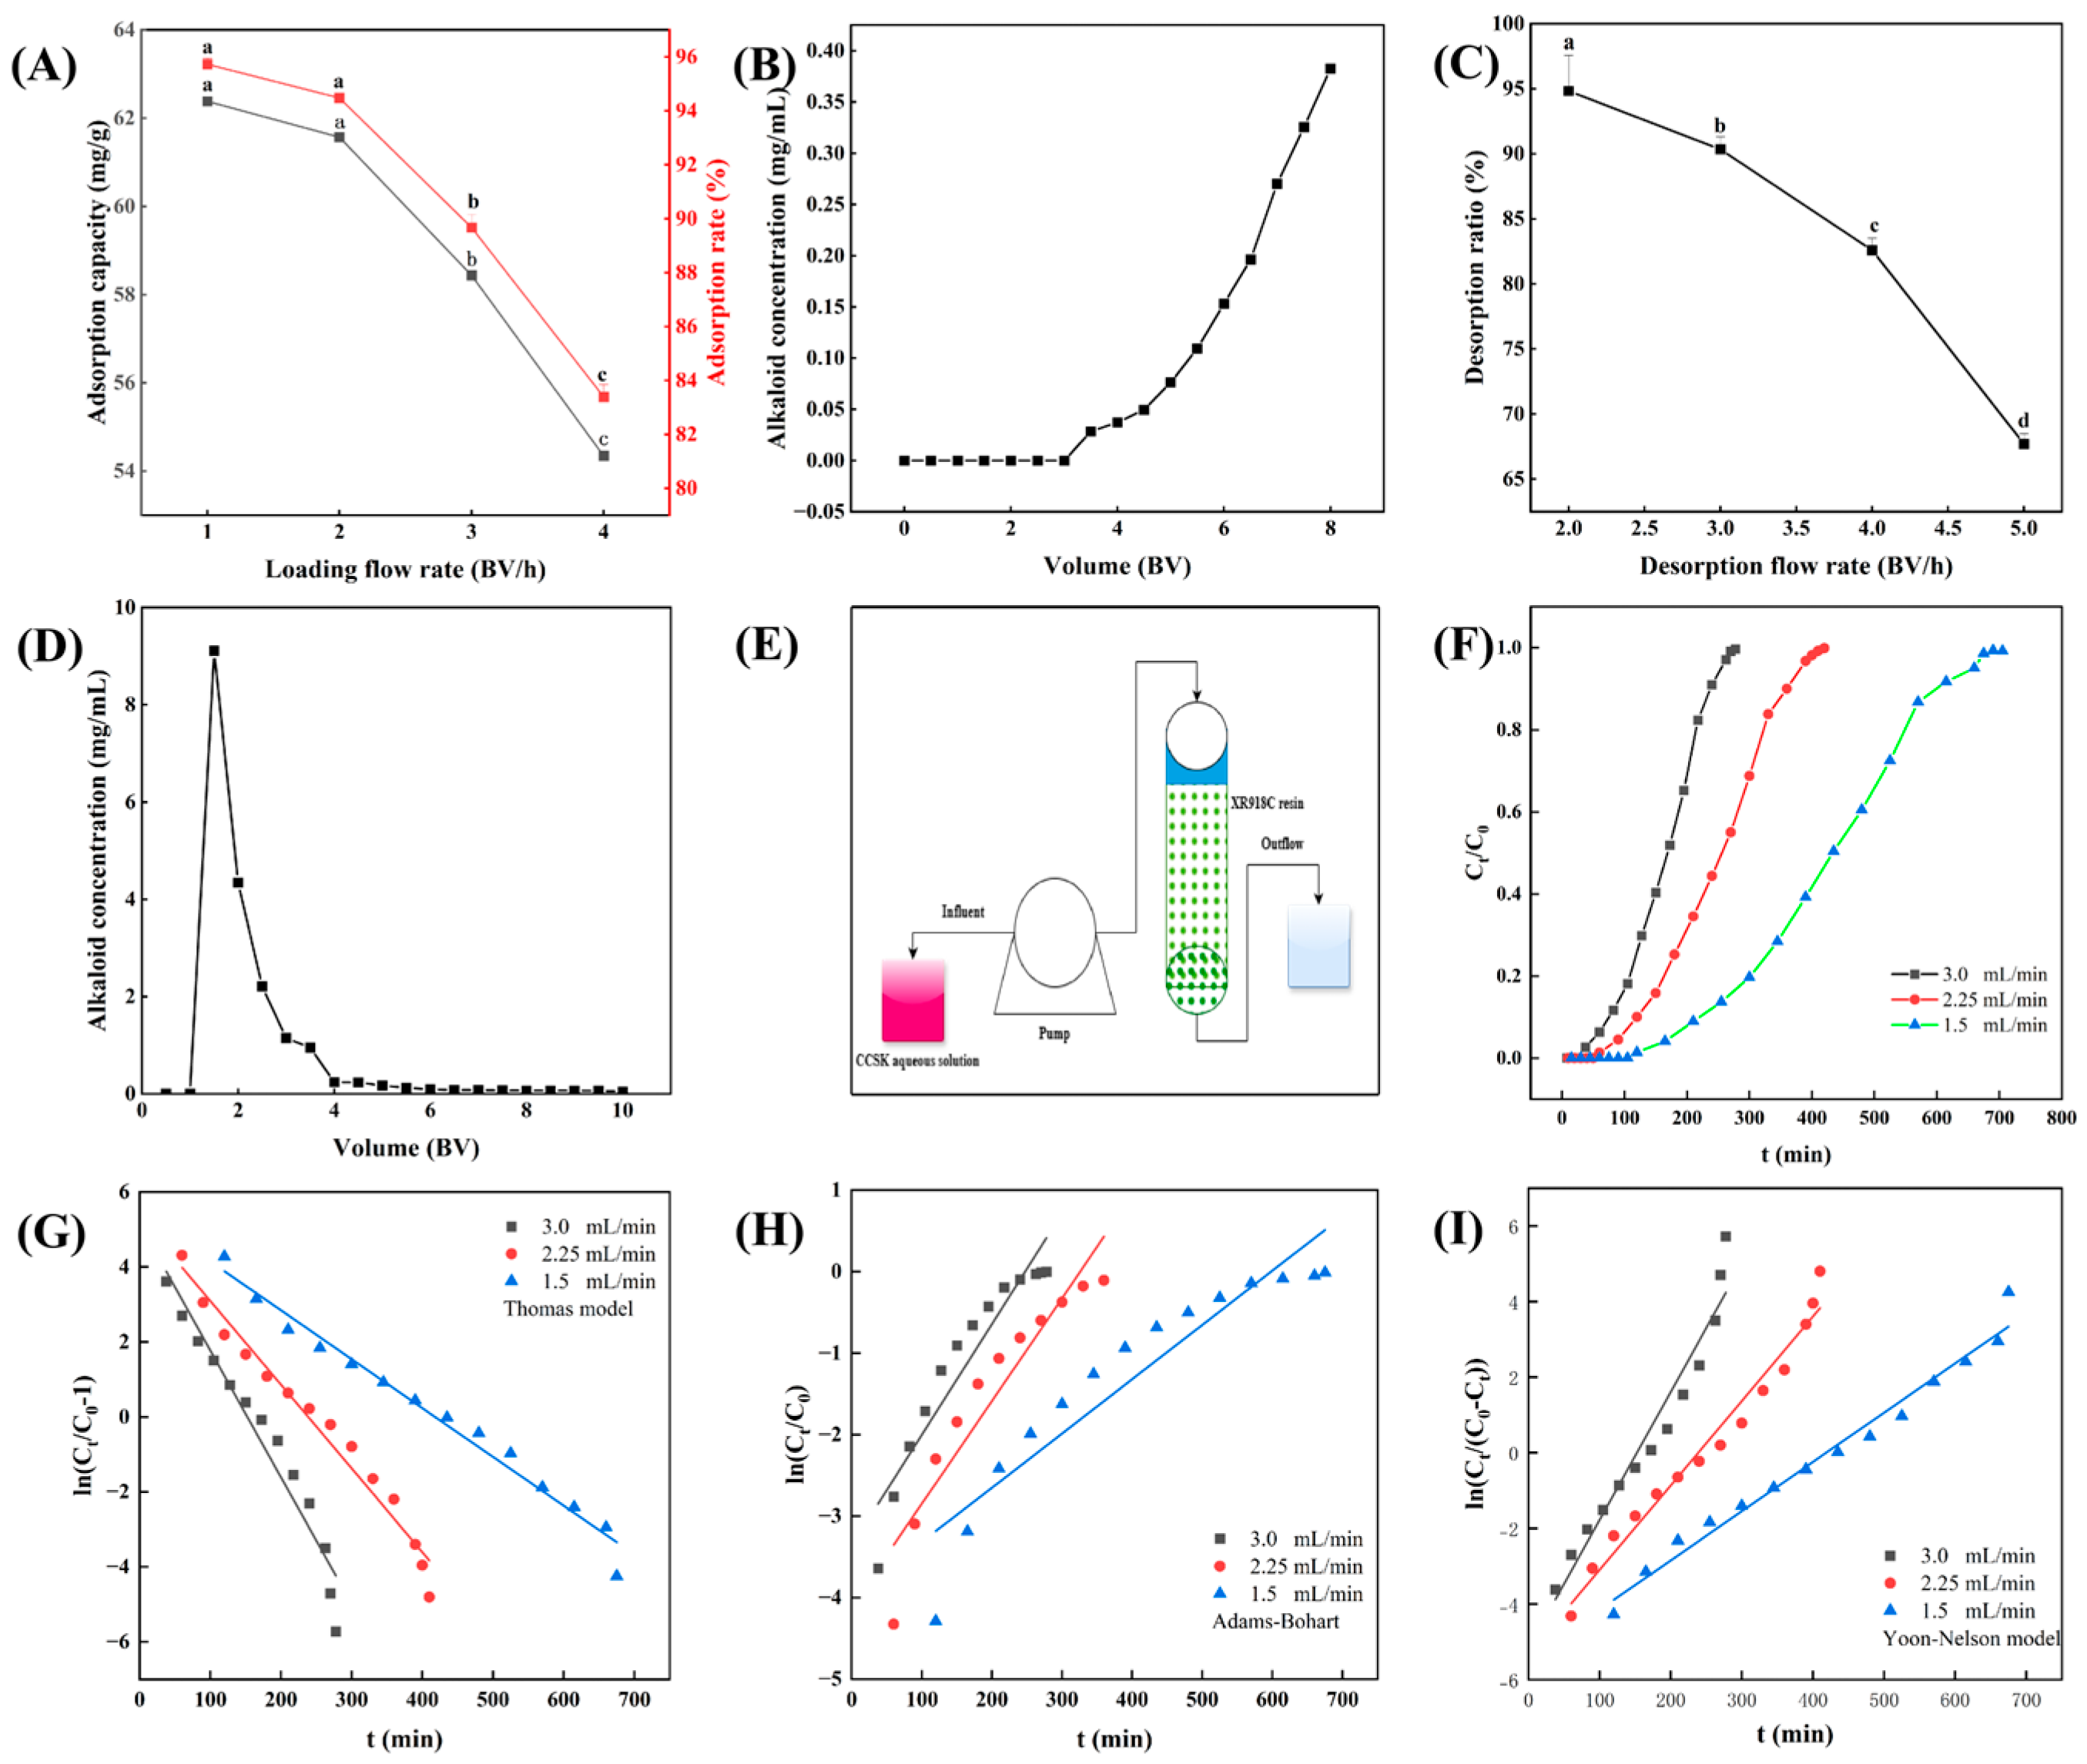
To ascertain the most effective parameters for the purpose of enriching alkaloids from the CCSK aqueous solution, a series of dynamic adsorption and desorption tests were conducted. These tests were carried out using a chromatographic column with a bore diameter of 16 mm and an extent of 300 mm. The chromatographic pillar was filled with pretreated resin, which had a height-to-diameter ratio of 14 (1 BV was 45 mL). To ascertain the impact of the flow rate on the efficacy of adsorption, the CCSK aqueous solution (2.45 mg/mL) was subjected to the chromatography column at a rate of 1 to 4 BV/h.
To study the impact of the desorption rate on desorption efficiency, desorption experiments of sample-laden columns at three different flow rates (2.0, 3.0 and 4.0 BV/h) were performed with the best eluent. The dynamic curve of C
t/C
0 over time was plotted, and the dynamic adsorption capacity of XR918C resin for CCSK alkaloids at various flow rates was calculated. Additionally, Thomas, Adams–Board and Yoon–Nelson dynamic models were used to fit the dynamic breakthrough data [
25]. The calculation formulas were as follows Equations (1)–(4):
where C
0 (mg/mL) and C
t (mg/mL) represent the concentration of CCSK alkaloids at initial and time t; K
TH (mL/mg/min), K
AB (mL/mg/min) and K
Y (min
−1) are the constants of reaction rates; Q
e represents the maximum adsorption amount of CCSK alkaloid; m (g) represents mass of adsorbent; Q (mL/min) and ν (cm/min) represent flow rate of CCSK alkaloid solutions; N
0 (mg/mL) represents the adsorption amount of packed-sorbent per unit volume; h (cm) represents bed depth of sorbent; τ is the moment at which C
t of CCSK alkaloid was up to 50% of C
0; and V (mL) represents the chromatographic pillar volume.
2.10. Scale-Up of Resin Column Chromatography
A 10-fold scale-up in the processing volume of the dynamic enrichment test was performed under optimum enrichment conditions (mentioned in
Section 2.9). The test was carried out using a laboratory-scale column with 3.5 cm inner diameter and 60 cm length, which was filled with pretreated XR918C resin. The diameter-to-length ratio of the fixed bed and the experimental conditions were the same as in
Section 2.9.
2.11. Reusability Evaluation of XR918C Resin
According to Wang et al. [
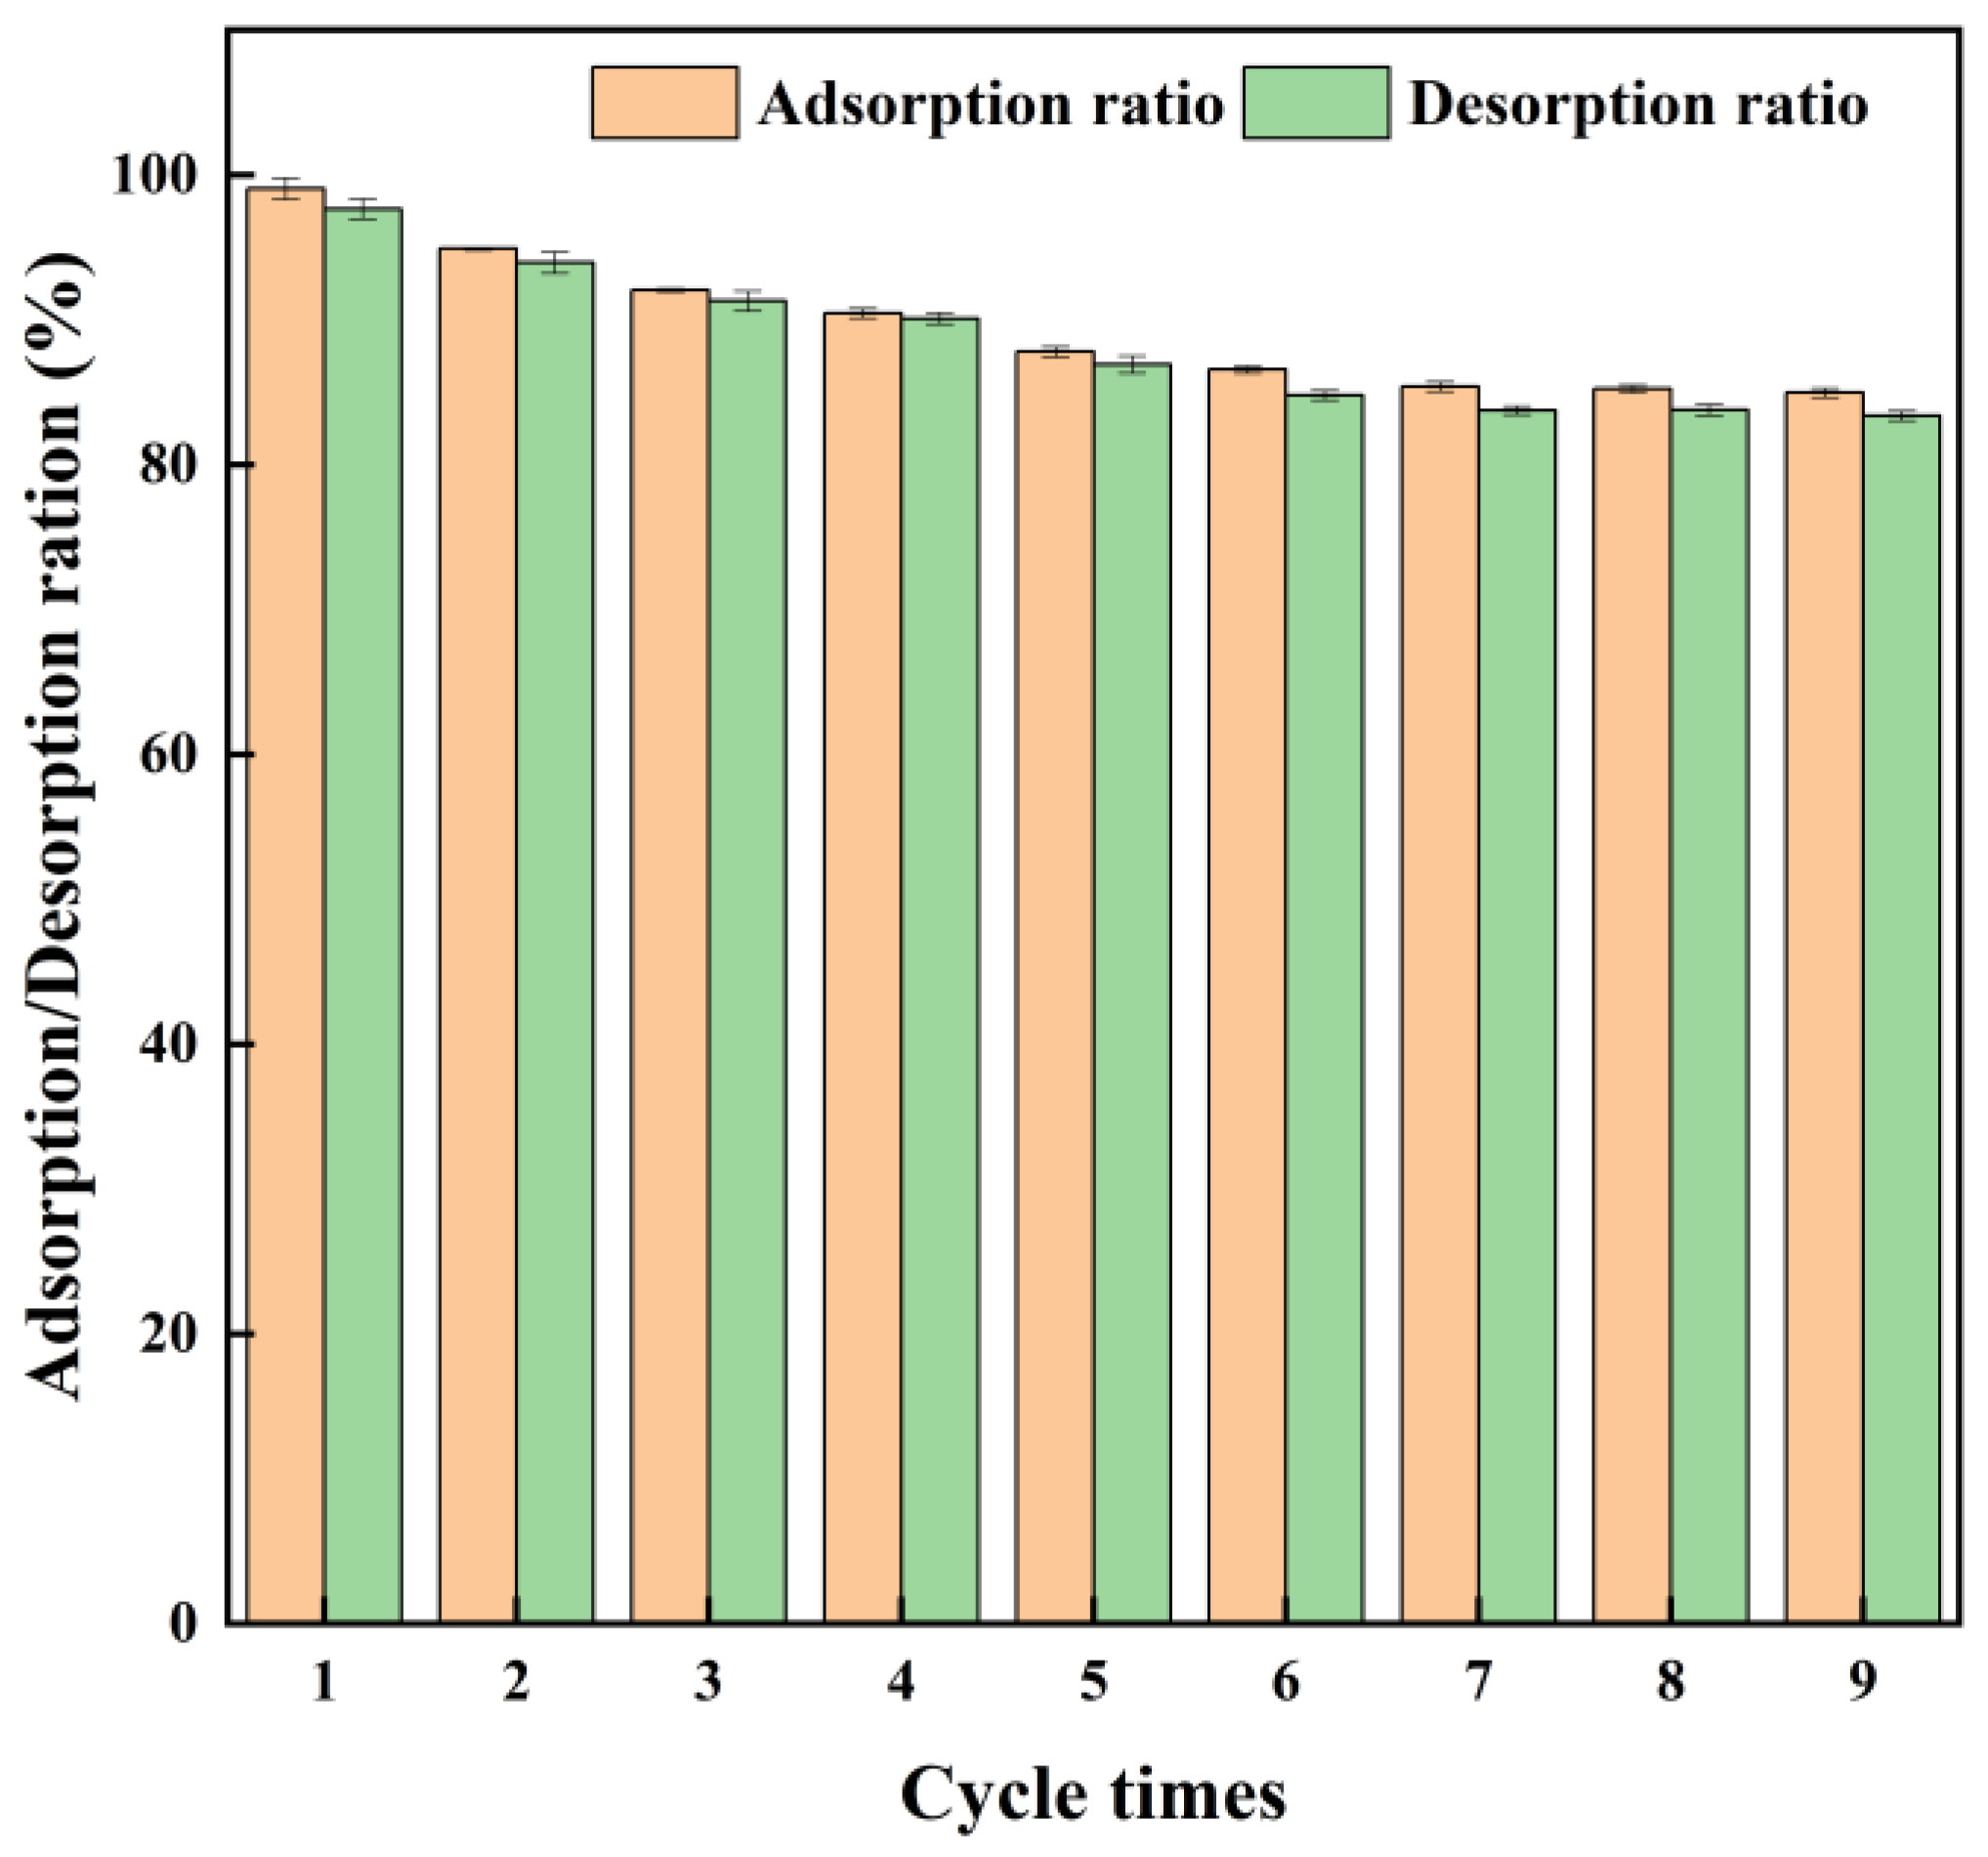
26], the reusability of XR918C resin was evaluated under the optimal conditions through repeated adsorption and desorption experiments in CCSK alkaloids. Desorption was performed using 80% anhydrous ethanol, after which the resin was washed with distilled water until the alcohol concentration measured by an alcoholometer was zero. The adsorption and desorption experiments were then repeated nine times.
2.12. Determination of Antioxidant Activity of CCSK Alkaloids Before and After Enrichment
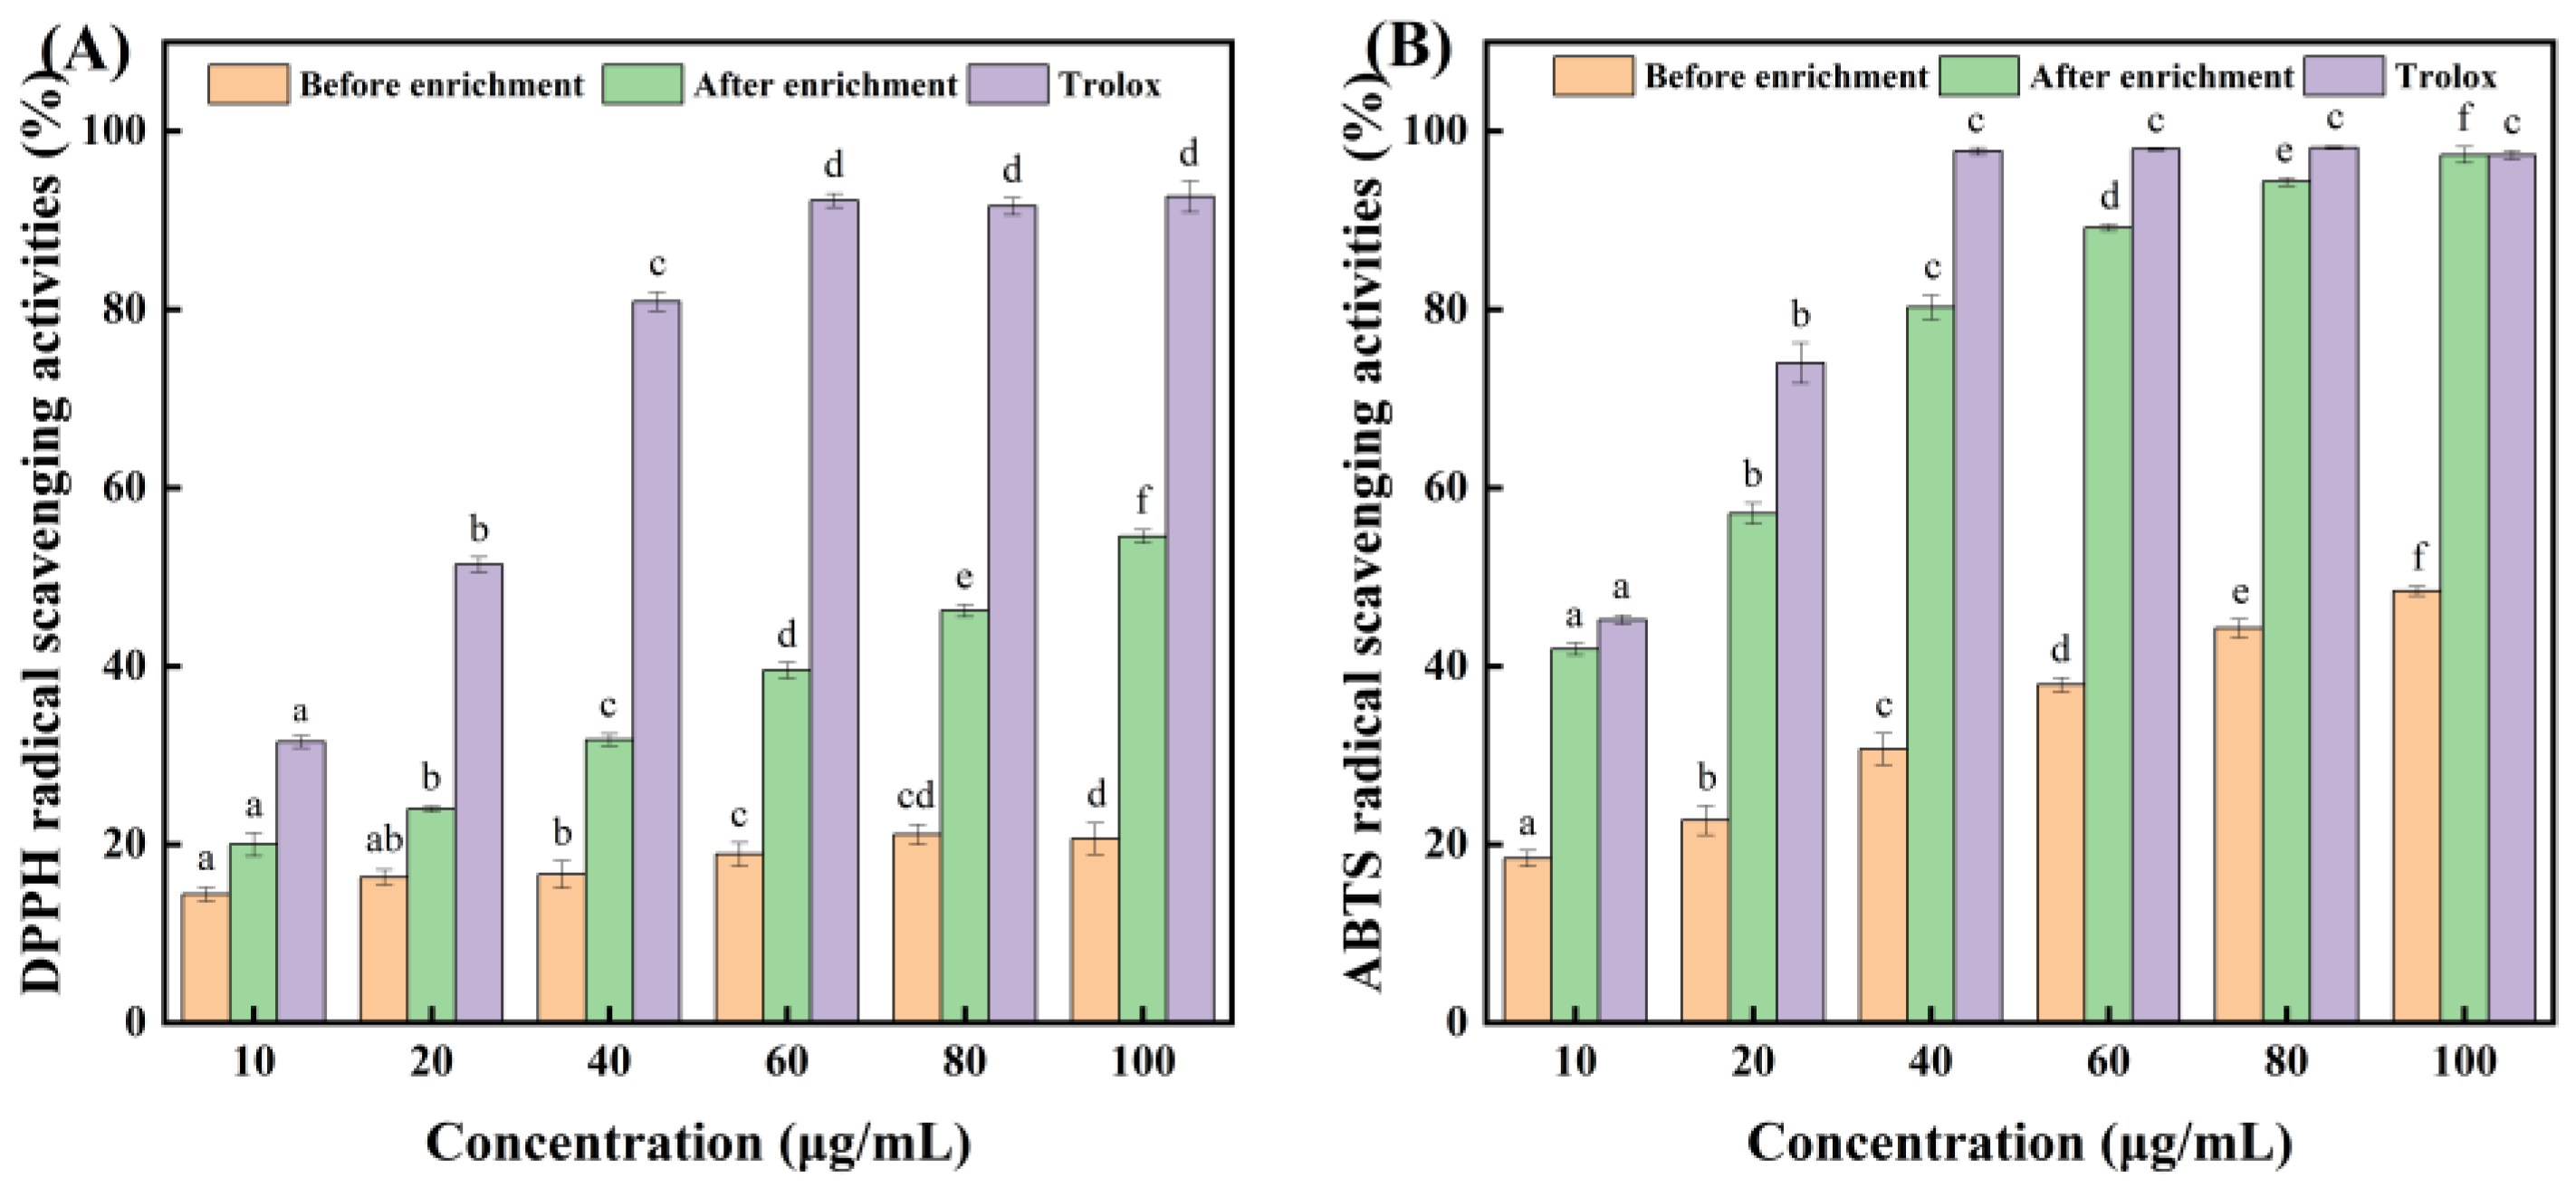
The antioxidant activity of CCSK alkaloids before and after enrichment was evaluated using DPPH and ABTS free radical scavenging assays [
27].
2.12.1. DPPH Radical Scavenging Activity
Briefly, the sample solutions at different CCSK alkaloid concentrations (10, 20, 40, 60, 80 and 100 μg/mL) were prepared by dissolving the freeze-dried powder in absolute ethanol. Then, 150 μL of DPPH solution (40 μg/mL, dissolved in absolute ethanol) was mixed with 50 μL of the sample solution. The mixture was then incubated in the dark at room temperature for 30 min, after which its absorbance (A
1) was measured at a wavelength of 517 nm using a microplate reader (ReadMax 1900; Flash Spectrum Biological Technology Co., Ltd., Shanghai, China). The absorbance of a mixture (A
0) of 150 μL of DPPH solution and 50 μL of distilled water and the absorbance of a mixture (A
2) of 150 μL of absolute ethanol and 50 μL of sample solution were measured under the same conditions. The DPPH radical scavenging activity (%) of the sample was then calculated using the following formula:
2.12.2. ABTS Radical Scavenging Activity
A solution of 7 mM ABTS was mixed with a solution of 2.45 mM potassium persulfate (K
2S
2O
8) in the dark at room temperature for 12–16 h to produce an ABTS free radical solution. Then, the obtained ABTS free radical solution was diluted with ethanol until its absorbance at 734 nm reached 0.70 ± 0.02 (TU-1950; Purkinje General Instrument Co., Beijing, China). Next, 150 μL of the ABTS radical solution was mixed with 50 μL of the sample solution at various concentrations (10, 20, 40, 60, 80 and 100 μg/mL; prepared as in
Section 2.12.1). After incubating the mixture in the dark at room temperature for 30 min, the absorbance (A
1) was measured at 734 nm. The absorbance of the mixed solution (A
2) containing 150 μL of distilled water and 50 μL of the sample solution and of the mixed solution (A
0) containing 150 μL of the ABTS free radical solution and 50 μL of distilled water were measured under the same conditions. The ABTS free radical scavenging activity of the sample was calculated according to the following formula:
2.13. Statistical Analysis
All data were presented as the mean ± standard deviation (SD) from at least three replicate experiments. Differences between groups were assessed using one-way ANOVA and Tukey’s test (SPSS Statistics 22 software). p < 0.05 was considered statistically significant.




 ,
,