3.2. Reactor-Aware Model Comparison
Under LORO-CV, SVR-RBF obtained the lowest pooled RMSE, therefore, SVR-RBF was selected according to the prespecified primary criterion. Gradient boosting, KNN, random forest, and decision tree produced similar pooled R
2 values (
Table 3).
A factor contributing to the predictive performance is the highly controlled nature of the experimental dataset. Unlike industrial anaerobic digesters, where feedstock variability, environmental disturbances, operational fluctuations, and sensor uncertainty introduce substantial noise, the present experiments were conducted under controlled laboratory conditions using well-defined operating parameters. Consequently, the experimental variability was considerably lower, allowing the ML algorithms to identify relationships among digestion time, substrate composition, and cumulative methane production. Similar observations have been reported in laboratory-scale methane-yield datasets that frequently produce substantially higher prediction accuracies than heterogeneous industrial datasets because the dominant process variables can be measured with greater precision and fewer uncontrolled disturbances [
14].
The predictive performance achieved in this study should not be attributed exclusively to the controlled laboratory conditions. Rather, it likely reflects a combination of experimental and modelling factors. The use of standardized batch conditions reduced uncontrolled sources of variability, while the high temporal resolution of methane monitoring provided detailed information on the evolution of cumulative methane production. In addition, digestion time and substrate composition represent process-relevant variables with systematic relationships to methane accumulation, allowing the ML models to capture the nonlinear response patterns present in the experimental data. Previous studies have demonstrated the ability of machine-learning approaches to model the complex nonlinear relationships governing anaerobic digestion and have shown that predictive performance depends on the characteristics of the input data, operating conditions, and model configuration [
21].
Methodological aspects should also be considered when comparing performance across studies. Model evaluation was performed using LORO-CV, in which complete reactor trajectories were withheld during validation. Thus, the reported performance represents prediction of unseen reactor trajectories rather than interpolation among timestamped observations from reactors already represented during training. Furthermore, predictor standardization was incorporated within each training fold. Consequently, differences between the performance obtained here and the values reported for more heterogeneous anaerobic digestion datasets likely arise from the combined effects of experimental conditions, dataset characteristics, process variability, and modelling and validation strategies, rather than from laboratory control alone.
Reactor-level paired testing did not establish that SVR-RBF was statistically superior to the alternative models. Although the unadjusted Wilcoxon
p-values for comparisons with the linear, ridge, and several MLP models were 0.0156, the smallest Holm-adjusted
p-value was 0.2344 (
Table 4). None of the 15 comparisons remained significant at α = 0.05 after multiplicity correction. Thus, SVR-RBF was selected because it minimized the prespecified pooled LORO-CV RMSE, not because statistical superiority over all alternative algorithms was demonstrated.
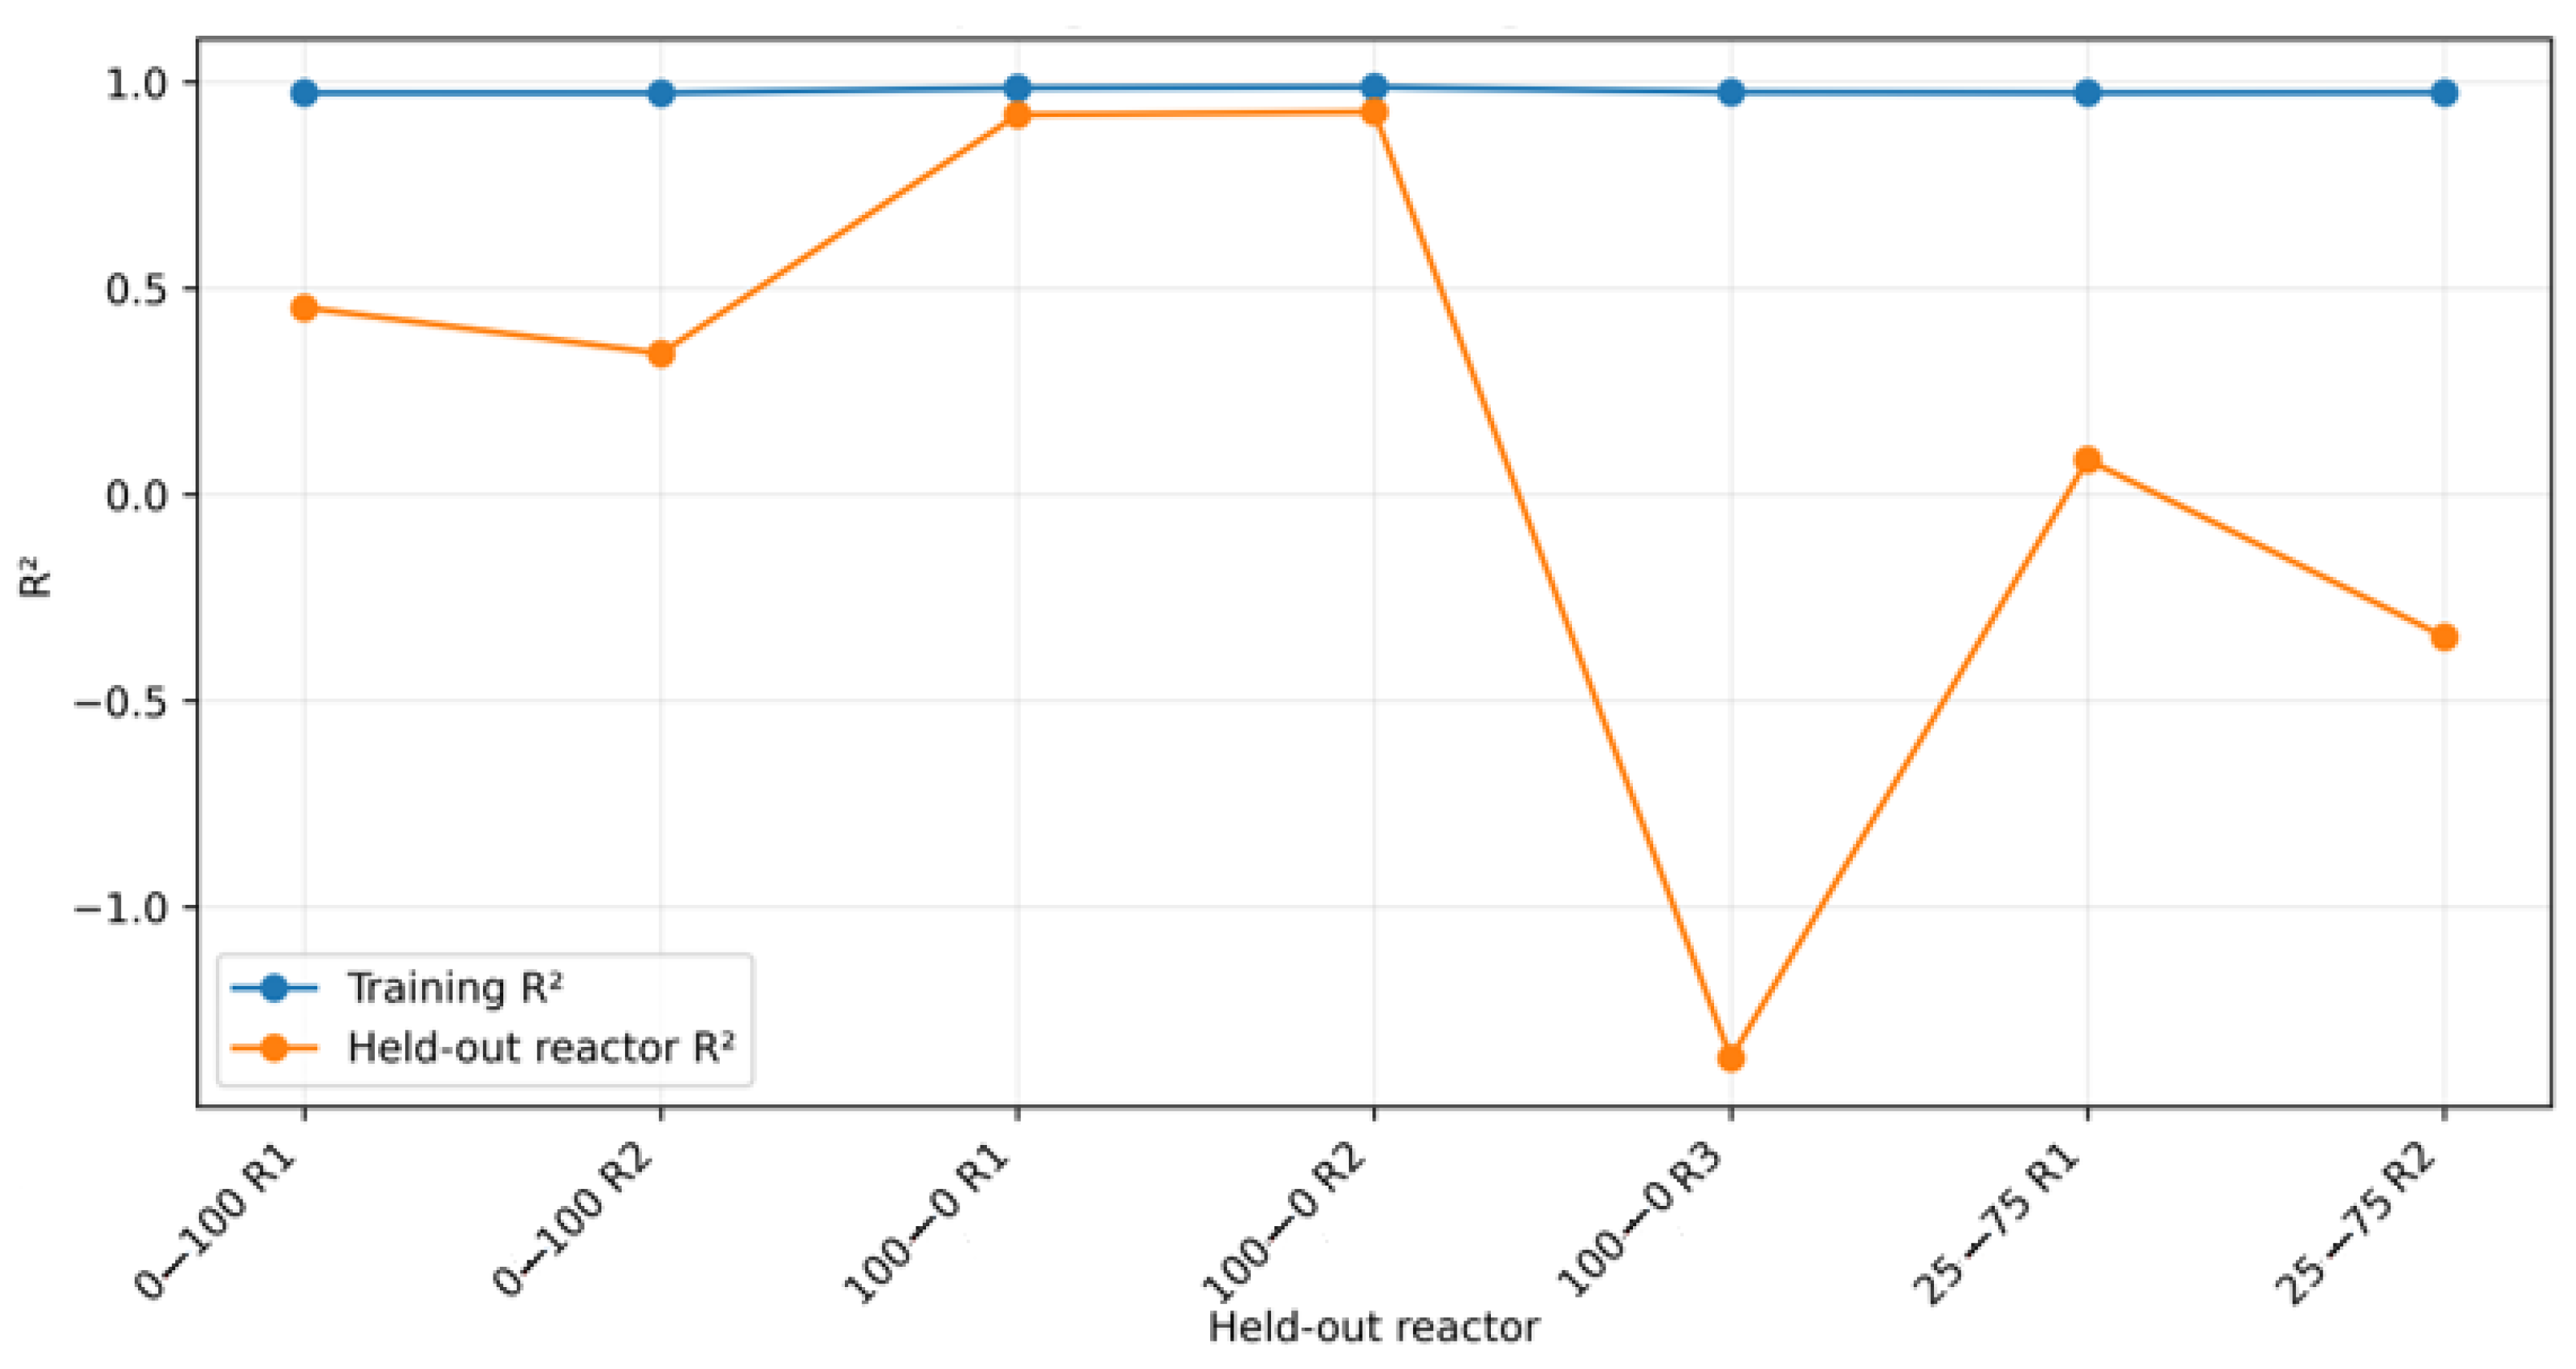
The group-aware generalization diagnostic for the selected SVR-RBF indicates that the pooled LORO-CV performance does not imply uniform predictive accuracy for every individual reactor. Although SVR-RBF achieved strong pooled LORO-CV performance, its generalization varied among reactors. The diagnostic indicates difficulty reproducing some low-variability or truncated trajectories, whereas the complete banana-peel reactors were predicted more accurately.
3.3. Grouped Generalization and SVR Sensitivity
Although SVR-RBF achieved a pooled LORO-CV R
2 of 0.9482, its held-out-reactor R
2 values varied from −1.366 to 0.928 (
Figure 2). These results are not mathematically contradictory because the two calculations evaluate different aspects of predictive performance. The pooled R
2 was calculated after concatenating predictions from all held-out reactors and therefore reflects the model’s ability to reproduce the overall variation among cumulative methane production trajectories, including the large differences in response magnitude among substrate compositions. In contrast, the reactor-specific R
2 was calculated using only the variation within each individual trajectory. Consequently, reactors exhibiting an early plateau or a narrow cumulative methane production range had a relatively small total sum of squares, meaning that even modest absolute prediction errors could produce R
2 values close to zero or below zero. A negative R
2 indicates that, for that particular reactor, the prediction errors were greater than those obtained by using the reactor mean as a constant prediction; it does not indicate an invalid calculation [
22].
The highest held-out R
2 values were obtained for the two complete banana-peel-only reactors (0.921 and 0.928), whose trajectories covered a broad methane-production range and included the complete sigmoidal development of the process. Conversely, the particularly low value for 100–0 R3 (R
2 = −1.366) can be attributed partly to its truncated trajectory, which did not cover the extended digestion period or cumulative methane production scale observed in the other banana-peel-only reactors. This interpretation is consistent with the known sensitivity of R
2 to the variance of the response variable: when the observed range is narrow, relatively small absolute prediction errors can produce low or negative R
2 values, because the residual sum of squares may exceed the total sum of squares [
22].
The lower R
2 values of the molasses-only and mixed-substrate reactors may likewise reflect their comparatively narrow response ranges, unequal trajectory durations, and differences between replicate trajectories. In addition, methane-production profiles in anaerobic digestion can vary among nominally identical reactors because of differences in substrate degradability, inoculum activity, pH, alkalinity, volatile fatty acids, microbial adaptation, and other biochemical conditions [
23,
24]. Reviews of machine-learning applications in anaerobic digestion identify limited datasets, heterogeneous operating conditions, and insufficient external validation as important barriers to model generalization [
23]. Another study reported higher machine-learning performance during training than during validation with unseen anaerobic-digestion data and attributed part of this difference to feedstock characteristics, temporal variability, and incomplete substrate information [
24].
The grouped diagnostic therefore supports the use of LORO-CV rather than invalidating the selected model. Cross-validation strategies that preserve the natural grouping of dependent observations provide a more realistic estimate of performance for unseen experimental units than random partitioning of correlated observations [
25]. Accordingly, the pooled LORO-CV metrics were used for comparative model selection, whereas the reactor-specific results were used to delimit model applicability. SVR-RBF can thus be considered a useful surrogate for describing the overall experimental domain and supporting uncertainty-aware optimization, but its predictions should not be interpreted as uniformly accurate for every individual reactor.
A sensitivity analysis for regularization hyperparameter C (1, 10, 50, and 100), kernel coefficient gamma (“scale”, 0.001, 0.01, and 0.1), and epsilon-insensitive loss parameter (0.01, 0.1, and 1.0) under the same LORO-CV scheme was performed. The analysis produced only a marginal improvement when ε was changed from 0.1 to 1.0 while C = 10 and gamma = “scale” were retained. RMSE decreased from 118.087 to 118.046 NmL CH4, a difference of approximately 0.035%, while MAE changed from 75.751 to 75.806 NmL CH4. This negligible variation indicated that the main conclusion was insensitive to ε within this range. Consequently, the prespecified ε = 0.1 model was retained for the final grouped optimization and bootstrap analysis.
3.4. Kinetic Benchmark Analysis
To complement the data-driven modelling framework with physically interpretable kinetic baselines, each cumulative methane trajectory was independently fitted using first-order, modified Gompertz, and modified logistic models, the parameters and the model performances are shown in
Table 5.
The kinetic benchmark showed that the temporal cumulative methane production pattern was strongly dependent on substrate composition and could not be adequately represented by a single kinetic formulation across all reactors. First-order kinetics provided the most parsimonious description of the 0/100 molasses-rich trajectories, whereas the modified Gompertz model better captured the rapid sigmoidal behavior observed at 25/75. The modified logistic model was superior for the complete 100/0 banana-peel trajectories, which exhibited a markedly delayed but much larger methane accumulation. Similar composition-dependent differences among first-order, modified Gompertz, logistic, and related kinetic formulations have been reported in batch anaerobic digestion, supporting the use of multiple candidate models rather than assuming that a single kinetic equation is universally appropriate [
26].
The modified Gompertz and logistic formulations are particularly useful because their parameters provide interpretable descriptors of batch methane kinetics, including asymptotic methane production, maximum production rate, and lag phase. Recent anaerobic co-digestion studies have similarly used these models to quantify differences in methanogenic response among substrate mixtures and operational conditions [
27]. In addition, kinetic modelling of banana-derived residues has shown that Gompertz-type models can closely reproduce cumulative methane or biogas trajectories, confirming their relevance as mechanistic-lean but physically interpretable benchmarks for lignocellulosic agro-industrial substrates [
28].
The kinetic models were fitted separately to each observed reactor trajectory and therefore characterize within-reactor degradation behavior, whereas the SVR-RBF was evaluated using leave-one-reactor-out cross-validation and addresses generalization to an unseen reactor trajectory. Consequently, the lower within-curve RMSE values of the kinetic models cannot be interpreted as evidence that they provide better out-of-reactor predictive performance than the SVR. Instead, the kinetic analysis contributes physically interpretable descriptors that are unavailable from the black-box regression model, while the reactor-aware SVR evaluates predictive transfer across experimental trajectories.
The kinetic results also reinforce the need for caution when interpreting the machine-learning optimum. The substantial differences in lag phase, maximum production rate, and asymptotic cumulative methane production among compositions demonstrate that the experimental trajectories represent kinetically distinct regimes. Therefore, the SVR-DE boundary optimum should be interpreted within the experimental domain rather than as evidence of a universal biological optimum.
3.5. Process Optimization
Following model validation, the best-performing ML model was integrated with the Differential Evolution algorithm to determine the operating conditions that maximize cumulative methane production within the experimental domain. Across the 70 grouped Differential Evolution runs (see
Table S2 in Supplementary Materials), the optimum consistently converged to the upper composition boundary. The median optimal composition was 100% banana peel and 0% sugarcane molasses, with a median digestion time of 310.10 h. The mean optimal time was 316.20 ± 13.54 h, and its 2.5th–97.5th percentile interval was 309.00–348.55 h. Median predicted cumulative methane production was 1433.25 NmL CH
4, with a corresponding interval of 1325.72–1515.97 NmL CH
4. Uncertainty in the optimization outcome was evaluated using the seven fold-specific SVR-RBF models, repeated Differential Evolution runs with different random seeds, reactor-level bootstrap resampling, and exclusion of the truncated reactor. Separately, the sensitivity of predictive performance to the main SVR hyperparameters was evaluated under the same LORO-CV procedure (
Table 6).
Reactor-level bootstrap resampling (500 iterations) confirmed the stability of the compositional solution, with 99% of bootstrap optima containing ≥99% banana peel. In contrast, considerably wider bootstrap intervals were obtained for optimal digestion time and predicted cumulative methane volume (46.30–366.38 h and 155.68–1531.66 NmL CH4, respectively). These results indicate that the direction of the compositional optimum was highly stable, whereas considerably greater uncertainty remained regarding the precise optimal digestion time and magnitude of methane production. Importantly, exclusion of the instrumentally truncated 100–0 R3 trajectory did not alter the optimization conclusion. All sensitivity runs without this reactor again converged to ≥99% banana peel, while the median optimal digestion time (310.20 h) and cumulative methane volume (1431.92 NmL CH4) remained consistent with the grouped analysis containing all reactors. This agreement indicates that the boundary solution was not an artifact produced by the incomplete trajectory. The optimization objective maximized cumulative methane volume and did not account for methane-production rate, volumetric productivity, energy consumption, reactor capacity, or economic return. Therefore, the median value of 310.10 h (approximately 12.9 days) represents a model-derived batch endpoint for cumulative methane recovery rather than an operationally or economically optimal digestion time. Although extending digestion may increase cumulative methane recovery, the additional production may not compensate for the associated reduction in reactor throughput and increased capacity and operating requirements.
The convergence of the grouped and bootstrap optimizations toward the banana-peel-rich boundary indicates that the direction of the compositional optimum is robust to reactor resampling, model refitting, and stochastic optimization. However, because the optimum lies at the boundary of the investigated composition domain, it should not be interpreted as evidence that 100% banana peel represents a universal biological optimum. Rather, the results indicate that, within the experimental domain represented by the available reactor trajectories, the SVR-RBF model predicts increasing cumulative methane production toward the banana-peel-rich end of the composition range.
This distinction is particularly relevant when machine-learning models are used for process optimization. Point predictions alone do not characterize the uncertainty associated with model-based decisions, and uncertainty quantification provides additional information regarding the reliability and stability of predicted operating conditions [
29,
30]. Recent developments in anaerobic-digestion modelling similarly emphasize that model configuration, data preparation, and optimization strategy can materially influence methane-prediction performance and the resulting optimization landscape [
31].
Importantly, the reactor-level bootstrap revealed a different degree of uncertainty among the optimized variables. Whereas the composition optimum remained highly stable, with 99% of bootstrap solutions containing ≥99% banana peel, substantially wider intervals were obtained for digestion time and predicted cumulative methane volume. This variability is consistent with the limited number of independent reactor trajectories available for model development and reinforces the need to distinguish between the stability of the location of the compositional boundary optimum and the uncertainty associated with its predicted response magnitude. Consequently, the predicted 100/0 condition should be regarded as a model-supported candidate for subsequent experimental confirmation rather than as a definitively established process optimum.
The boundary solution is biologically plausible in the context of the observed batch trajectories but should not be interpreted as proof of a universally optimal substrate ratio. The methane production potential of banana peel demonstrated in batch digestion studies depends on its non-structural carbohydrate, lignin, hemicellulose, and fibre composition [
16,
17,
28]. Conversely, sugarcane molasses contains readily fermentable carbohydrates that can promote rapid acidogenesis. If acid production exceeds the consumption capacity of syntrophic and methanogenic communities, volatile fatty acids may accumulate and decrease methane formation. Recent solid-state co-digestion experiments with sugarcane molasses reported that increasing molasses proportions caused volatile-fatty-acid accumulation and sharply reduced methane yield, with pure molasses producing the lowest yield among the tested mixtures [
18]. This provides a plausible explanation for the comparatively early plateau and low cumulative methane volume of the molasses-rich reactors in the present dataset. However, volatile fatty acids, alkalinity, and temporal pH were not measured in this study; therefore, acidification remains a literature-supported hypothesis rather than an experimentally demonstrated mechanism.