Article

Characterization of Non-Volatile and Volatile in Flat Green Teas Processed by Green, Yellow, and Purple-Colored Leaves Using Multi-Sensory Analysis and Metabolomics

1
Integrative Science Center of Germplasm Creation in Western China (CHONGQING) Science City, College of Food Science, Southwest University, Chongqing 400715, China
2
Chongqing Agricultural Technology Extension Station, Chongqing 400715, China
3
Chongqing Key Laboratory of Speciality Food Co-Built by Sichuan and Chongqing, Southwest University, Chongqing 400715, China
*
Author to whom correspondence should be addressed.
Foods 2026, 15(11), 1862; https://doi.org/10.3390/foods15111862
Submission received: 20 April 2026 / Revised: 19 May 2026 / Accepted: 22 May 2026 / Published: 24 May 2026
(This article belongs to the Section Foodomics)

Abstract

Teas processed from specialty-colored tea leaves possess distinctive quality profiles shaped by their volatile and non-volatile compounds, which serve as critical metrics for evaluating tea cultivars. In this study, we comprehensively characterized the quality attributes of flat green teas produced from three tea cultivars—green-leaved ‘FDDB’, yellow-leaved ‘ZH2’, and purple-leaved ‘ZJ’—using an integrated analytical approach including sensory evaluation, widely targeted metabolomics, GC-E-nose, and HS-SPME-GC-MS. Sensory evaluation revealed distinct sensory characteristics among teas processed from the three cultivars with different leaf colors. GC-E-nose analysis further confirmed that the aroma profiles of these tea samples could be clearly distinguished based on leaf color. Metabolomic analysis identified a total of 2050 non-volatile compounds, among which 18 amino acids, 5 phenolic acids, and 4 flavonoids were pinpointed as key contributors to the unique taste profiles of infusions from ZH2 and ZJ teas. Additionally, a total of 1100 volatile compounds were detected, with 94, 75, and 90 key aroma-active compounds identified in FDDB, ZH2, and ZJ teas, respectively. Collectively, in this study, systematic analysis revealed significant differences in both volatile and non-volatile chemical compositions across the three tea cultivars. These findings provide a scientific foundation for understanding the processing suitability and quality formation mechanisms of tea cultivars with distinct leaf colors.

1. Introduction

Tea plant [Camellia sinensis (L.) O. Kuntze], a perennial plant whose leaves are used to produce various kinds of tea products has significant health benefits for humans. China possesses the world’s richest collection of tea germplasm resources, providing a foundation for breeding distinctive cultivars and developing novel tea products [1,2,3]. In recent years, tea varieties with special leaf colors have attracted increasing attention due to their unique economic potential. Tea leaf colors are typically green, white, yellow, and purple. Leaf color variation affects the metabolite profiles of tea plants, which further influence the sensory quality and flavor of teas. Under identical growing and processing conditions, teas from different leaf color varieties show significant quality differences [4,5,6,7]. For instance, yellow-leaf teas typically contain higher amino acids and lower catechins. This composition contributes to a fresh and umami taste [8,9]. Purple-leaf teas, in contrast, are rich in anthocyanins. They exhibit strong antioxidant activity and a pronounced bitter-astringent profile [10,11].
As a leafy crop, tea quality is largely determined by the metabolic composition of the leaves. Non-volatile compounds such as L-theanine and flavonoids are key contributors to taste [12,13,14], while over 700 volatile metabolites collectively shape the aroma profile of tea infusions [15,16,17,18]. Metabolomics has emerged as a powerful tool for deciphering the chemical basis of tea quality. Widely targeted metabolomics based on UPLC-ESI-MS/MS enables comprehensive profiling of non-volatile compounds, whereas GC-MS/MS and ultra-fast GC-E-nose are commonly applied for volatile aroma analysis [19,20,21,22,23]. Despite extensive research on the chemical and sensory properties of tea cultivars with diverse leaf colors, systematic comparisons of green teas processed from yellow-leaf and purple-leaf varieties remain limited.
In this study, three tea plant cultivars with different leaf colors were used, named ‘Fuding Dabai Tea’ (FDDB, a green leaf variety), ‘Zhonghuang No. 2’ (ZH2, a yellow leaf variety) and ‘Zijuan’ (ZJ, a purple leaf variety), respectively. All were processed into flat green tea using a standardized method. Their non-volatile and volatile profiles were characterized through sensory evaluation, UPLC-ESI-MS/MS, GC-E-nose, and HS-SPME-GC-MS. The findings aim to provide new insights into the characteristic metabolites of specialty leaf-color tea varieties and offer a theoretical basis for the utilization of these unique germplasm resources.

2. Materials and Methods

2.1. Chemicals

HPLC-grade methanol, acetonitrile, and n-hexane used in the experiments were purchased from Merck (St. Louis, MO, USA). HPLC-grade formic acid was obtained from Aladdin Biochemical & Technology Co., Ltd. (Shanghai, China), and analytical-grade sodium chloride was sourced from Sinopharm Chemical Reagent Co., Ltd. (Shanghai, China). All other chemicals met chromatographic or analytical grade specifications. The 20 mL headspace vials and screw caps fitted with silicone/PTFE septum were purchased from Agilent Technologies Inc. (Palo Alto, CA, USA). Purified water was supplied by Hangzhou Wahaha Group Co., Ltd. (Hangzhou, China).

2.2. Tea Samples Processing

The test materials consisted of fresh leaves (one leaf and one bud) from three tea plant varieties. These were harvested in spring 2024 at Gaoyangbifeng Tea Co., Ltd. (Guangyuan City, Sichuan Province). These varieties were named ‘Camelia sinensis cv. Fudingdabaicha’ (a green leaf variety), ‘Camelia sinensis cv. Zhonghuang No. 2’ (a yellow leaf variety) and ‘Camelia sinensis cv. Zijuan’ (a purple leaf variety), and marked as FDDB, ZH2, and ZJ, respectively. All samples were processed into flat-shaped green tea using traditional methods, including withering, fixation, shaping, and drying. The detailed procedures were as follows: Firstly, fresh leaves picked on sunny days were placed in a well-ventilated indoor space for natural withering. This withering process was continued until the leaves exhibited wilting, texture softening, color deepening, a moisture content of 68–72%, and a transition from grassy notes to a fresh fragrance (5–8 h). Then, the withered leaves were pan-fired at 240 °C. As the leaves wilted, the petioles softened, and the color deepened further. Pressure was gradually increased every 30 s. Next, the cut tea leaves were shaped using a flat-bottomed wok. The initial wok temperature was set to 110 °C and maintained for 15 min, during which the humidity was maintained between 20% to produce tight, straight strands. Finally, the wok temperature was adjusted to 90 °C and heating was continued until the moisture content of the leaves dropped to 5–6%.

2.3. Sensory Evaluation

Sensory evaluation of tea samples was conducted according to the standard of China (GB/T 23776, 2018 [24]). The intensity values and aroma descriptors of the samples were verified by ten panelists, which were composed of six males and four females with an average age of 30, as previously described by Yue et al. (2023) [25]. Briefly, 200 g of each tea sample was placed on a white square plate to assess the dry tea appearance evaluation. Then, 3 g of each tea sample was brewed with 150 mL of boiling water in a white porcelain cup, and steeped for 4 min. The infusion was filtered into a porcelain bowl and successively evaluated for liquor color, aroma, taste. The intensities of the aroma and taste attributes were scored from 0 to 10, with the intensity ranging from no intensity to high perceptible.

2.4. Chromatic Difference Assessment

The color quality of the dry tea leaves was analyzed using a colorimeter apparatus (CM-5, Konica Minolta Investment Co., Ltd., Shanghai, China) equipped with a D65 light source. Color indicators included L*, a*, and b*, representing the luminance (bright: 100, dark: 0), red-green degree (red: +, green: −), yellow-blue degree (yellow: +, blue: −), respectively [26,27]. Each tea sample was measured three times. Ultrapure water was used as the blank control. The final result was the average of the three replicates.

2.5. Analysis of Non-Volatile Metabolites

Tea samples were dried using a vacuum freeze dryer (Scientz-100F, Ningbo Scientz Biotechnology Co., Ltd., Ningbo, China). The freeze-dried samples were crushed using a grinder (MM 400, Retsch, Haan, Germany) at a frequency of 30 Hz. Then, 50 mg of sample powder was weighed and mixed with 1.2 mL of pre-cooled (−20 °C) 70% aqueous methanol. The mixture was extracted at 4 °C for 3 h, with vortexing every 30 min. After centrifugation at 12,000 rpm for 3 min, the supernatant was filtered through a microporous membrane (0.22 μm pore size) and subjected to UPLC-ESI-MS/MS analysis, as previously described by Cao et al. (2024) [28]. Quantification was performed using multiple reaction monitoring (MRM) mode. The detailed MRM ion pairs (Q1 and Q3) for representative non-volatile compounds are provided in Table S1. Declustering potential (DP) and collision energy (CE) for individual MRM transitions were optimized. A specific set of MRM transitions was monitored for each period according to the metabolites eluted within that period. Non-volatile metabolites were identified by comparing the mass spectra with the data system library and linear retention index (Metware Biotechnology Co., Ltd., Wuhan, China). For two-group comparisons, differential metabolites were determined by VIP ≥ 1 and |Log2FC| ≥ 1.0. VIP values were extracted from OPLS-DA results, which were generated using the MetaboAnalystR package (version 1.0.1). Prior to OPLS-DA, all data were log transform (log2) and mean centering (without additional scaling). This preprocessing approach preserves the original variance structure of metabolites, which is appropriate for discriminant analysis when identifying group-specific differential metabolites. To avoid overfitting, a permutation test (200 permutations) was performed. For PCA, unit variance (UV) scaling was applied following the standard protocol of the metabolomics service provider (Metware Biotechnology Co., Ltd., Wuhan, China).

2.6. Measurement of Flavor Characteristics Using GC-E-Nose

To investigate the volatile fingerprints of tea samples, a GC-E-nose (Alpha M.O.S., Toulouse, France) was used to detect their aroma profiles as previously described by Yang et al. [29,30]. In brief, 0.5 g of tea sample was placed into a 20 mL sealed glass vial and incubated at 65 °C for 30 min prior to instrumental analysis. High-purity helium was used as the carrier gas at a flow rate of 1 mL/min. Volatile compounds were absorbed by an embedded volatile concentrator (Tenax TA) at 20 °C for 30 s in split mode (10 mL/min), followed by thermal desorption at 240 °C for 30 s. Separation was performed in parallel using a weak polar MXT-5 column and a medium polar MXT-1701 column (20 m × 0.18 mm I.D. × 0.4 μm, Restek Corporation, Bellefonte, PA, USA). The heating program was set as follows: initial temperature was held at 50 °C for 5 s, then ramped to 120 °C at 0.2 °C/s, and finally raised to 250 °C at 0.4 °C/s for 10 s. Both flame ionization detectors were maintained at 260 °C. All analyses were carried out in triplicate.

2.7. Volatile Metabolites Detection and rOAV Calculation

Samples were ground into powder in a liquid nitrogen environment. A total of 500 mg of powder was promptly transferred to a 20 mL headspace vial (Agilent, Palo Alto, CA, USA), containing NaCl saturated solution, to inhibit any enzyme reaction. Each sample was extracted three times using fully automated headspace solid-phase microextraction and analyzed by GC–MS as described by Yue et al. [25]. Qualitative and quantitative analysis of volatiles compounds was performed using an Agilent 8890 GC-7000D MS system (Agilent Technologies Inc., Santa Clara, CA, USA) equipped with a 30 m × 0.25 mm × 0.25 μm DB-5MS (5% phenyl-polymethylsiloxane) capillary column. Helium was used as the carrier gas at a linear flow rate of 1.2 mL/min. The injector port temperature was maintained at 250 °C. The column oven temperature program was as follows: initial temperature of 40 °C held for 3.5 min, followed by a ramp of 10 °C/min to 100 °C, 7 °C/min to 180 °C and 25 °C/min to 280 °C, where it was held for 5 min. Mass spectrometry detection employed 70 eV electron bombard ionization mode. The quadrupole mass detector, ion source, and transmission line temperatures were set to 150 °C, 230 °C, and 280 °C, respectively. Qualitative and quantitative analysis of target analytes were performed using selected ion monitoring (SIM) mode. The quantitative and qualitative ions used for SIM analysis of volatile compounds are provided in Table S2. The contents of volatile metabolites were calculated according to the peak area under the control of an internal standard compound, [2,3,4,5,6-2H5]-Benzyl Acetate (isoreag, catalog No. IR-20681-250 mg, Canada, CAS: 1398065-57-0, purity: 95%, 98% atom 2H). The differential metabolites between two-group comparison were identified based on VIP ≥ 1 and |Log2FC| ≥ 1.0. The relative odor activity value (rOAV) was determined as previously described [25]. Compounds with a rOAV > 1 were identified as key aroma-active compounds dominating the overall aroma profile [31,32,33].

2.8. Statistical Analysis

To ensure the reliability of the analytical results, both volatile and non-volatile compounds were analyzed with three technical replicates, consisting of three independent extractions and instrumental injections. Metabolomics and volatile compound data processing were carried out using the base package in R (version 4.1.2) and Origin software (2026). Principal component analysis (PCA), cluster analysis, and orthogonal partial least squares discrimination analysis (OPLS-DA) were conducted as previously described [25]. Hierarchical cluster analysis (HCA) was performed using the Metware Cloud platform (https://cloud.metware.cn).

3. Results and Discussion

3.1. Sensory Evaluation of Three Teas

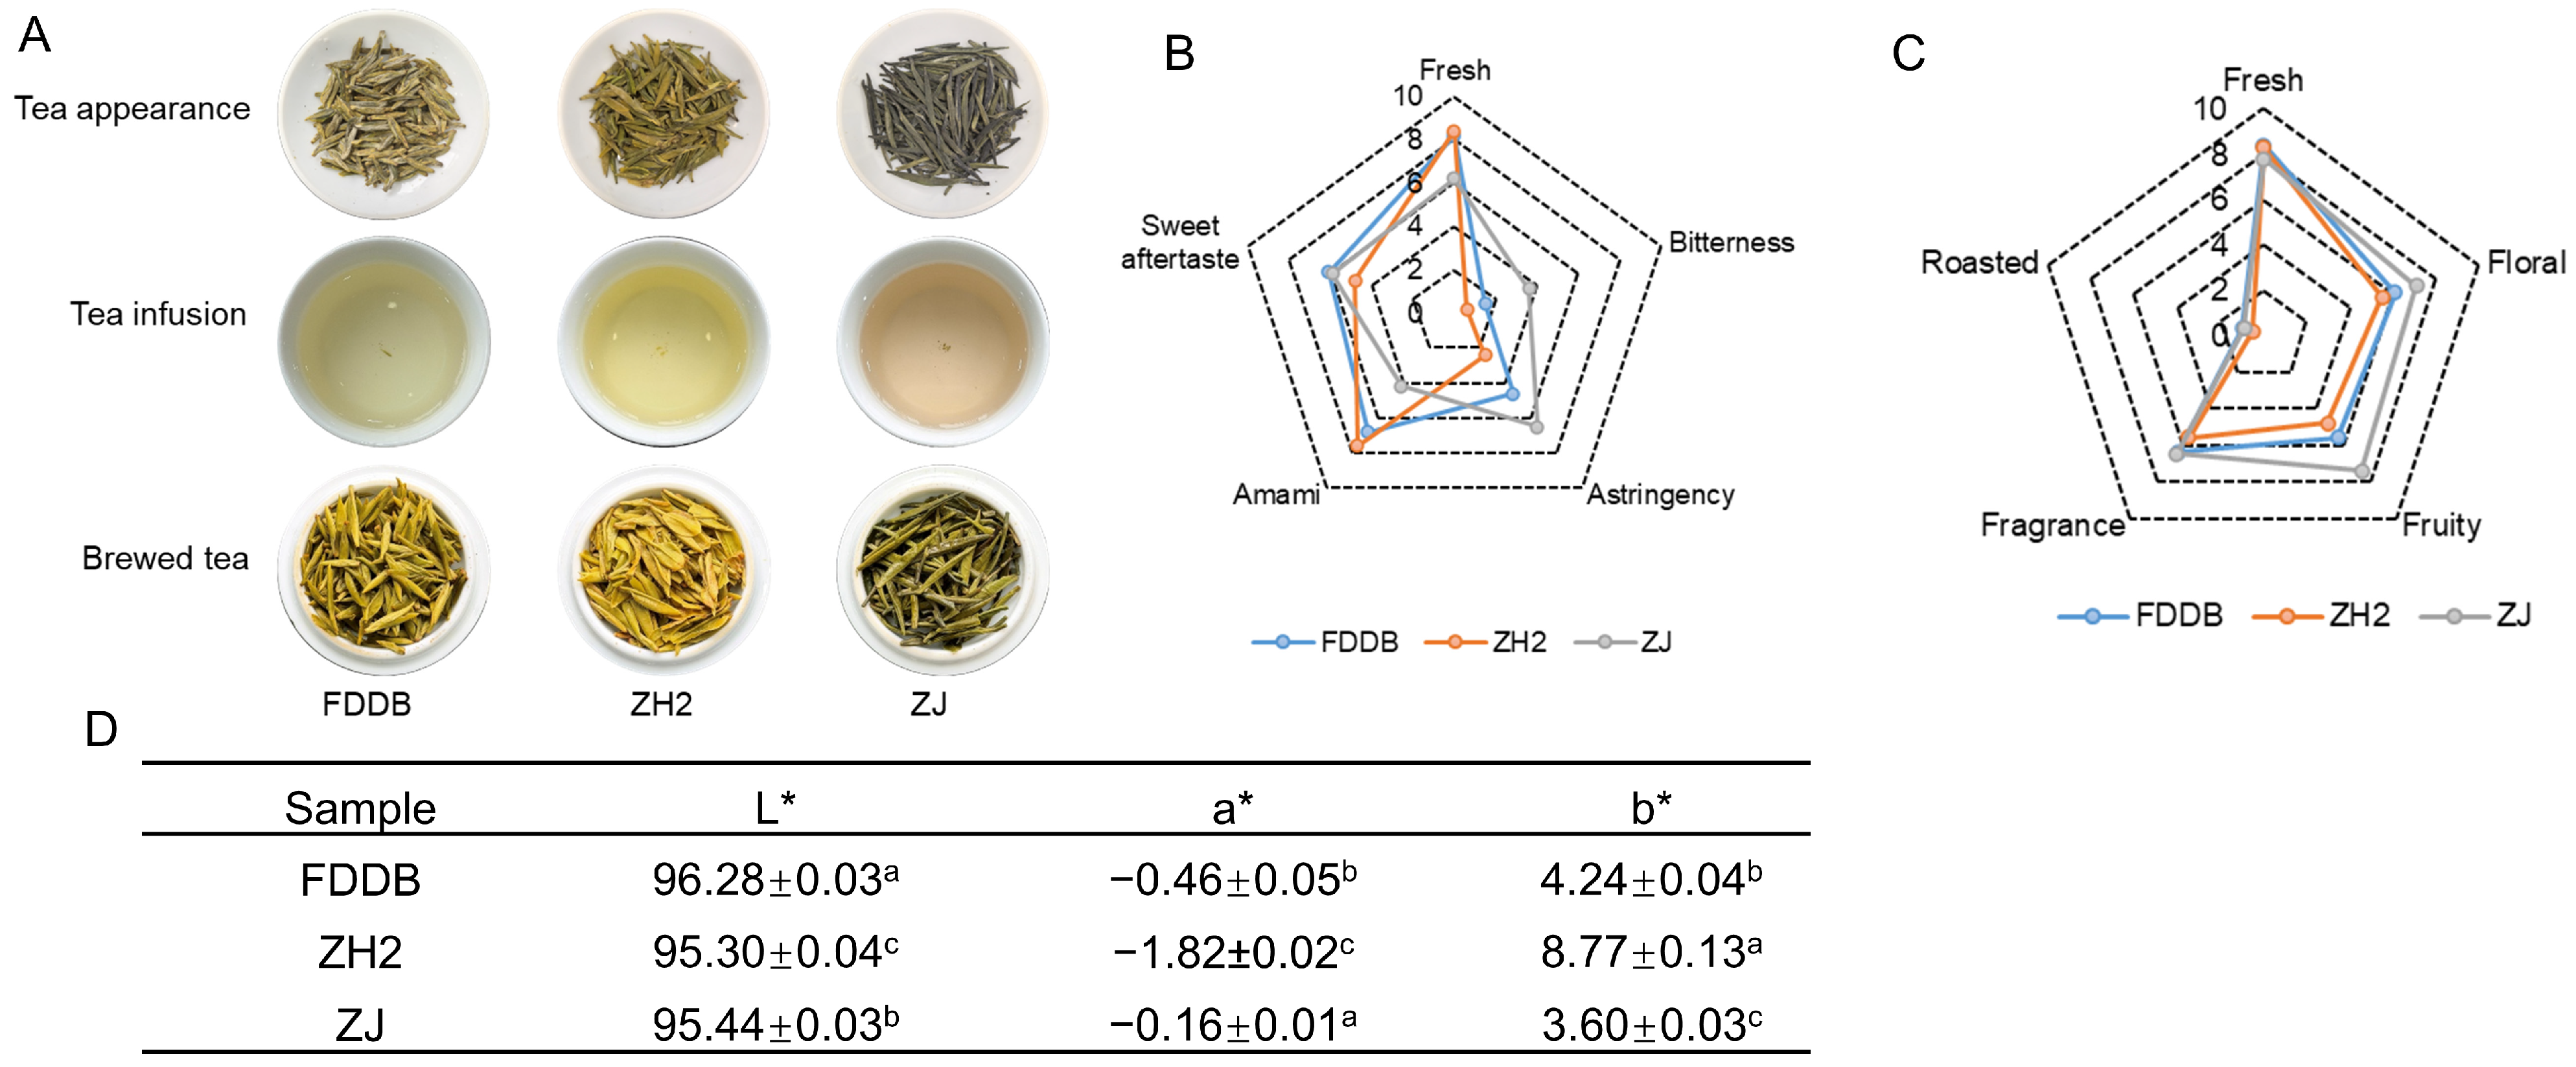
In this study, the sensory quality of teas processed from green (FDDB), yellow (ZH2), and purple (ZJ) colors tea leaves were evaluated. As shown in Figure 1A, the tea appearance, tea infusion and brewed teas exhibited high quality, and were distinct from each other, indicating that these three cultivars are suitable for green tea processing. Moreover, ZH2 had the highest umami and fresh taste and lowest bitterness, and FDDB had the highest sweet aftertaste, whereas ZJ exhibited the highest astringency and bitterness and lowest umami taste (Figure 1B). Among these teas, ZJ had the highest floral and fruity aroma (Figure 1C). Color is an important indicator of tea product quality and acceptability. The infusion color of the three samples varied significantly (Figure 1D). The color quality was evaluated based on three indicators: lightness (L*), greenness (−a*), and yellowness (b*). The L* values of FDDB were obviously higher than ZH2 and ZJ, demonstrating better lightness. The |−a| values of FDDB and ZH2 were significantly higher than that of ZJ. And ZH2 exhibited the highest b value. These results suggest that leaf color significantly influences the infusion color characteristics of tea.

3.2. Non-Volatile Metabolite Profiling of Three Teas Processed from Different Leaf Colors

3.2.1. Identification of Non-Volatile Compounds

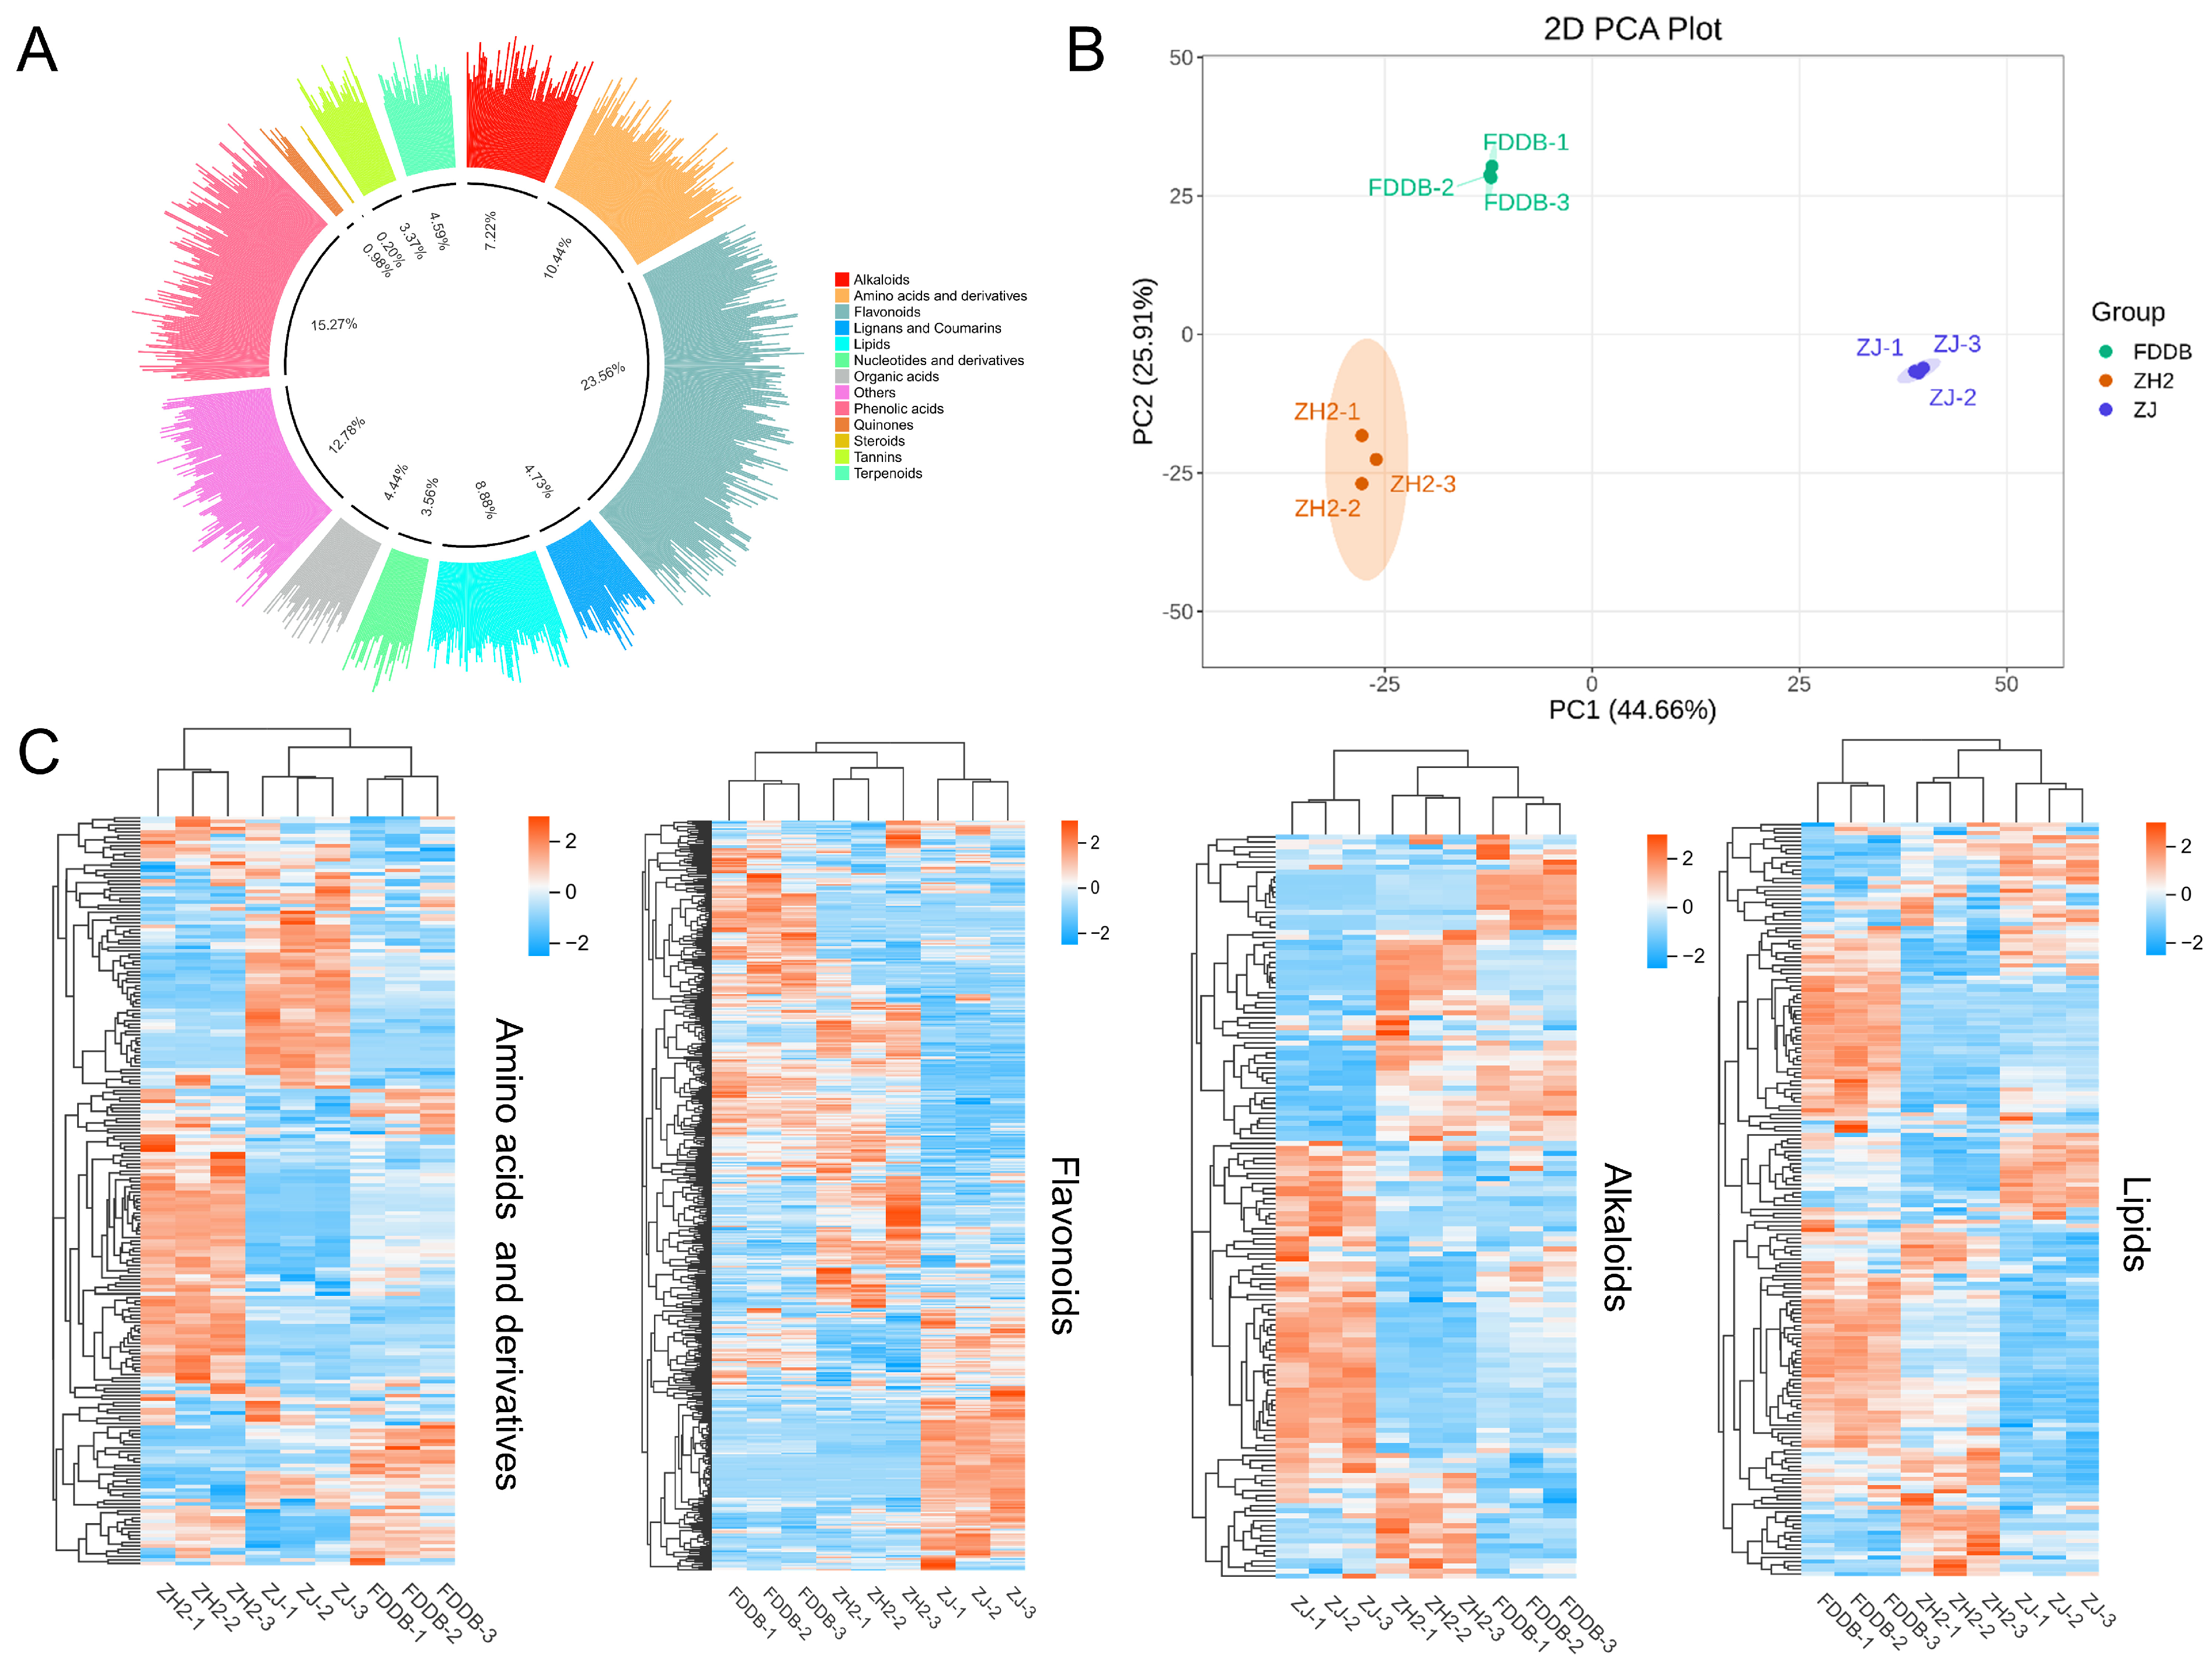
A total of 2050 non-volatile metabolites were identified via UPLC-MS/MS-based widely targeted metabolomics. These were primarily classified as flavonoids (23.56%), phenolic acids (15.27%), amino acids and their derivatives (10.44%), and lipids (8.88%) (Figure 2A). The MS/MS spectra and UPLC-MS/MS chromatograms of 30 representative non-volatile compounds (level 1) are shown in Figures S1 and S2. PCA revealed clear separation among the three tea samples (Figure 2B), with PC1 and PC2 explaining 37.35% and 25.88% of the variance, respectively, indicating substantial metabolic divergence [34]. Hierarchical clustering heatmaps further highlighted distinctive accumulation patterns of amino acids, flavonoids, alkaloids, and lipids among FDDB, ZH2, and ZJ (Figure 2C).

3.2.2. Analysis of Critical Differential Non-Volatile Metabolites

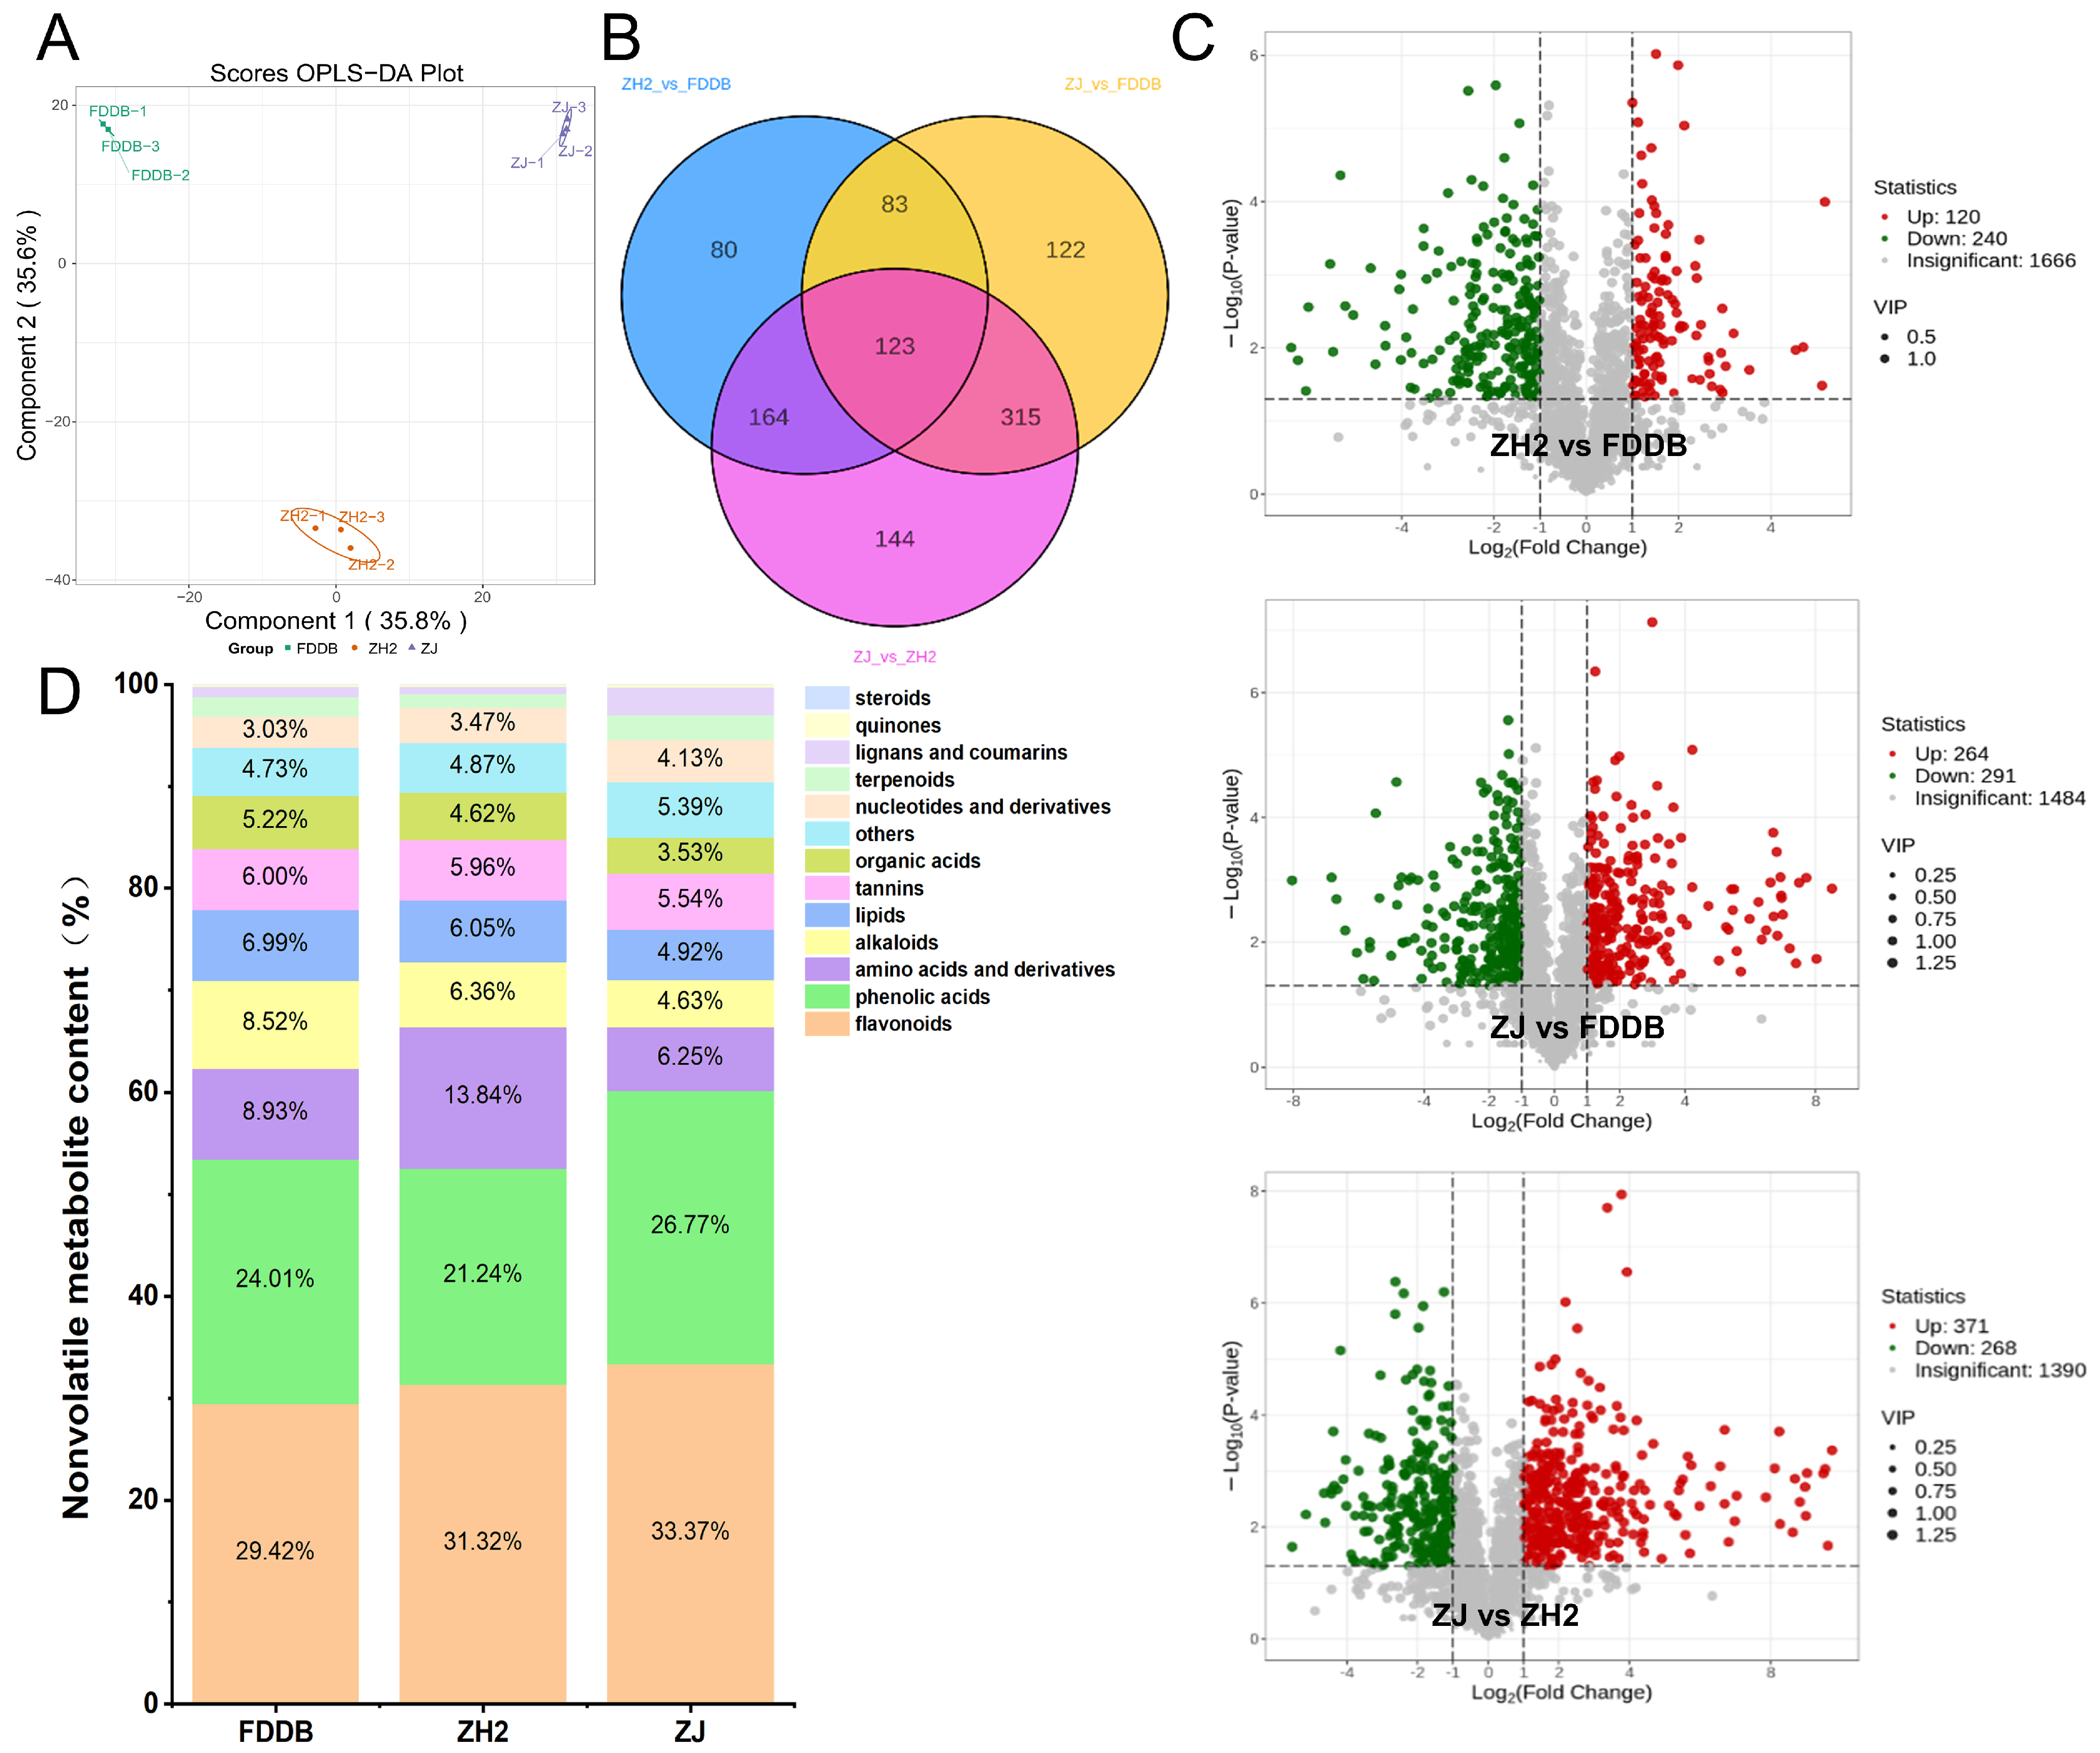
To evaluate the differential non-volatile compounds among three tea samples, the OPLS-DA method was utilized to examine the distinctions among samples (Figure 3A). The results exhibited distinct variations in the tea samples, which was similar to the findings obtained from PCA. After conducting 200 permutation tests, the values of Q2 exceeded 0.9 at p < 0.05, demonstrating a high level of reliability without overfitting (Figure S3). To further explore metabolic differences among FDDB, ZH2, and ZJ, the differential metabolites among the three tea samples were identified by calculating the VIP values and log2FC, with screening criteria set as VIP ≥ 1 and |log2FC| ≥ 1 [25,35]. Based on these standards, 123 non-volatile compounds were overlapped among three tea samples (Figure 3B), potentially representing major contributors to their flavor. Moreover, pairwise comparisons revealed 360 differential metabolites in ZH2 vs. FDDB (including 120 up-regulated and 240 down-regulated), 555 in ZJ vs. FDDB (including 264 up-regulated and 291 down-regulated), and 639 in ZJ vs. ZH2 (including 371 up-regulated and 268 down-regulated) (Figure 3C). The enhanced umami and sweet taste of ZH2 infusion may be attributed to the accumulation of 18 distinctive amino acids, including L-arginine, L-glutamic acid, and cycloleucine. By contrast, the pronounced bitterness and astringency of ZJ infusion likely results from its higher contents of (1′R,3R,5R,8′S)-dihydrophaseic acid-O-β-D-glucoside and other five phenolic acids as well as cyanidin 3-xyloside and other four flavonoids compared.
As shown in Figure 3D, FDDB was characterized by higher levels of organic acids and alkaloids, contributing to its rich mouthfeel. ZH2 accumulated significantly higher amino acids and their derivatives, consistent with the fresh and mellow taste of its infusion, as previously reported for yellow-leaf teas [36,37,38]. By contrast, ZJ showed the highest levels of flavonoids, phenolic acids, and nucleotides, with flavonoids known to impart bitterness and astringency, a feature commonly observed in purple-leaf teas [39,40,41,42]. These findings indicate that the distinct sensory characteristics of flat green teas from FDDB, ZH2, and ZJ are primarily shaped by cultivar-specific differences in the composition and abundance of non-volatile metabolites.

3.3. Volatile Metabolite Profiling of Three Teas Processed from Different Leaf Colors

3.3.1. GC-E-Nose Analysis

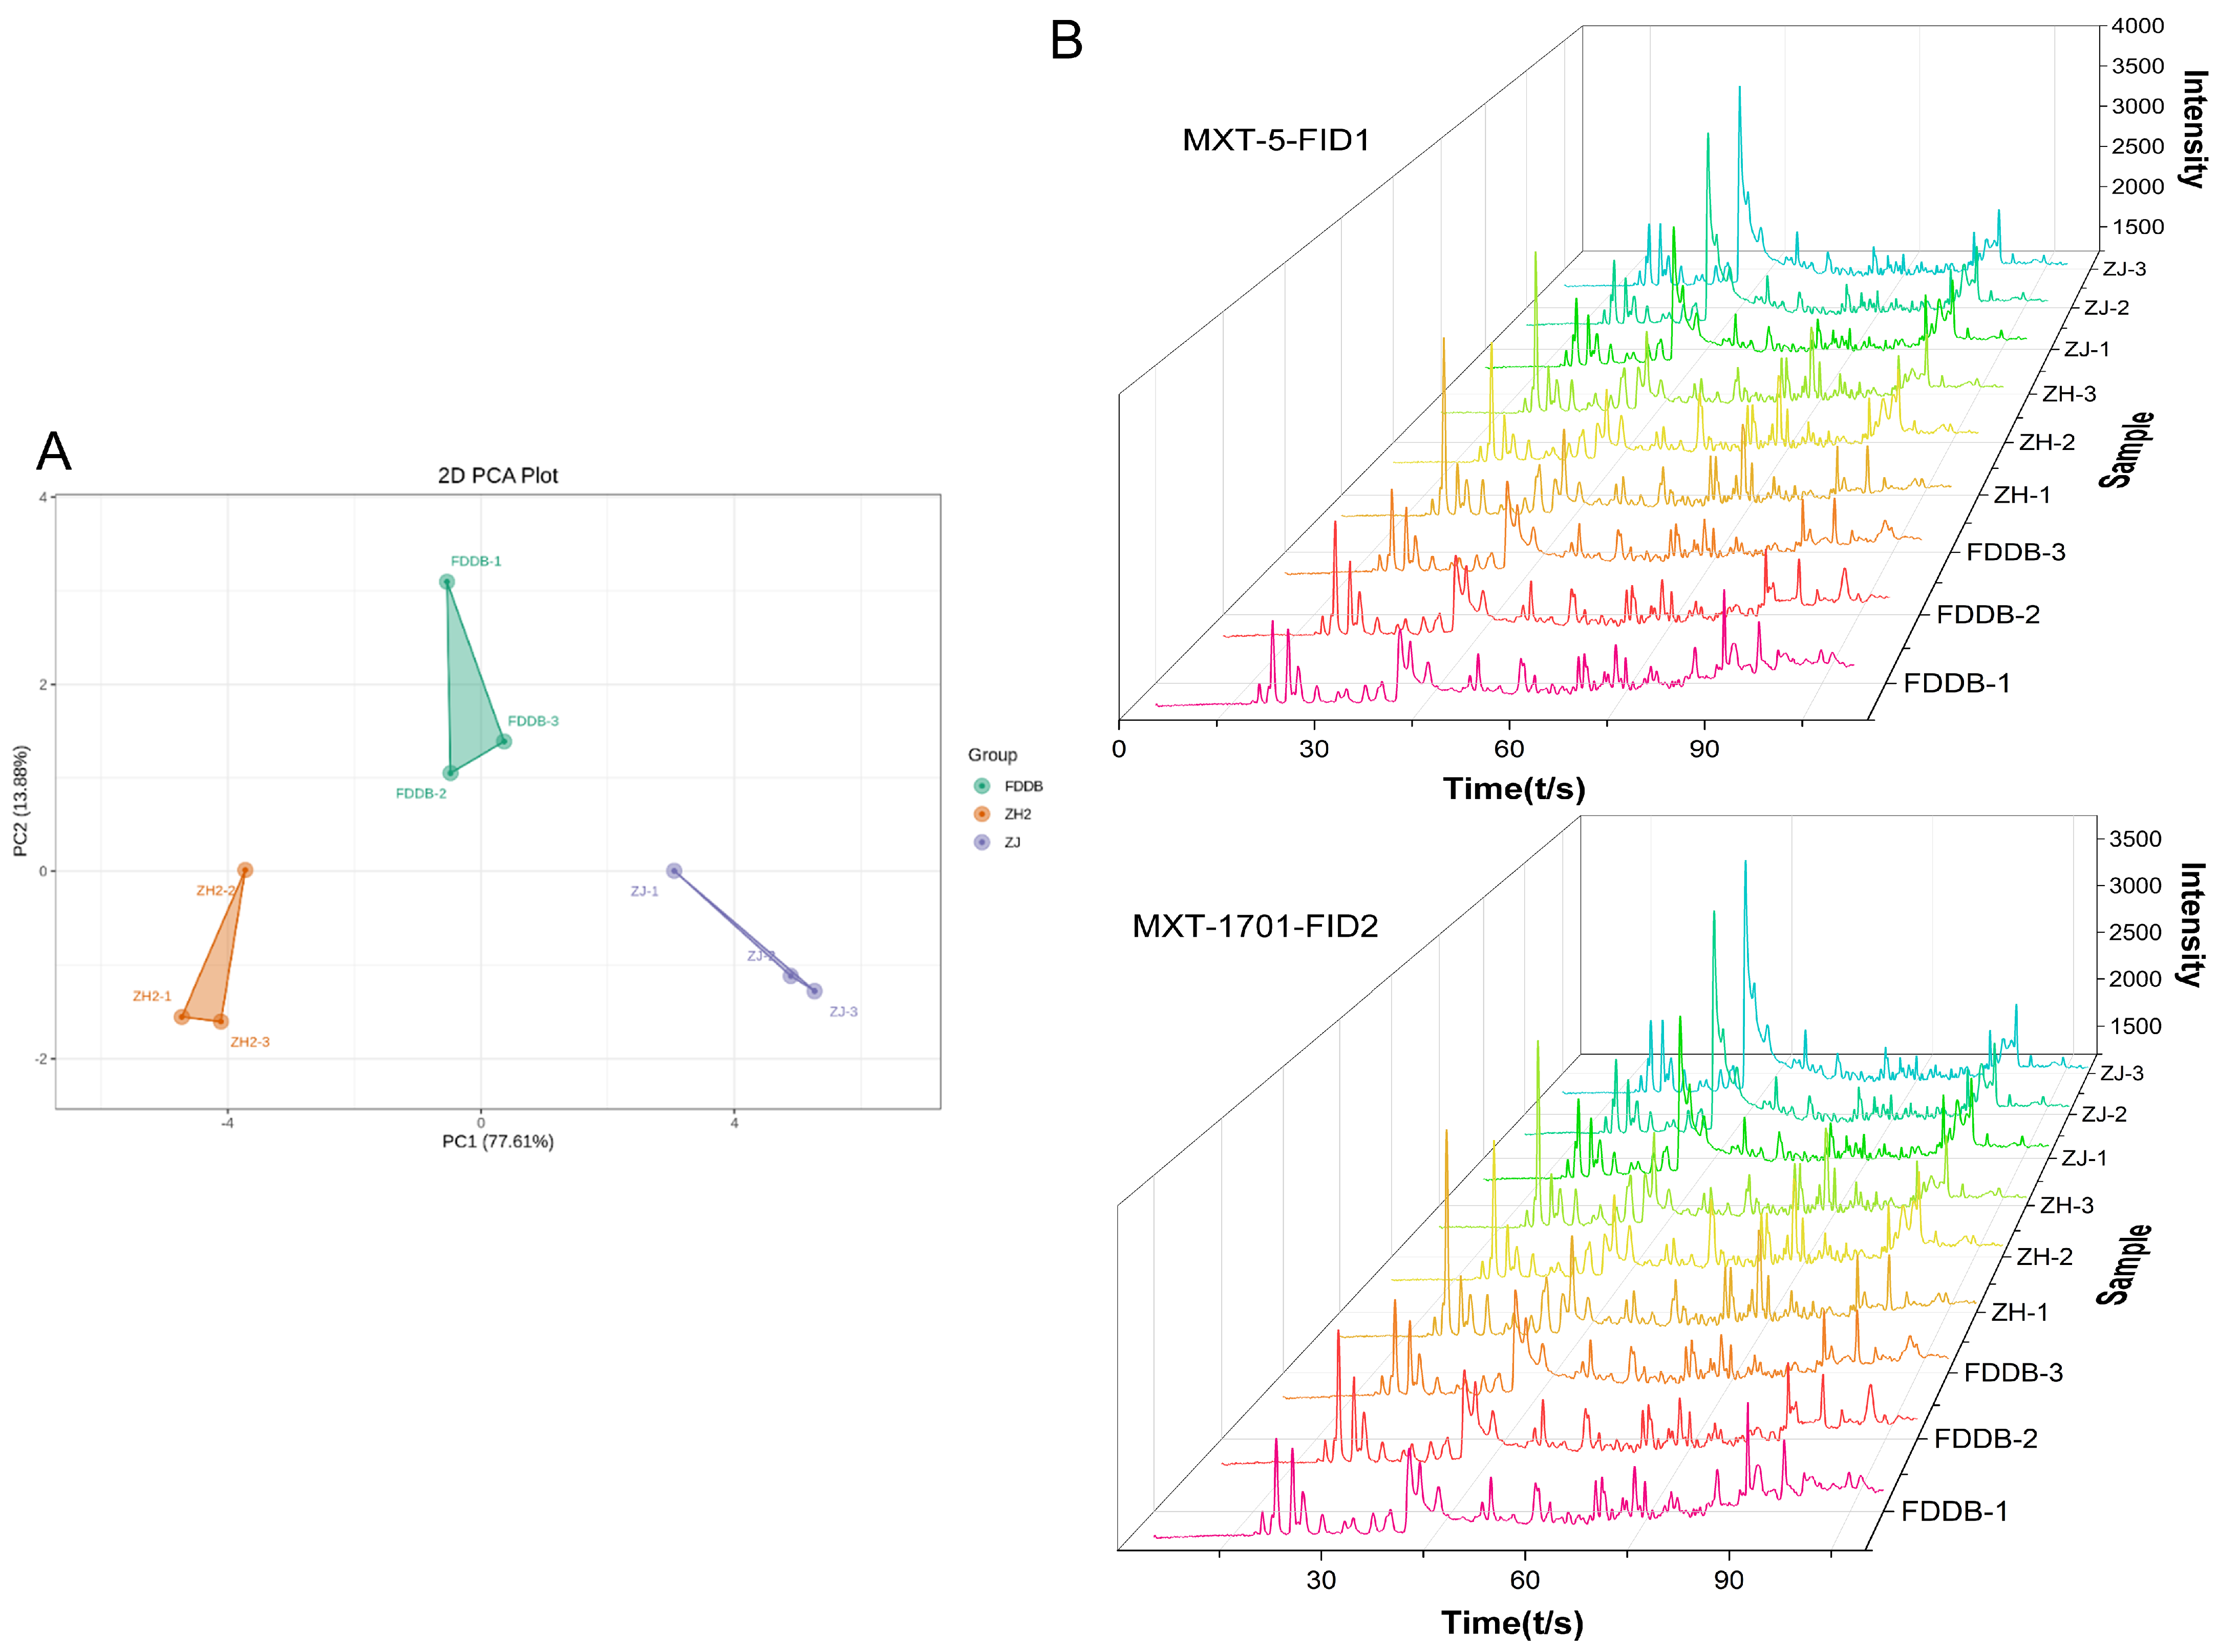
To further investigate the difference in aroma profiles among tea samples, GC-E-nose was used to detect their volatile compounds. PCA of GC-E-nose data showed distinct clustering of FDDB, ZH2, and ZJ, with PC1 and PC2 accounting for 77.61% and 13.88% of the total variance, respectively (Figure 4A). The tight clustering of biological replicates confirmed high reproducibility. Fingerprint spectra and radar plots revealed significant differences in volatile profiles across the three samples on both MXT-5 and MXT-1701 columns (Figure 4B,C), indicating that leaf color critically influences volatile composition.

3.3.2. Qualitative and Quantitative Analysis of Volatile Compounds

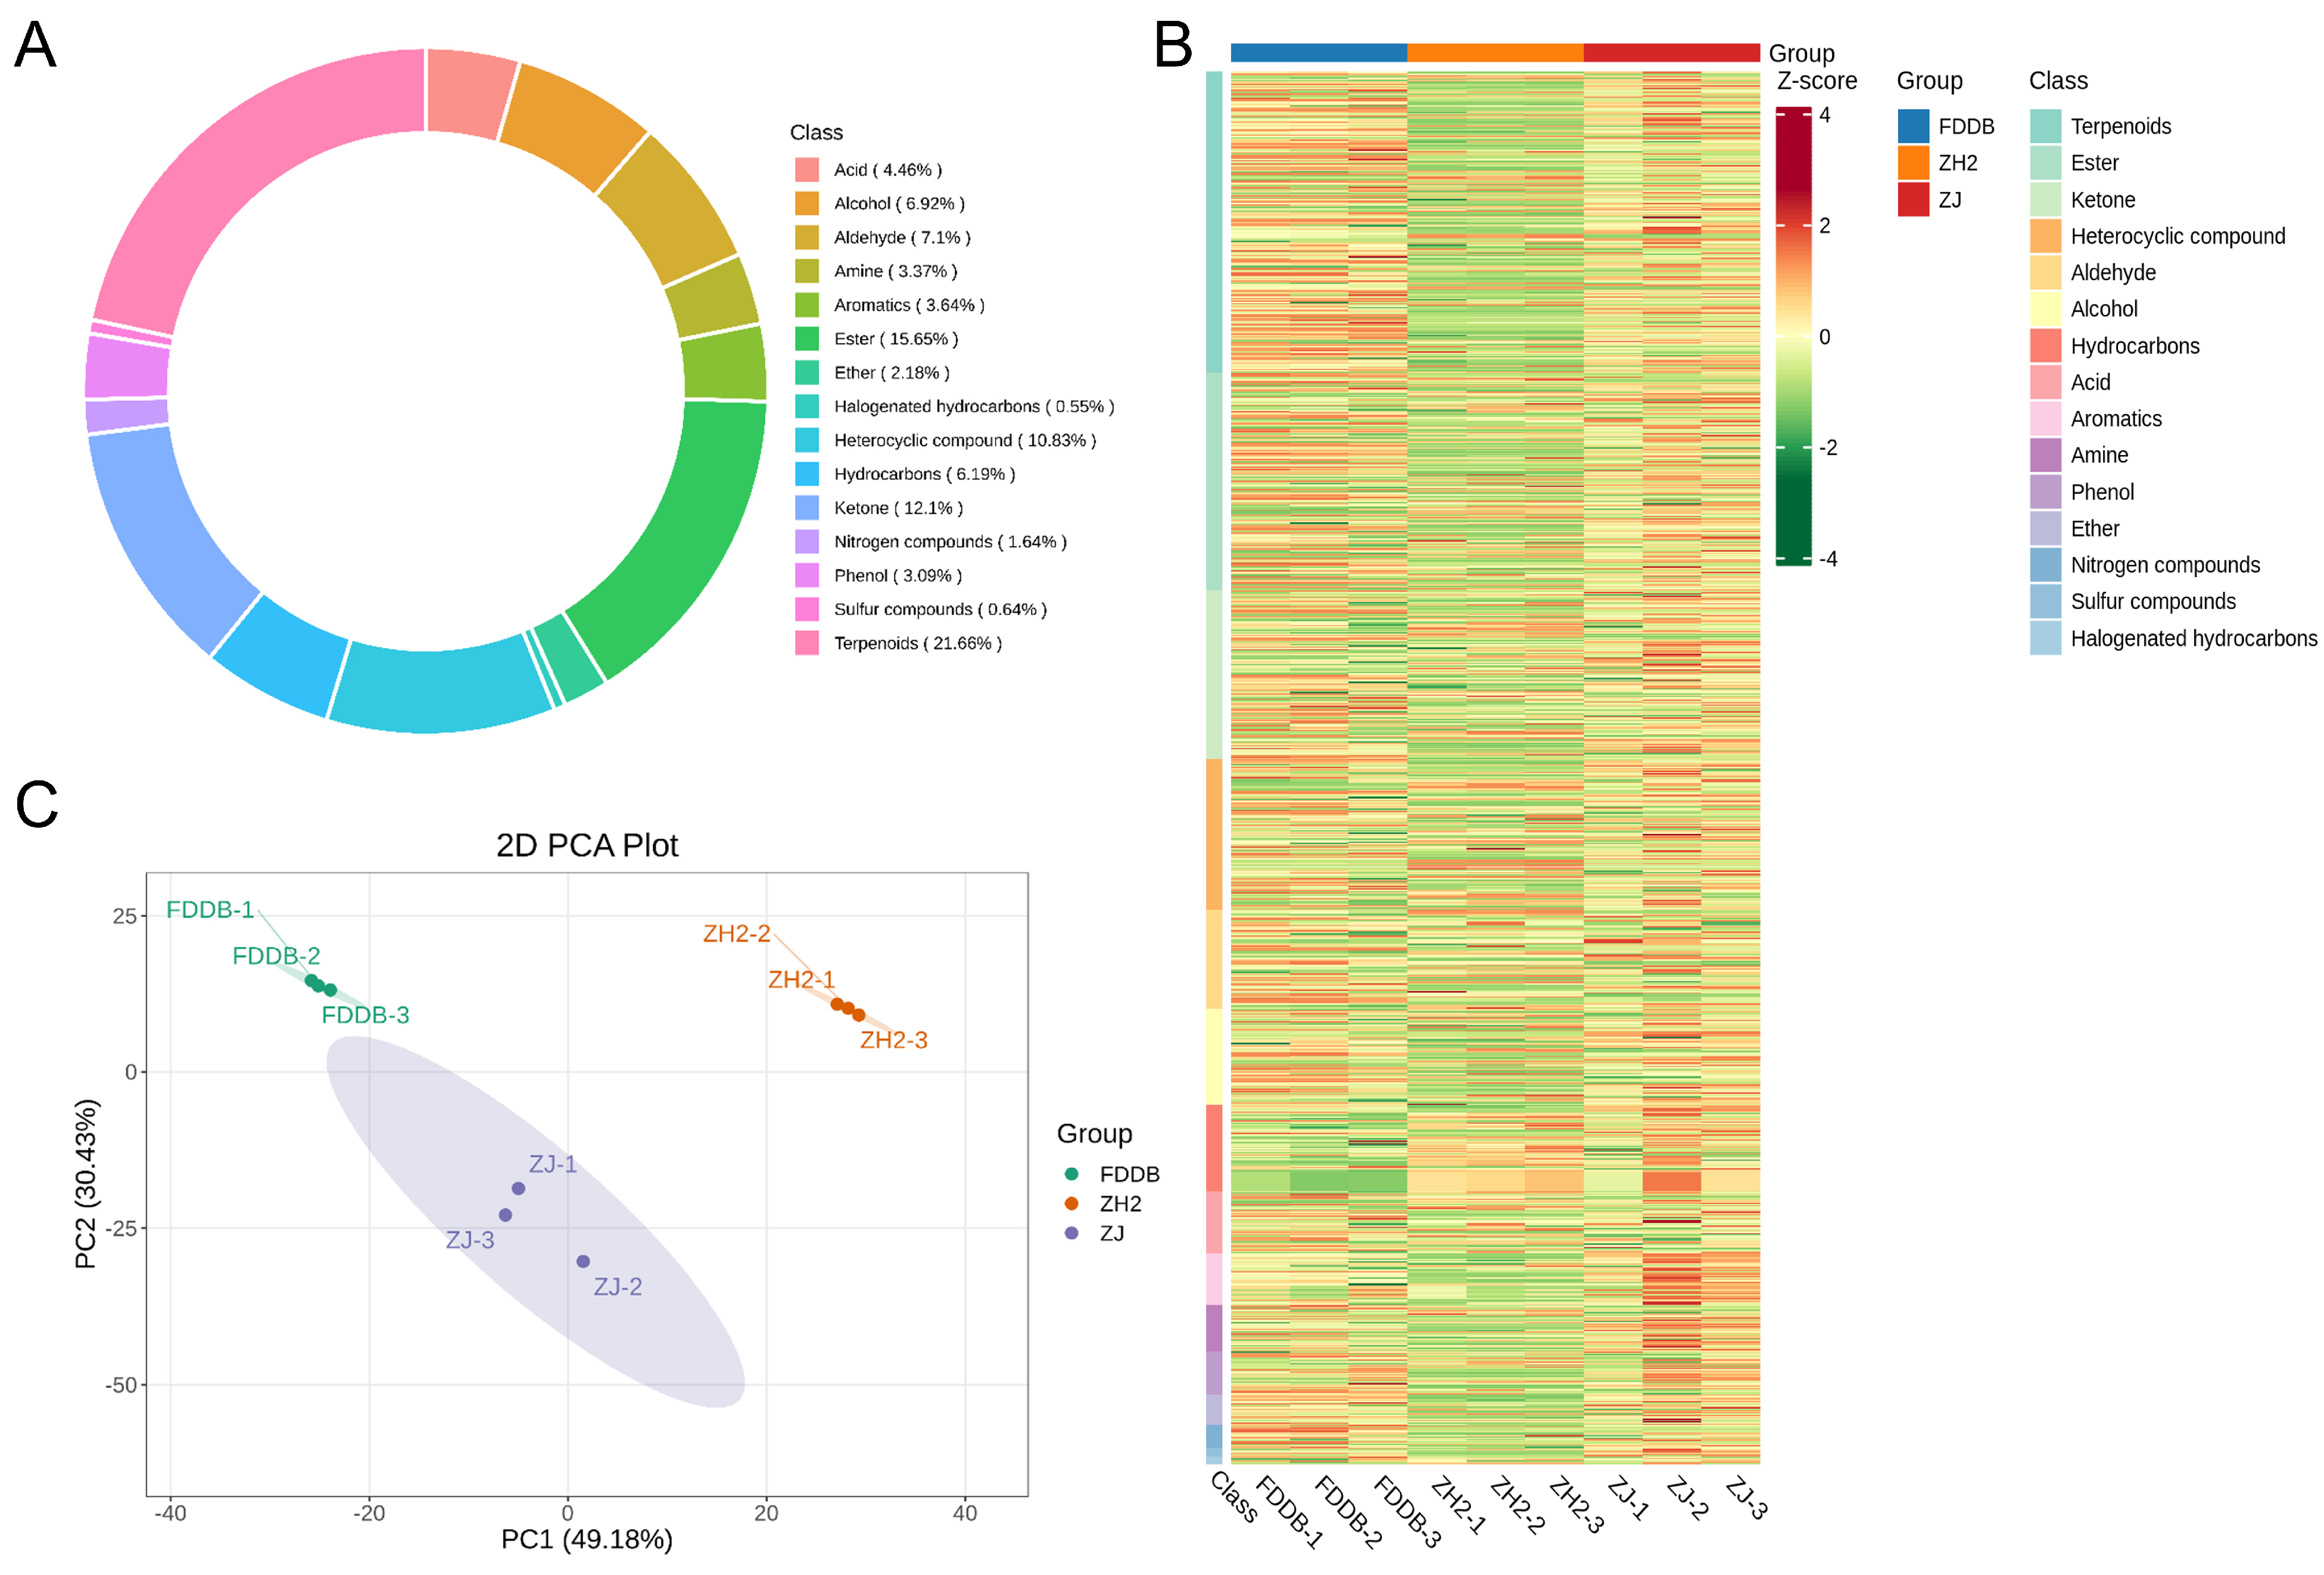
Aroma, influenced by multiple volatile compounds, serves as a crucial criterion for evaluating tea quality [43,44]. In this study, HS-SPME-GC-MS was used to analyze the aroma profiles of three tea samples, identifying over 1100 volatile compounds. Among these compounds, terpenes exhibited the highest content, accounting for 21.66% of total volatiles, followed by esters, ketones, heterocyclic compounds, and aldehydes, representing 15.65%, 12.10%, 10.83%, and 7.10%, respectively (Figure 5A,B), and this results aligned with the characteristic profile of volatile compounds present in green teas [22,45,46]. The MS/MS spectra and GC-MS/MS chromatograms of 30 key volatile compounds are provided in Figures S4 and S5. Based on these components, we conducted PCA model analysis and showed that the first and second principal components explained 59.70% and 20.31% of the variance (Figure 5C). A clear separation trend was observed among the three tea samples in terms of volatile substance composition, indicating significant differences in the accumulation of volatile metabolites among the three groups.

3.3.3. Identification of Differential Volatile Compounds

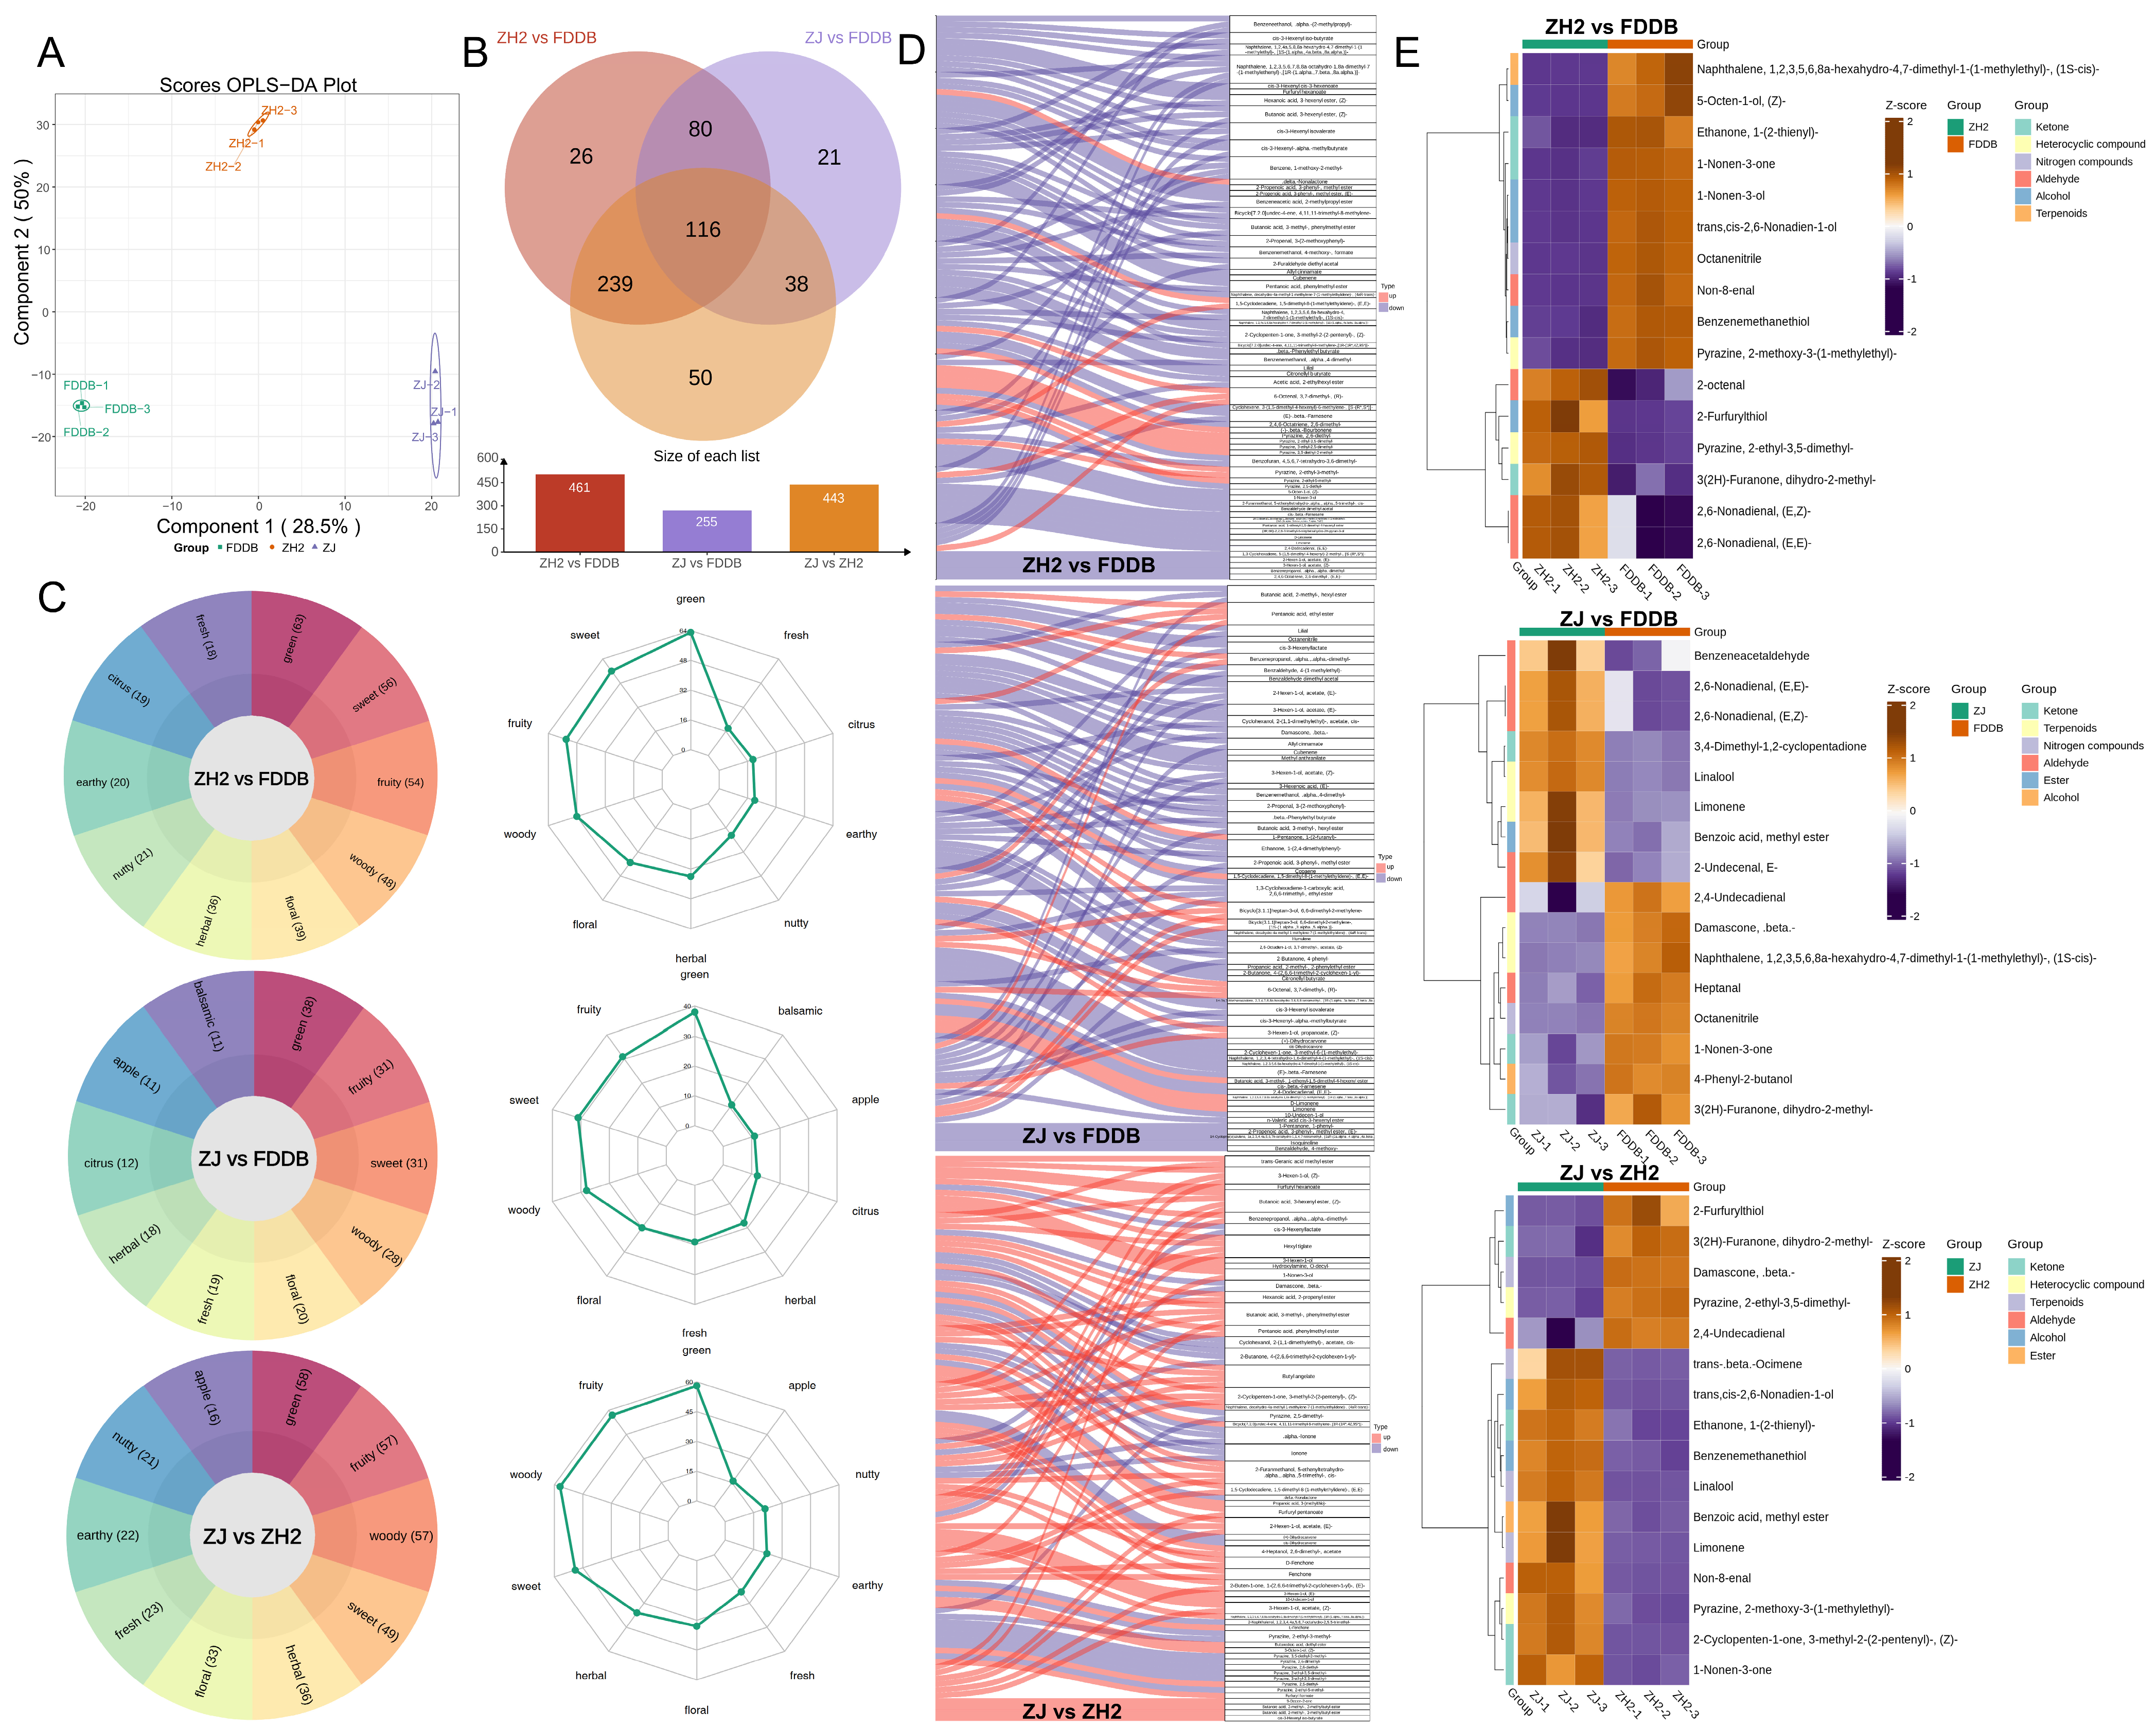
OPLS-DA based on the 1100 volatile compounds revealed clear separation according to leaf color (Figure 6A). Ultimately, 116 differentially volatile components (VIP > 1) were identified in the study samples, such as (+)-Dihydrocaryone, cis-Dihydrocaryone, o-Decylhydroxylamine, 4-Hexenoic acid acetate, 10-undecylenol, (E)-3-hexenoic acid, trans-2-hexenyl acetateand (E)-3-hexenyl acetate, etc. These compounds have been identified as differential compounds in numerous studies and primarily contribute to characteristics such as the fresh aroma of tea [47,48,49]. Pairwise comparisons identified 461 differential metabolites between ZH2 and FDDB, 443 between ZH2 and ZJ, and only 255 between ZJ and FDDB (Figure 6B). As shown in Figure 6C, ZH2 and ZJ exhibited more pronounced green, fruity, and sweet aromas compared to FDDB, with ZJ showing additional woody aroma. Furthermore, comparative analysis using Sankey diagrams of volatile metabolites confirmed that the flat green teas processed from FDDB, ZH2, and ZJ possessed clearly distinct aroma profiles (Figure 6D). Figure 6E illustrates the expression characteristics of the differential volatile compounds in different comparison groups.

3.3.4. Key Aroma-Active Volatiles in Three Tea Samples with Different Color

It is noteworthy that while over 700 volatile compounds have been identified in tea, only a small number of volatile metabolites in leaves are crucial to the overall aroma characteristic [18,46]. rOAV is used to quantify and evaluate the contribution of various volatile compounds to the overall aroma profile of a sample. According to established criteria in tea flavor research, volatile compounds with an rOAV ≥ 1 are defined as key aroma-active components and those with higher rOAVs exert a more prominent influence on the overall aromatic profile of tea [25,50,51,52]. Based on these criteria, we identified 94, 75, and 90 key aroma-active volatile compounds in FDDB, ZH2, and ZJ, respectively (Table 1). Among these, 1-nonen-3-one, 3(2H)-Furanone, dihydro-2-methyl-, Pyrazine, 2-methoxy-3-(1-methylethyl)- and 54 other compounds were common to all three cultivars. These aroma compounds likely constitute the key components shaping the overall aroma profile of the three flat green tea samples. Interestingly, 3-Buten-2-one, 4-(2,6,6-trimethyl-1-cyclohexen-1-yl)-(floral), Heptanal (fresh) and beta-Damascone (fruity) had been regarded as key specific aroma compounds in FDDB, enhancing its floral, fresh and fruity aromas. Additionally, ZH2 accumulated lower abundances of 4-Phenyl-2-butanol (floral), 5-Octen-1-ol, (Z)- (floral), 3(2H)-Furanone (green), dihydro-2-methyl- (sweet) and Pyrazine, 2-ethyl-3,5-dimethyl- (green), while ZJ showed higher enrichment in 2,6-Nonadienal, (E,Z)- (floral and woody), 2,6-Nonadienal, (E,E)- (floral) and 2-Nonenal (E)- (fruity). This compositional difference aligns with the sensory evaluation results, demonstrating that ZJ displayed the most pronounced floral and fruity notes compared with FDDB and ZH2. These findings had shown that tea cultivars with different leaf colors play a critical role in shaping the volatile metabolome and the sensory quality of tea.

4. Conclusions

This study comprehensively characterized the distinctive quality attributes of flat green teas produced from FDDB, ZH2, and ZJ cultivars through an integrated analytical approach encompassing sensory evaluation, GC-E-nose, widely targeted metabolomics, HS-SPME-GC-MS, and rOAV analysis. A total of 2050 non-volatile metabolites were identified across the three tea samples, with flavonoids (483), phenolic acids (313), and amino acids and their derivatives (214) representing the most abundant classes. Comparative analysis of differential metabolites revealed 902, 895, and 1180 differential metabolites in the pairwise comparisons of ZH2 vs. FDDB, ZJ vs. FDDB, and ZH2 vs. ZJ, respectively. These differential metabolites were primarily categorized as flavonoids, phenolic acids, and amino acids and their derivatives. GC-E-nose was verified as an effective tool for the rapid discrimination of tea samples, providing a valuable complement to sensory evaluation. Furthermore, a total of 1100 volatile compounds were identified in the three teas, including 238 terpenoids, 173 esters, 133 ketones, and 119 heterocyclic compounds. Among these, 94, 75, and 90 key aroma-active volatiles (rOAV ≥ 1) were detected in FDDB, ZH2, and ZJ, respectively. Interestingly, FDDB was characterized by 3-Buten-2-one, 4-(2, 6, 6-trimethyl-1-cyclohexen-1-yl)-, Heptanal and beta-Damascone; ZH2 showed lower abundances of 4-Phenyl-2-butanol and 3(2H)-Furanone, and ZJ was enriched in 2,6-Nonadienal and 2-Nonenal. This study provides profound insights into the unique quality foundations of teas processed from cultivars with special leaf colors, laying a scientific foundation for the further development of specialty-colored tea cultivars and the optimization of tea processing techniques to enhance tea quality.

Supplementary Materials

The following supporting information can be downloaded at: https://www.mdpi.com/article/10.3390/foods15111862/s1, Figure S1: The MS/MS spectra of 30 representative non-volatile compounds (level 1). Figure S2: The UPLC-MS/MS chromatogram of 30 representative non-volatile compounds (level 1). Figure S3: Permutation test of the OPLS-DA model of the non-volatile compounds; (A) ZH2 vs. FDDB; (B) ZJ vs. FDDB; (C) ZJ vs. ZH2. Figure S4: The MS/MS spectra of 30 representative volatile compounds. Figure S5: The GC-MS/MS chromatogram of 30 representative volatile compounds. Table S1: The MRM ion pairs (Q1 and Q3) for non-volatile compounds. Table S2: The SIM ion pairs (Quantitative and Qualitative) for volatile compounds.

Author Contributions

Conceptualization, C.Y.; methodology, Y.D., Y.S. and C.Y.; formal analysis, Y.D., Y.S., Y.O., K.Z. and L.Q.; investigation, Y.D., Y.S., L.Q., K.Z., Y.O. and C.Y.; data curation, Y.D., L.Q. and Y.O.; writing—original draft preparation, Y.D. and C.Y.; writing—review and editing, C.Y. and Y.D.; supervision, C.Y.; funding acquisition, C.Y. All authors have read and agreed to the published version of the manuscript.

Funding

This research was funded by the Chongqing Technology Innovation and Application Demonstration Project (grant number CSTB2022TIAD-KPX0093); National College Student Innovation and Entrepreneurship Program Project in Southwest University (grant numbers 202510635018 and S202510635251).

Institutional Review Board Statement

The research involved tea sensory evaluation, which falls outside the scope of regulations requiring institutional review board or ethics committee oversight, as per international standards for sensory analysis of food products.

Informed Consent Statement

Informed consent was obtained from all subjects involved in the study.

Data Availability Statement

The original contributions presented in this study are included in the article/Supplementary Materials. Further inquiries can be directed to the corresponding author.

Conflicts of Interest

The authors declare no conflicts of interest.

References

  1. Feng, W.; Zhou, H.; Xiong, Z.; Sheng, C.; Xia, D.; Zhang, J.; Li, T.; Wei, Y.; Deng, W.-W.; Ning, J. Exploring the Effect of Different Tea Varieties on the Quality of Lu’an Guapian Tea Based on Metabolomics and Molecular Sensory Science. Food Chem. X 2024, 23, 101534. [Google Scholar] [CrossRef] [PubMed]
  2. Kong, W.; Kong, X.; Xia, Z.; Li, X.; Wang, F.; Shan, R.; Chen, Z.; You, X.; Zhao, Y.; Hu, Y.; et al. Genomic Analysis of 1325 Camellia Accessions Sheds Light on Agronomic and Metabolic Traits for Tea Plant Improvement. Nat. Genet. 2025, 57, 997–1007. [Google Scholar] [CrossRef]
  3. Wang, Y.; Fang, M.; Zheng, S.; Cho, J.-G.; Yi, T.-H. Identification of Chinese Green Tea (Camellia sinensis) Marker Metabolites Using GC/MS and UPLC-QTOF/MS. Food Sci. Biotechnol. 2021, 30, 1293–1301. [Google Scholar] [CrossRef] [PubMed]
  4. An, Y.; Zhang, L.; Li, X.; Mi, X.; Qiao, D.; Jing, T. Integrated Multi-Omics Reveals Distinct Non-Volatile and Aroma Signatures in Albino, Yellow, and Purple Tea Varieties. Food Chem. X 2025, 29, 102830. [Google Scholar] [CrossRef]
  5. Guo, X.; Schwab, W.; Ho, C.-T.; Song, C.; Wan, X. Characterization of the Aroma Profiles of Oolong Tea Made from Three Tea Cultivars by Both GC–MS and GC-IMS. Food Chem. 2022, 376, 131933. [Google Scholar] [CrossRef]
  6. Li, Y.; Han, Z.; Wang, M.; Yan, Y.; Ma, R.; Wang, H.; Deng, W.-W. Metabolomics and Sensory Evaluation Reveal the Influence of Four Albino Tea Cultivars on the Quality of Processed Green Tea. Food Res. Int. 2025, 209, 116180. [Google Scholar] [CrossRef]
  7. Yang, J.; Zhou, H.; Liu, Y.; Wang, H.; Xu, Y.; Huang, J.; Lei, P. Chemical Constituents of Green Teas Processed from Albino Tea Cultivars with White and Yellow Shoots. Food Chem. Mol. Sci. 2022, 5, 100143. [Google Scholar] [CrossRef]
  8. Chen, L.; Song, Z.; Xiang, L.; Chen, J.; Zhang, Y.; Yu, W. How Do Green-Leaf and Yellow-Leaf Tea Cultivars Influence Oolong Tea Flavor? Insights from Metabolomic Analysis with Two Fujian Traditional Processing Technologies. LWT 2026, 242, 119144. [Google Scholar] [CrossRef]
  9. Ye, Y.; Gong, Y.; Huang, P.; Luo, F.; Gan, R.; Fang, C. Dynamic Changes in the Non-Volatile and Flavour Compounds in Withered Tea Leaves of Three Different Colour Cultivars Based on Multi-Omics. Food Chem. 2024, 449, 139281. [Google Scholar] [CrossRef] [PubMed]
  10. Yang, G.; Zhou, M.; Li, Y.; Kilmartin, P.A.; Lin, Z.; Shi, J.; Lv, H. Linking Chemical Profiles to Sensory Quality: Insights into Color and Taste Formation in Purple Leaf Tea Infusions. Food Chem. 2026, 507, 148283. [Google Scholar] [CrossRef]
  11. Chen, Y.; Yang, J.; Meng, Q.; Tong, H. Non-Volatile Metabolites Profiling Analysis Reveals the Tea Flavor of “Zijuan” in Different Tea Plantations. Food Chem. 2023, 412, 135534. [Google Scholar] [CrossRef]
  12. Liu, L.; Qiao, D.; Mi, X.; Yu, S.; Jing, T.; An, Y. Widely Targeted Metabolomics and SPME-GC-MS Analysis Revealed the Quality Characteristics of Non-Volatile/Volatile Compounds in Zheng’an Bai Tea. Front. Nutr. 2024, 11, 1484257. [Google Scholar] [CrossRef]
  13. Wang, H.; Hua, J.; Yu, Q.; Li, J.; Wang, J.; Deng, Y.; Yuan, H.; Jiang, Y. Widely Targeted Metabolomic Analysis Reveals Dynamic Changes in Non-Volatile and Volatile Metabolites during Green Tea Processing. Food Chem. 2021, 363, 130131. [Google Scholar] [CrossRef]
  14. Wang, J.; Qu, L.; Yu, Z.; Jiang, Y.; Yu, C.; Zhu, X.; Lin, Q.; Niu, L.; Yu, Y.; Lin, Q.; et al. Targeted Quantitative Metabolomic and Flavor Objective Quantification Technique Reveal the Impact Mechanism of Shaking on Black Tea Quality and Non-Volatile Metabolites. Food Chem. 2024, 458, 140226. [Google Scholar] [CrossRef]
  15. Li, J.; Han, S.; Mei, X.; Wang, M.; Han, B. Changes in Profiles of Volatile Compounds and Prediction of the Storage Year of Organic Green Tea during the Long-Term Storage. Food Chem. 2024, 437, 137831. [Google Scholar] [CrossRef]
  16. Liu, P.; Chen, J.; Feng, L.; Gao, S.; Wang, S.; Xue, J.; Wang, X.; Ye, F.; Gui, A.; Yu, Z.; et al. Processing Technology as Aroma Architect: OAV Fingerprints Decode Differentiation and Compatibility of Key Odorants in Fuding Dabai Tea via GC × GC-TOF-MS and Sensomics. Food Chem. X 2026, 34, 103530. [Google Scholar] [CrossRef] [PubMed]
  17. Wang, Z.; Zhu, A.; Zareef, M.; Feng, X.; Zhao, S.; Huo, S.; Chen, Q. Formation and Dynamic Evolution of Aroma, Taste, and Color in Spring Oolong Tea: Insights from the Entire Processing Procedure. Food Chem. 2025, 486, 144593. [Google Scholar] [CrossRef]
  18. Zhai, X.; Zhang, L.; Granvogl, M.; Ho, C.-T.; Wan, X. Flavor of Tea (Camellia sinensis): A Review on Odorants and Analytical Techniques. Compr. Rev. Food Sci. Food Saf. 2022, 21, 3867–3909. [Google Scholar] [CrossRef] [PubMed]
  19. Li, Z.; Gao, Z.; Yu, J.; Shi, H.; Ling, J.; Zhang, G. Applications of E-Nose, GC-MS, and GC-IMS in Tea Volatile Components analysisE-nose, GC-MS, and GC-IMS. J. Food Compos. Anal. 2026, 149, 108764. [Google Scholar] [CrossRef]
  20. Luo, Z.; Zhang, Q.; Yang, Y.; Song, C.; Cui, J.; Gao, T. Effect of Rainy-Day Harvesting on the Aroma Profile of Wuyi Rock Tea Based on GC–MS and Chemical Analysis. Food Chem. X 2025, 29, 102753. [Google Scholar] [CrossRef]
  21. Xiao, Y.; Tian, R.; Shen, Y.; Tang, H.; Huang, J.; Wu, W.; Zhang, S.; Yin, X. Aroma Profiling by HS-SPME/GC-MS of Black Tea Produced from Different Leaf Grades. LWT 2025, 229, 118223. [Google Scholar] [CrossRef]
  22. Zhang, J.; Feng, W.; Xiong, Z.; Dong, S.; Sheng, C.; Wu, Y.; Deng, G.; Deng, W.-W.; Ning, J. Investigation of the Effect of Over-Fired Drying on the Taste and Aroma of Lu’an Guapian Tea Using Metabolomics and Sensory Histology Techniques. Food Chem. 2024, 437, 137851. [Google Scholar] [CrossRef]
  23. Moreira, J.; Aryal, J.; Guidry, L.; Adhikari, A.; Chen, Y.; Sriwattana, S.; Prinyawiwatkul, W. Tea Quality: An Overview of the Analytical Methods and Sensory Analyses Used in the Most Recent Studies. Foods 2024, 13, 3580. [Google Scholar] [CrossRef]
  24. GB/T 23776-2018; Methodology for Sensory Evaluation of Tea. Standards Press of the People’s Republic of China: Beijing, China, 2018.
  25. Yue, C.; Cao, H.; Zhang, S.; Hao, Z.; Wu, Z.; Luo, L.; Zeng, L. Aroma Characteristics of Wuyi Rock Tea Prepared from 16 Different Tea Plant Varieties. Food Chem. X 2023, 17, 100586. [Google Scholar] [CrossRef] [PubMed]
  26. Sun, J.; Zhou, L.; He, Y.; Gui, L.; Cheng, Y.; Xie, M.; Liu, S.; Shen, Z.; Li, Y. Comprehensive Evaluation of Processing Suitability of Different Tea Cultivars for Huangshan Maofeng Green Tea. J. Food Compos. Anal. 2025, 147, 108114. [Google Scholar] [CrossRef]
  27. Wu, J.; Ouyang, Q.; Park, B.; Kang, R.; Wang, Z.; Wang, L.; Chen, Q. Physicochemical Indicators Coupled with Multivariate Analysis for Comprehensive Evaluation of Matcha Sensory Quality. Food Chem. 2022, 371, 131100. [Google Scholar] [CrossRef]
  28. Cao, H.; Yue, C.; Luo, L.; Wang, H.; Shao, H.; Wu, F.; He, L.; Lucini, L.; Zeng, L. Muti-Omics Analysis Reveals the Anthocyanin Biosynthesis and Accumulation Mechanism in the Hawk Tea Tree (Litsea coreana var. lanuginose). Food Biosci. 2024, 62, 105497. [Google Scholar] [CrossRef]
  29. Yang, Y.; Chen, J.; Jiang, Y.; Qian, M.C.; Deng, Y.; Xie, J.; Li, J.; Wang, J.; Dong, C.; Yuan, H. Aroma Dynamic Characteristics during the Drying Process of Green Tea by Gas Phase Electronic Nose and Gas Chromatography-Ion Mobility Spectrometry. LWT 2022, 154, 112691. [Google Scholar] [CrossRef]
  30. Yang, Y.; Qian, M.C.; Deng, Y.; Yuan, H.; Jiang, Y. Insight into Aroma Dynamic Changes during the Whole Manufacturing Process of Chestnut-like Aroma Green Tea by Combining GC-E-Nose, GC-IMS, and GC × GC-TOFMS. Food Chem. 2022, 387, 132813. [Google Scholar] [CrossRef]
  31. Cheng, Q.; He, S.; Duan, X.; Chen, Y. The Flavor-Related Metabolites and Sensory Quality of White Tea Produced by Exogenous Methyl Jasmonate Treated Tea Leaves. Food Chem. 2026, 501, 147648. [Google Scholar] [CrossRef] [PubMed]
  32. He, L.; Wu, F.; Wang, D.; Wu, X.; Wei, F.; Liu, Y.; Yue, C.; Luo, L.; Zeng, L. Effects of Different Leaf Colors on the Quality of Hawk Black Tea: Sensory Evaluation and Metabolomics. Food Chem. 2025, 493, 145892. [Google Scholar] [CrossRef]
  33. Xue, J.; Liu, P.; Yin, J.; Wang, W.; Zhang, J.; Wang, W.; Le, T.; Ni, D.; Jiang, H. Dynamic Changes in Volatile Compounds of Shaken Black Tea during Its Manufacture by GC × GC–TOFMS and Multivariate Data Analysis. Foods 2022, 11, 1228. [Google Scholar] [CrossRef]
  34. Fang, X.; Liu, Y.; Xiao, J.; Ma, C.; Huang, Y. GC–MS and LC-MS/MS Metabolomics Revealed Dynamic Changes of Volatile and Non-Volatile Compounds during Withering Process of Black Tea. Food Chem. 2023, 410, 135396. [Google Scholar] [CrossRef]
  35. Tan, L.; Zhang, P.; Cui, D.; Yang, X.; Zhang, D.; Yang, Y.; Chen, W.; Tang, D.; Tang, Q.; Li, P. Multi-Omics Analysis Revealed Anthocyanin Accumulation Differences in Purple Tea Plants ‘Ziyan’, ‘Zijuan’ and Their Dark-Purple Hybrid. Sci. Hortic. 2023, 321, 112275. [Google Scholar] [CrossRef]
  36. Yang, J.; Zhou, Q.; Fang, S.; Yan, K.; Peng, Q.; Lin, Z.; Lv, H.; Mu, D.; Fu, J.; Shi, J. Comparative Analysis of Flavonoids, Carotenoids, and Major Primary Compounds in Site-Specific Yellow-Leaf Tea and Their Dynamic Alterations During Processing. Foods 2025, 14, 3575. [Google Scholar] [CrossRef] [PubMed]
  37. Pang, D.; Liu, Y.; Sun, Y.; Tian, Y.; Chen, L. Menghai Huangye, a Novel Albino Tea Germplasm with High Theanine Content and a High Catechin Index. Plant Sci. 2021, 311, 110997. [Google Scholar] [CrossRef] [PubMed]
  38. Wang, L.; Di, T.; Li, N.; Peng, J.; Wu, Y.; He, M.; Hao, X.; Huang, J.; Ding, C.; Yang, Y.; et al. Transcriptomic Analysis of Hub Genes Regulating Albinism in Light- and Temperature-Sensitive Albino Tea Cultivars ‘Zhonghuang 1’ and ‘Zhonghuang 2’. Plant Mol. Biol. 2024, 114, 44. [Google Scholar] [CrossRef]
  39. Chen, Z.; Liu, J.; Xiong, F.; Wang, Y.; Chen, Z.; Zhang, C.; Yang, Y.; Gao, C.; Cao, S.; Yu, S.; et al. Metabolome Technology Reveals the Material Basis for the Formation of Characteristic Flavors in Four Types of Purple Teas. Food Chem. X 2026, 34, 103551. [Google Scholar] [CrossRef] [PubMed]
  40. Liu, M.; Zhou, C.; Zhuang, R.; Ling, Z.; Leng, J.; Qin, X.; Tan, Y.; Yuan, Y.; Xiao, W. Improving Summer Black Tea Quality via Vibratory Withering and Piling Fermentation: Insights from Metabolomics and Sensory Analysis. Food Chem. 2025, 496, 146728. [Google Scholar] [CrossRef]
  41. Wang, H.; Liang, S.; Lang, X.; Wang, Y.; He, S.; Yamashita, H.; Zhang, S.; Wu, L.; Yue, J.; Ikka, T.; et al. Deciphering the Molecular Underpinnings of Anthocyanin Accumulation in Purple-Leaf Tea Plant Germplasm Resources. Sci. Hortic. 2025, 345, 114160. [Google Scholar] [CrossRef]
  42. Yang, G.; Shi, J.; Tan, L.; Yang, Y.; Guo, L.; Wang, L.; Zheng, X.; Lin, Z.; Lv, H. A Comprehensive Review on the Promising Purple Leaf Tea. Compr. Rev. Food Sci. Food Saf. 2025, 24, e70142. [Google Scholar] [CrossRef]
  43. Liao, S.; Mo, H.; Gao, Y.; Bouphun, T.; Xu, W.; Lin, L. Study on the Influence of Microorganisms on the Flavor of Black Tea. Food Chem. X 2025, 31, 103173. [Google Scholar] [CrossRef]
  44. Song, Y.; Li, J.; Ding, Q.; Yang, X.; Yu, J.; Zhang, Y.; Wang, Y.; Wan, X.; Zhai, X. Exploring Key Aroma Differences of Three “Fenghuang Dancong” Oolong Teas and Their Perception Interactions with Caffeine via Sensomics Approach. Food Res. Int. 2025, 202, 115665. [Google Scholar] [CrossRef]
  45. Wang, F.; Feng, H.; Zheng, Y.; Liu, R.; Dong, J.; Wu, Y.; Chen, S.; Zhang, B.; Wang, P.; Yan, J. Aroma Analysis and Biomarker Screening of 27 Tea Cultivars Based on Four Leaf Color Types. Food Res. Int. 2025, 201, 115681. [Google Scholar] [CrossRef]
  46. Xia, D.; Zhang, J.; Xiong, Z.; Huang, W.; Wei, Y.; Feng, W.; Huang, J.; Ning, J. Effects of Different Fixation Methods on the Aroma Quality of Anjibai Tea. LWT 2024, 204, 116430. [Google Scholar] [CrossRef]
  47. Hao, Z.; Feng, J.; Chen, Q.; Lin, H.; Zhou, X.; Zhuang, J.; Wang, J.; Tan, Y.; Sun, Z.; Wang, Y.; et al. Comparative Volatiles Profiling in Milk-Flavored White Tea and Traditional White Tea Shoumei via HS-SPME-GC-TOFMS and OAV Analyses. Food Chem. X 2023, 18, 100710. [Google Scholar] [CrossRef] [PubMed]
  48. Liu, N.; Shen, S.; Huang, L.; Deng, G.; Wei, Y.; Ning, J.; Wang, Y. Revelation of Volatile Contributions in Green Teas with Different Aroma Types by GC–MS and GC–IMS. Food Res. Int. 2023, 169, 112845. [Google Scholar] [CrossRef]
  49. Zhang, J.; Xia, D.; Li, T.; Wei, Y.; Feng, W.; Xiong, Z.; Huang, J.; Deng, W.-W.; Ning, J. Effects of Different Over-Fired Drying Methods on the Aroma of Lu’an Guapian Tea. Food Res. Int. 2023, 173, 113224. [Google Scholar] [CrossRef]
  50. Guo, X.; Ho, C.-T.; Wan, X.; Zhu, H.; Liu, Q.; Wen, Z. Changes of Volatile Compounds and Odor Profiles in Wuyi Rock Tea during Processing. Food Chem. 2021, 341, 128230. [Google Scholar] [CrossRef]
  51. Shi, J.; Wu, W.; Zhang, Y.; Baldermann, S.; Peng, Q.; Wang, J.; Xu, L.; Yang, G.; Fu, J.; Lv, H.; et al. Comprehensive Analysis of Carotenoids Constituents in Purple-Coloured Leaves and Carotenoid-Derived Aroma Differences after Processing into Green, Black, and White Tea. LWT 2023, 173, 114286. [Google Scholar] [CrossRef]
  52. Zhu, Y.-L.; Li, W.-X.; Zhang, Y.-H.; Yan, H.; Guo, L.-Y.; Zhang, Y.; Lv, H.-P.; Zhou, L.-H.; Lin, Z.; Wu, W.-L.; et al. Insight into Volatile Metabolites and Key Odorants in Black Teas Processed from Jianghua Kucha Tea Germplasm (Camellia sinensis var. assamica cv. Jianghua). Food Chem. 2025, 464, 141794. [Google Scholar] [CrossRef]
Figure 1. Sensory evaluation of three tea samples processed from FDDB, ZH2, and ZJ, respectively. (A) Tea appearance, tea infusion and brewed teas of tea samples; (B) tea taste scores; (C) tea aroma scores; (D) tea infusion colors evaluation, different superscript letters (a, b, c) in the same column indicate significant differences among samples (p < 0.05).
Foods 15 01862 g001
Figure 2. Overview of non-volatile metabolites. (A) Types and content of non-volatile metabolites; (B) PCA based on non-volatile metabolites; (C) heatmap of amino acids and derivatives, flavonoids, alkaloids, and lipids in three samples.
Foods 15 01862 g002
Figure 3. Differentially expressed non-volatile metabolites analysis. (A) OPLS-DA score plot; (B) Venn plots showing pairwise comparisons of differentially expressed non-volatile metabolites; (C) volcano plot showing the number of metabolites differing between ZH2 vs. FDDB, ZJ vs. FDDB, and ZJ vs. ZH2; (D) proportional composition of differentially expressed non-volatile compounds across the three tea samples.
Foods 15 01862 g003
Figure 4. GC E-nose analysis. (A) The PCA score plot of three samples using GC E-nose; (B) fingerprint spectra of three samples on MXT-5-FID1 and MXT-1701 columns.
Foods 15 01862 g004
Figure 5. Overview of volatile metabolites. (A) Types and content of volatile metabolites; (B) heatmap of volatile compounds. FDDB, ZH2, and ZJ represent flat-shaped green teas processed from green, yellow, and purple fresh leaves, respectively. Each sample group was replicated three times; (C) PCA based on volatile metabolites.
Foods 15 01862 g005
Figure 6. Volatile metabolites analysis. (A) OPLS-DA score plot; (B) Venn diagram showing pairwise comparisons of differentially non-volatile metabolites; (C) floral profile wheel and radar diagram; (D) Sanky diagram. (E) Heat maps show the amount of differential volatile compounds in different combinations.
Foods 15 01862 g006
Table 1. The volatile compounds with rOAV values greater than one in three tea samples.
IDNameThreshold
µg/g
CASOdor DescriptionrOAV
FDDBZH2ZJ
11-Nonen-3-one0.00000124415-26-7pungent, mushroom40,096.999761.0027,229.38
23(2H)-Furanone, dihydro-2-methyl-0.0000053188-00-9sweet, solvent, bread, buttery, nutty38,295.2458,759.8825,651.94
3Pyrazine, 2-methoxy-3-(1-methylethyl)-0.00000225773-40-4beany, pea, earthy, chocolate, nutty11,019.182004.4311,172.10
43-Buten-2-one, 4-(2,6,6-trimethyl-1-cyclohexen-1-yl)-0.00000714901-07-6floral, woody, sweet, fruity, berry, tropical, beeswax5238.383863.685283.60
5Beta-Damascone0.00000223726-91-2fruity, floral, berry, plum, black currant, honey, rose, tobacco1715.752874.49345.13
61-Hexen-3-one0.000021629-60-3cooked, vegetable, metallic1012.991726.141302.12
7Octanenitrile0.00013124-12-9fatty, aldehydic, green794.53152.81146.98
8Non-8-enal0.000239770-04-2smoky, plastic724.5782.59715.63
9Benzenemethanethiol0.0000035100-53-8sharp, alliaceous, onion, sulfury, garlic, horseradish, minty, coffee722.21129.97561.11
104-Heptenal, (Z)-0.0000256728-31-0oily, fatty, green, dairy, milky, creamy444.89409.72280.19
112,6-Nonadienal, (E,Z)-0.00001557-48-2cucumber, green193.93724.73773.17
122-Cyclopenten-1-one, 3-methyl-2-(2-pentenyl)-, (Z)-0.00026488-10-8woody, herbal, floral, spicy, jasmin, celery326.6371.37377.12
132,4-Undecadienal0.0000113162-46-4green, buttery, spicy, baked, fruity, fatty, aldehydic, chicken191.81289.5678.22
14trans-.beta.-Ionone0.000279-77-6dry, powdery, floral, woody, orris183.34135.23184.93
153-Octen-2-one0.000031669-44-9earthy, spicy, herbal, sweet, mushroom, hay, blueberry175.2799.05190.42
16Ethanone, 1-(2-thienyl)-0.00188-15-3sulfury, nutty, hazelnut, walnut95.814.9986.39
17Cyclohexanone, 2,2,6-trimethyl-0.00012408-37-9pungent, thujone, labdanum, honey, cistus60.7951.6061.55
182-octenal0.00022363-89-5fatty, green, herbal57.8282.1665.23
19Dodecanenitrile0.000092437-25-4citrus, orange, peel, metallic, spicy49.6453.9161.66
203,5-Octadien-2-one, (E,E)-0.000530086-02-3fruity, green, grassy28.9614.8622.28
212-Nonenal, (E)-0.0000818829-56-6fatty, green, cucumber, aldehydic, citrus29.1142.2649.13
223-mercapto-2-pentanone0.000767633-97-0sulfury, metallic, roasted, onion, horseradish, potato26.3023.2716.61
236-Nonenal, (Z)-0.000142277-19-2green, cucumber, melon, cantaloupe, honeydew, waxy, vegetable, orris, violet, leafy24.5136.6634.77
242-Nonenal0.00012463-53-8fatty, green, waxy, cucumber, melon23.2933.8039.30
25trans,cis-2,6-Nonadien-1-ol0.00128069-72-9green, cucumber, oily, violet, leafy21.704.9118.14
26Pyrazine, 2-ethyl-3,5-dimethyl-0.0000413925-07-0burnt, almond, roasted, nutty, coffee23.10157.5238.00
271-Nonen-3-ol0.00121964-44-3oily, creamy, green, earthy, mushroom19.061.8216.55
28Naphthalene, 1,2,3,5,6,8a-hexahydro-4,7-dimethyl-1-(1-methylethyl)-, (1S-cis)-0.0015483-76-1thyme, herbal, woody, dry17.921.242.70
292-Furfurylthiol0.00000698-02-2sulfury, roasted, coffee, oily, fatty, burnt, smoky13.6884.6714.27
30Heptanal0.0028111-71-7fresh, aldehydic, fatty, green, herbal, wine, ozonous13.1712.107.95
312,4-Decadienal, (E,E)-0.0000725152-84-5dusty, waxy, oily, soapy11.9713.3711.58
322-Undecenal, E-0.0007853448-07-0fresh, fruity, citrus, orange, peel9.4915.4814.52
33.beta.-Myrcene0.015123-35-3musty, balsamic, spice9.165.388.43
345-Octen-1-ol, (Z)-0.00264275-73-6green, melon, watery, watermelon, earthy, mushroom, violet, leafy, fishy, soapy9.032.497.36
352,6-Nonadienal, (E,E)-0.000517587-33-6fresh, citrus, green, cucumber, melon3.8814.4915.46
36Benzoic acid, methyl ester0.0005293-58-3phenol, wintergreen, almond, floral, canga7.163.4414.91
37Linalool0.00678-70-6floral, green6.813.3014.66
384-Phenyl-2-butanol0.00432344-70-9floral, peony, foliage, sweet, mimosa, heliotrope6.282.042.30
39Nonanal0.001124-19-6aldehyde, citrus, orange peel5.845.099.76
40(2S,4R)-4-Methyl-2-(2-methylprop-1-en-1-yl)tetrahydro-2H-pyran0.00023033-23-6rose, cortex, green, floral, geranium, powdery, metallic5.928.907.78
412H-Pyran, tetrahydro-4-methyl-2-(2-methyl-1-propenyl)-0.000216409-43-1sweet, floral, aromatic, rose, fresh, bay, leafy5.928.907.78
423,4-Dimethyl-1,2-cyclopentadione0.01713494-06-9sweet, maple, caramel, sugar, fenugreek, licorice4.836.8910.61
43Benzeneacetaldehyde0.0063122-78-1floral, honey, rose, cherry4.512.297.50
442-Octenal, (E)-0.0032548-87-0fresh, cucumber, fatty, green, herbal, banana, waxy, leafy3.855.484.35
45Limonene0.01138-86-3citrus, herbal, terpene, camphor3.631.359.20
46Oxazole, trimethyl-0.00520662-84-4nutty, nut skin, roasted, wasabi, shellfish, mustard, vegetable3.514.324.34
473-Nonanone0.017925-78-0caramel, spicy, sweet3.212.093.43
48trans-.beta.-Ocimene0.0343779-61-1sweet, herbal3.201.654.23
49Bicyclo[2.2.1]heptan-2-ol, 1,7,7-trimethyl-, (1S-endo)-0.048464-45-9pine, woody, camphor1.922.532.41
50Naphthalene, 2-methyl-0.00491-57-6sweet, floral, woody2.522.903.50
51Butanoic acid, butyl ester0.028109-21-7fruity, banana, pineapple, green, cherry, tropical fruit, ripe fruit, juicy fruity2.835.053.48
52trans-Rose oxide0.0005876-18-6floral2.373.563.11
532-n-Butyl furan0.0054466-24-4mild, fruity, wine, sweet, spicy2.101.951.25
541,3-Dithiolo[4,5-b]furan, tetrahydro-3a-methyl-0.00667411-25-0boiled, milky, chicken, cooked beef, rubbery, sulfury, thiamin1.902.832.34
552-Cyclopenten-1-one, 3-ethyl-2-hydroxy-0.05221835-01-8strong, caramel1.582.253.47
561,3-Cyclohexadiene-1-carboxaldehyde, 2,6,6-trimethyl-0.003116-26-7fresh, herbal, phenol, metallic, rosemary, tobacco, spicy1.682.411.32
57Naphthalene, 1-methyl-0.00890-12-0naphthyl, chemical, medicinal, camphor1.261.451.75
Disclaimer/Publisher’s Note: The statements, opinions and data contained in all publications are solely those of the individual author(s) and contributor(s) and not of MDPI and/or the editor(s). MDPI and/or the editor(s) disclaim responsibility for any injury to people or property resulting from any ideas, methods, instructions or products referred to in the content.