Article

Process Optimization and Odor Analysis of Instant Black Tea Powder

1
College of Food Science, Fujian Agriculture and Forestry University, Fuzhou 350002, China
2
College of Tea and Food Sciences, Wuyi University, Wuyishan 354300, China
*
Authors to whom correspondence should be addressed.
Foods 2025, 14(9), 1552; https://doi.org/10.3390/foods14091552
Submission received: 31 March 2025 / Revised: 16 April 2025 / Accepted: 24 April 2025 / Published: 28 April 2025

Abstract

:
This study enhanced the odor retention of instant black tea powder by utilizing ultrasonic-assisted extraction and β-cyclodextrin embedding technology. Through single-factor tests considering variables such as the tea-to-water ratio, extraction temperature, ultrasonic extraction duration, and β-cyclodextrin addition, the optimal extraction conditions were determined. The ideal parameters were identified as follows: β-cyclodextrin was added at a rate of 7.5%, the tea-to-water ratio was 1:16, the ultrasonic extraction temperature was 52 °C, and the extraction duration was 30 min, and then the extract was processed by freeze-drying to obtain instant tea powder. Electronic nose trials revealed that the primary volatile odor compounds distinguishing the 14 groups of instant black tea soups were sulfides, terpenes, nitrogen oxides, alkanes, and aromatic compounds. HS-SPME-GC-MS analysis identified 65 effective volatile compounds, among which 11 key odor compounds, including Benzyl alcohol, Phytol, phenylethyl alcohol, 1,6,10-Dodecatrien-3-ol,3,7,11-trimethyl-,(E)-, Benzeneacetaldehyde, Undecanoic acid, ethyl ester, Dodecanoic acid, ethyl ester, Tetradecane, 2,4-Di-tert-butylphenol, 2-Pentadecanone, 6,10,14-trimethyl-, and indole, were the main contributors to the odor profile of instant black tea. The instant black tea powder produced under these conditions exhibited high quality, providing a valuable reference for further research on the production process of instant black tea powder.

Graphical Abstract

1. Introduction

China, as the birthplace of black tea, boasts a rich and profound tea culture [1,2,3,4]. Black tea is one of the six basic types of tea in China and plays a pivotal role in the country’s tea production and export [5,6,7,8]. Summer and autumn teas have notably lower levels of amino acids and vitamins, while caffeine and polyphenol levels are much higher, which significantly diminish the balance of taste and odor compared to spring teas [9,10,11]. Despite the abundance of summer and autumn tea resources, their lower quality and underutilization lead to substantial resource waste [12].
Shuai Daliang et al. [13] used fresh summer and autumn tea leaves (one bud and two leaves) as raw materials to produce black tea, inoculating them with Fu brick tea bacterial liquid to create a unique red tea product combining the distinctive aromas of both black tea and goldenrod fungus. By fermenting black tea with the enzyme polyphenol oxidase found in apple, pear, or banana, Zou Chun et al. enhanced the quality and flavor of summer and autumn black tea, reducing its bitterness and astringency while imparting a sweet, fruity odor. Additionally, research has explored using summer and autumn tea to produce instant black tea concentrate, which is rich in nutrients, portable, and well suited for a fast-paced lifestyle [14,15]. The challenge remains to overcome the limitations of traditional instant tea processing techniques, minimize the loss of tea odor during production, preserve as much of the original black tea’s content and fragrance as possible, and improve the overall quality of instant tea [16,17].
The odor of tea soup is a critical factor influencing the quality of instant tea products [18,19,20,21,22,23]. β-cyclodextrin (β-CD) aids in the preservation and enhancement of odor by encapsulating the fragrant compounds in tea leaves, thereby reducing their loss during processing [4]. Yang Doudou et al. improved the solubility and rapid dissolution of mulberry leaf instant tea powder by incorporating 5% β-cyclodextrin as an embedding agent and extracting the leaves for 20 min [24]. In this study, ultrasonic-assisted extraction was used to shorten the extraction time. Instant black tea was prepared by the β-cyclodextrin embedding method with response surface optimization [25,26,27,28]. The quality of the prepared instant black tea powder was analyzed comprehensively by an electronic nose combined with HS-SPME-GC-MS [29,30,31], so as to provide a reference for further improving the quality of instant black tea [32,33].

2. Materials and Methods

2.1. Materials and Reagents

Black tea was obtained from Wuyishan Xuling Rock Tea Factory, Wuyishan City, Fujian Province, China; β-cyclodextrin (food grade) from Yunmo Biotechnology Co., Ltd., Shanghai City, China; Ethyl caprate (chromatography pure) from Shanghai Aladdin Biochemical Technology Co., Ltd., Shanghai City, China; and n-hexane (chromatography pure) from Shanghai Maclean’s Biochemical Technology Co., Ltd., Shanghai City, China.

2.2. Instruments and Equipment

The YF-6CHZ-2 Tea Roasting Machine was obtained from Fujian Anxi Yongfeng Machinery Co., Ltd., Anxi County, Quanzhou City, Fujian Province, China; FW80 high-speed grinder from Tianjin Tester Instrument Co., Ltd., Tianjin City, China; KQ5200DE CNC ultrasonic cleaner from Kunshan Ultrasonic Instrument Co., Ltd., Kunshan City, Jiangsu Province, China; RE-5205A rotary evaporator from Shanghai Yarong Biochemical Instrument Factory, Shanghai City, China; BUCHI L-200 Freeze Dryer from Shanghai Shujun Instrument Equipment Co., Ltd., Shanghai City, China; PEN3 electronic nose from Beijing Yingsheng Hengtai Technology Co., Ltd., Beijing City, China; DVB/CAR/PDMS solid-phase microextraction fibers from Shanghai Jingrui Scientific Instrument Effective Company, Shanghai City, China; and GCMS-TQ8050NX Gas Chromatography Mass Spectrometer from Shimadzu Instruments (Suzhou) Co., Ltd., Suzhou City, Jiangsu Province, China.

2.3. Test Method

2.3.1. Instant Black Tea Powder Preparation Process

The production process of instant black tea powder consists of several key steps. Initially, black tea powder was prepared, followed by extraction. The extract was then filtered to remove impurities. Subsequently, rotary evaporation and concentration were performed to concentrate the tea extract. The concentrated extract was frozen at −80 °C and then subjected to vacuum freeze-drying to obtain the instant black tea powder. Finally, the product was stored in a sealed container to maintain its quality.
The specific process for producing instant black tea powder is as follows: First, remove the thick stems from the black tea, dry it at 80 °C for 30 min, and then grind it using a high-speed grinder and sieve it through a 40-mesh sieve. Accurately weigh 10 g of black tea powder (with an accuracy of ±0.001 g). Transfer 200 mL of purified water at 55 °C (solid-to-liquid ratio: 1:20) into an 800 mL beaker. Add β-cyclodextrin to the beaker, stir thoroughly, cover the beaker with plastic wrap, and proceed with ultrasonic extraction using an ultrasonic device set to 28 kHz at a constant temperature of 55 °C for 30 min. Simultaneously, perform a control experiment by conducting a static extraction under the same temperature conditions without adding β-cyclodextrin. Once the extraction is complete, filter and separate the tea powder and tea infusion using a 150-mesh nylon gauze. Then, transfer the filtered extract to an evaporating flask and concentrate it under vacuum for approximately 15 to 20 min until the solution becomes viscous. Place the concentrate into a 50 mL storage tube and freeze it at −80 °C for 18 h. To produce instant black tea powder, seal the frozen concentrate in an aluminum foil bag, puncture small holes in the bag, and freeze-dry it under low-temperature vacuum conditions for 96 h. Finally, seal the powder in a polyethylene bag and store it in a desiccator to maintain its quality.

2.3.2. Extraction Single-Factor Optimization Test

Single-factor experiments were conducted to optimize the extraction process, taking into consideration the tea-to-water ratio (1:10, 1:15, 1:20, 1:25, 1:30), ultrasonic extraction time (10, 20, 30, 40, 50 min), ultrasonic extraction temperature (35, 45, 55, 60, 65 °C), and β-cyclodextrin addition levels (4%, 6%, 8%, 10%, 12%). Sensory evaluation scores were used as the assessment criteria, with each experiment repeated three times.

2.3.3. Sensory Evaluation Method for Instant Black Tea

For each group, 1 g of instant black tea powder was brewed in 200 mL of purified water at 80 °C to prepare samples for testing. A sensory evaluation panel of 10 tea tasters followed the method described by Lai [34] and the standards in Q/QRYZ 0004 S-2022. The sensory evaluation standards are shown in Table 1.

2.3.4. Design of Process Optimization Experiment Using Response Surface Methodology

Based on the results of single-factor experiments, response surface methodology (RSM) was employed to optimize the extraction process. The factors selected for optimization included the tea-to-water ratio (A), ultrasonic extraction temperature (B), and the amount of β-cyclodextrin added (C), with the sensory score as the dependent variable. The levels of these factors are shown in Table 2.

2.3.5. Measurement of Instant Black Tea Odor Components Using Electronic Nose

Accurately weigh 0.2 g of instant black tea powder (±0.001 g) into a 50 mL headspace vial. Add 10 mL boiling purified water, seal the vial, shake gently, and let it stand for 30 min. Set the following electronic nose parameters: gas flow rate to 0.4 L/min, sensor cleaning time to 200 s, sample preparation time to 5 s, and sample collection time to 90 s. Set the operating environment’s temperature to room temperature. Perform three parallel measurements for each sample.

2.3.6. Analysis of Odor Components and Content in Instant Black Tea Using HS-SPME-GC-MS

Accurately weigh 0.1 g of instant black tea powder (±0.001 g) into a 20 mL headspace vial. Add 5 mL of boiling purified water and 10 μL of a 50 μg/mL ethyl decanoate solution as the internal standard. Gently shake to mix, add a magnetic stir bar, seal the vial, and place it on a magnetic stirrer at 250 rpm and 75 °C for 10 min to equilibrate. Insert the extraction fiber into the headspace vial and extract for 50 min. After extraction, quickly remove the fiber and insert it into the gas chromatograph injection port. Desorb the sample at 250 °C for 3 min, and then perform GC-MS analysis [35].
The gas chromatography (GC) conditions are as follows: An HP-5MS capillary column (30 m × 250 µm × 0.25 µm) with a splitless injection mode, an injection port temperature of 250 °C, and high-purity helium gas (purity > 99.999%) as the carrier gas at a flow rate of 1.0 mL/min. A constant flow column flow control mode is used with a solvent delay of 3 min. The GC oven temperature program is as follows: hold at 50 °C for 1 min; increase to 80 °C at 2 °C/min and hold for 1 min; increase to 120 °C at 5 °C/min and hold for 1 min; increase to 140 °C at 4 °C/min and hold for 3 min; increase to 150 °C at 4 °C/min and hold for 3 min; increase to 160 °C at 5 °C/min and hold for 2 min; and finally, increase to 220 °C at 10 °C/min and hold for 5 min.
The mass spectrometry (MS) conditions are as follows: Electron impact ionization (EI) source with an electron energy of 70 eV, a transfer line temperature of 280 °C, an ion source temperature of 230 °C, and a quadrupole temperature of 150 °C. The scan mode is full scan (SCAN), with a mass scan range of m/z 45 to 600 amu.
The qualitative and semi-quantitative analysis of volatile odor compounds was performed using the NIST11 spectral library for compound identification, and the internal standard method was used for semi-quantification. Ethyl decanoate was used as the internal standard, and the concentration of volatile odor compounds was calculated using Equation (1):
C x = ( S x C i ) / S i
where Cx and Sx represent the concentration and peak area of the volatile odor compound, respectively, and Ci and Si represent the concentration and peak area of the internal standard ethyl decanoate, respectively.

2.4. Methods of Data Processing and Analysis

The response surface design and data analysis were performed using Design-Expert 13 software. The odor radar chart and odor component content chart were generated using Origin 2019 software. Additionally, principal component analysis (PCA) and loading analysis were conducted using Winmuster1.6.2 software.

3. Results and Discussion

3.1. Analysis of Different Processing Techniques for Instant Black Tea Powder

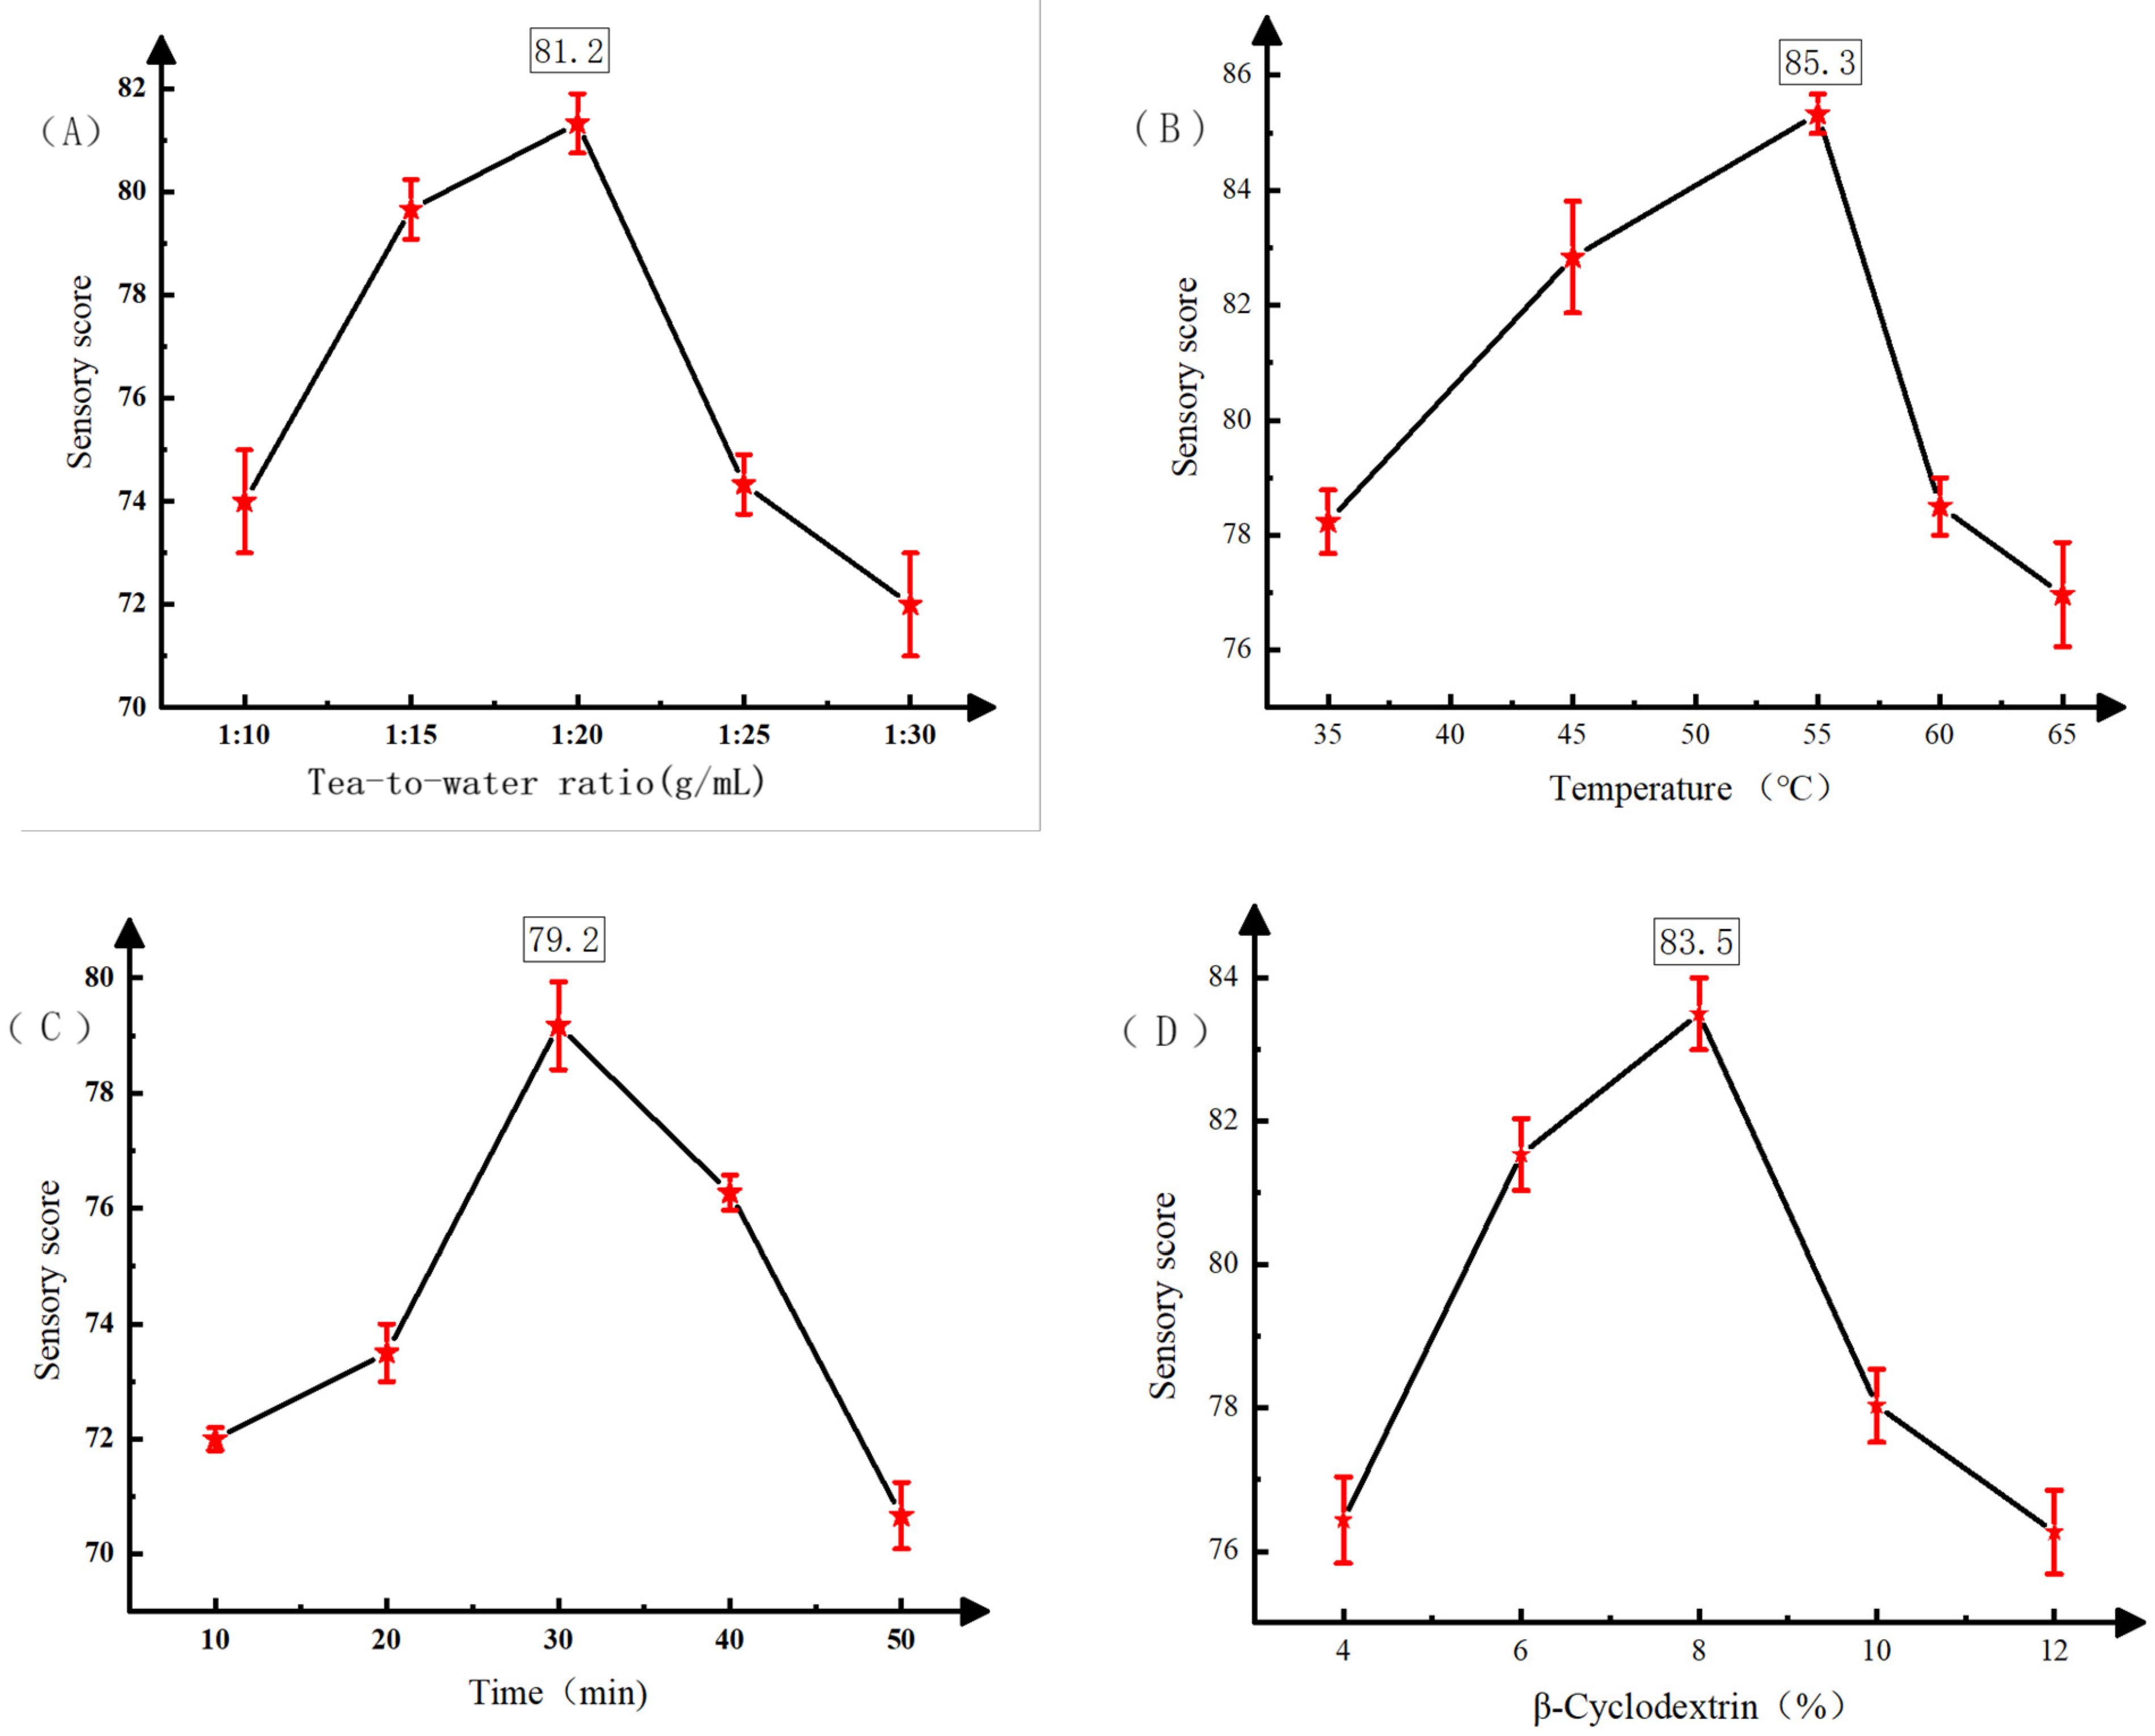
Single-Factor Test Results

The single-factor results (Figure 1) show that the sensory score of instant black tea increased and then decreased with the tea-to-water ratio, peaking at 1:20. The score was highest at an ultrasonic extraction temperature of around 55 °C, while higher temperatures caused turbidity and odor loss. The optimal extraction time was 30 min. The tea’s color and odor retention were best when β-cyclodextrin was added at around 8%, achieving the highest sensory score.

3.2. Response Surface Test Results

3.2.1. Design and Result Analysis of Response Surface Test

Based on the single-factor test results and in accordance with the Box–Behnken central composite design principle, a three-factor, three-level response surface optimization test was conducted. The factors selected for optimization included the tea-to-water ratio (A), ultrasonic extraction temperature (B), and β-cyclodextrin addition (C). The optimization results are shown in Table 3.
The data in Table 3 were analyzed using the response surface design software Design-Expert 13, with the sensory evaluation score Y as the response value. A multiple regression simulation was conducted, resulting in the following regression equation:
Y = 86.66 − 0.25A − 1.40B + 0.40C − 1.38AB + 2.42AC + 1.38BC − 2.12A2 − 3.02B2 − 3.27C2
The results of the regression model analysis are shown in Table 4. The regression model was highly significant (p < 0.0001) and the lack of fit was not significant (p = 0.1535 > 0.05), with a goodness of fit R2 = 0.9879 and the difference between R2Adj and R2Pre being less than 0.2, indicating that the model had good fit. The differences between the treatment conditions were significant, demonstrating that the three-factor, three-level analysis modeled by the equation is feasible, and the model is effective.
Based on the p-values, B (extraction temperature), interaction terms AB, AC, and BC, and quadratic terms A2, B2, and C2 all showed highly significant effects (p < 0.01) on the sensory score of instant black tea powder. Judging by the F-values, in the response surface optimization test, factor B (extraction temperature) exerts the most prominent influence on the quality of instant black tea powder.

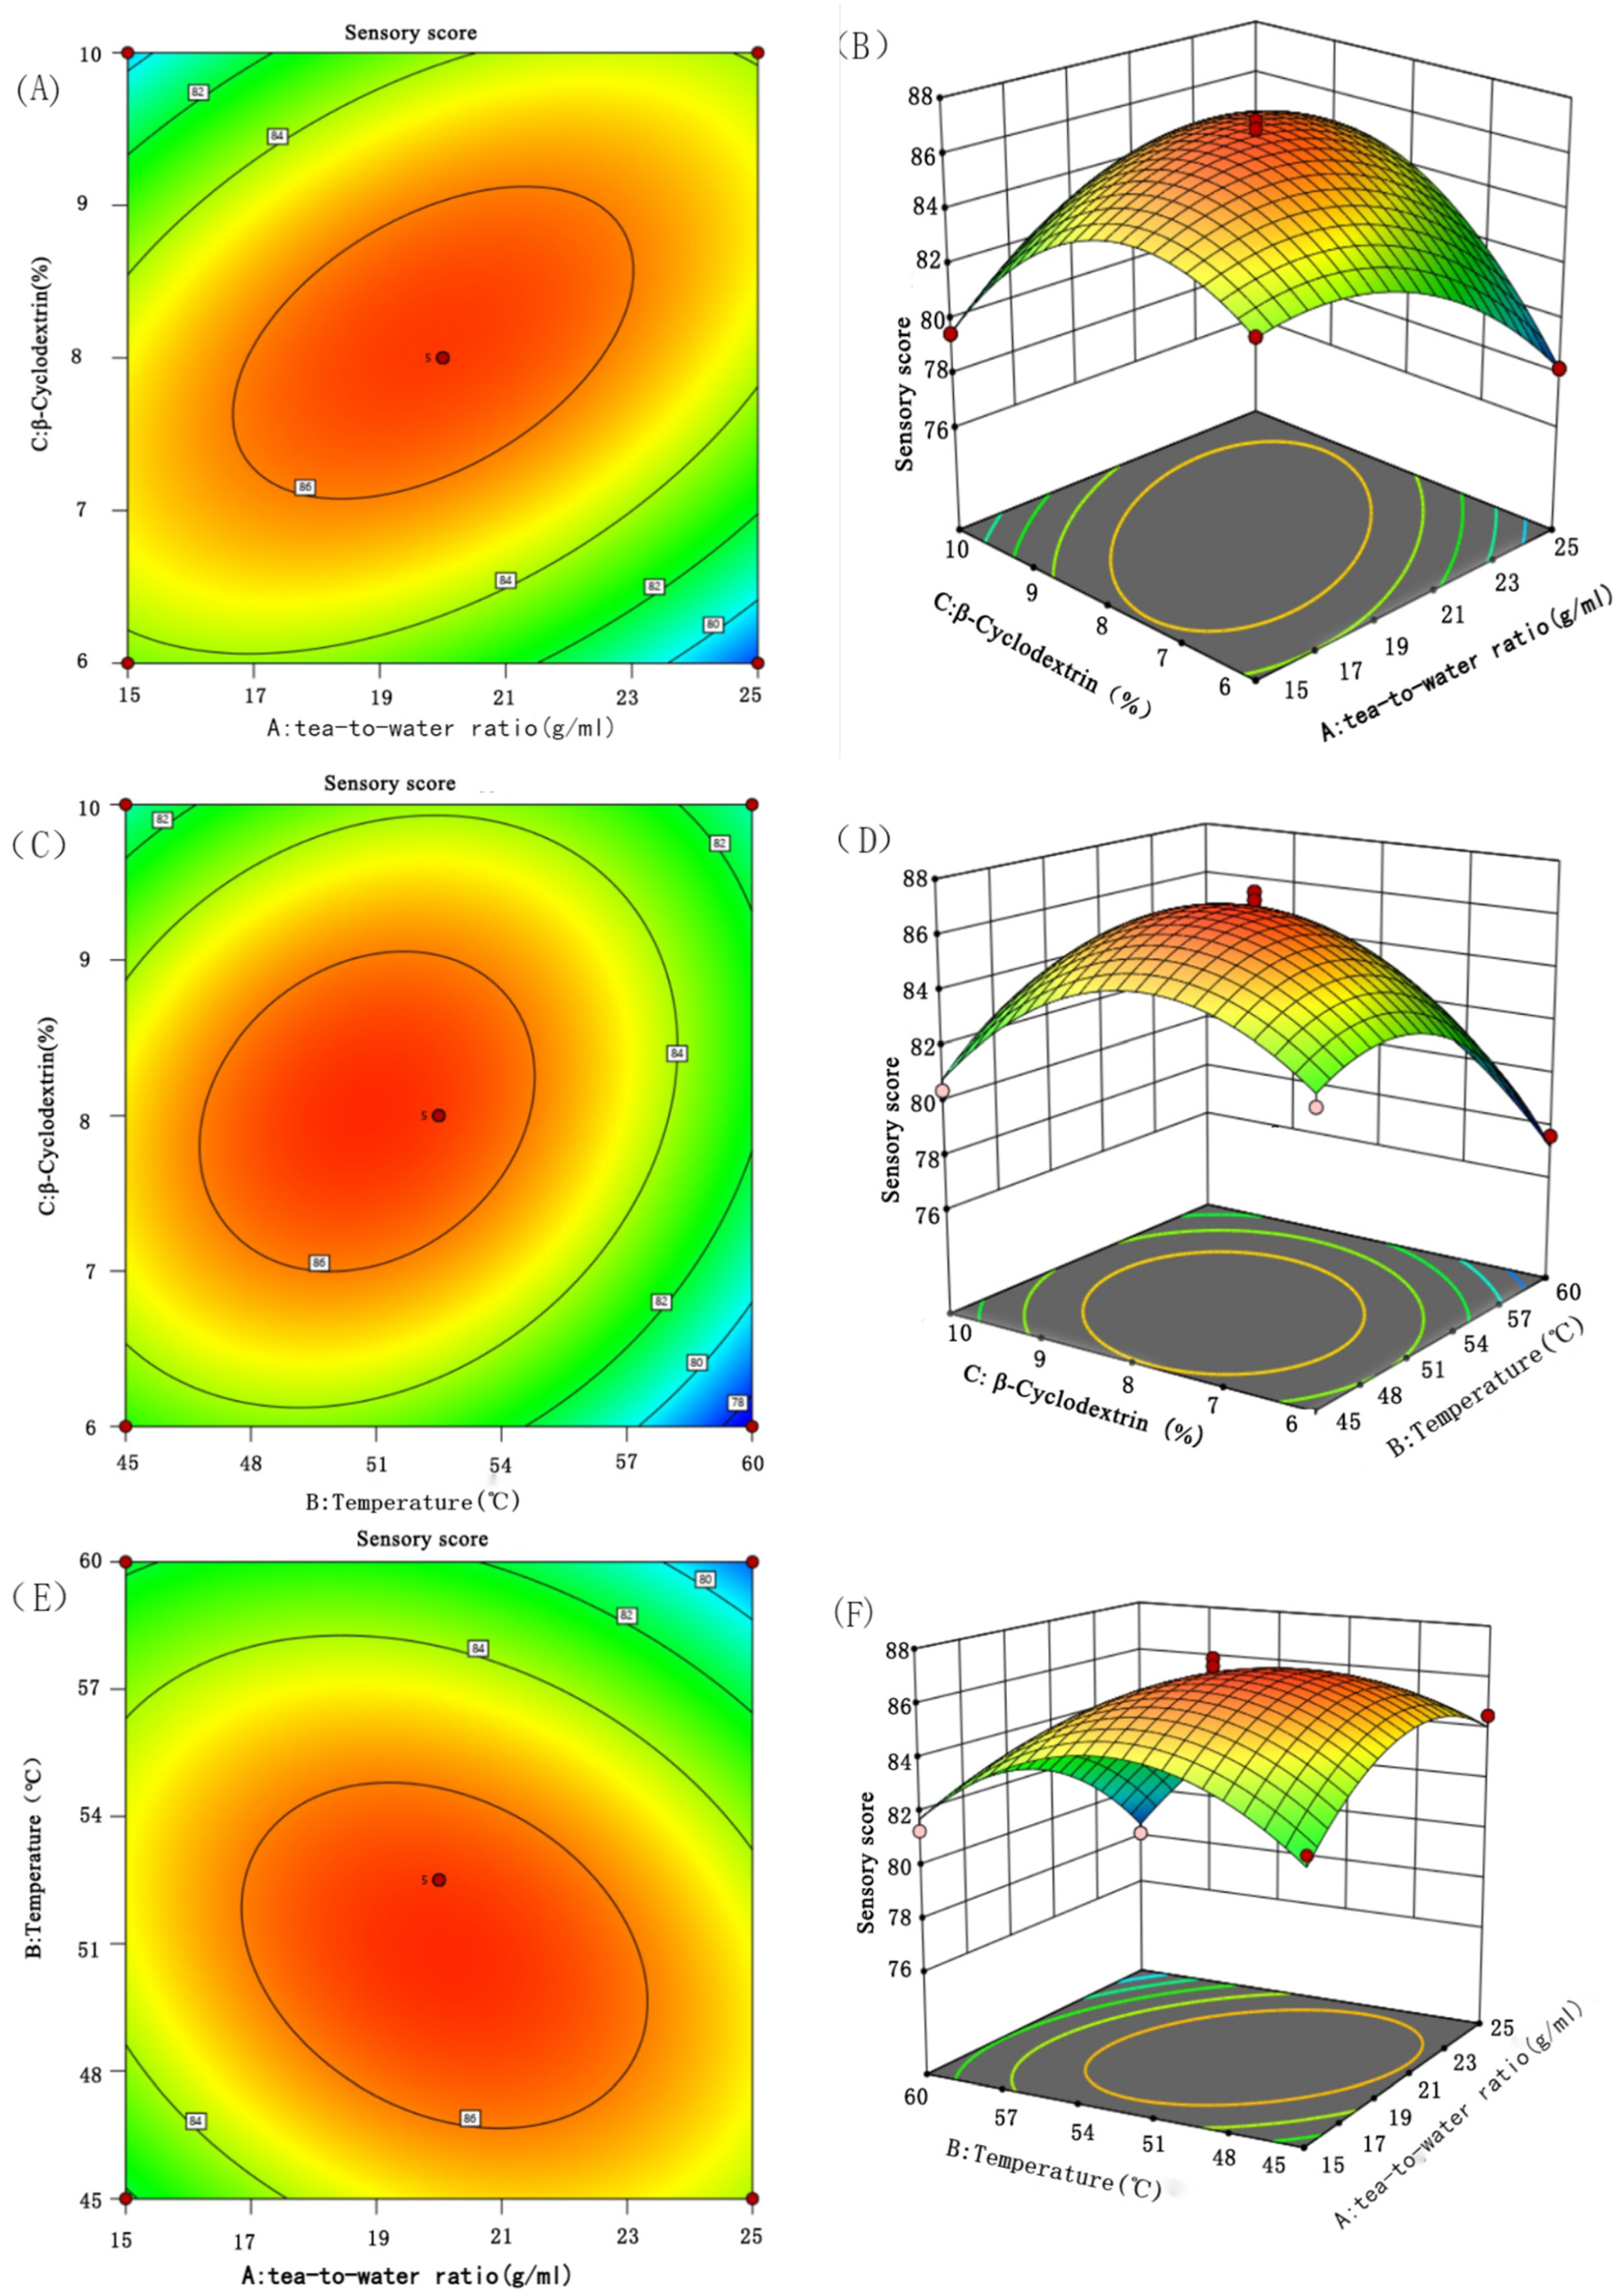
3.2.2. Interaction Analysis

The response surface graph is a curved surface graph in three-dimensional space formed by the response values and various experimental factors. In the response surface analysis graph, the optimal parameters and the interactions between various parameters can be vividly observed. In Figure 2, a graphical analysis of the influence of the interactions among the three factors (A: tea-to-water ratio; B: ultrasonic extraction temperature; C: β-cyclodextrin) on the sensory score of instant black tea can be seen. It can be observed that in the interaction of A and C, the extreme value is very obvious, and the impact on the sensory score is particularly significant. As A and C increase, the sensory score of instant black tea powder first increases and then decreases. In a comparison of these three sets of response surface graphs, it can be clearly seen that the interaction between A and C has the most significant impact on the sensory score of instant black tea powder, followed by the interactions between B and C and between A and B. This is consistent with the results of the variance analysis.

3.2.3. Verification of the Response Surface Model

The optimal processing conditions for instant black tea powder were obtained using Design-Expert 13 software to optimize and predict the experimental data. The predicted optimal conditions were as follows: a tea-to-water ratio of 1:15.7, an ultrasonic extraction temperature of 51.7 °C, an ultrasonic extraction time of 30 min, and a β-cyclodextrin addition of 7.4%. Under these conditions, the predicted sensory score for the instant black tea powder was 87.55 points. Considering practical operational constraints, the conditions were slightly adjusted to a tea-to-water ratio of 1:16, an ultrasonic extraction temperature of 52 °C, an ultrasonic extraction time of 30 min, and a β-cyclodextrin addition of 7.5%. Under these adjusted conditions, the measured sensory score was 88.7 points, which closely aligns with the theoretical prediction.

3.3. Results of Analysis of Instant Black Tea with Different Processing Methods by Electronic Nose Processing Techniques

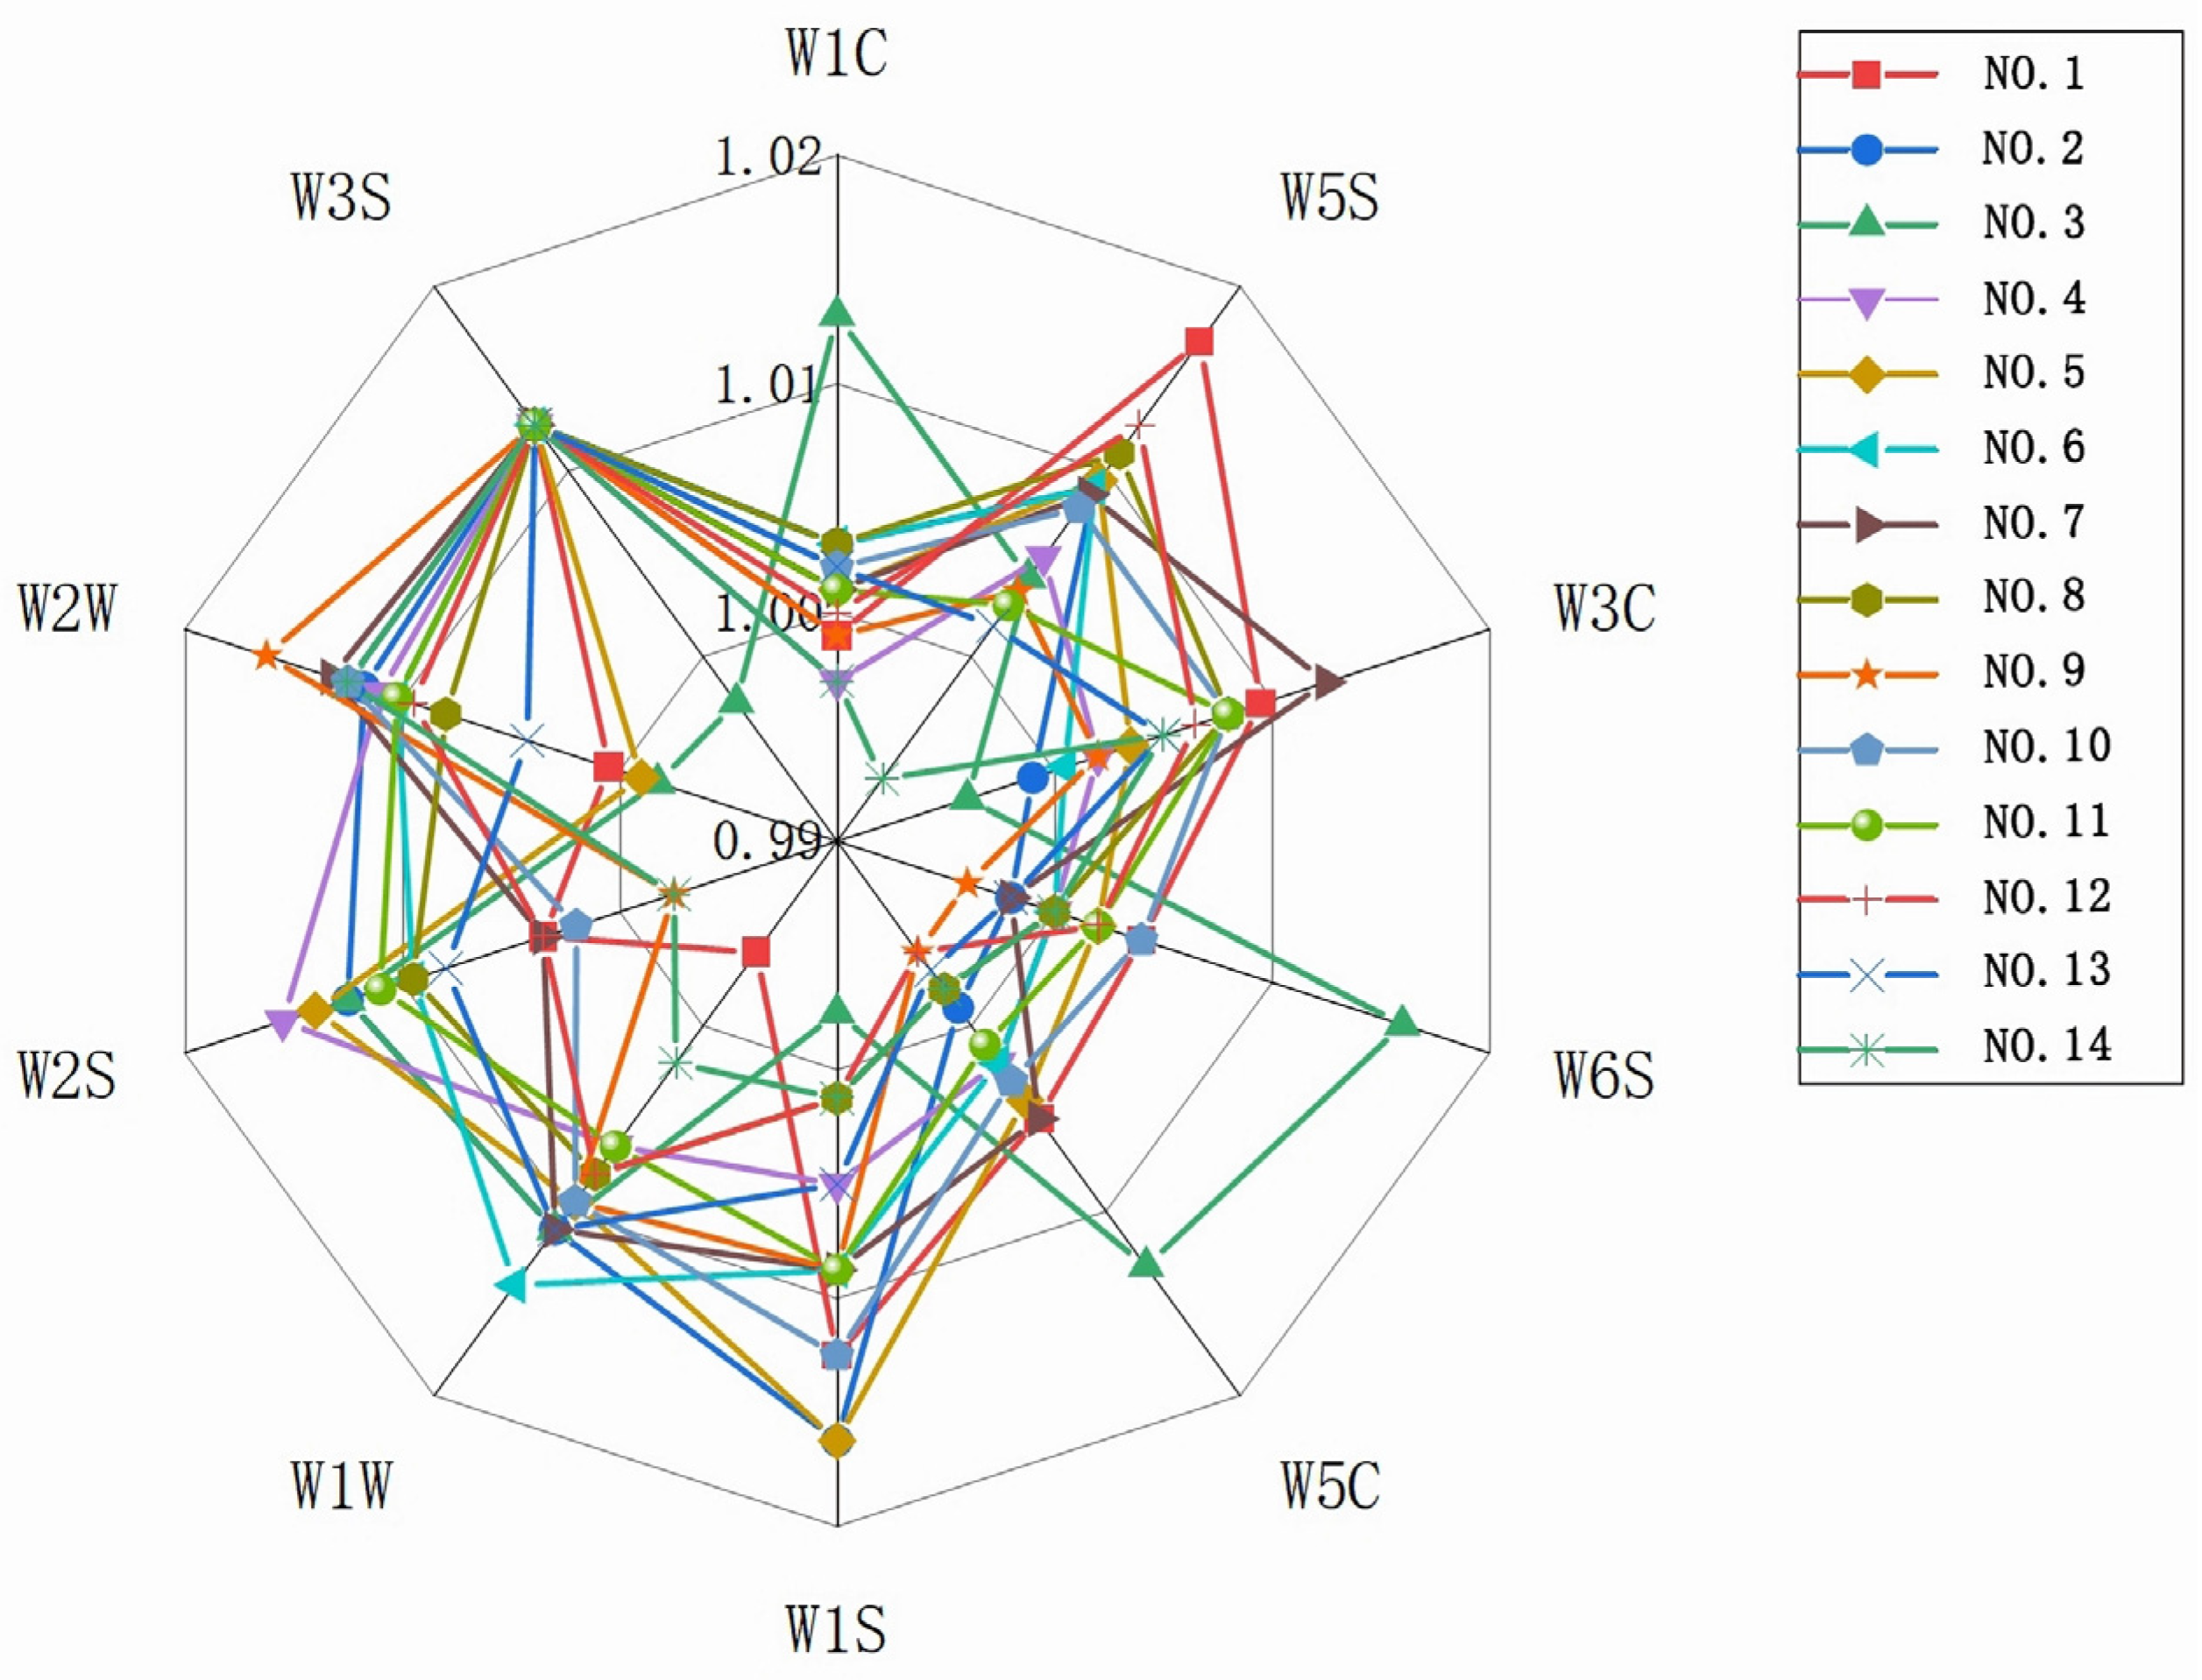
3.3.1. Analysis of the Odor Source of Instant Black Tea by Electronic Nose Sensors

An electronic nose equipped with 10 different semiconductor metal oxide sensors was used to measure the odor of instant tea. The sensors included W1C, W5S, W3C, W6S, W5C, W1S, W1W, W2S, W2W, and W3S. The substances corresponding to the response of each sensor are listed in Table 5. During sample analysis, the main volatile substances in the sample could be identified based on the type of gas detected. Using response surface design, we analyzed 12 experimental points, 1 center point, and a blank control of instant black tea. The analysis examined the types and concentrations of odor compounds in 14 groups of instant tea processed using different methods, as shown in Figure 3.
As shown in Figure 3, Group 1 exhibits a higher content of nitrogen oxides, as indicated by its prominent response in W5S. Group 3 shows elevated values in W1C, W6S, and W5C, suggesting a higher content of aliphatic aromatic compounds, benzene series, hydrogenated compounds, short-chain alkanes, and other aromatic substances. Group 6 stands out in W1W, indicating a higher content of sulfides and terpenes. Group 9 is prominent in W2W, suggesting a higher content of organic sulfides and aromatic compounds. Additionally, most samples show relatively low and concentrated response values in the W6S, W5C, and W1C sensors, with some values close to 1, indicating minimal differences among these samples. In contrast, the W3C sensor detects substances with response values mostly greater than 1, except for Groups 2 and 3, which have relatively lower values below 1. The response values for different samples are highly concentrated in the W3S sensor, indicating that the long-chain alkane volatile substances in instant black tea produced by different processing methods do not vary significantly. In the W5S, W1S, W2W, W2S, and W1W sensors, most response values are greater than 1, suggesting that the prominent odor substances in instant black tea powder are primarily alkane aromatic substances, aromatic volatile substances, aldehydes, alcohols, and ester volatile substances. The blank control group (Group 14) shows significantly lower response values for volatile odor substances compared to the other 13 groups, indicating that ultrasonic-assisted extraction and the addition of β-cyclodextrin can effectively retain volatile odor substances during processing.

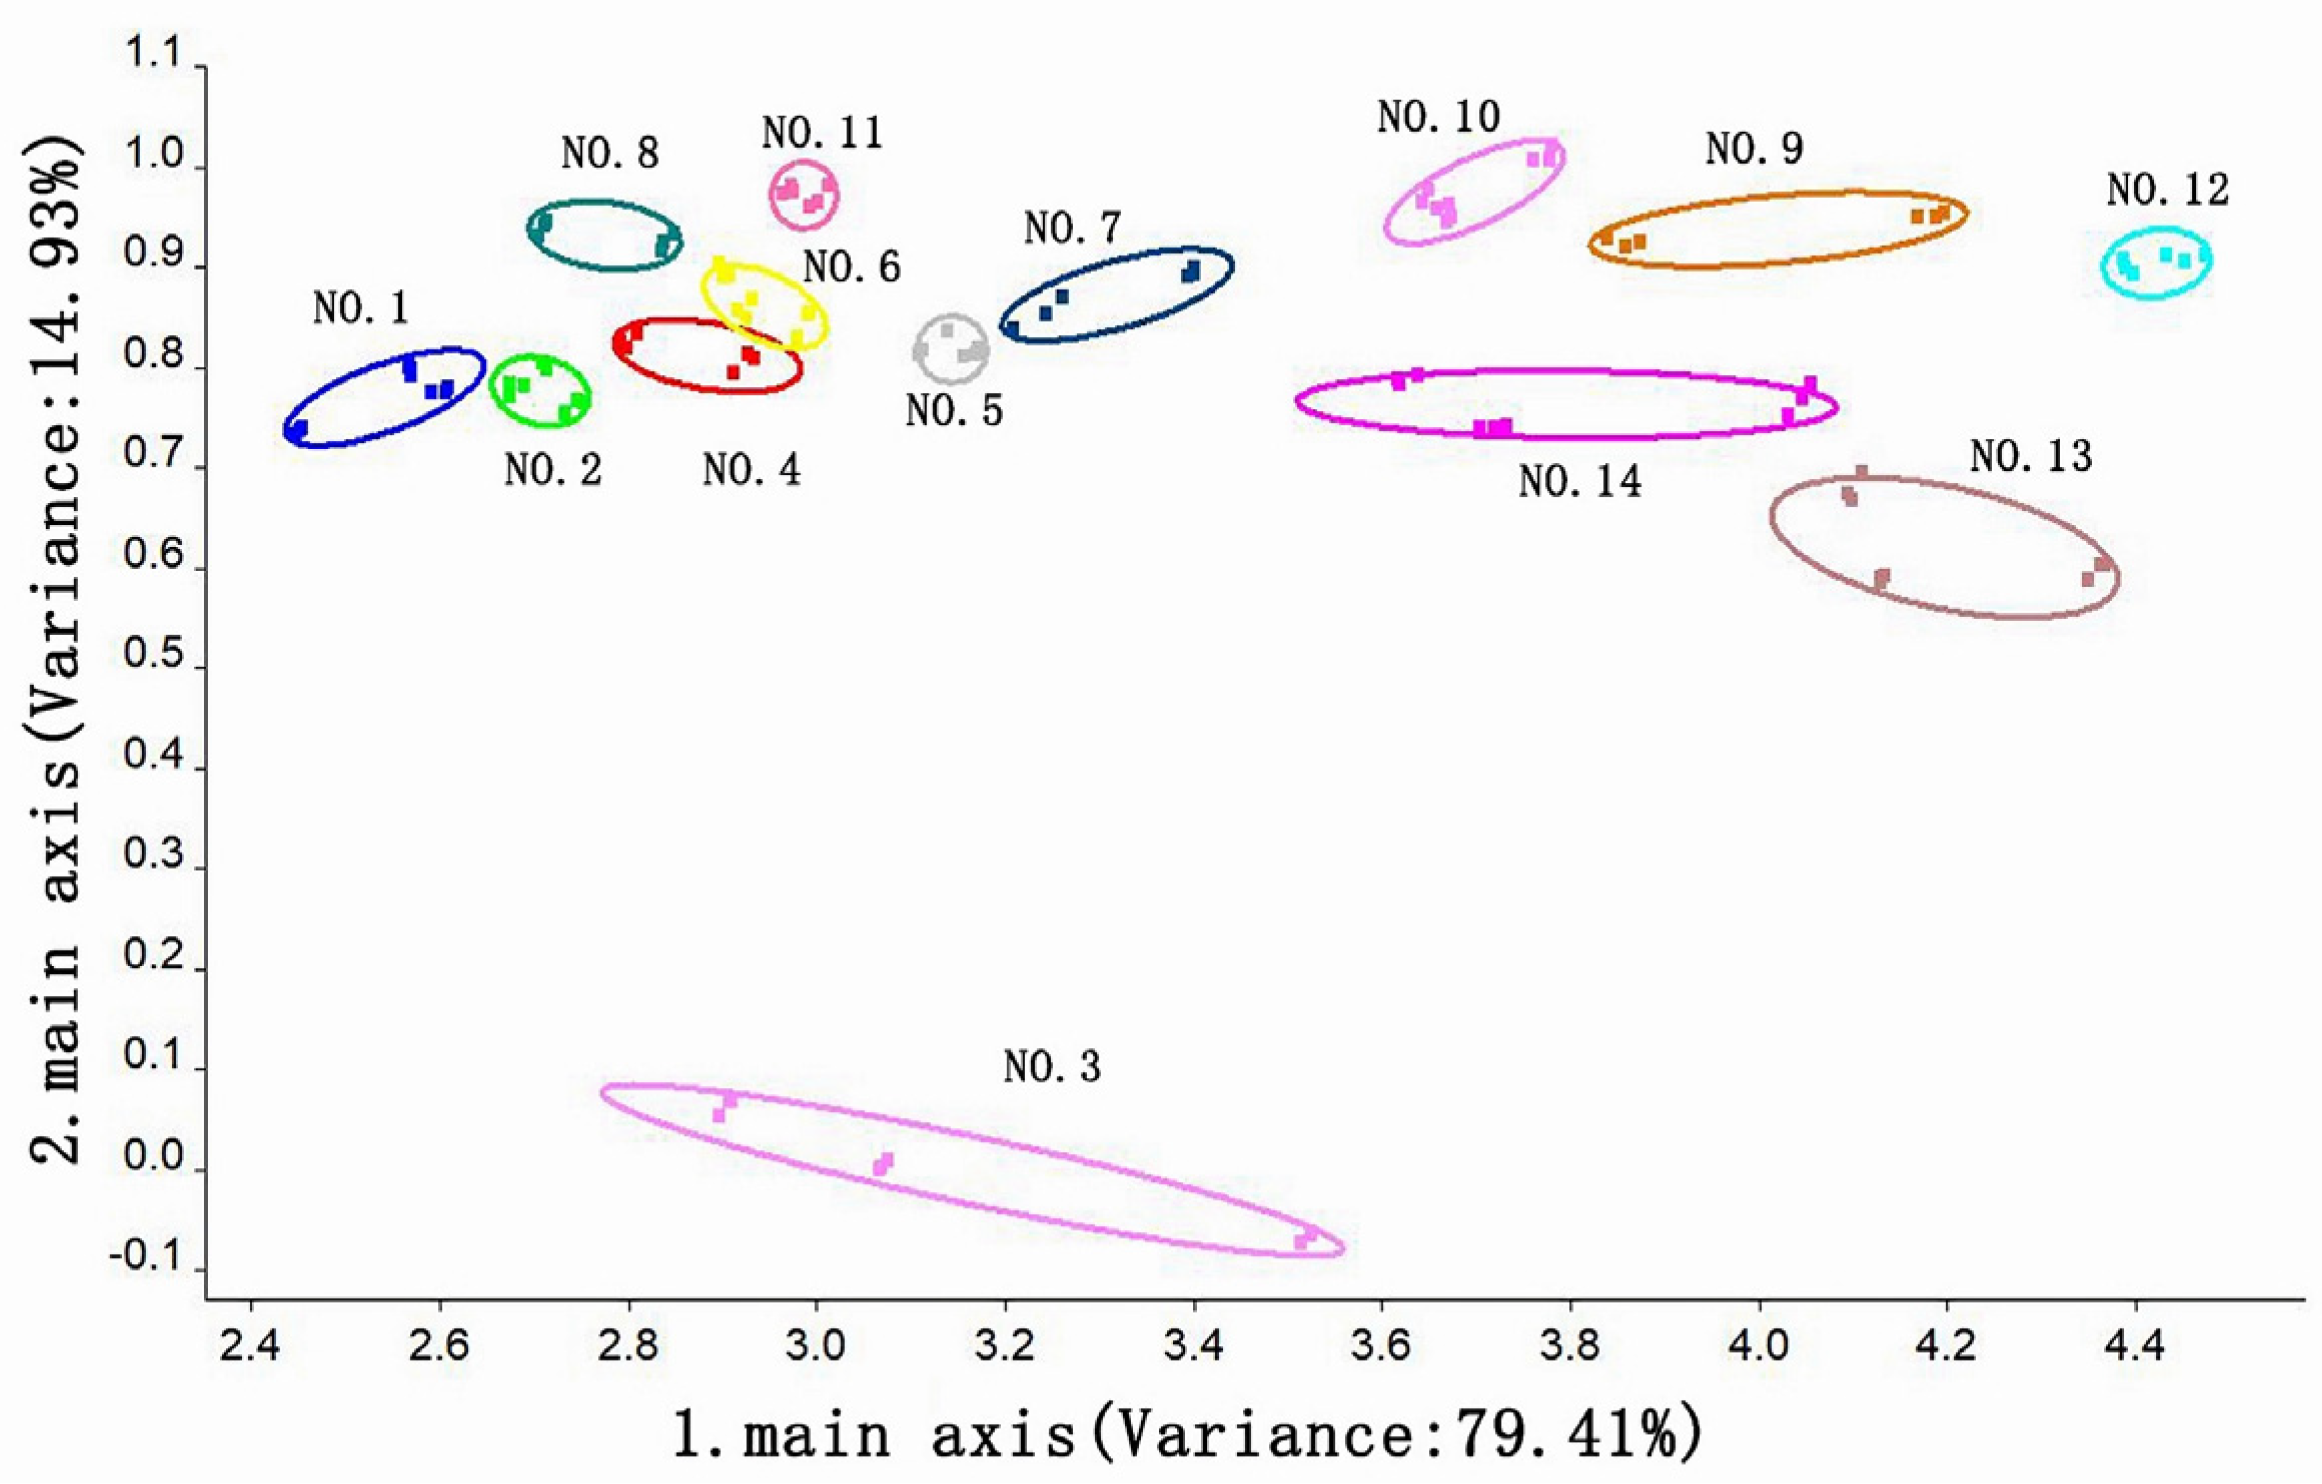
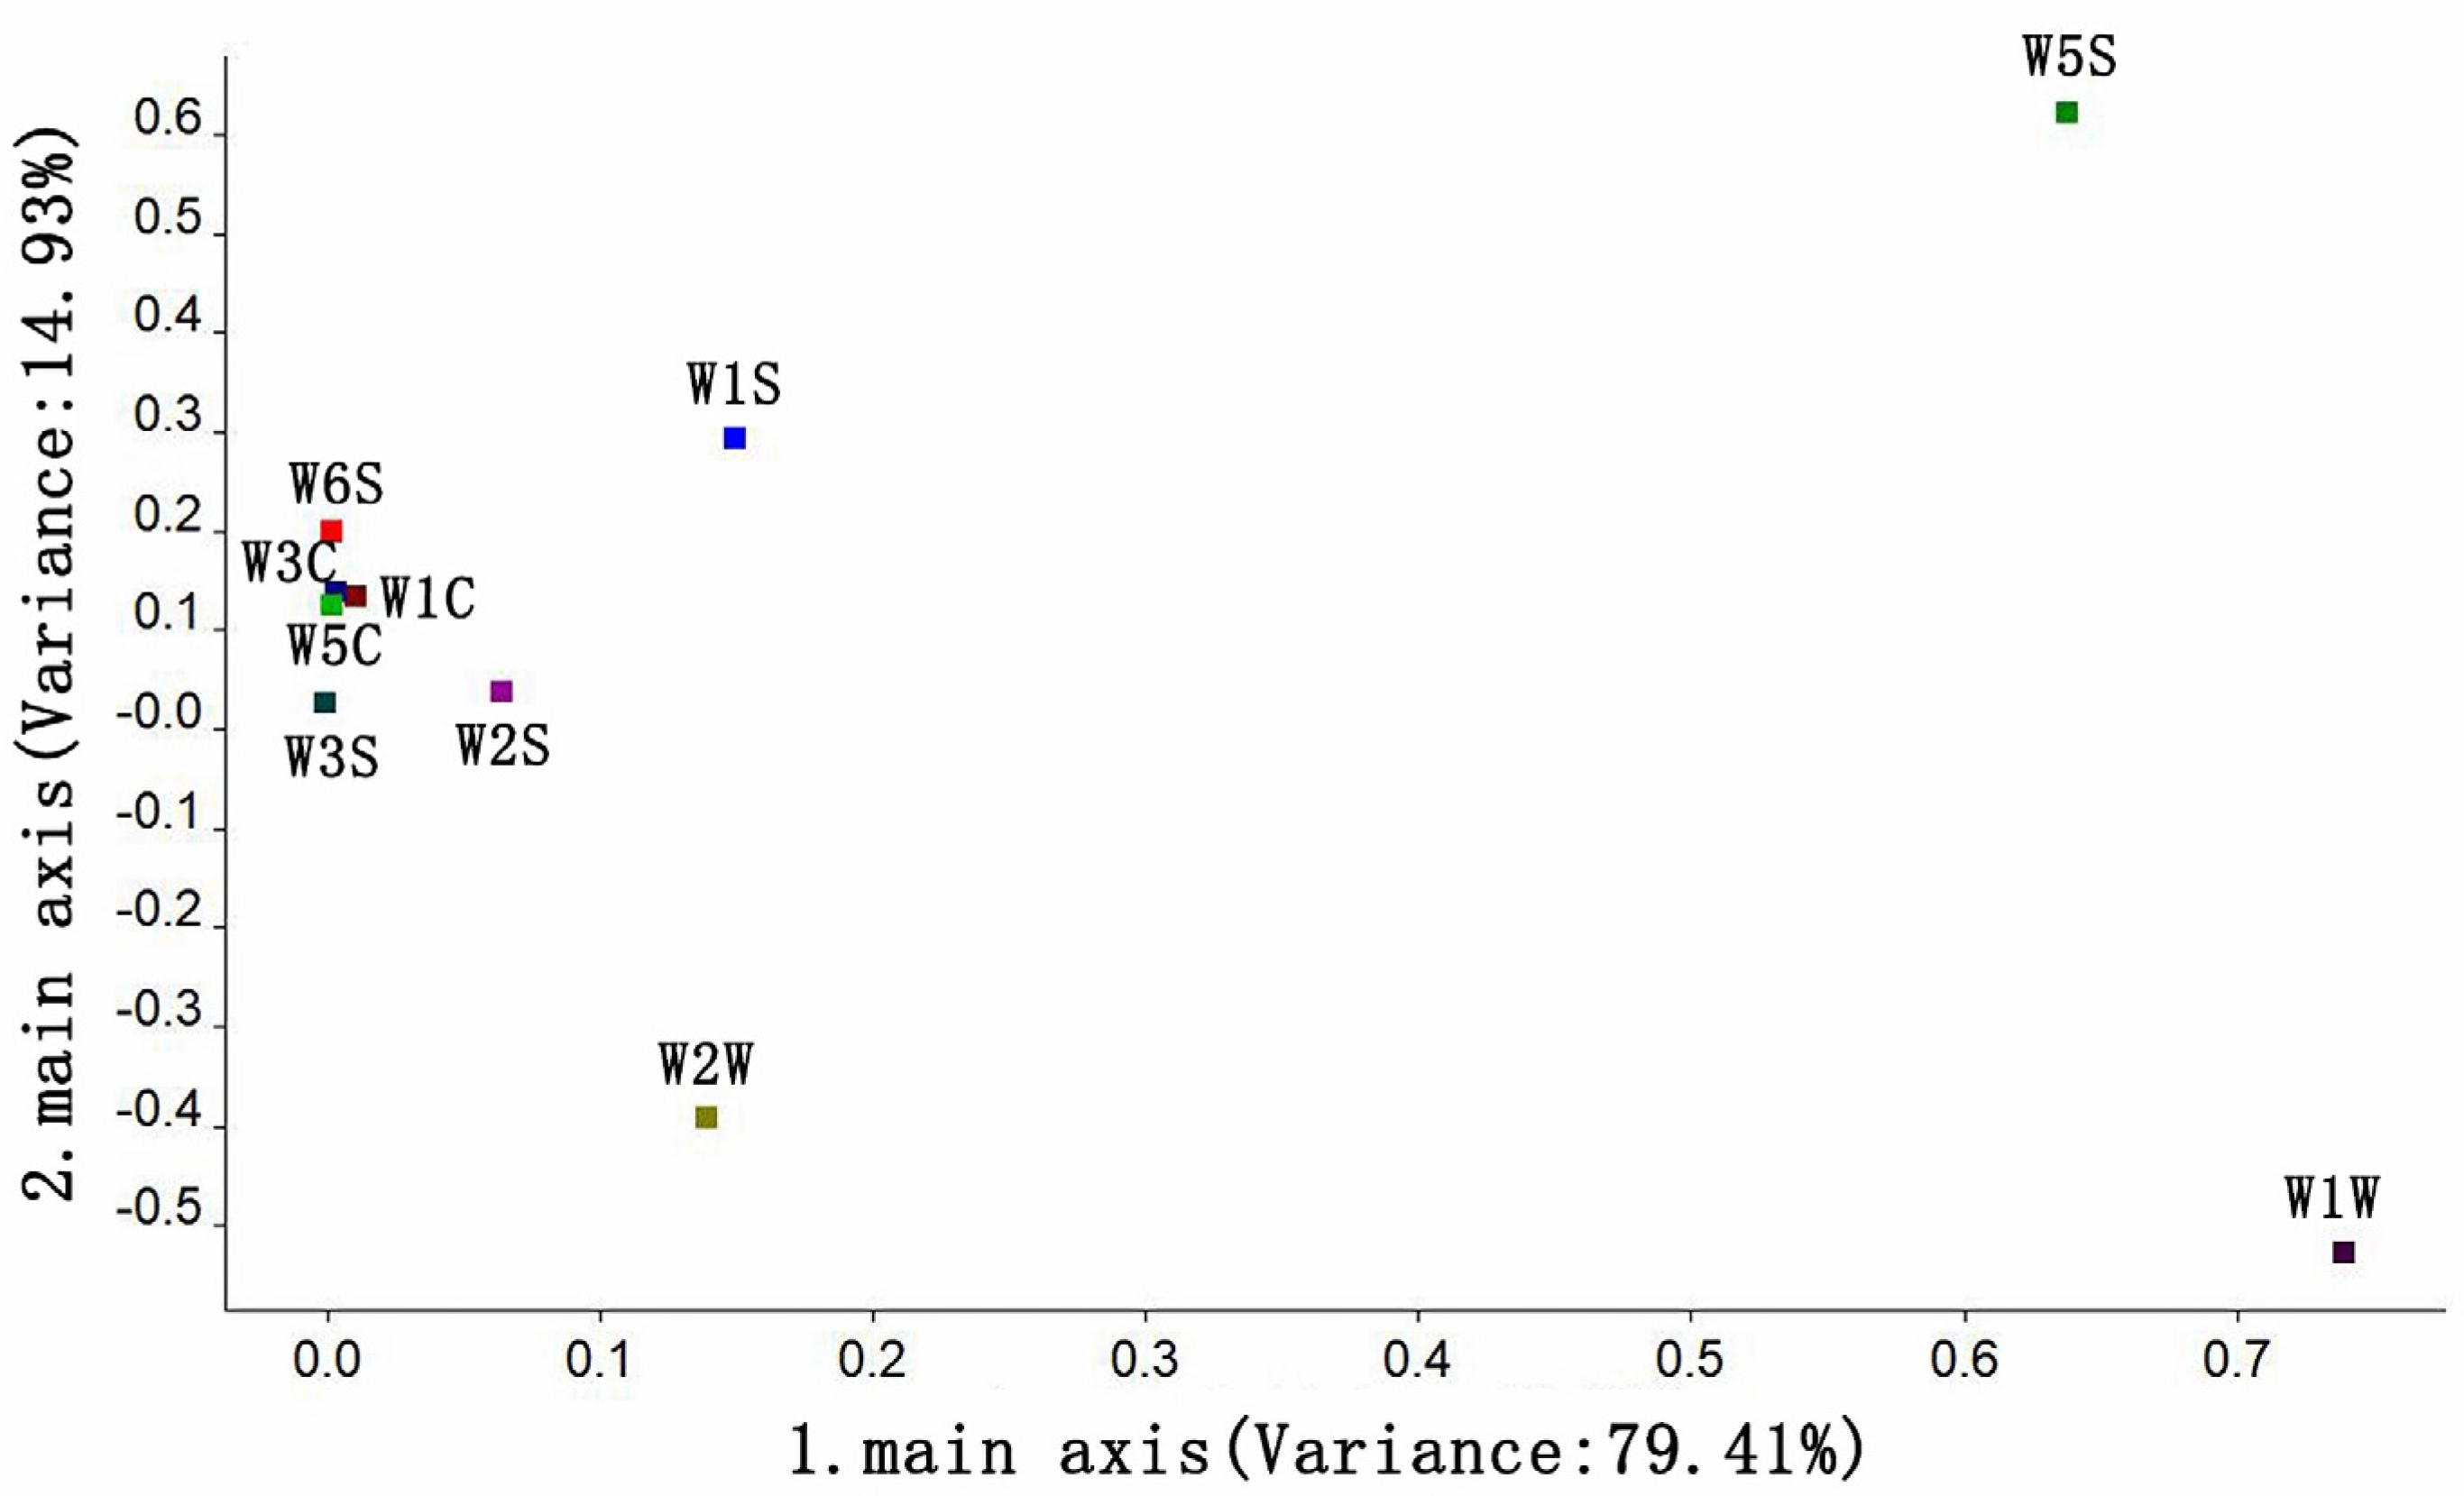
3.3.2. Principal Component Analysis of the Odor of Instant Black Tea Soup

Principal component analysis (PCA) was performed on fourteen groups of instant black tea soup processed using different methods, and the results of the odor substance analysis are displayed in Figure 4. PCA can effectively capture the distinctive characteristics of a sample when the total contribution rate exceeds 85%. In this case, the first and second principal components accounted for 79.41% and 14.93% of the variance, respectively, contributing to a total of 94.34%, which exceeds 85% (Figure 4). The odor substances in the 14 groups of instant black tea soup showed a clear separation trend along the first principal component. The most prominent odor substances were found in Groups 1 and 12, with nitrogen oxides and long-chain alkanes being the dominant compounds, respectively. From an elliptical distance perspective, Groups 4 and 6 exhibited a close, cross-correlated distance, indicating that their odor characteristics might be similar. The analysis of the second principal component revealed significant differences between Group 3 and the other groups in terms of odor compound content, suggesting that the processing method used for Group 3 altered the type and content of odor compounds in the instant black tea. Overall, the differences in odor components across the instant black tea powder samples were primarily influenced by variations in the β-cyclodextrin addition amount, ultrasonic extraction temperature, and tea-to-water ratio during processing.

3.3.3. Loading Analysis of the Odor of Instant Black Tea Soup

To determine which types of odor substances play a primary role in distinguishing the samples, a loading analysis of the electronic nose was conducted to reflect the contribution of various sensors in identifying odor substances in instant black tea and its soup. The analysis results are shown in Figure 5. Sensors closer to the origin have a smaller impact on the odor substances, while those farther from the origin have a greater effect.
The first and second principal components of the loading analysis accounted for 94.34% of the total variance (Figure 5). The sensors W1W and W5S made the greatest contribution to the first principal component, indicating that the dominant volatile substances in the odor of instant tea soup were alkanes, methane, methyl compounds, and nitrogen oxides. The sensors W5S, W2W, and W1S contributed more to the second principal component, suggesting that the odor components contained higher amounts of nitrogen oxides, alcohols, aldehydes, and ketones, as well as alkanes, methane, and methyl groups. The loading factors of the W6S, W3C, W1C, W5C, W2S, and W3S sensors were close to the origin, indicating that these sensors had low sensitivity to the volatile compounds in the odor of instant tea soup. The analysis revealed that sulfides, terpenes, nitrogen oxides, alkanes, and aromatic compounds were the primary volatile odor compounds distinguishing the 14 groups of instant black tea soup.

3.4. HS-SPME-GC-MS Detection and Analysis of the Volatile Components and Contents of Instant Black Tea

Analysis of Volatile Compounds Characteristics of Different Instant Teas

Through the use of headspace solid-phase microextraction–gas chromatography–mass spectrometry (HS-SPME-GC-MS), a total of 65 volatile compounds were detected, including 17 aldehydes, 8 alcohols, 15 esters, 12 alkanes, 4 ketones, 4 acids, 2 phenols, and 3 other compounds. The analysis showed that the primary volatile compounds of instant black tea produced by various methods are aldehydes, followed by esters, alkanes, and alcohols. Instant black tea retained the same sweet, floral, and fruity aromas as original black tea. Aldehydes typically exhibit floral notes, alcohols have unique floral and fruity aromas, esters contribute a fruity scent, and ketones provide a floral, sweet, and fruity odor, and these odor types are present in higher concentrations in each group of instant tea [36,37,38,39,40].
As shown in Table 6, HS-SPME-GC-MS detected 65 volatile compounds, with 11 key odor substances—Benzyl alcohol, Phytol, Phenylethyl alcohol 1,6,10-Dodecatrien-3-ol,3,7,11-trimethyl-,(E)-, Benzeneacetaldehyde, Undecanoic acid, ethyl ester, Dodecanoic acid, ethyl ester, Tetradecane, 2,4-Di-tert-butylphenol, 2-Pentadecanone, 6,10,14-trimethyl-, and indole—having concentrations generally above 500 μg/kg. These compounds play a crucial role in the formation of the odor of instant black tea. Among most of the volatile compounds in instant black tea, alcohol compounds had the highest relative concentration, followed by esters and alkanes (Figure 6), both of which significantly contribute to the tea’s odor, consistent with the loading analysis. In Group 7, ketone compounds showed a relatively higher concentration, while alkanes were lower in this group. Additionally, aldehydes were most prominent in Group 1, where alcohols were present in the lowest relative concentration. These findings demonstrate that the odor components vary depending on the processing conditions. The results suggest that using Wuyi Mountain summer and autumn tea leaves and incorporating β-cyclodextrin in the production of instant black tea powder help retain the odor of the tea soup.

4. Conclusions

This study explored the improvement of the instant black tea powder production process using summer and autumn tea combined with β-cyclodextrin embedding technology. Sensory evaluation and response surface analysis revealed that the optimal processing conditions for instant black tea powder were as follows: a tea-to-water ratio of 1:16, an ultrasonic extraction temperature of 52 °C, an extraction time of 30 min, and a β-cyclodextrin addition of 7.5%. Under these conditions, the sensory score reached 88.7 points. The content of volatile odor compounds, taste, tea color, solubility, odor, and appearance of the instant black tea powder were all superior to those of the control group.
The principal component analysis (PCA) and loading analysis of electronic nose detection effectively distinguished the volatile substances under different processing conditions. The odor radar chart response values indicated that the primary odor compounds in the instant black tea powder were alkanes, aromatic volatile substances, aldehydes, alcohols, and ester volatile compounds. Through the use of headspace solid-phase microextraction–gas chromatography–mass spectrometry (HS-SPME-GC-MS), 65 effective volatile volatile compounds were detected across 14 groups of instant black tea. These components included alcohols, esters, aldehydes, ketones, acids, and alkanes, with high levels of esters and alcohols contributing to the tea’s distinctive floral and fruity odor. The results indicated that the odor components and their concentrations varied under different processing conditions.
This study concludes that the use of summer and autumn tea combined with the β-cyclodextrin embedding process enhanced the odor types and intensity of instant black tea powder. This approach allows for the greater utilization and development of summer and autumn tea resources, thereby improving the overall quality of instant black tea powder. These findings provide valuable reference data for future research on the production process of instant black tea powder. Future research could further explore the impact of β-cyclodextrin on odor components.

Author Contributions

Project administration, Funding acquisition, Methodology, C.M.; Methodology, Y.H.; Formal analysis, Writing—original draft, Y.X.; Investigation, Formal analysis, H.L. (Haomu Liao); Visualization, Investigation, Data curation, H.L. (Haiyue Liao); Software, Formal analysis, X.S. All authors have read and agreed to the published version of the manuscript.

Funding

This research was funded by the Science and Technology Project of Fujian Province [grant number 2023N0018] and Scientific and Technological Innovation in Resource Chemistry Industry Project of Nanpin [grant number N2021Z006].

Institutional Review Board Statement

Not applicable.

Informed Consent Statement

Informed consent was obtained from all subjects involved in the study.

Data Availability Statement

The original contributions presented in the study are included in the article; further inquiries can be directed to the corresponding authors.

Conflicts of Interest

The authors declare no conflicts of interest.

References

  1. Alasalvar, C.; Pelvan, E.; Özdemir, K.S.; Kocadağlı, T.; Mogol, B.A.; Paslı, A.A.; Özcan, N.; Özçelik, B.; Gökmen, V. Compositional, Nutritional, and Functional Characteristics of Instant Teas Produced from Low- and High-Quality Black Teas. J. Agric. Food Chem. 2013, 61, 7529–7536. [Google Scholar] [CrossRef] [PubMed]
  2. Kraujalytė, V.; Pelvan, E.; Alasalvar, C. Volatile Compounds and Sensory Characteristics of Various Instant Teas Produced from Black Tea. Food Chem. 2016, 194, 864–872. [Google Scholar] [CrossRef] [PubMed]
  3. Yang, Z.; Baldermann, S.; Watanabe, N. Recent Studies of the Volatile Compounds in Tea. Food Res. Int. 2013, 53, 585–599. [Google Scholar] [CrossRef]
  4. Dai, Q.; Liu, S.; Jin, H.; Jiang, Y.; Xia, T. Effects of Additive β-Cyclodextrin on the Performances of Green Tea Infusion. J. Chem. 2019, 2019, 1–7. [Google Scholar] [CrossRef]
  5. Constable, A.; Varga, N.; Richoz, J.; Stadler, R.H. Antimutagenicity and Catechin Content of Soluble Instant Teas. Mutagenesis 1996, 11, 189–194. [Google Scholar] [CrossRef]
  6. Qin, Z.; Pang, X.; Chen, D.; Cheng, H.; Hu, X.; Wu, J. Evaluation of Chinese Tea by the Electronic Nose and Gas Chromatography–Mass Spectrometry: Correlation with Sensory Properties and Classification According to Grade Level. Food Res. Int. 2013, 53, 864–874. [Google Scholar] [CrossRef]
  7. Sinija, V.R.; Mishra, H.N. Fuzzy Analysis of Sensory Data for Quality Evaluation and Ranking of Instant Green Tea Powder and Granules. Food Bioprocess Technol. 2011, 4, 408–416. [Google Scholar] [CrossRef]
  8. Tong, W.; Yu, J.; Wu, Q.; Hu, L.; Tabys, D.; Wang, Y.; Wei, C.; Ling, T.; Ali Inayat, M.; Bennetzen, J.L. Black Tea Quality Is Highly Affected during Processing by Its Leaf Surface Microbiome. J. Agric. Food Chem. 2021, 69, 7115–7126. [Google Scholar] [CrossRef]
  9. Guo, H.; Fu, M.-X.; Wu, D.-T.; Zhao, Y.-X.; Li, H.; Li, H.-B.; Gan, R.-Y. Structural Characteristics of Crude Polysaccharides from 12 Selected Chinese Teas, and Their Antioxidant and Anti-Diabetic Activities. Antioxidants 2021, 10, 1562. [Google Scholar] [CrossRef]
  10. Ma, Q.; Qin, M.; Song, L.; Sun, H.; Zhang, H.; Wu, H.; Ren, Z.; Liu, H.; Duan, G.; Wang, Y.; et al. Molecular Link in Flavonoid and Amino Acid Biosynthesis Contributes to the Flavor of Changqing Tea in Different Seasons. Foods 2022, 11, 2289. [Google Scholar] [CrossRef]
  11. Perera, G.A.A.R.; Amarakoon, A.M.T.; Illeperuma, D.C.K.; Muthukumarana, P.K.P. Effects of Raw Material on the Chemical Composition, Organoleptic Properties, Antioxidant Activity, Physical Properties and the Yield of Instant Black Tea. LWT Food Sci. Technol. 2015, 63, 745–750. [Google Scholar] [CrossRef]
  12. Cao, M.; Cao, Z.; Tian, J.; Lv, W.; Wang, H. Structural Characterization and In Vitro Antioxidant Activity of a Novel Polysaccharide from Summer–Autumn Tea. Foods 2024, 13, 821. [Google Scholar] [CrossRef]
  13. Shuai, D.; Guo, M.; Zhang, W. Summer and fall tea raw material processing of red tea eight process study. J. Zhejiang Agric. Sci. 2022, 63, 804–806. [Google Scholar] [CrossRef]
  14. Chen, Q.; Song, J.; Bi, J.; Meng, X.; Wu, X. Characterization of Volatile Profile from Ten Different Varieties of Chinese Jujubes by HS-SPME/GC–MS Coupled with E-Nose. Food Res. Int. 2018, 105, 605–615. [Google Scholar] [CrossRef]
  15. Wang, L.-F.; Lee, J.-Y.; Chung, J.-O.; Baik, J.-H.; So, S.; Park, S.-K. Discrimination of Teas with Different Degrees of Fermentation by SPME–GC Analysis of the Characteristic Volatile Flavour Compounds. Food Chem. 2008, 109, 196–206. [Google Scholar] [CrossRef] [PubMed]
  16. Chen, Z.; Li, Z.; Zhao, Y.; Zhu, M.; Li, J.; Wang, K. A Meta-Analysis of Dynamic Changes of Key Aroma Compounds during Black Tea Processing. Food Biosci. 2024, 58, 103784. [Google Scholar] [CrossRef]
  17. Pelvan, E.; Özilgen, M. Assessment of Energy and Exergy Efficiencies and Renewability of Black Tea, Instant Tea and Ice Tea Production and Waste Valorization Processes. Sustain. Prod. Consum. 2017, 12, 59–77. [Google Scholar] [CrossRef]
  18. Ma, C.; Li, J.; Chen, W.; Wang, W.; Qi, D.; Pang, S.; Miao, A. Study of the Aroma Formation and Transformation during the Manufacturing Process of Oolong Tea by Solid-Phase Micro-Extraction and Gas Chromatography–Mass Spectrometry Combined with Chemometrics. Food Res. Int. 2018, 108, 413–422. [Google Scholar] [CrossRef]
  19. Parveen, A.; Qin, C.-Y.; Zhou, F.; Lai, G.; Long, P.; Zhu, M.; Ke, J.; Zhang, L. The Chemistry, Sensory Properties and Health Benefits of Aroma Compounds of Black Tea Produced by Camellia sinensis and Camellia assamica. Horticulturae 2023, 9, 1253. [Google Scholar] [CrossRef]
  20. Lv, H.-P.; Zhong, Q.-S.; Lin, Z.; Wang, L.; Tan, J.-F.; Guo, L. Aroma Characterisation of Pu-Erh Tea Using Headspace-Solid Phase Microextraction Combined with GC/MS and GC–Olfactometry. Food Chem. 2012, 130, 1074–1081. [Google Scholar] [CrossRef]
  21. Ma, C.; Qu, Y.; Zhang, Y.; Qiu, B.; Wang, Y.; Chen, X. Determination of Nerolidol in Teas Using Headspace Solid Phase Microextraction–Gas Chromatography. Food Chem. 2014, 152, 285–290. [Google Scholar] [CrossRef]
  22. Wang, J.; Zhang, C.; Chang, M.; He, W.; Lu, X.; Fei, S.; Lu, G. Optimization of Electronic Nose Sensor Array for Tea Aroma Detecting Based on Correlation Coefficient and Cluster Analysis. Chemosensors 2021, 9, 266. [Google Scholar] [CrossRef]
  23. Zhu, J.; Chen, F.; Wang, L.; Niu, Y.; Yu, D.; Shu, C.; Chen, H.; Wang, H.; Xiao, Z. Comparison of Aroma-Active Volatiles in Oolong Tea Infusions Using GC–Olfactometry, GC–FPD, and GC–MS. J. Agric. Food Chem. 2015, 63, 7499–7510. [Google Scholar] [CrossRef] [PubMed]
  24. Yang, D.; Yang, X. Mulberry leaf instant tea research. J. Compr. Util. Resour. China 2018, 36, 2. [Google Scholar] [CrossRef]
  25. Xia, T.; Shi, S.Q.; Wan, X.C. Impact of Ultrasonic-Assisted Extraction on the Chemical and Sensory Quality of Tea Infusion. J. Food Eng. 2006, 74, 557–560. [Google Scholar] [CrossRef]
  26. He, W.; Hu, X.; Zhao, L.; Liao, X.; Zhang, Y.; Zhang, M.; Wu, J. Evaluation of Chinese Tea by the Electronic Tongue: Correlation with Sensory Properties and Classification According to Geographical Origin and Grade Level. Food Res. Int. 2009, 42, 1462–1467. [Google Scholar] [CrossRef]
  27. Zhang, C.; Zhou, C.; Xu, K.; Tian, C.; Zhang, M.; Lu, L.; Zhu, C.; Lai, Z.; Guo, Y. A Comprehensive Investigation of Macro-Composition and Volatile Compounds in Spring-Picked and Autumn-Picked White Tea. Foods 2022, 11, 3628. [Google Scholar] [CrossRef]
  28. Bleibaum, R.N.; Stone, H.; Tan, T.; Labreche, S.; Saint-Martin, E.; Isz, S. Comparison of Sensory and Consumer Results with Electronic Nose and Tongue Sensors for Apple Juices. Food Qual. Prefer. 2002, 13, 409–422. [Google Scholar] [CrossRef]
  29. Zhou, Z.-W.; Wu, Q.-Y.; Wu, Y.; Deng, T.-T.; Chen, X.-H.; Xiao, S.-T.; Zhang, C.-X.; Sun, Y.; Zheng, S.-Z. The Dynamic Changes in Volatile Compounds During Wuyi Rock Tea (WRT) Processing: More than a Contribution to Aroma Quality. Horticulturae 2025, 11, 120. [Google Scholar] [CrossRef]
  30. Xiao, H.; Tian, Y.; Yang, H.; Zeng, Y.; Yang, Y.; Yuan, Z.; Zhou, H. Are There Any Differences in the Quality of High-Mountain Green Tea before and after the First New Leaves Unfold? A Comprehensive Study Based on E-Sensors, Whole Metabolomics and Sensory Evaluation. Food Chem. 2024, 457, 140119. [Google Scholar] [CrossRef]
  31. Zhang, L.; Zhou, C.; Zhang, C.; Zhang, M.; Guo, Y. Volatilomics and Macro-Composition Analyses of Primary Wuyi Rock Teas of Rougui and Shuixian Cultivars from Different Production Areas. Plants 2024, 13, 2206. [Google Scholar] [CrossRef] [PubMed]
  32. Ni, H.; Jiang, Q.-X.; Zhang, T.; Huang, G.-L.; Li, L.-J.; Chen, F. Characterization of the Aroma of an Instant White Tea Dried by Freeze Drying. Molecules 2020, 25, 3628. [Google Scholar] [CrossRef]
  33. Yang, Y.; Zhang, M.; Yin, H.; Deng, Y.; Jiang, Y.; Yuan, H.; Dong, C.; Li, J.; Hua, J.; Wang, J. Rapid Profiling of Volatile Compounds in Green Teas Using Micro-Chamber/Thermal Extractor Combined with Thermal Desorption Coupled to Gas Chromatography-Mass Spectrometry Followed by Multivariate Statistical Analysis. LWT 2018, 96, 42–50. [Google Scholar] [CrossRef]
  34. Lai, J.; Tang, X.; Li, M.; Chen, H. Optimization of tea extraction technology and tea powder processing by response surface method. Food Sci. Technol. 2022, 47, 72–78. (In Chinese) [Google Scholar]
  35. Zeng, L.; Liu, Y.-Y.; Wang, F.; Jin, S.; Chen, L.-S.; Fu, Y.-Q.; Feng, Z.-H.; Yin, J.-F.; Sun, W.-J.; Yu, X.-M.; et al. Effect of Tea Green Leafhopper (Empoasca onukii Matsuda) Sucking on the Quality of Oriental Beauty. Food Front. 2024, 5, 1571–1582. [Google Scholar] [CrossRef]
  36. Flaig, M.; Qi, S.; Wei, G.; Yang, X.; Schieberle, P. Characterization of the Key Odorants in a High-Grade Chinese Green Tea Beverage (Camellia sinensis; Jingshan Cha) by Means of the Sensomics Approach and Elucidation of Odorant Changes in Tea Leaves Caused by the Tea Manufacturing Process. J. Agric. Food Chem. 2020, 68, 5168–5179. [Google Scholar] [CrossRef]
  37. Mei, S.; Cao, Y.; Zhang, G.; Zhou, S.; Wang, Y.; Gong, S.; Chu, Q.; Chen, P. Construction of Sensory/Mass Spectrometry Feedback Platform for Seeking Aroma Contributors during the Aroma Enhancement of Congou Black Tea. Plants 2022, 11, 823. [Google Scholar] [CrossRef] [PubMed]
  38. Rawat, R.; Gulati, A.; Kiranbabu, G.; Acharya, R.; Kaul, V.; Singh, B. Characterization of Volatile Components of Kangra Orthodox Black Tea by Gas Chromatography-Mass Spectrometry. Food Chem. 2007, 105, 229–235. [Google Scholar] [CrossRef]
  39. Sheibani, E.; Duncan, S.E.; Kuhn, D.D.; Dietrich, A.M.; O’Keefe, S.F. SDE and SPME Analysis of Flavor Compounds in Jin Xuan Oolong Tea. J. Food Sci. 2016, 81, C348–C358. [Google Scholar] [CrossRef]
  40. Xiao, Z.; Wang, H.; Niu, Y.; Liu, Q.; Zhu, J.; Chen, H.; Ma, N. Characterization of Aroma Compositions in Different Chinese Congou Black Teas Using GC–MS and GC–O Combined with Partial Least Squares Regression. Flavour Fragr. J. 2017, 32, 265–276. [Google Scholar] [CrossRef]
Figure 1. Single-factor experimental results. (A) Sensory rating of tea–water ratio; (B) sensory fractions of extraction temperature; (C) sensory fractions of extraction time; (D) sensory scores of β-cyclodextrin.
Foods 14 01552 g001
Figure 2. Response surface plots of the interaction effects of various factors on the sensory score of instant tea. (A) Response surface plane of tea–water ratio and β-cyclodextrin content to sensory scores of instant tea; (B) three-dimensional response surface of tea–water ratio and β-cyclodextrin content to sensory scores of instant tea; (C) response plane of extraction temperature and β-cyclodextrin content to sensory scores of instant tea; (D) three-dimensional response surface of extraction temperature and β-cyclodextrin content to sensory scores of instant tea; (E) response surface plane of extraction temperature and tea–water ratio to instant tea sensory score; (F) three-dimensional response surface of extraction temperature and tea–water ratio to sensory score of instant tea.
Foods 14 01552 g002
Figure 3. Radar chart of electronic nose sensor response values for instant black tea powder produced with different processing methods.
Foods 14 01552 g003
Figure 4. PCA plot of instant black tea soup.
Foods 14 01552 g004
Figure 5. Loading analysis of instant black tea soup.
Foods 14 01552 g005
Figure 6. Relative content of volatile compounds in 14 groups of instant black tea.
Foods 14 01552 g006
Table 1. Sensory evaluation table for instant black tea powder.
Evaluation ItemScoring CriteriaScore Range
Odor
(30 points)
Dull, impure odor
Pure odor
Sweet, floral, or fruity odor
1~10
11~20
21~30
Taste
(30 points)
Bland, slightly astringent taste
Fairly mellow, but lacking smoothness
Mellow, sweet, refreshing, with lingering aftertaste
1~10
11~20
21~30
Liquid Color
(20 points)
Dark red, slightly cloudy
Red, fairly bright
Brownish red or reddish brown, clear and bright
1~6
7~13
14~20
Solubility
(10 points)
Needs stirring to dissolve, sediment at the bottom
Instantly dissolves, no sediment
1~5
6~10
Appearance
(10 points)
Solid granules, dull, not easily dispersible
Loose flakes or powder, glossy, no clumps or impurities
1~5
6~10
Table 2. Factors and levels of response surface experiments.
LevelFactor
A Tea-To-Water RatioB TemperatureC β-Cyclodextrin (%)
−11:15456
01:20558
11:256010
Table 3. Response surface design scheme and test results for optimizing the processing of instant black tea powder.
Test GroupABCSensory Score Y (Points)
10−1−182.3
20−1180.4
3−1−1082.2
41−1084.5
5−10−183.6
610−178.2
700086.4
8−10179.5
910183.8
1001−177.6
11−11081.3
1211078.1
1301181.2
1400086.2
1500087.2
1600086.9
1700086.6
Table 4. Regression model variance analysis results.
Source of VarianceSum of SquaresDegree of FreedomMean SquareF-Valuep-ValueSignificance
Model169.78918.8663.27<0.0001**
A—tea–water ratio0.500010.50001.680.2364
B—temperature15.68115.6852.590.0002**
C—β-cyclodextrin1.2811.284.290.0770
AB7.5617.5625.370.0015**
AC23.52123.5278.90<0.0001**
BC7.5617.5625.370.0015**
A218.88118.8863.32<0.0001**
B238.34138.34128.59<0.0001**
C244.95144.95150.78<0.0001**
Residuals2.0970.2981
Lack of fit1.4530.48503.070.1535Not significant
Pure error0.632040.1580
Total171.8716
R20.9879
Adjusted R20.9722
Predicted R20.8588
Adeq precision22.5893
Note: p < 0.05 is a significant difference, marked with *; p < 0.01 is the most significant difference, and the mark is **.
Table 5. Substances measured by sensors.
SensorDetermination of the Substance
W1CAliphatic aromatic compounds, benzene series
W5SNitrogen oxides
W3CAmines, aromatic substances
W6SHydrogenated compounds
W5CShort-chain alkanes, aromatic substances
W1SAlkanes, methane, methyl compounds
W1WSulfides, terpenes
W2SAlcohols, aldehydes, ketones, aromatic compounds
W2WOrganic sulfides, aromatic substances
W3SLong-chain alkanes
Table 6. Composition and content of volatile compounds substances in 14 groups of instant black tea powder (μg/kg).
NumberCompoundsNo.1No.2No.3No.4No.5No.6No.7No.8No.9No.10No.11No.12No.13No.14
Aldehydes
1Benzaldehyde210.0 319.3 254.4 370.7 440.7 310.6 138.4 541.7 569.2 659.9 885.7 646.9 289.6 591.0
2(E,E)-2,4-Heptadi-enal161.0 566.3 356.9 366.2 94.4 300.3 288.0 400.3 293.8 614.0 522.0 524.8 260.9 354.8
3Benzeneacetaldehyde165.7 926.7 815.5 1266.9 870.5 976.5 1065.1 1021.8 1310.0 1128.5 1307.7 1327.0 994.2 1586.7
42-Undecenal368.7 404.5 215.6 500.0 122.7 168.4 439.7 570.7 395.4 156.0 362.6 174.4 562.9 436.9
5Dodecanal16,462.8 437.5 346.4 540.7 403.0 419.6 413.7 387.4 474.0 517.8 513.7 438.1 359.4 474.2
62,4-Nonadienal, (E,E)-108.9 108.9 56.7 109.6 57.3 92.9 122.7 132.2 46.8 865.1 97.2 71.9 28.8 34.7
7Tetradecanal20,155.6 129.3 292.1 185.3 100.2 199.1 100.6 67.3 168.1 210.8 106.2 164.3 -270.8
8Nonanal169.7 166.8 119.7 269.3 152.5 89.2 208.0 236.3 347.5 151.0 235.4 198.5 172.1 183.5
9Undecanal8291.3 66.2 48.1 84.5 51.5 26.3 71.2 64.9 89.4 65.9 74.0 77.8 65.3 91.2
10Decanal335.3 188.2 126.9 287.4 154.0 167.3 225.1 202.6 257.3 160.2 212.4 197.8 147.5 203.6
112-Hexenal43.8 51.2 31.1 74.3 --46.7 51.7 50.9 35.2 46.1 --182.0
122-Octenal, (E)-20.5 24.4 13.3 63.6 12.7 30.5 14.6 49.5 17.7 14.1 27.8 ---
132-Nonenal, (E)-30.7 34.4 39.5 83.1 43.5 51.7 79.1 85.4 89.2 51.6 78.1 59.4 26.1 66.8
14Tridecanal79.3 98.3 76.9 97.4 192.1 139.1 182.6 175.9 85.0 152.5 153.9 95.4 147.5 183.4
15(E)-Tetradec-2-enal1372.1 --------9.3 ----
1613-Methyltetradecanal500.0 91.6 31.2 ----122.1 95.6 -104.7 -213.9 -
17(Z)-9-Hexadecenal1722.1 -------------
Alcohols
18Benzyl alcohol578.1 566.3 491.2 842.3 264.3 553.0 777.5 465.1 436.0 435.9 871.8 795.6 605.0 1200.2
19Phenylethyl alcohol1476.7 1830.4 1543.9 2596.6 1793.1 2080.1 2529.9 2293.9 2749.9 2295.8 2587.0 2489.0 1990.2 3273.9
20Phytol2183.1 3038.8 3187.5 4075.1 4536.6 4097.1 4138.2 6252.1 4541.8 4339.0 4462.2 4039.7 4173.9 2710.9
212,6,10-Dodecatrien-1-ol, 3,7,11-trimethyl-266.7 511.5 424.1 274.4 505.1 235.0 562.9 599.8 490.3 455.0 583.8 538.4 430.0 505.6
22Geraniol121.1 750.2 195.4 319.2 184.9 279.1 812.7 400.8 648.4 661.8 760.7 827.5 375.3 697.4
231,6,10-Dodecatrien-3-ol, 3,7,11-trimethyl-,(E)-2554.4 4941.5 4818.1 3931.5 4086.0 3507.0 5721.1 5611.4 4306.9 4277.0 4885.6 7281.7 3803.5 4641.2
24Linalool20.9 232.6 55.2 38.6 39.5 26.7 95.2 38.5 76.4 210.5 253.3 268.6 31.4 132.5
252-Decenal, (E)--424.2 118.3 193.6 128.5 251.5 348.2 395.3 280.7 135.2 190.6 170.6 198.6 212.4
Esters
26Propyl decanoate2177.5 544.2 713.6 634.9 718.0 489.9 ---522.4 479.6 506.3 829.3 504.2
27Undecanoic acid, ethyl ester1872.9 2846.7 2634.8 3697.6 2713.5 2776.2 2390.2 2848.5 2816.9 3577.6 3323.6 3736.8 3006.4 3257.6
28Dodecanoic acid, ethyl ester875.7 1398.6 1276.3 1610.3 1369.2 1308.4 1233.4 1440.2 1409.2 1743.4 1543.4 1702.5 1433.3 1399.1
299,12-Octadecadienoic acid (Z,Z)-, methyl ester64.0244.6-42.67130.5419.4874.8251.7167.4359.5835.4294.5228.056.0
30Hexadecanoic acid, methyl ester1986.4 356.7 358.4 409.5 398.2 622.3 493.2 498.8 383.4 425.6 418.6 428.9 461.1 311.3
311,4-Dibutyl benzene-1,4-dicarboxylate--270.8 452.7 414.6 534.9 526.4 561.6 2714.1 326.9 427.8 425.3 340.6 422.4
32Isopropyl palmitate1111.3 115.7 -186.3 41.8 135.4 --290.0 75.4 69.0 -100.1 33.2
331,2-Benzenedicarboxylic acid, bis(2-methylpropyl) ester199.04469.79310.8-453.91547.68524.08538.17335.11194.9188.11267.17193.24386.47
34Pentanedioic acid, dimethyl ester98.0 127.9 148.0 70.8 98.2 100.4 131.7 271.7 205.6 199.3 267.5 75.8 140.4 246.5
35Bis(2-ethylhexyl) phthalate19.9237.43--26.2755.288.89114.0164.8933.7423.518.2735.6271.23
36Hexanedioic acid, dimethyl ester136.6 207.7 83.0 108.5 194.9 180.1 243.8 369.2 260.9 241.0 286.7 103.7 184.0 304.0
37.gamma.-Tetradecalactone4593.1 ----924.2 -1749.3 439.0 -----
38.beta.-Phenylethyl butyrate-245.7 42.0 87.0 -370.4 --------
39Nerolidyl acetate961.3 --------5165.7 4420.5 ---
Alkanes
40Tetradecane1379.8 1157.9 1532.0 1091.8 2027.0 1191.5 1123.9 1103.1 1112.6 1034.3 991.3 1171.4 1078.6 1067.9
41Pentadecane815.7 717.2 554.0 852.6 711.7 961.8 730.9 842.2 1172.1 992.4 847.5 988.8 878.6 1049.2
42Eicosane184.7 287.9 243.9 392.0 305.6 454.4 346.1 413.5 432.2 363.3 409.9 395.0 328.3 447.2
43Heptadecane146.8493.44-96.55206.41111.9395.19116.8789.298.2395.19196.87229.27185.43
44Nonadecane103.51103.51-93.99315.32216.4280.11172.86246.28213.88196.96216.4213.88196.96
45Heptadecane, 3-methyl-----188.2775.51139.2263.2761.47139.2275.51139.2275.51-
46Hexadecane---96.3983.91---------
47Pentadecane, 2,6,10,14-tetramethyl------101.27107.47140.61135.47144.26102.33101.27101.27-
482-Methyltetracosane427.3 141.2 132.6 120.3 109.8 185.1 155.8 116.6 173.8 144.8 184.4 187.0 190.6 196.3
4911-Methyltricosane804.3 ------23.6 112.3 107.2 114.0 219.4 97.6 98.1
502,6,10-Trimethyltridecane---100.55108.11100.07108.65100.07108.65108.65108.65108.6581.71-
512-Methylhexacosane404.8 141.2 53.7 66.7 109.8 267.5 155.8 251.8 197.4 144.8 187.8 136.6 190.6 -
52.beta.-Phenylethyl butyrate-245.7 42.0 87.0 -370.4 --------
Ketones
53γ-Dodecalactone267.5 --650.0 -577.6 -717.4 663.4 530.0 339.5 318.3 327.6 308.6
542-Pentadecanone, 6,10,14-trimethyl-2885.1 1533.7 444.1 1389.2 1051.6 3595.6 4870.5 2462.2 1017.7 490.0 520.5 893.4 879.9 597.2
55.alpha.-Ionone110.9 125.7 125.4 154.8 -113.0 --201.2 304.8 315.9 316.9 -340.6
562(4H)-Benzofuranone, 5,6,7,7a-tetrahydro-4,4,7a-trimethyl-, (R)--201.6 103.8 -460.8 238.5 609.0 578.6 509.2 472.0 489.2 518.4 345.8 568.3
Acids
57n-Decanoic acid--1166.8 1754.6 1144.6 1451.8 1492.5 1781.1 1506.0 873.1 1298.5 616.6 863.1 1540.9
58Pentadecanoic acid-----237.24-----181.97--
59Eicosanoic acid6035.7 75.7 71.2 64.1 59.8 -----68.2 63.4 55.3 69.9
60Nonanoic acid72.0 52.1 -63.4 -51.9 --151.6 -47.8 40.4 105.7 59.8
Phenols
612,4-Di-tert-butylphenol757.0 1250.3 303.9 1488.9 1466.6 1225.5 1561.0 1561.2 1496.8 1514.7 1570.9 1402.1 1285.4 2167.8
62Phenol, 2,4,6-tri-tert-butyl-88.6 59.1 86.7 81.5 172.8 173.7 231.3 212.2 146.2 165.8 179.4 213.9 125.9 235.4
Other categories
63Indole1088.3 581.5 555.1 806.7 637.4 748.9 907.4 880.4 1086.6 791.4 985.8 873.5 691.0 957.3
64Caffeine701.8 -512.4 613.8 993.5 1227.0 1385.1 1994.1 2442.4 865.4 1202.6 1562.0 988.1 1140.2
65Neophytadiene1664.1 1118.4 1386.4 1871.2 1868.7 1842.6 1786.2 2056.8 1725.1 1740.0 2020.0 1596.0 1468.3 1181.2
Note: “-” indicates that the compound has not been detected in this sample.
Disclaimer/Publisher’s Note: The statements, opinions and data contained in all publications are solely those of the individual author(s) and contributor(s) and not of MDPI and/or the editor(s). MDPI and/or the editor(s) disclaim responsibility for any injury to people or property resulting from any ideas, methods, instructions or products referred to in the content.

