
Development of a DNA Metabarcoding Method for the Identification of Crustaceans (Malacostraca) and Cephalopods (Coleoidea) in Processed Foods

Abstract

1. Introduction
2. Materials and Methods
2.1. Sample Collection
2.2. DNA Extraction with CTAB Protocol and Quantification
2.3. Preparation of DNA Extract Mixtures
2.4. Reference Sequences, DNA Barcodes, and Primers

| Name | Sequence 5′ → 3′ |
|---|---|
| Fwd crustaceans [53] | GACGAKAAGACCCTA |
| FwdK-1 | GGGGACGATAAGACCCTATAAA |
| FwdK-2 | AAAGACGATAAGACCCTATAAA |
| Fwd cephalopods [54] | GACGAGAAGACCCTAATGAGCTTT |
| FwdW-1 | GGACGAGAAGACCCTATTGAG |
| FwdW-2 | GGACGAGAAGACCCTAATGAG |
| FwdW-3 | GGACGAAAAGACCCTATTGAG |
| Rev crustaceans [53] | CGCTGTTATCCCTADRGTAACT |
| RevK-1 | ATTACGCTGTTATCCCTAAAGTA |
| RevK-2 | ATAACGCTGTTATCCCTAAAGTA |
| Rev cephalopods [54] | CAAATTACGCTGTTATCCCTATGG |
| RevW-1 | ACGCTGTTATCCCTATGGTAA |
| Illumina Overhang Adapter Sequences | |
| Forward | TCGTCGGCAGCGTCAGATGTGTATAAGAGACAG |
| Reverse | GTCTCGTGGGCTCGGAGATGTGTATAAGAGACAG |
2.5. Library Preparation and NGS
2.6. NGS Data Analysis with Galaxy
3. Results and Discussion
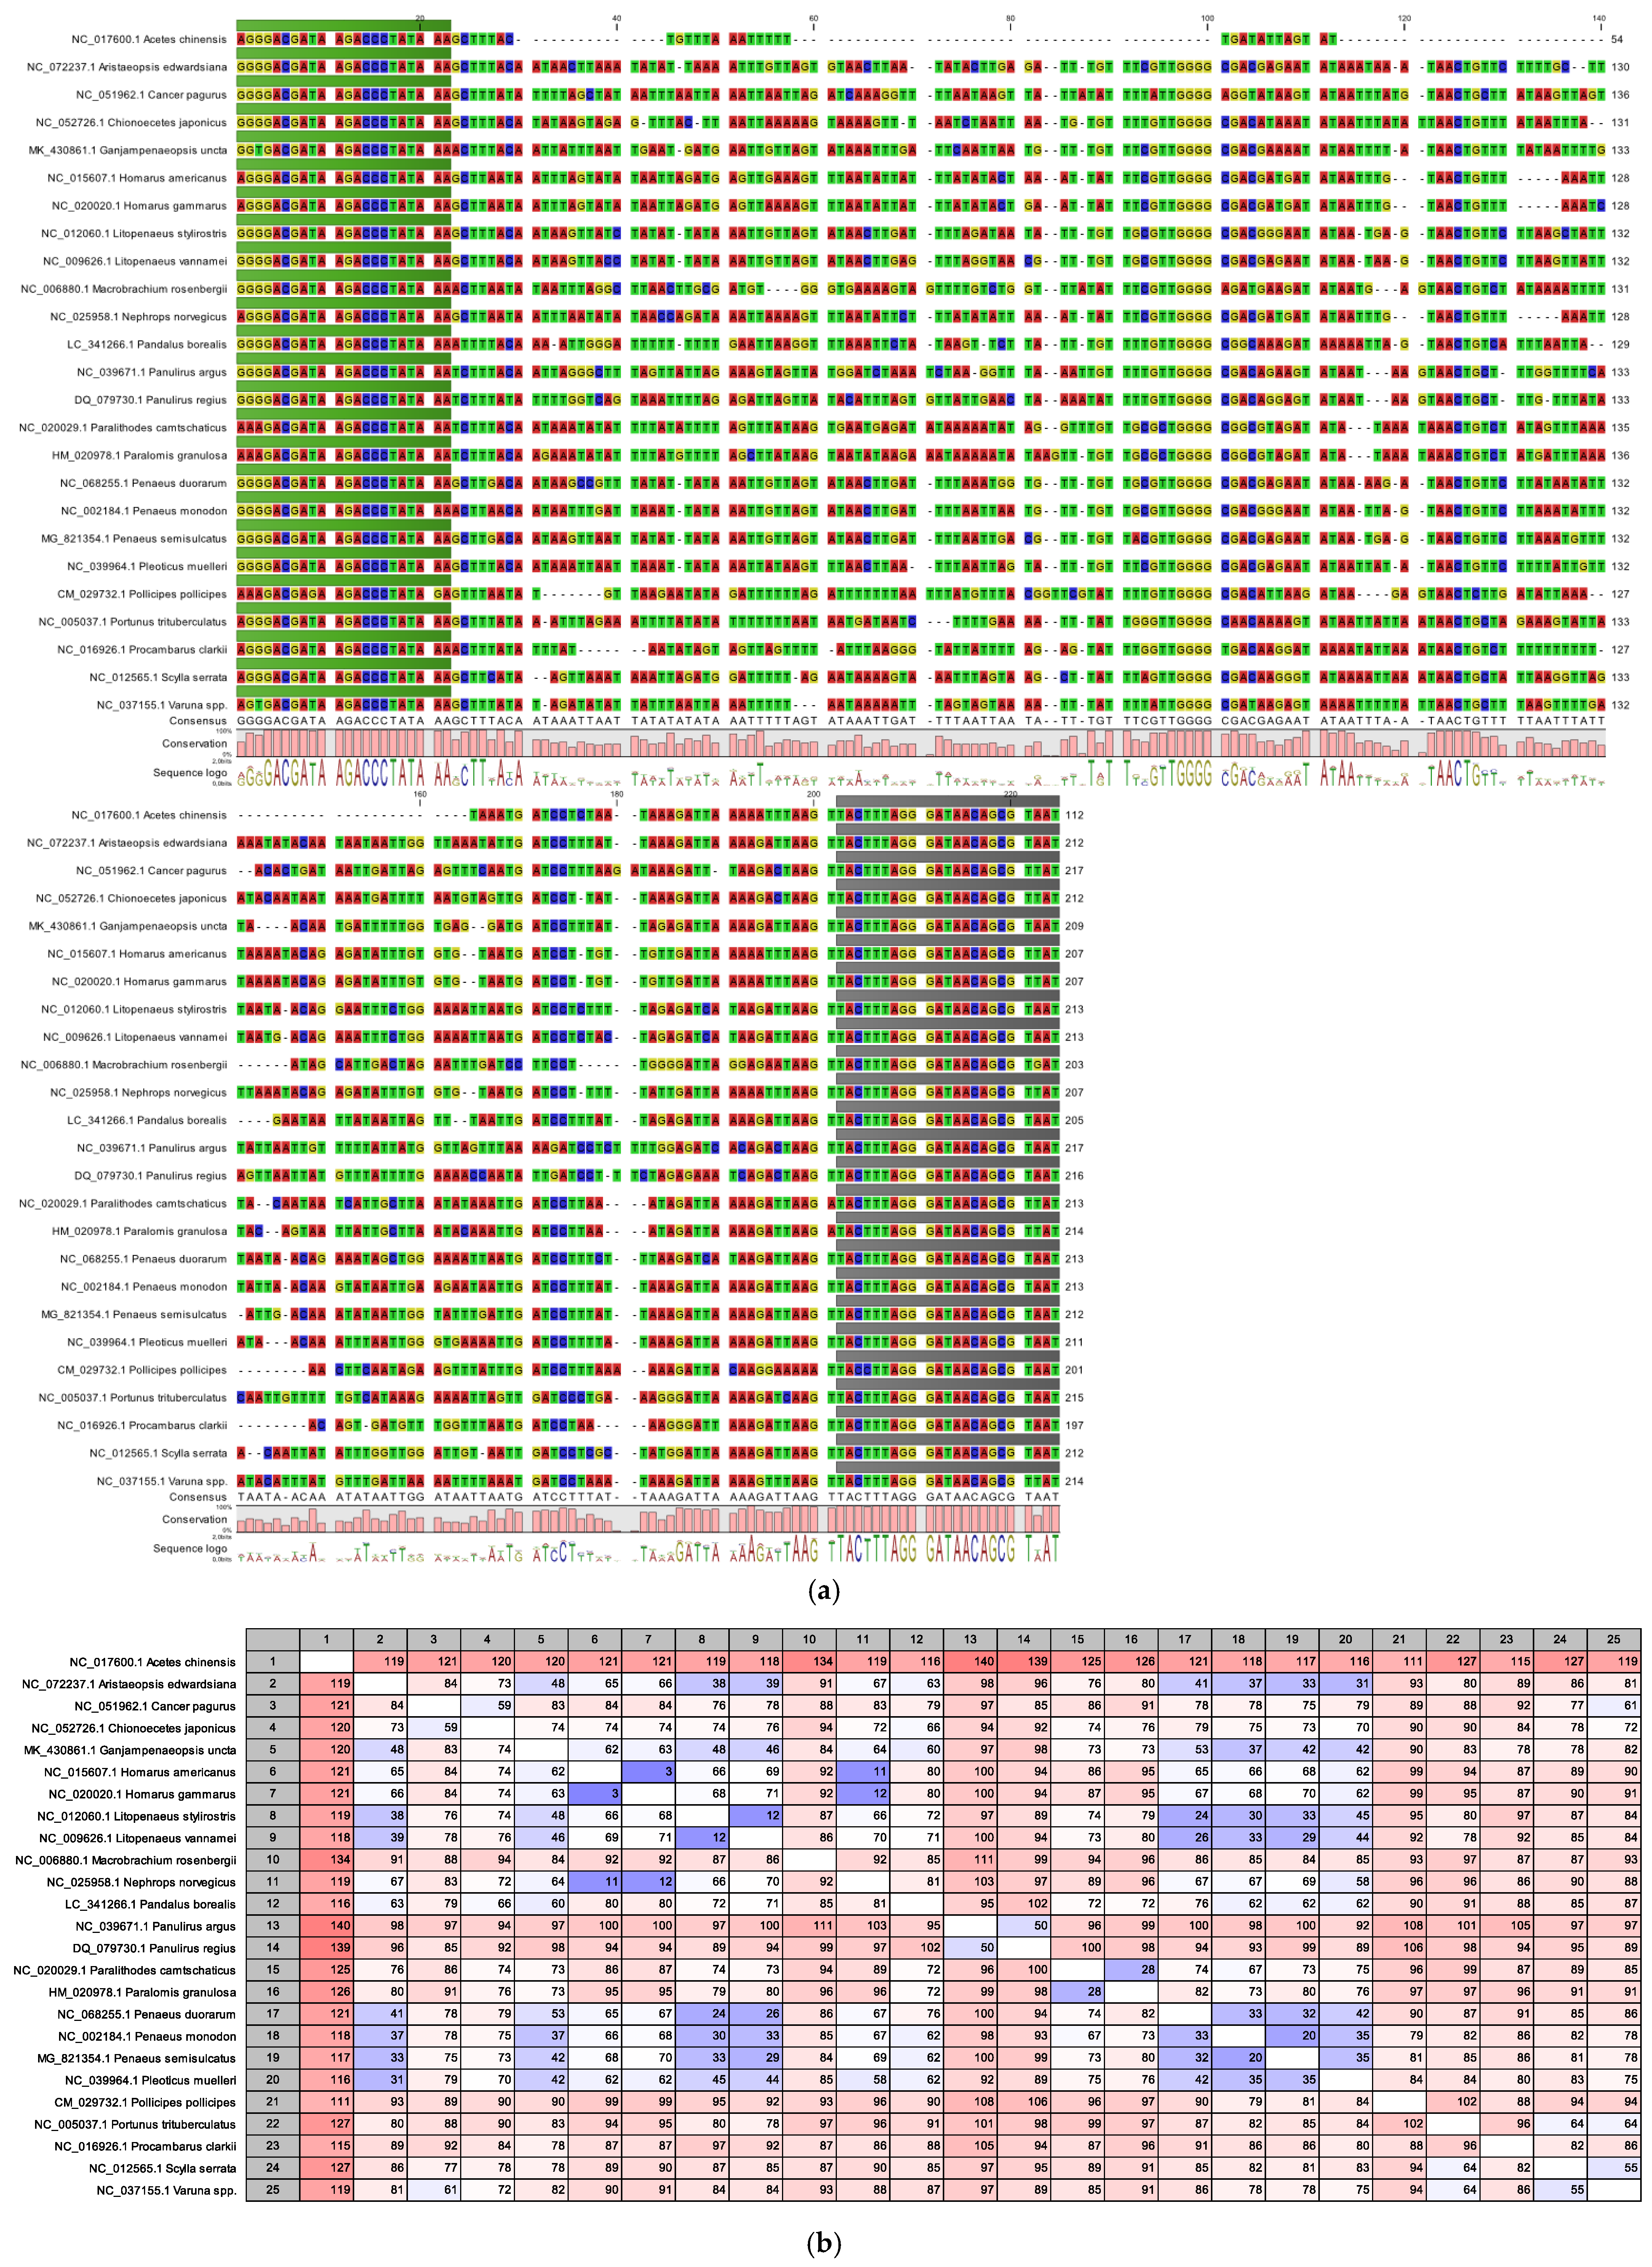
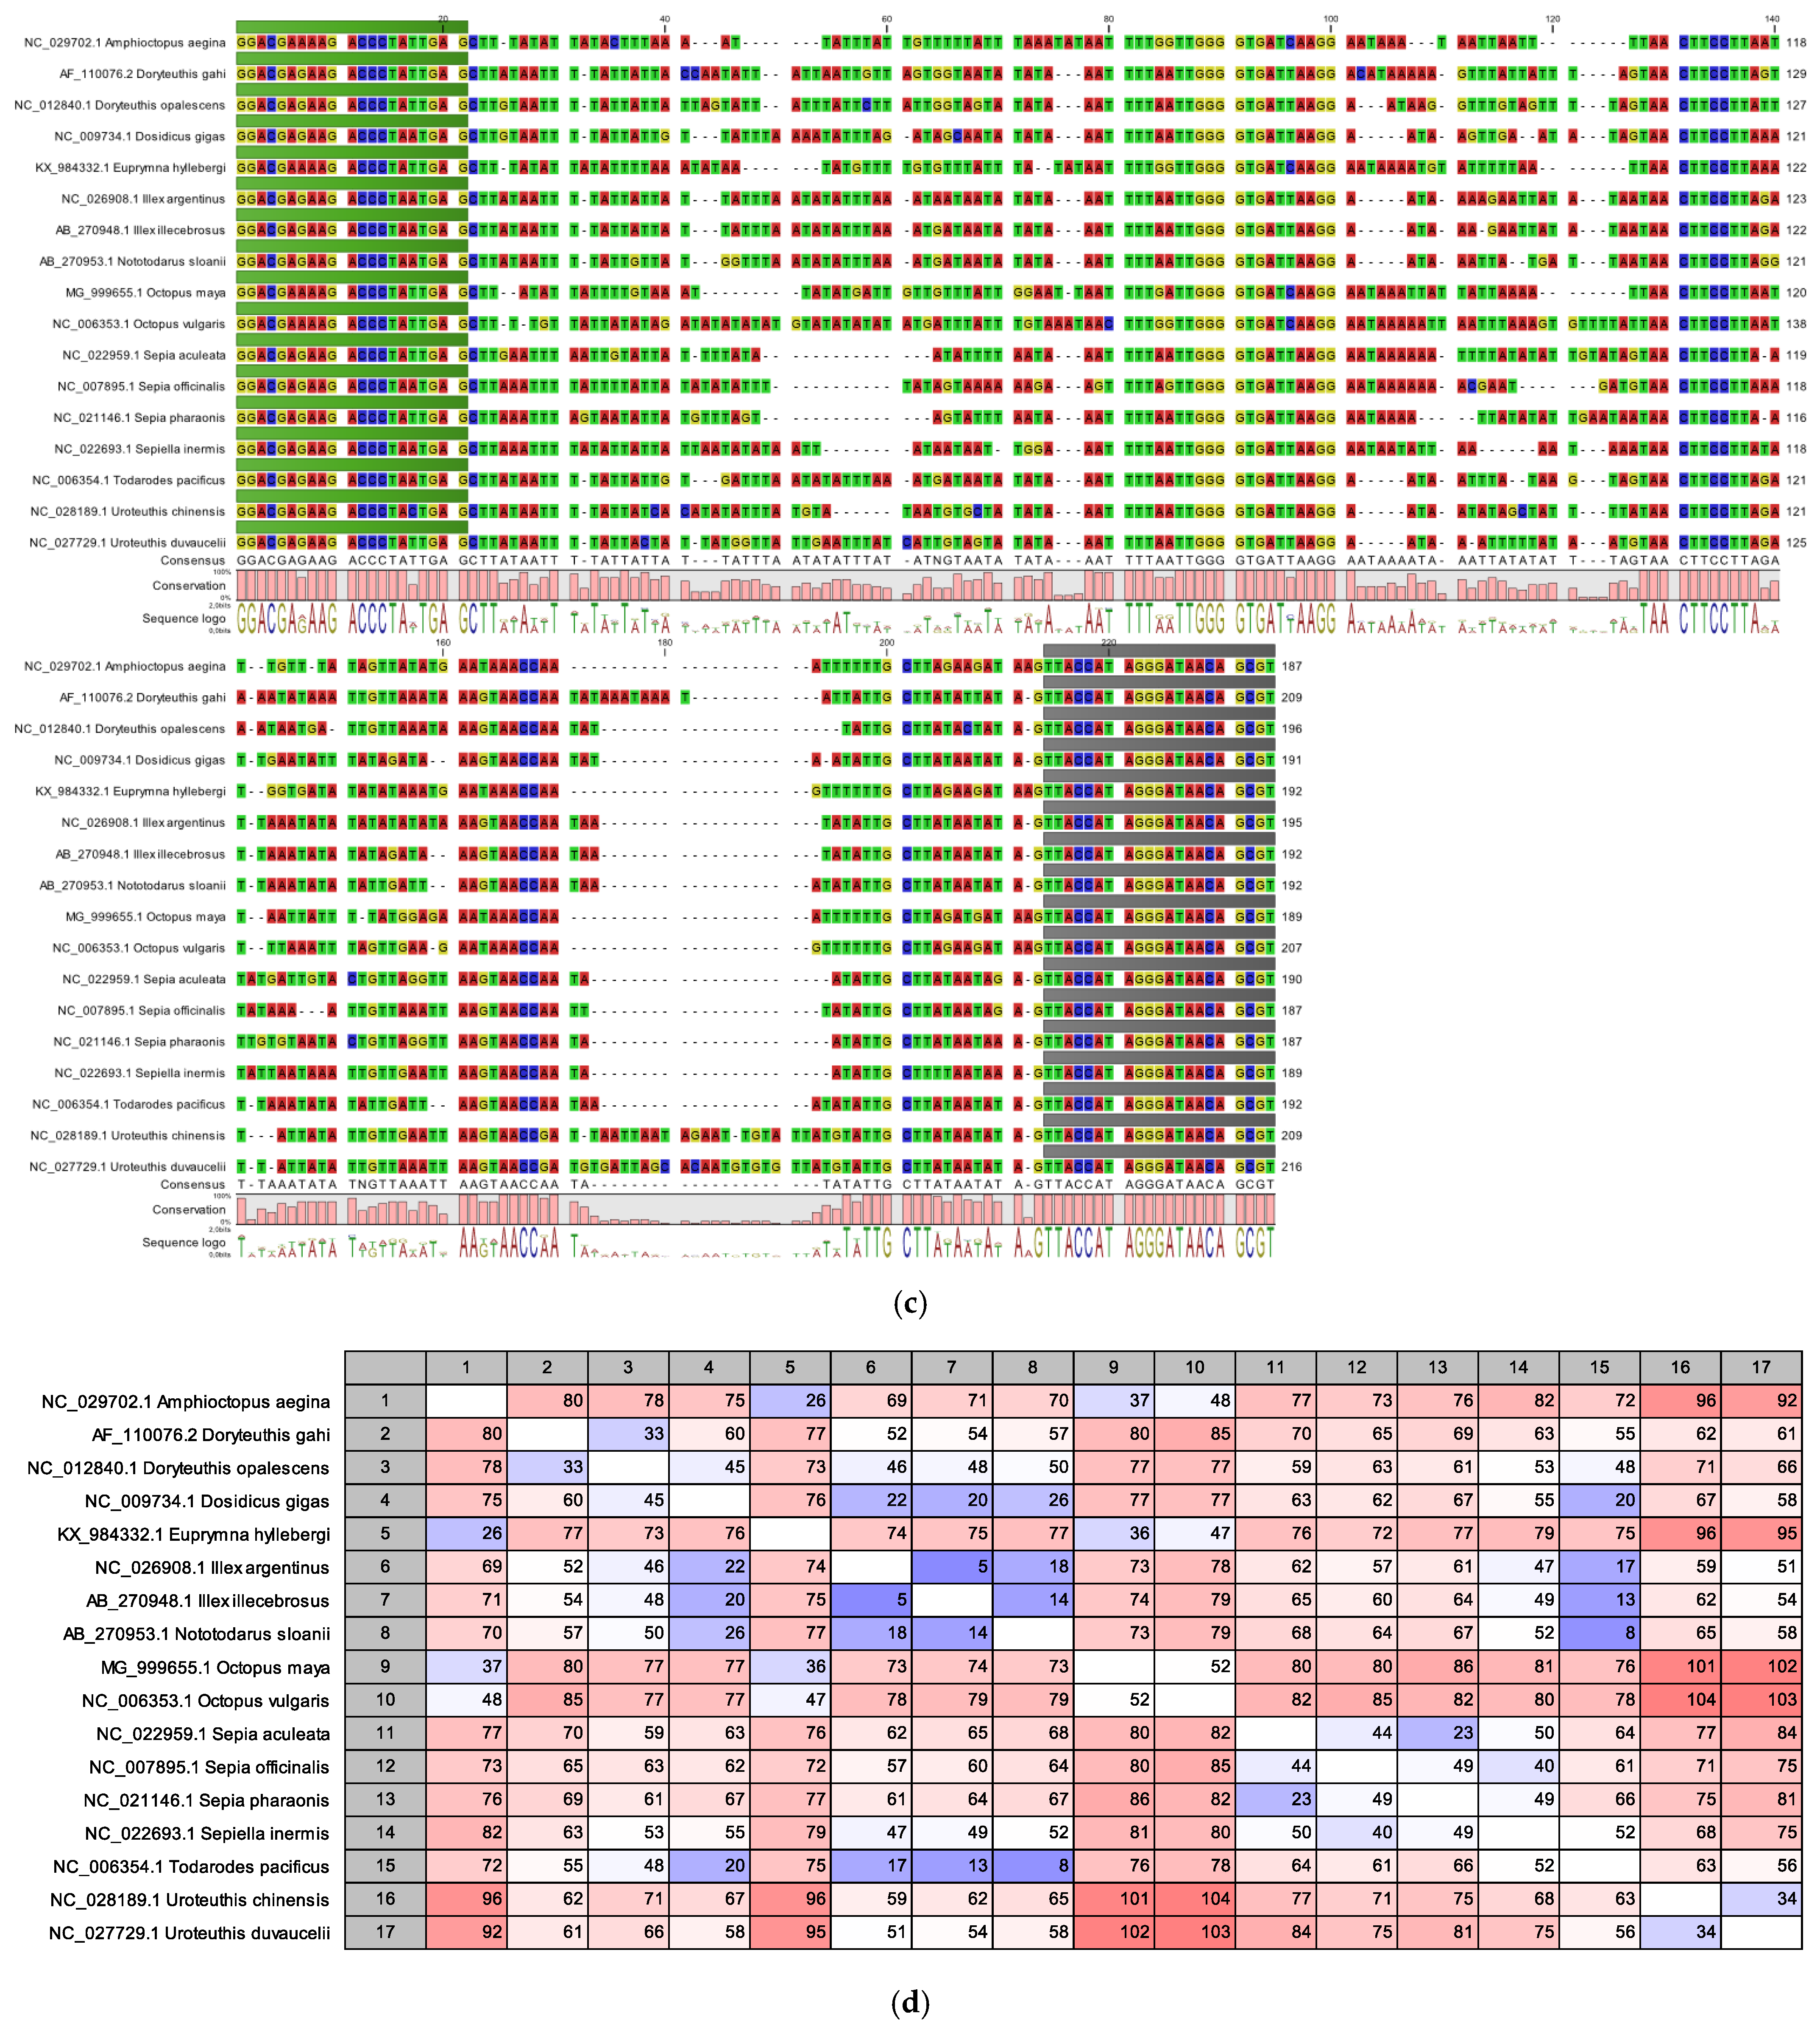
3.1. In Silico Alignment Studies of the 16S rDNA Barcodes
3.2. Development of Primer Systems, PCR Assays, and Analysis of Reference Material with DNA Metabarcoding
3.3. Analysis of DNA Extract Mixtures
3.4. Analysis of DNA Extracts from Model Foods
3.5. Analysis of Commercial Processed Foods
4. Conclusions
Supplementary Materials
Author Contributions
Funding
Institutional Review Board Statement
Data Availability Statement
Acknowledgments
Conflicts of Interest
References
- Food and Agricultural Organization of the United Nations (FAO). The State of World Fisheries and Aquaculture 2024—Blue Transformation in Action; FAO: Rome, Italy, 2024. [Google Scholar] [CrossRef]
- Hoffman, L.C.; Schreuder, J.; Cozzolino, D. Food authenticity and the interactions with human health and climate change. Crit. Rev. Food Sci. Nutr. 2024, 64, 1–14. [Google Scholar] [CrossRef] [PubMed]
- Fox, M.; Mitchell, M.; Dean, M.; Elliott, C.; Campbell, K. The seafood supply chain from a fraudulent perspective. Food Sec. 2018, 10, 939–963. [Google Scholar] [CrossRef]
- Donlan, C.J.; Luque, G.M. Exploring the causes of seafood fraud: A meta-analysis on mislabeling and price. Mar. Policy 2019, 100, 258–264. [Google Scholar] [CrossRef]
- Fernandes, T.J.R.; Amaral, J.S.; Mafra, I. DNA barcode markers applied to seafood authentication: An updated review. Crit. Rev. Food Sci. Nutr. 2020, 61, 3904–3935. [Google Scholar] [CrossRef]
- Lawrence, S.J.; Elliott, C.; Huisman, W.; Dean, M.; van Ruth, S. The 11 sins of seafood: Assessing a decade of food fraud reports in the global supply chain. Compr. Rev. Food Sci. Food Saf. 2022, 21, 3746–3769. [Google Scholar] [CrossRef]
- Ballin, N.Z.; Vogensen, F.K.; Karlsson, A.H. Species determination—Can we detect and quantify meat adulteration? Meat Sci. 2009, 83, 165–174. [Google Scholar] [CrossRef]
- Cappucci, J. Retain or Reject: The Adherence to the Kosher Laws in a Canadian City. Contemp. Jew. 2021, 41, 411–435. [Google Scholar] [CrossRef]
- Nakonechna, A.; van Bergen, A.; Anantharachagan, A.; Arnold, D.; Johnston, N.; Nadeau, K.; Rutkowski, K.; Sindher, S.B.; Sriaroon, P.; Thomas, I.; et al. Fish and shellfish allergy: Presentation and management differences in the UK and US—Analysis of 945 patients. J. Allergy Clin. Immunol. Glob. 2024, 3, 100309. [Google Scholar] [CrossRef]
- European Parliament and of the Council. Regulation (EU) No. 1169/2011 of the European Parliament and of the Council of 25 October 2011 on the provision of food information to consumers, amending Regulations (EC) No. 1924/2006 and (EC) No 1925/2006 of the European Parliament and of the Council, and repealing Commission Directive 87/250/EEC, Council Directive 90/496/EEC, Commission Directive 1999/10/EC, Directive 2000/13/EC of the European Parliament and of the Council, Commission Directives 2002/67/EC and 2008/5/EC and Commission Regulation (EC) No 608/2004. Off. J. Eur. Union 2011, L304, 18–63. [Google Scholar]
- European Parliament and of the Council. Regulation (EU) No. 1379/2013 of the European Parliament and of the Council of 11 December 2013 on the common organisation of the markets in fishery and aquaculture products, amending Council Regulations (EC) No 1184/2006 and (EC) No 1224/2009 and repealing Council Regulation (EC) No 104/2000. Off. J. Eur. Union 2013, L354, 1–21. [Google Scholar]
- Bundesministerium für Arbeit, Soziales, Gesundheit und Konsumentenschutz. Codexkapitel/B 35/Fische, Krebse, Weichtiere und daraus hergestellte Erzeugnisse: BMGF-75210/0026-II/B/13/2017; Bundesministerium für Arbeit, Soziales, Gesundheit und Konsumentenschutz: Vienna, Austria, 2007.
- Mottola, A.; Intermite, C.; Piredda, R.; Lorusso, L.; Ranieri, L.; Carpino, S.; Celano, G.V.; Di Pinto, A. DNA Metabarcoding Approach as a Potential Tool for Supporting Official Food Control Programs: A Case Study. Foods 2024, 13, 2941. [Google Scholar] [CrossRef]
- Lawrence, S.; Elliott, C.; Huisman, W.; Dean, M.; van Ruth, S. Food fraud threats in UK post-harvest seafood supply chains; an assessment of current vulnerabilities. NPJ Sci. Food 2024, 8, 30. [Google Scholar] [CrossRef]
- Guardone, L.; Tinacci, L.; Costanzo, F.; Azzarelli, D.; D’Amico, P.; Tasselli, G.; Magni, A.; Guidi, A.; Nucera, D.; Armani, A. DNA barcoding as a tool for detecting mislabeling of fishery products imported from third countries: An official survey conducted at the Border Inspection Post of Livorno-Pisa (Italy). Food Control 2017, 80, 204–216. [Google Scholar] [CrossRef]
- Salla, V.; Murray, K.K. Matrix-assisted laser desorption ionization mass spectrometry for identification of shrimp. Anal. Chim. Acta 2013, 794, 55–59. [Google Scholar] [CrossRef] [PubMed]
- Lasch, P.; Uhlig, S.; Uhlig, C.; Wilhelm, C.; Bergmann, N.; Wittke, S. Development and In-House Validation of an LC–MS and LC–MS/MS Assay for the Determination of Food Fraud for Different Fish Species. J. AOAC Int. 2019, 102, 1330–1338. [Google Scholar] [CrossRef]
- Spielmann, G.; Diedrich, J.; Haszprunar, G.; Busch, U.; Huber, I. Comparison of three DNA marker regions for identification of food relevant crustaceans of the order Decapoda. Eur. Food. Res. Technol. 2018, 245, 987–995. [Google Scholar] [CrossRef]
- Gense, K.; Peterseil, V.; Licina, A.; Wagner, M.; Cichna-Markl, M.; Dobrovolny, S.; Hochegger, R. Development of a DNA Metabarcoding Method for the Identification of Bivalve Species in Seafood Products. Foods 2021, 10, 2618. [Google Scholar] [CrossRef]
- Pascoal, A.; Barros-Velázquez, J.; Ortea, I.; Cepeda, A.; Gallardo, J.M.; Calo-Mata, P. Molecular identification of the black tiger shrimp (Penaeus monodon), the white leg shrimp (Litopenaeus vannamei) and the Indian white shrimp (Fenneropenaeus indicus) by PCR targeted to the 16S rRNA mtDNA. Food Chem. 2011, 125, 1457–1461. [Google Scholar] [CrossRef]
- Velasco, A.; Ramilo-Fernández, G.; Sotelo, C.G. A Real-Time PCR Method for the Authentication of Common Cuttlefish (Sepia officinalis) in Food Products. Foods 2020, 9, 286. [Google Scholar] [CrossRef]
- Hillinger, S.; Saeckler, J.; Domig, K.J.; Dobrovolny, S.; Hochegger, R. Development of a DNA Metabarcoding Method for the Identification of Insects in Food. Foods 2023, 12, 1086. [Google Scholar] [CrossRef]
- Hebert, P.D.N.; Cywinska, A.; Ball, S.L.; deWaard, J.R. Biological identifications through DNA barcodes. Proc. R. Soc. Lond. B 2003, 270, 313–321. [Google Scholar] [CrossRef] [PubMed]
- Chin, T.C.; Adibah, A.B.; Danial Hariz, Z.A.; Siti Azizah, M.N. Detection of mislabelled seafood products in Malaysia by DNA barcoding: Improving transparency in food market. Food Control 2016, 64, 247–256. [Google Scholar] [CrossRef]
- Wong, E.H.-K.; Hanner, R.H. DNA barcoding detects market substitution in North American seafood. Food Res. Int. 2008, 41, 828–837. [Google Scholar] [CrossRef]
- Gorini, T.; Mezzasalma, V.; Deligia, M.; De Mattia, F.; Campone, L.; Labra, M.; Frigerio, J. Check Your Shopping Cart: DNA Barcoding and Mini-Barcoding for Food Authentication. Foods 2023, 12, 2392. [Google Scholar] [CrossRef]
- Harris, D.J.; Rosado, D.; Xavier, R. DNA Barcoding Reveals Extensive Mislabeling in Seafood Sold in Portuguese Supermarkets. J. Aquat. Food Prod. Technol. 2016, 25, 1375–1380. [Google Scholar] [CrossRef]
- Marín, A.; Serna, J.; Robles, C.; Ramírez, B.; Reyes-Flores, L.E.; Zelada-Mázmela, E.; Sotil, G.; Alfaro, R. A glimpse into the genetic diversity of the Peruvian seafood sector: Unveiling species substitution, mislabeling and trade of threatened species. PLoS ONE 2018, 13, e0206596. [Google Scholar] [CrossRef]
- Nicolè, S.; Negrisolo, E.; Eccher, G.; Mantovani, R.; Patarnello, T.; Erickson, D.L.; Kress, W.J.; Barcaccia, G. Seafood Authentication by DNA Barcoding. Food Technol. Biotechnol. 2012, 50, 387–398. [Google Scholar]
- Pardo, M.A.; Jiménez, E.; Viðarsson, J.R.; Ólafsson, K.; Ólafsdóttir, G.; Daníelsdóttir, A.K.; Pérez-Villareal, B. DNA barcoding revealing mislabeling of seafood in European mass caterings. Food Control 2018, 92, 7–16. [Google Scholar] [CrossRef]
- Zhang, X.; Giusti, A.; Sun, Z.; Li, Y.; Guo, J.; Deng, W.; Chen, Y.; He, A.; Peng, H.; Tinacci, L.; et al. Molecular authentication of surimi-based products (fish cakes, 鱼糕) sold on the Chinese e-commerce: Traditional (DNA barcoding) and innovative techniques (metabarcoding) to tackle seafood fraud. Food Control 2024, 155, 110110. [Google Scholar] [CrossRef]
- Wen, J.; Tinacci, L.; Acutis, P.L.; Riina, M.V.; Xu, Y.; Zeng, L.; Ying, X.; Chen, Z.; Guardone, L.; Chen, D.; et al. An insight into the Chinese traditional seafood market: Species characterization of cephalopod products by DNA barcoding and phylogenetic analysis using COI and 16SrRNA genes. Food Control 2017, 82, 333–342. [Google Scholar] [CrossRef]
- Giusti, A.; Armani, A.; Sotelo, C.G. Advances in the analysis of complex food matrices: Species identification in surimi-based products using Next Generation Sequencing technologies. PLoS ONE 2017, 12, e0185586. [Google Scholar] [CrossRef]
- Kappel, K.; Gadelmeier, A.; Denay, G.; Gerdes, L.; Graf, A.; Hagen, M.; Hassel, M.; Huber, I.; Näumann, G.; Pavlovic, M.; et al. Detection of adulterated meat products by a next-generation sequencing-based metabarcoding analysis within the framework of the operation OPSON X: A cooperative project of the German National Reference Centre for Authentic Food (NRZ-Authent) and the competent German food control authorities. J. Consum. Prot. Food Saf. 2023, 18, 375–391. [Google Scholar] [CrossRef]
- Detcharoen, M.; Khrueakaew, P.; Sukkapat, P.; Benjakul, S.; Saetang, J. Metabarcoding for authentication of fish species in surimi-based products by Nanopore sequencing. Food Biosci. 2024, 61, 104628. [Google Scholar] [CrossRef]
- Carvalho, D.C.; Palhares, R.M.; Drummond, M.G.; Gadanho, M. Food metagenomics: Next generation sequencing identifies species mixtures and mislabeling within highly processed cod products. Food Control 2017, 80, 183–186. [Google Scholar] [CrossRef]
- Klapper, R.; Velasco, A.; Döring, M.; Schröder, U.; Sotelo, C.G.; Brinks, E.; Muñoz-Colmenero, M. A next-generation sequencing approach for the detection of mixed species in canned tuna. Food Chem. X 2023, 17, 100560. [Google Scholar] [CrossRef]
- Lee, H.-T.; Liao, C.-H.; Hsu, T.-H. DNA metabarcoding unveils the hidden species composition in fish surimi: Implications for the management of unlabeled and mixed seafood products. Heliyon 2024, 10, e36287. [Google Scholar] [CrossRef]
- Noh, E.S.; Lee, M.-N.; Kim, E.M.; Nam, B.-H.; Noh, J.K.; Park, J.Y.; Kim, K.-H.; Kang, J.-H. Discrimination of raw material species in mixed seafood products (surimi) using the next generation sequencing method. Food Biosci. 2021, 41, 100786. [Google Scholar] [CrossRef]
- Voorhuijzen-Harink, M.M.; Hagelaar, R.; van Dijk, J.P.; Prins, T.W.; Kok, E.J.; Staats, M. Toward on-site food authentication using nanopore sequencing. Food Chem. X 2019, 2, 100035. [Google Scholar] [CrossRef]
- Kappel, K.; Haase, I.; Käppel, C.; Sotelo, C.G.; Schröder, U. Species identification in mixed tuna samples with next-generation sequencing targeting two short cytochrome b gene fragments. Food Chem. 2017, 234, 212–219. [Google Scholar] [CrossRef]
- Giusti, A.; Malloggi, C.; Lonzi, V.; Forzano, R.; Meneghetti, B.; Solimeo, A.; Tinacci, L.; Armani, A. Metabarcoding for the authentication of complex seafood products: The fish burger case. J. Food Compos. Anal. 2023, 123, 105559. [Google Scholar] [CrossRef]
- Zhang, X.; Malloggi, C.; Giusti, A.; Deng, W.; Sun, Z.; Li, Y.; Guo, J.; Peng, H.; Tinacci, L.; Gao, L.; et al. Label analysis and molecular identification of Japanese Seafood Products purchased on Chinese e-commerce. Food Control 2024, 161, 110373. [Google Scholar] [CrossRef]
- Mottola, A.; Piredda, R.; Catanese, G.; Giorelli, F.; Cagnazzo, G.; Ciccarese, G.; Dambrosio, A.; Quaglia, N.C.; Di Pinto, A. DNA metabarcoding for identification of species used in fish burgers. Ital. J. Food Saf. 2022, 11, 10412. [Google Scholar] [CrossRef] [PubMed]
- Hu, J.; Giusti, A.; Zhang, J.; Tinacci, L.; Zhao, C.; Ying, X.; Armani, A.; Guidi, A.; Deng, S. A Double-Gene Metabarcoding Approach for the Authentication of Shrimp Surimi- Based Products. Genes 2025, 16, 144. [Google Scholar] [CrossRef]
- Staats, M.; Arulandhu, A.J.; Gravendeel, B.; Holst-Jensen, A.; Scholtens, I.; Peelen, T.; Prins, T.W.; Kok, E. Advances in DNA metabarcoding for food and wildlife forensic species identification. Anal. Bioanal. Chem. 2016, 408, 4615–4630. [Google Scholar] [CrossRef]
- Giusti, A.; Tinacci, L.; Sotelo, C.G.; Marchetti, M.; Guidi, A.; Zheng, W.; Armani, A. Seafood Identification in Multispecies Products: Assessment of 16SrRNA, cytb, and COI Universal Primers’ Efficiency as a Preliminary Analytical Step for Setting up Metabarcoding Next-Generation Sequencing Techniques. J. Agric. Food Chem. 2017, 65, 2902–2912. [Google Scholar] [CrossRef]
- Dobrovolny, S.; Blaschitz, M.; Weinmaier, T.; Pechatschek, J.; Cichna-Markl, M.; Indra, A.; Hufnagl, P.; Hochegger, R. Development of a DNA Metabarcoding Method for the Identification of Fifteen Mammalian and Six Poultry Species in Food. Food Chem. 2019, 272, 354–361. [Google Scholar] [CrossRef]
- Paired-End Sequencing on Illumina Platforms. Available online: https://emea.illumina.com/science/technology/next-generation-sequencing/plan-experiments/paired-end-vs-single-read.html (accessed on 27 January 2025).
- Günther, B.; Bierne, N.; Borsa, P.; Perrin, C.; Ripoll, O.; Darbois, F.; Arnaud-Haond, S. Citizen science approach for genetic species identification in a local French seafood speciality. Int. J. Gastron. Food Sci. 2024, 35, 100823. [Google Scholar] [CrossRef]
- Ho, J.K.I.; Puniamoorthy, J.; Srivathsan, A.; Meier, R. MinION sequencing of seafood in Singapore reveals creatively labelled flatfishes, confused roe, pig DNA in squid balls, and phantom crustaceans. Food Control 2020, 112, 107144. [Google Scholar] [CrossRef]
- National Center for Biotechnology Information. Available online: https://www.ncbi.nlm.nih.gov/ (accessed on 6 December 2024).
- Deagle, B.E.; Gales, N.J.; Evans, K.; Jarman, S.N.; Robinson, S.; Trebilco, R.; Hindell, M.A. Studying Seabird diet through genetic analysis of Faeces: A case study on Macaroni Penguins (Eudyptes chrysolophus). PLoS ONE 2007, 2, e831. [Google Scholar] [CrossRef]
- Chapela, M.J.; Sotelo, C.G.; Calo-Mata, P.; Pérez-Martén, R.I.; Rehbein, H.; Hold, G.L.; Quinteiro, J.; Rey-Méndez, M.; Rosa, C.; Santos, A.T. Identification of Cephalopod Species (Ommastrephidae and Loliginidae) in Seafood Products by Forensically Informative Nucleotide Sequencing (FINS). J. Food Sci. 2002, 67, 1672–1676. [Google Scholar] [CrossRef]
- Dobrovolny, S.; Uhlig, S.; Frost, K.; Schlierf, A.; Nichani, K.; Simon, K.; Cichna-Markl, M.; Hochegger, R. Interlaboratory Validation of a DNA Metabarcoding Assay for Mammalian and Poultry Species to Detect Food Adulteration. Foods 2022, 11, 1108. [Google Scholar] [CrossRef] [PubMed]
- Basic Local Alignment Search Tool of the NCBI. Available online: https://blast.ncbi.nlm.nih.gov/Blast.cgi (accessed on 9 December 2024).
- Edgar, R.C. Search and clustering orders of magnitude faster than BLAST. Bioinformatics 2010, 26, 2460–2461. [Google Scholar] [CrossRef] [PubMed]
- Huson, D.H.; Auch, A.F.; Qi, J.; Schuster, S.C. MEGAN analysis of metagenomic data. Genome Res. 2007, 17, 377–386. [Google Scholar] [CrossRef] [PubMed]
- Lorusso, L.; Piredda, R.; Mottola, A.; Intermite, C.; Ranieri, L.; Carpino, S.; Di Pinto, A. Authentication of seafood species on the ASFIS list (FAO) by in-silico evaluation of primers for metabarcoding. Food Control 2024, 165, 110663. [Google Scholar] [CrossRef]
- Stadhouders, R.; Pas, S.D.; Anber, J.; Voermans, J.; Mes, T.H.M.; Schutten, M. The Effect of Primer-Template Mismatches on the Detection and Quantification of Nucleic Acids Using the 5’ Nuclease Assay. J. Mol. Diagn. 2010, 12, 109–117. [Google Scholar] [CrossRef]
- ViennaRNA Web Services. Available online: http://rna.tbi.univie.ac.at/ (accessed on 4 December 2024).
- Fan, H.; Wang, J.; Komiyama, M.; Liang, X. Effects of secondary structures of DNA templates on the quantification of qPCR. J. Biomol. Struct. Dyn. 2019, 37, 2867–2874. [Google Scholar] [CrossRef]
- Reksten, A.M.; Wiech, M.; Aakre, I.; Markhus, M.W.; Nøstbakken, O.J.; Hannisdal, R.; Madsen, L.; Dahl, L. Exploring the nutrient composition of various shellfish available in Norway and their role in providing key nutrients. J. Food Compos. Anal. 2024, 128, 106003. [Google Scholar] [CrossRef]
- del Socorro Toxqui Rodríguez, M.; Vanhollebeke, J.; Derycke, S. Evaluation of DNA metabarcoding using Oxford Nanopore sequencing for authentication of mixed seafood products. Food Control 2023, 145, 109388. [Google Scholar] [CrossRef]
- Sarmiento, K.P.; Pereda, J.M.R.; Ventolero, M.F.H.; Santos, M.D. Not fish in fish balls: Fraud in some processed seafood products detected by using DNA barcoding. Phillippine Sci. Lett. 2018, 11, 30–36. [Google Scholar]
- Kroetz, K.; Luque, G.M.; Gephart, J.A.; Jardine, S.L.; Lee, P.; Moore, K.C.; Cole, C.; Steinkruger, A.; Donlan, C.J. Consequences of seafood mislabeling for marine populations and fisheries management. Proc. Natl. Acad. Sci. USA 2020, 117, 30318–30323. [Google Scholar] [CrossRef]
- Rasmussen, R.S.; Morrissey, M.T. Application of DNA-based methods to identify fish and seafood substitution on the commercial market. Compr. Rev. Food Sci. Food Saf. 2009, 8, 118–154. [Google Scholar] [CrossRef]
- Lo, Y.-T.; Shaw, P.-C. DNA-based techniques for authentication of processed food and food supplements. Food Chemistry 2018, 240, 767–774. [Google Scholar] [CrossRef] [PubMed]
- Athanassiou, C.G.; Vayias, B.J.; Dimizas, C.B.; Kavallieratos, N.G.; Papagregoriou, A.S.; Buchelos, C.T. Insecticidal efficacy of diatomaceous earth against Sitophilus oryzae (L.) (Coleoptera: Curculionidae) and Tribolium confusum du Val (Coleoptera: Tenebrionidae) on stored wheat: Influence of dose rate, temperature and exposure interval. J. Stored Prod. Res. 2005, 41, 47–55. [Google Scholar] [CrossRef]
- IUCN Red List of Threatened Species. Available online: https://www.iucnredlist.org/ (accessed on 9 December 2024).
- Köppel, R.; Daniels, M.; Felderer, N.; Brünen-Nieweler, C. Multiplex real-time PCR for the detection and quantification of DNA from duck, goose, chicken, turkey and pork. Eur. Food Res. Technol. 2013, 236, 1093–1098. [Google Scholar] [CrossRef]
- Giusti, A.; Malloggi, C.; Magagna, G.; Filipello, V.; Armani, A. Is the metabarcoding ripe enough to be applied to the authentication of foodstuff of animal origin? A systematic review. Compr. Rev. Food Sci. Food Saf. 2024, 23, e13256. [Google Scholar] [CrossRef]
| Taxonomic Class/Subclass | Species with Identical Barcodes |
|---|---|
| Malacostraca | Jasus tristani:Jasus paulensis |
| Varuna yui:Varuna litterata | |
| Lysmata uncicornis:Lysmata arvoredensis | |
| Chionoecetes bairdi:Chionoecetes opilio | |
| Portunus sayi:Portunus segnis | |
| Charybdis riversandersoni:Charybdis miles | |
| Heterocarpus corona:Heterocarpus gibbosus | |
| Maja squinado:Maja brachydactyla | |
| Polybius holsatus:Polybius henslowii | |
| Parapenaeus australiensis:Parapenaeus ruberoculatus | |
| Metapenaeus brevicornis:Metapenaeus dobsoni | |
| Metanephrops velutinus:Metanephrops andamanicus:Metanephrops sagamiensis | |
| Parapenaeus sextuberculatus:Parapenaeus lanceolatus:Parapenaeus kensleyi:Parapenaeus indicus:Parapenaeus fissuroides | |
| Solenocera melantho:Solenocera crassicornis | |
| Heterocarpus woodmasoni:Heterocarpus fascirostratus | |
| Heterocarpus parvispina:Heterocarpus hayashii:Heterocarpus ensifer | |
| Coleoidea | Sepia recurvirostra:Sepia madokai |
| Octopus mimus:Octopus hubbsorum | |
| Octopus minor:Octopus variabilis | |
| Sepia pharaonis:Sepia ramani | |
| Sepiola rondeleti:Sepiola intermedia | |
| Sepiella maindroni:Sepiella japonica | |
| Uroteuthis singhalensis:Uroteuthis duvaucelii |
| Sample ID | Expected Species | Identified Species | Commercial Name (English) | Total Raw Reads | Total Reads Passing the Pipeline | Reads Assigned Correctly |
|---|---|---|---|---|---|---|
| 1 | Aristaeopsis edwardsiana | Carabineros shrimp | 15,547 | 15,154 | 15,147 | |
| 2 | Homarus americanus | American lobster | 48,835 | 48,211 | 48,151 | |
| 3 | Homarus americanus | American lobster | 63,977 | 60,964 | 60,876 | |
| 4 | Litopenaeus vannamei | Whiteleg shrimp | 47,678 | 47,067 | 46,988 | |
| 5 | Litopenaeus vannamei | Whiteleg shrimp | 54,231 | 53,478 | 53,440 | |
| 6 | Litopenaeus vannamei | Whiteleg shrimp | 41,712 | 41,159 | 41,089 | |
| 7 | Litopenaeus vannamei | Whiteleg shrimp | 51,514 | 50,670 | 50,630 | |
| 8 | Litopenaeus vannamei | Whiteleg shrimp | 54,555 | 53,859 | 53,811 | |
| 9 | Litopenaeus vannamei | Whiteleg shrimp | 51,965 | 51,254 | 51,180 | |
| 10 | Litopenaeus vannamei | Whiteleg shrimp | 60,082 | 59,300 | 59,243 | |
| 11 | Macrobrachium rosenbergii | Giant river prawn | 60,082 | 59,300 | 59,243 | |
| 13 | Metapenaeus monoceros | Ganjampenaeopsis uncta | Shrimp | 64,968 | 63,738 | 62,993 |
| 14 | Metapenaeus monoceros | Ganjampenaeopsis uncta | Shrimp | 69,722 | 68,488 | 67,670 |
| 15 | Nephrops norvegicus | Norway lobster | 28,662 | 26,200 | 26,034 | |
| 16 | Panulirus argus | Caribbean spiny lobster | 22,358 | 21,941 | 21,838 | |
| 17 | Pandalus borealis | Northern prawn | 30,632 | 27,409 | 27,214 | |
| 18 | Pandalus borealis | Northern prawn | 67,124 | 64,459 | 63,946 | |
| 19 | Paralithodes camtschaticus | Red king crab | 71,559 | 68,561 | 66,508 | |
| 20 | Paralomis granulosa | Stone crab | 72,018 | 70,886 | 70,535 | |
| 21 | Penaeus monodon | Giant tiger prawn | 40,192 | 38,446 | 38,358 | |
| 22 | Penaeus monodon | Giant tiger prawn | 25,434 | 25,195 | 25,058 | |
| 23 | Penaeus monodon | Giant tiger prawn | 41,889 | 41,352 | 41,292 | |
| 24 | Penaeus notalis | Penaeus duorarum | Shrimp | 59,698 | 59,008 | 58,929 |
| 25 | Pleoticus muelleri | Argentine red shrimp | 48,943 | 48,338 | 48,102 | |
| 26 | Procambarus clarkii | Red swamp crawfish | 107,491 | 96,537 | 96,278 | |
| 27 | Doryteuthis gahi | Patagonian longfin squid | 42,872 | 42,598 | 42,473 | |
| 28 | Dosidicus gigas | Jumbo flying squid | 88,759 | 86,095 | 85,906 | |
| 29 | Illex argentinus | Euprymna hyllebergi | Small benthic squid | 48,697 | 46,071 | 45,292 |
| 30 | Loligo opalescens | Doryteuthis opalescens | Opalescent inshore squid | 53,342 | 52,487 | 52,339 |
| 31 | Nototodarus sloanii | New Zealand arrow squid | 72,036 | 71,311 | 71,159 | |
| 32 | Amphioctopus aegina | Marbled octopus | 25,005 | 21,545 | 21,511 | |
| 32 | Octopus maya | Mexican four-eyed octopus | 64,169 | 63,576 | 63,421 | |
| 33 | Octopus vulgaris | Common octopus | 64,050 | 54,037 | 53,451 | |
| 34 | Octopus vulgaris | Common octopus | 21,756 | 21,549 | 21,514 | |
| 35 | Octopus vulgaris | Sepia pharaonis | Pharaoh cuttlefish | 36,477 | 36,146 | 35,791 |
| 36 | Sepiella inermis | Spineless cuttlefish | 44,133 | 43,773 | 43,553 | |
| 37 | Todarodes pacificus | Japanese flying squid | 48,252 | 47,823 | 47,728 | |
| 38 | Uroteuthis chinensis | Taiwanese squid | 27,369 | 25,801 | 25,686 | |
| 39 | Uroteuthis duvaucelii | Indian Ocean squid | 55,824 | 55,028 | 54,958 | |
| 40 | Nephrops norvegicus | Norway lobster | 63,454 | 62,273 | 62,216 | |
| 41 | Procambarus clarkii | Red swamp crawfish | 52,094 | 48,578 | 48,475 | |
| 42 | Litopenaeus vannamei | Whiteleg shrimp | 53,205 | 52,426 | 52,332 | |
| 43 | Penaeus semisulcatus | Green tiger prawn | 40,611 | 39,201 | 39,095 | |
| 44 | Macrobrachium rosenbergii | Giant river prawn | 66,803 | 63,644 | 63,536 | |
| 45 | Pollicipes pollicipes | Goose neck barnacle | 60,266 | 59,677 | 59,514 | |
| 46 | Paralithodes camtschaticus | Red king crab | 75,110 | 71,749 | 69,515 | |
| 47 | Panulirus argus | Panulirus regius | Royal spiny lobster | 58,954 | 55,575 | 55,451 |
| 48 | Sepia pharaonis | Sepia aculeata | Common cuttlefish | 43,778 | 43,481 | 43,407 |
| 49 | Pandalus borealis | Northern prawn | 54,690 | 52,463 | 52,126 | |
| 50 | Scylla serrata | Mud crab | 48,582 | 47,526 | 47,485 | |
| 51 | Chionoecetes japonicus | Red snow crab | 22,807 | 22,409 | 21,818 | |
| 52 | Doryteuthis gahi | Patagonian longfin squid | 32,920 | 32,674 | 32,215 | |
| 53 | Illex argentinus | Argentine shortfin squid | 32,202 | 31,887 | 31,441 | |
| 54 | Portunus trituberculatus | Gazami crab | 48,542 | 47,670 | 47,291 | |
| 55 | Procambarus clarkii | Red swamp crawfish | 42,194 | 39,065 | 38,914 | |
| 56 | Penaeus monodon | Giant tiger prawn | 30,930 | 30,667 | 30,499 | |
| 57 | Sepia spp. | Sepia officinalis | European common cuttlefish | 37,233 | 36,968 | 36,826 |
| 58 | Dosidicus gigas | Jumbo flying squid | 35,930 | 35,736 | 35,630 | |
| 59 | Sepiella inermis | Spineless cuttlefish | 70,903 | 69,531 | 69,492 | |
| 60 | Litopenaeus stylirostris | Blue shrimp | 26,578 | 22,497 | 22,387 | |
| 61 | Illex illecebrosus | Northern shortfin squid | 124,657 | 121,117 | 120,877 | |
| 62 | Acetes chinensis | Shrimp | 68,967 | 64,879 | 63,905 | |
| 63 | Cancer pagurus | Edible crab | 133,702 | 127,196 | 127,093 | |
| 64 | Varuna spp. | Crab | 19,124 | 18,759 | 18,750 | |
| 65 | Homarus gammarus | Homarus gammarus | European lobster, American lobster | 63,433 | 54,462 | 52,088 |
| Homarus americanus | 2097 | |||||
| Number of DNA Extract Mixture | Species | Composition (% w/w) | Total Number of Raw Reads | Total Number of Reads Passing the Pipeline | Reads Assigned Correctly | Reads Assigned Correctly [%] |
|---|---|---|---|---|---|---|
| 1 | Litopenaeus vannamei | 98 | 122,138 | 120,298 | 118,561 | 98.6 |
| Penaeus monodon | 1.5 | 151 | 0.1 | |||
| Panulirus argus | 0.5 | 1547 | 1.3 | |||
| 2 | Litopenaeus vannamei | 98 | 113,774 | 112,035 | 111,618 | 99.6 |
| Penaeus monodon | 1.5 | 147 | 0.1 | |||
| Homarus gammarus | 0.5 | 241 | 0.2 | |||
| 3 | Litopenaeus vannamei | 98 | 130,215 | 128,309 | 128,105 | 99.8 |
| Penaeus monodon | 1.5 | 169 | 0.1 | |||
| Cancer pagurus | 0.5 | 12 | 0.009 | |||
| 4 | Litopenaeus vannamei | 17 | 126,700 | 118,427 | 7620 | 6.4 |
| Litopenaeus stylirostris | 17 | 1568 | 1.3 | |||
| Penaeus monodon | 17 | 1802 | 1.5 | |||
| Penaeus semisulcatus | 17 | 91,888 | 77.6 | |||
| Penaeus duorarum | 17 | 11,706 | 9.9 | |||
| Ganjampenaeopsis uncta | 17 | 3782 | 3.2 | |||
| 5 | Litopenaeus vannamei | 17 | 105,130 | 95,483 | 1886 | 2.0 |
| Homarus americanus | 17 | 15,457 | 16.2 | |||
| Panulirus regius | 17 | 17,167 | 18.0 | |||
| Scylla serrata | 17 | 59,366 | 62.2 | |||
| Procambarus clarkii | 17 | 1323 | 1.4 | |||
| Paralithodes camtschaticus | 17 | 245 | 0.3 | |||
| 6 | Procambarus clarkii | 97.0 | 116,394 | 110,363 | 107,597 | 97.5 |
| Litopenaeus vannamei | 0.5 | 258 | 0.2 | |||
| Litopenaeus stylirostris | 0.5 | 47 | 0.04 | |||
| Penaeus monodon | 0.5 | 55 | 0.1 | |||
| Penaeus semisulcatus | 0.5 | 1996 | 1.8 | |||
| Penaeus duorarum | 0.5 | 292 | 0.3 | |||
| Ganjampenaeopsis uncta | 0.5 | 88 | 0.1 | |||
| 7 | Penaeus monodon | 97.0 | 91,972 | 88,023 | 71,001 | 80.7 |
| Litopenaeus vannamei | 0.5 | 428 | 0.5 | |||
| Homarus americanus | 0.5 | 3139 | 3.6 | |||
| Panulirus regius | 0.5 | 2998 | 3.4 | |||
| Scylla serrata | 0.5 | 9959 | 11.3 | |||
| Procambarus clarkii | 0.5 | 396 | 0.4 | |||
| Paralithodes camtschaticus | 0.5 | 74 | 0.1 | |||
| 8 | Panulirus argus | 98 | 157,230 | 152,906 | 152,471 | 99.7 |
| Homarus gammarus | 1.5 | 344 | 0.2 | |||
| Cancer pagurus | 0.5 | 1 | 0.0 | |||
| 9 | Homarus gammarus | 98 | 127,103 | 118,266 | 114,271 | 96.6 |
| Cancer pagurus | 1.5 | 15 | 0.01 | |||
| Panulirus argus | 0.5 | 1257 | 1.1 | |||
| 10 | Cancer pagurus | 98 | 104,264 | 100,767 | 48,590 | 48.2 |
| Panulirus argus | 1.5 | 49,345 | 49.0 | |||
| Homarus gammarus | 0.5 | 2661 | 2.6 | |||
| 11 | Gallus gallus | 85 | 127,236 | 119,841 | 0 | 0.0 |
| Litopeneaus vannamei | 5 | 7737 | 6.5 | |||
| Homarus gammarus | 5 | 8448 | 7.0 | |||
| Scylla serrata | 5 | 103,424 | 86.3 | |||
| 12 | Sus scrofa | 85 | 129,275 | 122,438 | 0 | 0.0 |
| Litopeneaus vannamei | 5 | 8129 | 6.6 | |||
| Homarus gammarus | 5 | 8535 | 7.0 | |||
| Scylla serrata | 5 | 105,519 | 86.2 | |||
| 13 | Sparus aurata | 85 | 142,005 | 134,238 | 0 | 0.0 |
| Litopeneaus vannamei | 5 | 10,185 | 7.6 | |||
| Homarus gammarus | 5 | 10,976 | 8.2 | |||
| Scylla serrata | 5 | 112,785 | 84.0 | |||
| 14 | Zea mays | 85 | 135,635 | 127,946 | 0 | 0.0 |
| Litopeneaus vannamei | 5 | 9150 | 7.2 | |||
| Homarus gammarus | 5 | 9583 | 7.5 | |||
| Scylla serrata | 5 | 108,942 | 85.1 | |||
| 15 | Mytilus spp. | 85 | 144,115 | 135,886 | 12 | 0.009 |
| Litopeneaus vannamei | 5 | 9849 | 7.2 | |||
| Homarus gammarus | 5 | 9718 | 7.2 | |||
| Scylla serrata | 5 | 116,043 | 85.4 | |||
| 16 | Octopus vulgaris | 98 | 107,278 | 105,994 | 105,783 | 99.8 |
| Illex argentinus | 1.5 | 70 | 0.1 | |||
| Uroteuthis chinensis | 0.5 | 114 | 0.1 | |||
| 17 | Octopus vulgaris | 98 | 122,817 | 121,388 | 121,204 | 99.8 |
| Illex argentinus | 1.5 | 82 | 0.1 | |||
| Dosidicus gigas | 0.5 | 84 | 0.1 | |||
| 18 | Octopus vulgaris | 98 | 121,814 | 120,142 | 120,081 | 99.9 |
| Illex argentinus | 1.5 | 39 | 0.03 | |||
| Illex illecebrosus | 0.5 | 0 | 0.0 | |||
| 19 | Dosidicus gigas | 20 | 128,539 | 122,392 | 64,807 | 53.0 |
| Illex illecebrosus | 20 | 80 | 0.1 | |||
| Illex argentinus | 20 | 12,985 | 10.6 | |||
| Nototodarus sloanii | 20 | 11,997 | 9.8 | |||
| Todarodes pacificus | 20 | 32,431 | 26.5 | |||
| 20 | Octopus vulgaris | 20 | 145,905 | 142,396 | 21,957 | 15.4 |
| Dosidicus gigas | 20 | 17,888 | 12.6 | |||
| Uroteuthis chinensis | 20 | 32,115 | 22.6 | |||
| Euprymna hyllebergi | 20 | 5783 | 4.1 | |||
| Sepia pharaonis | 20 | 63,822 | 44.8 | |||
| 21 | Illex argentinus | 98.0 | 97,750 | 95,347 | 87,013 | 91.3 |
| Sepia pharaonis | 0.5 | 5418 | 5.7 | |||
| Sepia aculeata | 0.5 | 2642 | 2.8 | |||
| Sepia officinalis | 0.5 | 40 | 0.04 | |||
| Sepiella inermis | 0.5 | 83 | 0.1 | |||
| 22 | Illex argentinus | 98.0 | 79,723 | 78,069 | 69,180 | 88.6 |
| Dosidicus gigas | 0.5 | 1125 | 1.4 | |||
| Uroteuthis chinensis | 0.5 | 2165 | 2.8 | |||
| Euprymna hyllebergi | 0.5 | 302 | 0.4 | |||
| Sepia pharaonis | 0.5 | 4591 | 5.9 | |||
| 23 | Octopus vulgaris | 98 | 102,779 | 101,276 | 101,229 | 100.0 |
| Illex argentinus | 1.5 | 43 | 0.04 | |||
| Uroteuthis duvaucellii | 0.5 | 1 | 0.0 | |||
| 24 | Illex argentinus | 98 | 95,406 | 94,229 | 93,283 | 99.0 |
| Uroteuthis duvaucellii | 1.5 | 83 | 0.1 | |||
| Octopus vulgaris | 0.5 | 806 | 0.9 | |||
| 25 | Uroteuthis duvaucellii | 98 | 93,731 | 92,020 | 58,954 | 64.1 |
| Octopus vulgaris | 1.5 | 31,270 | 34.0 | |||
| Illex argentinus | 0.5 | 1780 | 1.9 | |||
| 26 | Doryteuthis gahi | 90 | 131,746 | 127,458 | 79,158 | 62.1 |
| Illex argentinus | 5 | 26,022 | 20.4 | |||
| Nototodarus sloanii | 5 | 22,214 | 17.4 | |||
| 27 | Uroteuthis chinensis | 95 | 144,194 | 142,628 | 142,500 | 99.9 |
| Uroteuthis duvaucellii | 5 | 55 | 0.04 | |||
| 28 | Uroteuthis duvaucellii | 95 | 146,272 | 142,370 | 39,983 | 28.1 |
| Uroteuthis chinensis | 5 | 102,311 | 71.9 | |||
| 29 | Sepiella inermis | 70 | 132,448 | 128,272 | 22,816 | 17.8 |
| Sepia pharaonis | 10 | 36,878 | 28.7 | |||
| Sepia officinalis | 10 | 559 | 0.4 | |||
| Sepia aculeata | 10 | 67,522 | 52.6 | |||
| 30 | Gallus gallus | 70 | 154,842 | 151,040 | 0 | 0.0 |
| Todarodes pacificus | 5 | 21,458 | 14.2 | |||
| Doryteuthis gahi | 5 | 854 | 0.6 | |||
| Dosidicus gigas | 5 | 51,473 | 34.1 | |||
| Illex argentinus | 5 | 9402 | 6.2 | |||
| Octopus vulgaris | 5 | 66,491 | 44.0 | |||
| Doryteuthis opalescens | 5 | 2102 | 1.4 | |||
| 31 | Sus scrofa | 70 | 108,057 | 105,584 | 2211 | 2.1 |
| Todarodes pacificus | 5 | 15,134 | 14.3 | |||
| Doryteuthis gahi | 5 | 625 | 0.6 | |||
| Dosidicus gigas | 5 | 35,496 | 33.6 | |||
| Illex argentinus | 5 | 5791 | 5.5 | |||
| Octopus vulgaris | 5 | 45,054 | 42.7 | |||
| Doryteuthis opalescens | 5 | 1254 | 1.2 | |||
| 32 | Gadus chalcogrammus | 70 | 123,571 | 121,128 | 112 | 0.1 |
| Todarodes pacificus | 5 | 18,315 | 15.1 | |||
| Doryteuthis gahi | 5 | 805 | 0.7 | |||
| Dosidicus gigas | 5 | 42,108 | 34.8 | |||
| Illex argentinus | 5 | 6796 | 5.6 | |||
| Octopus vulgaris | 5 | 50,836 | 42.0 | |||
| Doryteuthis opalescens | 5 | 1915 | 1.6 | |||
| 33 | Zea mays | 70 | 147,666 | 144,660 | 0 | 0.0 |
| Todarodes pacificus | 5 | 22,409 | 15.5 | |||
| Doryteuthis gahi | 5 | 985 | 0.7 | |||
| Dosidicus gigas | 5 | 52,820 | 36.5 | |||
| Illex argentinus | 5 | 7720 | 5.3 | |||
| Octopus vulgaris | 5 | 58,564 | 40.5 | |||
| Doryteuthis opalescens | 5 | 2136 | 1.5 | |||
| 34 | Mytilus spp. | 70 | 136,793 | 133,560 | 0 | 0.0 |
| Todarodes pacificus | 5 | 21,154 | 15.8 | |||
| Doryteuthis gahi | 5 | 879 | 0.7 | |||
| Dosidicus gigas | 5 | 49,795 | 37.3 | |||
| Illex argentinus | 5 | 7209 | 5.4 | |||
| Octopus vulgaris | 5 | 52,486 | 39.3 | |||
| Doryteuthis opalescens | 5 | 1979 | 1.5 |
| Sample | Food Matrix | Correct Species | Spike Level [mg/kg] 1 | Identified Species | Total Number of Raw Reads | Reads Passing the Pipeline | Reads Assigned Correctly |
|---|---|---|---|---|---|---|---|
| 1 | Spice cracker, baked | Litopenaeus vannamei | 71.8 | Litopenaeus vannamei | 88,680 | 84,810 | 84,802 |
| 2 | Spice cracker, baked | - | 0 | - | 813 | 529 | 522 |
| 3 | Potato powder | Litopenaeus vannamei | 30.8 | Litopenaeus vannamei | 262,994 | 251,942 | 251,806 |
| 4 | Potato powder, maltodextrin | - | 0 | - | 99 | - | - |
| 5 | Procambarus clarkii | 79 | Procambarus clarkii | 36,462 | 30,704 | 30,633 | |
| 6 | Procambarus clarkii | 151 | Procambarus clarkii | 300,251 | 250,255 | 250,189 | |
| 7 | - | 0 | - | 355 | 88 | 53 |
| Sample ID | Food Product | Species Labeled (Amount in %, if available) | Identified Species | Total Number of Raw Reads | Total Number of Reads Passing the Pipeline | Reads Assigned to the Identified Species |
|---|---|---|---|---|---|---|
| 1 | Dried shrimps | Dendrobranchiata | Xiphopenaeus kroyeri | 92,985 | 88,907 | 85,089 |
| Xiphopenaeus riveti | 1638 | |||||
| Xiphopenaeus baueri | 1110 | |||||
| 2 | Squid in squid ink sauce | Dosidicus gigas | Dosidicus gigas | 100,811 | 100,052 | 99,915 |
| 3 | Fried calamari | Calamari | Doryteuthis gahi | 64,820 | 64,140 | 63,931 |
| 4 | Octopus carpaccio | Octopus | Octopus cyanea | 74,303 | 73,567 | 73,347 |
| 5 | Squid in squid ink sauce | Squid | Todarodes pacificus | 111,201 | 109,956 | 108,889 |
| 6 | Seafood mix (bivalves, crustaceans, cephalopods) | Litopenaeus vannamei, Uroteuthis duvaucelii, Mytilus chinensis | Litopenaeus vannamei | 83,012 62,214 | 80,705 60,364 | 80,683 |
| Uroteuthis duvaucelii | 24,760 | |||||
| Todarodes pacificus | 20,679 | |||||
| Uroteuthis spp. | 7601 | |||||
| Uroteuthis edulis | 7170 | |||||
| 7 | Seafood mix (bivalves, crustaceans, cephalopods) | Litopenaeus vannamei, Mytilus chilenis, Mytilus edulis, Illex argentinus | Litopenaeus vannamei | 102,180 | 100,944 | 100,651 |
| Illex argentinus | 50,803 | 50,022 | 49,981 | |||
| 8 | Seafood mix (bivalves, crustaceans, cephalopods) | Dosidicus gigas, Octopus membranaceus, Mytilus galloprovincialis, Litopenaeus vannamei | Dosidicus gigas | 90,584 | 85,748 | 85,731 |
| 9 | Seafood mix (bivalves, crustaceans, cephalopods) | Mytilus chilensis, Paphia undulata, Penaeus vannamei, Loligo duvaucelii | Litopenaeus vannamei | 104,482 | 102,594 | 101,889 |
| Uroteuthis duvaucelii | 35,769 | |||||
| Uroteuthis spp. | 63,647 | 61,670 | 22,312 | |||
| Uroteuthis edulis | 3543 | |||||
| 10 | Frozen shrimp | Penaeus merguiensis, Metapenaeus ensis, Litopenaeus vannamei | Fenneropenaeus merguiensis | 86,435 | 85,727 | 85,035 |
| 11 | Soup cube (prawn soup) | Norway lobster (Nephrops norvegicus) | - | 65,778 | 328 | - |
| 12 | Prawn cracker | Penaeus merguiensis | Litopenaeus vannamei | 98,952 | 98,145 | 93,297 |
| Euphausia superba | 4473 | |||||
| 13 | Pesto from Styrian mountain prawn and basil | Litopenaeus stylirostris (22%) | Litopenaeus vannamei | 105,687 | 104,996 | 104,884 |
| 14 | Nero di Sepia, squid ink | Sepia officinalis | Sepia officinalis | 80,296 | 79,274 | 72,599 |
| Sepia spp. | 3603 | |||||
| Sepia pharaonis | 2050 | |||||
| Sepia hierredda | 812 | |||||
| 15 | Seafood mix (bivalves, crustaceans, cephalopods) | Litopenaeus vannamei (1) or Argentine red shrimp Pleoticus muelleri (2) (A)/ Uroteuthis duvaucelii (1), Dosidicus gigas (2), Sepia pharaonis (3), Sepia aculeata (4) Illex argentinus (5), Nototodarus sloanii (6) (B)/Mytilus chilensis | Litopenaeus vannamei | 94,825 61,573 | 93,555 54,620 | 92,040 |
| Ganjampenaeopsis uncta | 1003 | |||||
| Sepia spp. | 20,170 | |||||
| Sepia pharaonis | 13,875 | |||||
| Uroteuthis duvaucelii | 9975 | |||||
| Todarodes pacificus | 6141 | |||||
| Uroteuthis edulis | 3786 | |||||
| Uroteuthis spp. | 519 | |||||
| Illex argentinus | 134 | |||||
| 16 | Squid rings | Illex argentinus | Illex argentinus | 46,295 | 45,697 | 45,520 |
| 17 | Dried red shrimp | Dendrobranchiata, shrimp | Litopenaeus vannamei | 132,346 | 130,570 | 130,367 |
| 18 | Ground crayfish | Crayfish | Nematopalaemon schmitti | 305,241 | 272,628 | 268,128 |
| Lysmata spp. | 3988 | |||||
| 19 | Linguine with squid ink | Sepia (0.86%) | Sepia officinalis | 45,180 | 43,341 | 36,830 |
| Sepia hierredda | 6387 | |||||
| 20 | Spaghetti with squid ink | Sepia | Sepia ramani | 51,791 | 50,253 | 31,561 |
| Sepia spp. | 9775 | |||||
| Sitophilus oryzae | 5852 | |||||
| Sepia hierredda | 2951 | |||||
| 21 | Lobster butter | Homarus americanus (24%) | Homarus americanus | 80,294 | 78,614 | 78,362 |
| 22 | Crab butter | Cancer pagurus (25%) | Cancer pagurus | 90,220 | 89,093 | 88,854 |
| 23 | Prawn butter | Pandalus borealis (28%) | Pandalus borealis | 94,127 | 88,767 | 88,003 |
| 24 | Crab creme | Cancer pagurus (23%) | Cancer pagurus | 69,045 | 68,241 | 67,971 |
| 25 | Squid in olive oil | Dosidicus gigas (65%) | Dosidicus gigas | 92,687 | 91,984 | 91,904 |
| 26 | Filled squid in olive oil | Loligo spp. | Doryteuthis pealei | 84,890 | 83,381 | 71,779 |
| Uroteuthis duvaucelii | 11,471 | |||||
| 27 | Instant noodle soup, shrimp flavor | Shrimp (0.2%) | Acetes chinensis | 71,563 | 69,380 | 66,777 |
| Acetes japonicus | 1384 | |||||
| 28 | Lobster soup (lobster, Norway lobster, shrimp powder) | Homarus americanus (2.2%), Nephrops norvegicus (1.9%), shrimp powder | Homarus americanus | 95,534 | 93,587 | 90,792 |
| Nephrops norvegicus | 2544 | |||||
| 29 | Instant noodle soup (spicy seafood flavor) * | Shrimp (0.15%) | Litopenaeus vannamei | 73,660 | 72,383 | 55,860 |
| Acetes japonicus | 10,633 | |||||
| Macrobrachium lanchesteri | 2722 | |||||
| Mesopodopsis orientalis | 936 | |||||
| Acetes indicus | 871 | |||||
| Acetes spp. | 541 | |||||
| Procletes levicarinaa | 352 | |||||
| 30 | Acetes chinensis | 65,860 | 63,603 | 60,193 | ||
| Oratosquillina perpensa | 1136 | |||||
| Acetes japonicus | 926 | |||||
| Oratosquilla oratoria | 713 | |||||
| Oratosquillina interruptab | 436 | |||||
| 31 | Octopus in chimichurri sauce | Octopus | Octopus vulgaris | 79,255 | 78,415 | 78,223 |
| 32 | Sugo Pronto al Nero di Sepia | Calamari, squid ink (1.2%) | Dosidicus gigas | 21,026 | 2261 | 2145 |
| 33 | Seafood stew | Calamari, Musk octopus, Sepia | Sepia spp. | 132,776 | 131,143 | 126,017 |
| Amphioctopus aegina | 4866 | |||||
| 34 | Fried gambas in garlic oil | Gambas | Pleoticus muelleri | 71,984 | 71,393 | 71,264 |
| 35 | Prawn crackers | Shrimp (10%) | Acetes indicus | 121,032 | 119,917 | 66,184 |
| Litopenaeus vannamei | 40,284 | |||||
| Acetes spp. | 8665 | |||||
| Acetes japonicus | 4652 | |||||
| 36 | Shrimp chips | Shrimp (20%) | Ganjampenaeopsis uncta | 123,668 | 121,526 | 35,492 |
| Metapenaeus affinis | 32,642 | |||||
| Metapenaeus ensis | 27,061 | |||||
| Penaeidae | 16,429 | |||||
| Alcockpenaeopsis hungerfordii | 5156 | |||||
| Fenneropenaeus merguiensis | 3572 | |||||
| Fenneropenaeus penicillatus | 816 | |||||
| 37 | Canned spider crab meat | Maja squinado | Maja spp. | 87,205 | 85,694 | 83,890 |
| Maja crispata | 1665 | |||||
| 38 | Canned snow crab meat | Chionoecetes apilio | Chionoecetes spp. | 55,109 | 54,561 | 54,101 |
| 39 | Breaded squid rings | Squid | Dosidicus gigas | 85,936 | 85,240 | 85,142 |
| 40 | Frozen king prawns | Litopenaeus vannamei | Litopenaeus vannamei | 53,500 | 50,677 | 50,667 |
| 41 | Frozen shrimps | Shrimps | Litopenaeus vannamei | 53,188 | 49,818 | 49,765 |
| 42 | Frozen shrimps | Litopenaeus vannamei | Litopenaeus vannamei | 59,840 | 56,703 | 56,658 |
| 43 | Frozen black tiger shrimp | Penaeus monodon | Penaeus monodon | 48,142 | 44,297 | 44,185 |
| 44 | Frozen shrimps | Shrimps | Litopenaeus vannamei | 53,843 | 51,196 | 51,183 |
| 45 | Cooked octopus | Octopus vulgaris | Octopus vulgaris | 42,871 | 41,587 | 41,387 |
| 46 | Cooked crayfish tails with dill, frozen | Procambarus clarkii | Procambarus clarkii | 60,948 | 52,506 | 52,232 |
| 47 | Frozen giant squid tentacles | Dosidicus gigas | Dosidicus gigas | 52,098 | 51,026 | 51,008 |
| 48 | Frozen king prawns | Litopenaeus vannamei | Litopenaeus vannamei | 53,936 | 51,322 | 51,316 |
| 49 | Frozen shrimp | Litopenaeus vannamei | Litopenaeus vannamei | 59,845 | 56,949 | 56,920 |
| 50 | Frozen king prawns | Litopenaeus vannamei | Litopenaeus vannamei | 55,553 | 52,670 | 52,619 |
| 51 | Frozen white tiger shrimps | Litopenaeus vannamei | Litopenaeus vannamei | 66,902 | 63,700 | 63,688 |
| 52 | White tiger shrimps | Litopenaeus vannamei | Litopenaeus vannamei | 55,412 | 52,101 | 52,084 |
| 53 | Frozen black tiger shrimp | Penaeus monodon | Litopenaeus vannamei | 30,879 | 28,760 | 28,203 |
| 54 | Cooked squid tentacle slices, frozen | Dosidicus gigas | Dosidicus gigas | 47,944 | 47,160 | 47,115 |
| 55 | Frozen shrimp | Litopenaeus vannamei | Litopenaeus vannamei | 50,563 | 48,711 | 48,699 |
| 56 | Frozen shrimp | Litopenaeus vannamei | Litopenaeus vannamei | 55,110 | 52,296 | 52,243 |
| 57 | Frozen black tiger shrimp | Penaeus monodon | Penaeus monodon | 54,049 | 51,034 | 50,859 |
| 58 | Frozen shrimp | Litopenaeus vannamei | Litopenaeus vannamei | 62,333 | 59,871 | 59,827 |
| 59 | Frozen shrimp | Litopenaeus vannamei | Litopenaeus vannamei | 53,424 | 51,387 | 51,368 |
| 60 | Frozen shrimp | Litopenaeus vannamei | Litopenaeus vannamei | 62,691 | 60,273 | 60,266 |
| 61 | Frozen shrimp | Litopenaeus vannamei | Litopenaeus vannamei | 52,674 | 50,362 | 50,256 |
| 62 | Frozen shrimp | Litopenaeus vannamei | Litopenaeus vannamei | 48,023 | 46,249 | 46,213 |
| 63 | Frozen shrimp | Litopenaeus vannamei | Litopenaeus vannamei | 49,720 | 47,929 | 49,887 |
| 64 | Frozen shrimp | Litopenaeus vannamei | Litopenaeus vannamei | 52,318 | 49,921 | 49,887 |
| 65 | Frozen shrimp | Litopenaeus vannamei | Litopenaeus vannamei | 53,908 | 50,124 | 50,083 |
| 66 | Frozen squid | Uroteuthis duvaucelii | Uroteuthis duvaucelii | 49,152 | 48,187 | 47,703 |
| Uroteuthis edulis | 286 | |||||
| 67 | Frozen shrimp | Crangon crangon | Carcinus maenas | 22,143 | 21,684 | 10,113 |
| Palaemon macrodactylus | 5887 | |||||
| Palaemon serratus | 5479 | |||||
| 68 | Frozen shrimp | Litopenaeus vannamei | Fenneropenaeus merguiensis | 48,844 | 48,022 | 35,530 |
| Fenneropenaeus penicillatus | 12,367 | |||||
| 69 | Canned swimming crab meat | Portunus spp. | Monomia gladiator | 55,299 | 53,149 | 22,645 |
| Portunus sanguinolentus | 18,062 | |||||
| Monomia lucida | 5596 | |||||
| Charybdis natator | 3284 | |||||
| Portunus gracilimanus | 2240 | |||||
| 70 | Canned swimming crab meat | Portunus spp. | Ovalipes punctatus | 51,621 | 46,285 | 35,434 |
| Charybdis natator | 5077 | |||||
| Monomia gladiator | 3161 | |||||
| Portunus sanguinolentus | 2189 | |||||
| 71 | Frozen shrimp | Shrimps | Metapenaeopsis palmensis | 33,992 | 29,241 | 18,626 |
| Alcockpenaeopsis | 4924 | |||||
| hungerfordii | ||||||
| Parapenaeopsis hardwickii | 2761 | |||||
| Solenocera spp. | 2676 | |||||
| 72 | Frozen squid | Uroteuthis duvaucelii | Uroteuthis duvaucelii | 35,720 | 35,181 | 29,156 |
| Uroteuthis spp. | 5896 | |||||
| 73 | Frozen squid | Loligo edulis | Uroteuthis chinensis | 55,942 | 49,906 | 28,721 |
| Uroteuthis duvaucelii | 16,239 | |||||
| Uroteuthis edulis | 4858 | |||||
| 74 | Frozen squid | Uroteuthis edulis | Octopus cyanea | 31,410 | 28,266 | 12,849 |
| Euprymna hyllebergi | 6143 | |||||
| Amphioctopus marginatus | 4439 | |||||
| Amphioctopus aegina | 4310 | |||||
| 75 | Cooked shrimp | Crangon crangon | Litopenaeus vannamei | 68,223 | 66,313 | 55,877 |
| Pandalus borealis | 8939 | |||||
| 76 | Blanched, frozen shrimp | Metapenaeus affinis | Metapenaeus monoceros | 48,500 | 47,730 | 44,337 |
| Metapenaeus affinis | 2768 | |||||
| 77 | Peeled shrimp | Crangon crangon | Loligo vulgaris | 116,997 | 111,662 | 65,977 |
| Liocarcinus marmoreus | 23,297 | |||||
| Liocarcinus holsatus | 22,176 | |||||
| 78 | Peeled shrimp | Crangon crangon | Liocarcinus holsatus | 122,767 | 112,657 | 58,184 |
| Liocarcinus marmoreus | 34,381 | |||||
| Metapenaeus ensis | 19,663 | |||||
| 79 | Frozen squid | Loligo edulis | Uroteuthis chinensis | 104,561 | 78,626 | 50,760 |
| Uroteuthis duvaucelii | 27,780 | |||||
| 80 | Frozen squid | Uroteuthis duvaucelii | Uroteuthis edulis | 102,839 | 97,739 | 89,516 |
| Uroteuthis duvaucelii | 8143 | |||||
| 81 | Frozen squid | Uroteuthis edulis | Uroteuthis chinensis | 80,388 | 64,314 | 55,573 |
| Uroteuthis duvaucelii | 8667 | |||||
| 82 | Cooked shrimp | Crangon crangon | Pandalus montagui | 80,414 | 78,400 | 78,295 |
| 83 | Cooked shrimp | Crangon crangon | Pandalus montagui | 31,892 | 19,995 | 19,772 |
| 84 | Cooked shrimp | Heterocarpus redii | Heterocarpus sp. S6-2 | 60,640 | 57,394 | 57,302 |
| 85 | Fresh shrimp | Macrobrachium rosenbergii | Penaeus monodon | 55,191 | 54,328 | 54,065 |
| 86 | Fresh shrimp | Penaeus occidentalis | Pleoticus muelleri | 61,182 | 60,371 | 60,261 |
| 87 | Squid in oil | Eledone moschata | Amphioctopus aegina | 67,626 | 67,021 | 66,561 |
| 88 | Frozen squid | Loligo edulis | Uroteuthis chinensis | 54,972 | 54,437 | 54,253 |
| 89 | Frozen sepia | Sepiella japonica | Sepiella inermis | 71,160 | 70,577 | 70,373 |
| 90 | Fresh squid | Sepia officinalis | Sepia pharaonis | 63,447 | 62,979 | 62,877 |
| 91 | Frozen squid | Loligo chinensis | Doryteuthis gahi | 53,813 | 53,368 | 53,279 |
| 92 | Fresh shrimp | Litopenaeus stylirostris | Litopenaeus vannamei | 56,813 | 56,033 | 55,947 |
| 93 | Fresh squid | Calamari | Doryteuthis gahi | 60,008 | 59,541 | 59,412 |
| 94 | Frozen crab | Portunus pelagicus | Portunus trituberculatus | 50,738 | 46,460 | 46,072 |
| 95 | Frozen baby shrimp | Metapenaeus spp. | Acetes chinensis | 33,897 | 33,599 | 33,079 |
| 96 | Frozen shrimp | Penaeus monodon | Litopenaeus vannamei | 32,468 | 30,509 | 30,434 |
| 97 | Frozen crab | Thenus orientalis | Thenus unimaculatus | 38,568 | 36,506 | 35,999 |
| 98 | Frozen softshell crab | Scylla serrata | Scylla olivacea | 26,349 | 24,163 | 24,077 |
| 99 | Frozen crayfish | Crayfish | Astacus leptodactylus | 33,698 | 28,395 | 28,242 |
| 100 | Frozen squid | Loligo edulis | Uroteuthis chinensis | 110,023 | 107,066 | 106,953 |
| 101 | Cooked, frozen shrimp | Heterocarpus reedi | Heterocarpus sp. S6-2 | 51,962 | 46,474 | 46,224 |
| 102 | Frozen crab | Scylla serrata | Scylla olivacea | 39,524 | 30,476 | 30,267 |
| 103 | Frozen shrimp | Macrobrachium rosenbergii | Penaeus monodon | 46,195 | 45,246 | 45,245 |
| 104 | Frozen crayfish | Crayfish | Procambarus clarkii | 74,346 | 69,883 | 69,883 |
| 105 | Frozen squid rings | Squid | Illex argentinus | 55,705 | 54,753 | 54,730 |
| 106 | Fresh giant prawn | Aristaeomorpha foliacea | Aristaeopsis spp. | 35,422 | 29,967 | 26,964 |
Disclaimer/Publisher’s Note: The statements, opinions and data contained in all publications are solely those of the individual author(s) and contributor(s) and not of MDPI and/or the editor(s). MDPI and/or the editor(s) disclaim responsibility for any injury to people or property resulting from any ideas, methods, instructions or products referred to in the content. |
© 2025 by the authors. Licensee MDPI, Basel, Switzerland. This article is an open access article distributed under the terms and conditions of the Creative Commons Attribution (CC BY) license (https://creativecommons.org/licenses/by/4.0/).
Share and Cite
Andronache, J.; Cichna-Markl, M.; Dobrovolny, S.; Hochegger, R. Development of a DNA Metabarcoding Method for the Identification of Crustaceans (Malacostraca) and Cephalopods (Coleoidea) in Processed Foods. Foods 2025, 14, 1549. https://doi.org/10.3390/foods14091549
Andronache J, Cichna-Markl M, Dobrovolny S, Hochegger R. Development of a DNA Metabarcoding Method for the Identification of Crustaceans (Malacostraca) and Cephalopods (Coleoidea) in Processed Foods. Foods. 2025; 14(9):1549. https://doi.org/10.3390/foods14091549
Chicago/Turabian StyleAndronache, Julia, Margit Cichna-Markl, Stefanie Dobrovolny, and Rupert Hochegger. 2025. "Development of a DNA Metabarcoding Method for the Identification of Crustaceans (Malacostraca) and Cephalopods (Coleoidea) in Processed Foods" Foods 14, no. 9: 1549. https://doi.org/10.3390/foods14091549
APA StyleAndronache, J., Cichna-Markl, M., Dobrovolny, S., & Hochegger, R. (2025). Development of a DNA Metabarcoding Method for the Identification of Crustaceans (Malacostraca) and Cephalopods (Coleoidea) in Processed Foods. Foods, 14(9), 1549. https://doi.org/10.3390/foods14091549