Article

Simulated Gastrointestinal Digestion and In Vitro Fecal Fermentation of Purified Pyracantha fortuneana (Maxim.) Li Fruit Pectin

1
Key Laboratory of Fermentation Engineering and Biological Pharmacy of Guizhou Province, School of Liquor and Food Engineering, Guizhou University, Guiyang 550025, China
2
Key Laboratory of Plant Resource Conservation and Germplasm Innovation in Mountainous Region (Ministry of Education), Institute of Agro-Bioengineering, College of Life Sciences, Guizhou University, Guiyang 550025, China
*
Author to whom correspondence should be addressed.
Foods 2025, 14(9), 1529; https://doi.org/10.3390/foods14091529
Submission received: 20 March 2025 / Revised: 15 April 2025 / Accepted: 25 April 2025 / Published: 27 April 2025

Abstract

:
Pyracantha fortuneana, an underutilized wild plant, has been found to have a high nutritional value. This study used simulated digestion and fecal fermentation models to investigate the digestive properties of the purified acidic pectin polysaccharide of Pyracantha fortuneana and its impact on the gut microbiota and metabolites. Pyracantha fortuneana polysaccharide (PFP) is mainly composed of rhamnose (Rha), galacturonic acid (GalA), glucose (Glc), galactose (Gal), and arabinose (Ara), with a molecular weight (Mw) of 851.25 kDa. Following simulated digestion, the Mw of PFP remained consistent. The reduced sugar content showed minimal change, suggesting that PFP exhibits resistance to gastrointestinal digestion and can effectively reach the colon. Following fecal fermentation, the molecular weight, monosaccharide, and carbohydrate contents of PFP decreased, while the short-chain fatty acid content increased. This suggests that PFP is susceptible to degradation by microorganisms and can be metabolized into acetic acid and n-butyric acid, contributing to the regulation of intestinal health. Meanwhile, PFP promotes the reproduction of beneficial bacteria such as Bacteroides, Dialister, and Dysgonomonas, inhibits the growth of harmful bacteria like Proteus, and generates metabolites such as thiamine, leonuriside A, oxoadipic acid, S-hydroxymethylglutathione, and isonicotinic acid, which exert beneficial effects on human health. These results indicate that PFP has great potential in regulating the gut microbiota and generating beneficial metabolites to promote intestinal functional health and can be used as a prebiotic to prevent diseases by improving intestinal health.

Graphical Abstract

1. Introduction

Pyracantha fortuneana (Maxim.) Li, a plant species of Maloideae within the Pyracantha Roemer genus, is commonly found in the southern and northwest regions of China and is frequently used for the treatment of indigestion [1]. The fruit of this plant is rich in bioactive substances such as polysaccharides, polyphenols (especially anthocyanins and flavonoids), and dietary fiber, thus making it a valuable natural resource [2]. Among these components, polysaccharides stand out as a key bioactive compound, exhibiting various beneficial effects, including enhanced immune function and antioxidant properties [3]. Positive correlations were observed between the administration of P. fortuneana polysaccharide and the enhancement of immune function and antioxidant activity in mice [4]. Furthermore, polysaccharides extracted from P. fortuneana exhibited significant cytotoxicity in Skov3 cells by activating intracellular reactive oxygen species (ROS) production, resulting in mitochondrial disruption and DNA damage, ultimately leading to apoptosis in ovarian cancer cells [5]. A previous study employed six methods to extract and prepare polysaccharides from P. fortuneana, thereby elucidating their physicochemical properties, structural characteristics, and biological activities [6]. The polysaccharide extracted from P. fortuneana using acid extraction is identified as a plant pectin rich in galacturonic acid (GalA), which has sparked our interest.
Pectin is a complex anionic polysaccharide polymer rich in glucuronic acid, a biomolecule composed of GalA monosaccharides and some neutral monosaccharides by covalent cross-linking. Pectin can be classified into three main structural types based on differences in monosaccharide composition and glucoside bond: Homogalacturonan (HG), Rhamnogalacturonan I (RG-I), and Rhamnogalacturonan II (RG-II) [7]. Furthermore, two minor structural types, Xylogalacturonan (XGA) and Apiogalacturonan (AGA), are present in small quantities in certain fruits and lichenoid pectin [8]. Their specific structural domains are shown in Figure 1A. Currently, it has been revealed that the primary structure, degree of esterification, and molecular weight (Mw) of pectin significantly affect the nutritional function of the gut microbiota [9,10]. Pectin polysaccharides extracted from okra are rich in RG-I structures, whose content is positively correlated with the growth of anti-inflammatory microorganisms and the production of short-chain fatty acids (SCFAs) [11]. Meanwhile, pectin polysaccharides from Lycium barbarum and raspberry notably improved the intestinal ecological imbalance in mice suffering from inflammatory bowel disease (IBD) by enhancing immune organ parameters, repairing colon damage, reducing levels of TNF-α, IL-17, and IL-1β, alleviating oxidative stress, and boosting the overall production of SCFAs [12]. However, there is currently a lack of research reports on the prebiotic properties of pectic polysaccharides in P. fortuneana, such as their effects on the composition of the gut microbiota and SCFAs. This reveals that the structure of can be linked to alteration of the gut microbiota, which will shed more light on the prebiotic effects of the Pyracantha fortuneana polysaccharide (PFP).
This study examines the in vitro digestion and fermentation characteristics of the purified pectin polysaccharide PFP. The anti-digestion properties of PFP and its ability to reach the distal colon were evaluated using an in vitro simulated digestion model. Furthermore, the interaction between the pectin polysaccharide and intestinal health and its prebiotic potential was investigated using an in vitro fecal fermentation model. Assessment of intestinal fermentability, based on the production of SCFAs and alterations in the gut microbiota and metabolites, aimed at identifying beneficial flora regulated by the structural characteristics of PFP pectin for the study of functional foods.

2. Materials and Methods

2.1. Materials

In October 2022, P. fortuneana fruits were gathered from the local region (Weining County, Guizhou Province, China). The collected P. fortuneana fruits underwent drying and grinding and were subsequently passed through a 60-mesh sieve for preservation. Monosaccharide standards, including mannose (Man), ribose (Rib), rhamnose (Rha), glucuronic acid (GlcA), galacturonic acid (GalA), glucose (Glc), galactose (Gal), xylose (Xyl), arabinose (Ara), and fucose (Fuc) (a total of 10 types), were purchased from Beijing Solarbio Science & Technology Co., Ltd. (Beijing, China). The following enzymes from porcine sources, pepsin (250 U/mg) (EC: 232-628-3), trypsin (250 U/mg) (EC: 232-650-8), lipase (60 U/mg) (EC: 232-619-9), pancreatic enzymes (EC: 232-468-9), and bile, were also purchased from Beijing Solarbio Science & Technology Co., Ltd. (Beijing, China). The EC number refers to the Enzyme Commission nomenclature number. Dextran molecular weight standards ranging from 1 to 670 kDa were purchased from Sigma (St. Louis, MO, USA). All other chemicals and solvents used were of reagent grade and were purchased from The Sinopharm Group Co., Ltd. (Beijing, China).

2.2. Extraction and Purification of PFP

The extraction of pectin polysaccharides from P. fortuneana was carried out according to a previous study [6]. In other words, we extracted the powder of P. fortuneana using HCl (0.05 mol/L) for 2 h at 90 °C with a solid-to-liquid ratio of 1:30 (w/w). The supernatant was taken by centrifugation, and the extract was precipitated by adding anhydrous ethanol to a final ethanol concentration of 80% (v/v). The crude polysaccharide Ac-PFP of P. fortuneana was prepared by decolorization using an AB-8 macroporous adsorbent resin, deproteinization by the Sevag method after enzymolysis, and the extract was dialyzed and lyophilized in a 3500 kDa dialysis bag [13].
The crude Ac-PFP was dissolved in ultrapure water at a concentration of 20 mg/mL and then filtered through a 0.22 μm aqueous filter membrane. The filtrate was loaded onto a DEAE Sepharose Fast Flow anion exchange chromatography column (GE Healthcare, Little Chalfont, Buckinghamshire, UK) (24 × 400 mm) and eluted with ultrapure water and 0.1 M NaCl, 0.3 M NaCl, 0.5 M NaCl, and 2.0 M NaCl solutions at a flow rate of 4.8 mL/min using a peristaltic pump.
The 0.3 M NaCl elution fraction Ac-PFP-2 was collected according to the elution curve of Figure S2. Subsequently, the samples were concentrated and ultrafiltered using a Labscale TFF system (XX42LSS12, Millipore, Burlington, MA, USA) with a Pall 100 kDa ultrafiltration membrane package, and the fractions of different Mw were separated using a 0.3 M NaCl eluent. Monitoring was performed online using a high-performance gel permeation chromatography (HPGPC) system (LC-20AT, Shimadzu, Kyoto, Japan) until a single normally distributed peak appeared. The samples were desalted and collected. Collected samples were lyophilized to finally obtain a single component of purified PFP.

2.3. Physicochemical Characterization of PFP

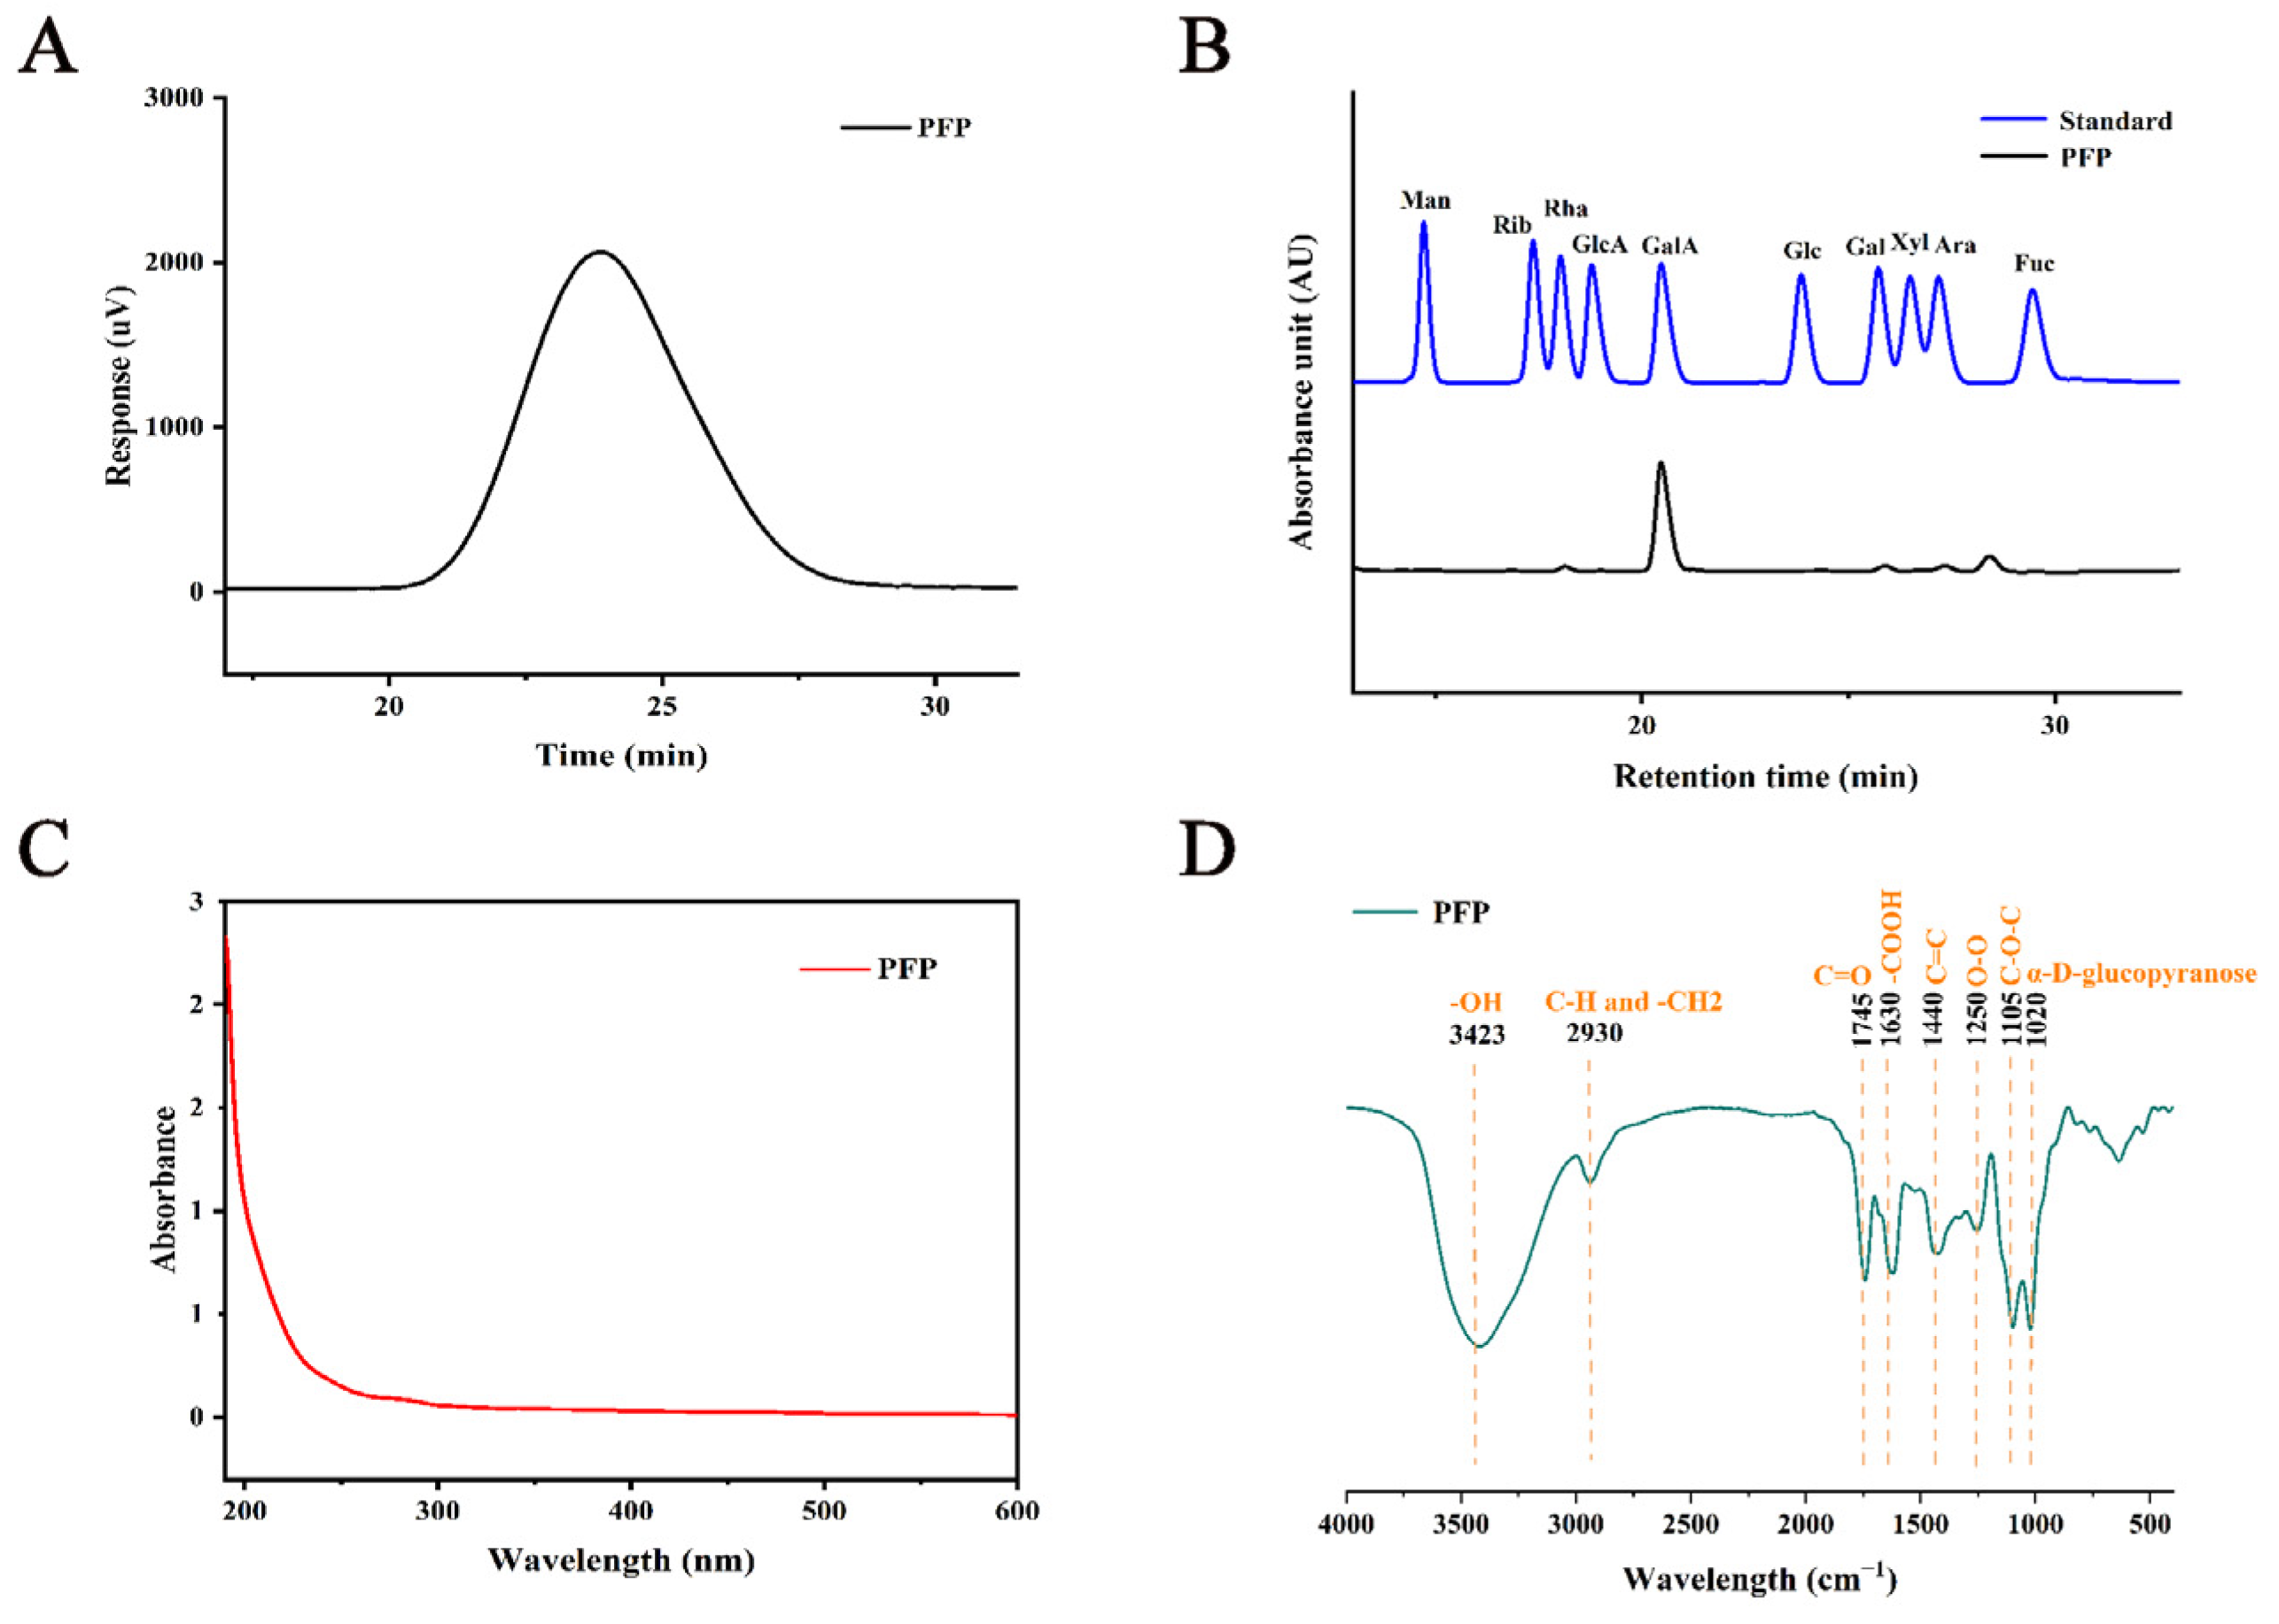
2.3.1. Composition of PFP

The total soluble sugar content of PFP was quantified using the phenol–sulfuric acid method and a mixed standard consisting of 80% GalA and 20% Glc [14,15]. The M-hydroxybiphenyl method was employed to measure the uronic acid content in PFP, using GalA as the standard material [16].

2.3.2. Fourier Transform Infrared (FT-IR) and Ultraviolet Spectroscopy (UV) Analysis of PFP

The UV-1900i (Shimadzu Corporation, Kyoto, Japan), ranging from 190 to 600 nm, was used to detect the presence of proteins and nucleic acids. FT-IR spectroscopy (Nexus IS10 FTIR, Thermo Fisher Scientific, Waltham, MA, USA) was performed by mixing 1 mg of PFP with 100 mg of KBr and pressing it into thin slices, followed by transmission scanning in the range of 4000–400 cm−1.

2.3.3. Determination of PFP Mw

The Mw was determined by an HPGPC system, which consisted of a high-performance liquid chromatograph (LC-20AT, Shimadzu, Kyoto, Japan) and two size-exclusion chromatography columns (Ultrahydrogel 2000 and Ultrahydrogel 250) (7.8 mm × 300 mm) (Waters Co., Milford, MA, USA) connected in series. To summarize, 3 mg of the sample were dissolved in 1 mL of the mobile phase, filtered through a 0.22 μm aqueous membrane, and then placed into a sample vial. A mobile phase of 0.2 M NaCl solution consisting of 0.03% NaN3 was used with a column temperature of 40 °C, an injection volume of 20 μL, a flow rate of 0.6 mL/min, and data collection for 50 min. LabSolutions v5.0 software was used for data acquisition and processing. The measured Mw was calibrated using a dextran molecular weight standard curve (1, 5, 12, 25, 50, 410, and 670 kDa), and the standard curve equation was y = −3.6168x + 45.328, R2 = 0.9915.

2.3.4. Composition of Monosaccharide in PFP

The monosaccharide composition of PFP was prepared by pre-column derivatization with 1-phenyl-3-methyl-5-pyrazolinone (PMP) and identified by high-performance liquid chromatography (HPLC) [17]. The Waters 2695 HPLC system (Waters, Milford, MA, USA) was equipped with a PDA 2996 detector (Waters, Milford, MA, USA) and a Zorbax Eclipse XDB-C18 column (4.6 mm × 250 mm, 5 μm, Agilent, Santa Clara, CA, USA). Briefly, 3 mg of PFP were first mixed well with 1 mL of 4 M trifluoroacetic acid sealed in an ampoule and placed at 110 °C for 6 h of continuous hydrolysis. After acid hydrolysis, 0.2 mL of methanol were added to the hydrolysis product and dried with nitrogen, which was repeated three times to remove residual trifluoroacetic acid and dissolved in ultrapure water. Second, 450 μL of polysaccharide hydrolyzed samples or mixed standards were mixed with equal amounts of 0.3 M NaOH and 0.5 M PMP solution. This was bathed in water at 70 °C for 100 min, and the pH was adjusted to neutral with 0.3 M HCl. An equivalent volume of trichloromethane was added to remove residual PMP, after which the supernatant was filtered through a 0.22 μm membrane and stored for later use. Finally, the derivatized samples were studied by HPLC. The mobile phase was a mixture of phosphate buffer solution (0.05 M, pH = 6.8) and acetonitrile (15%, v/v). The flow rate and UV detection wavelength of the diode array detector were set at 1.0 mL/min and 250 nm, respectively, and the elution time was 45 min. Preparation of the mixed standard solution of monosaccharides involved dissolving each of the 10 monosaccharide standards in distilled water and preparing a mixed standard solution, in which the concentration of each monosaccharide was 2 mmol/L.

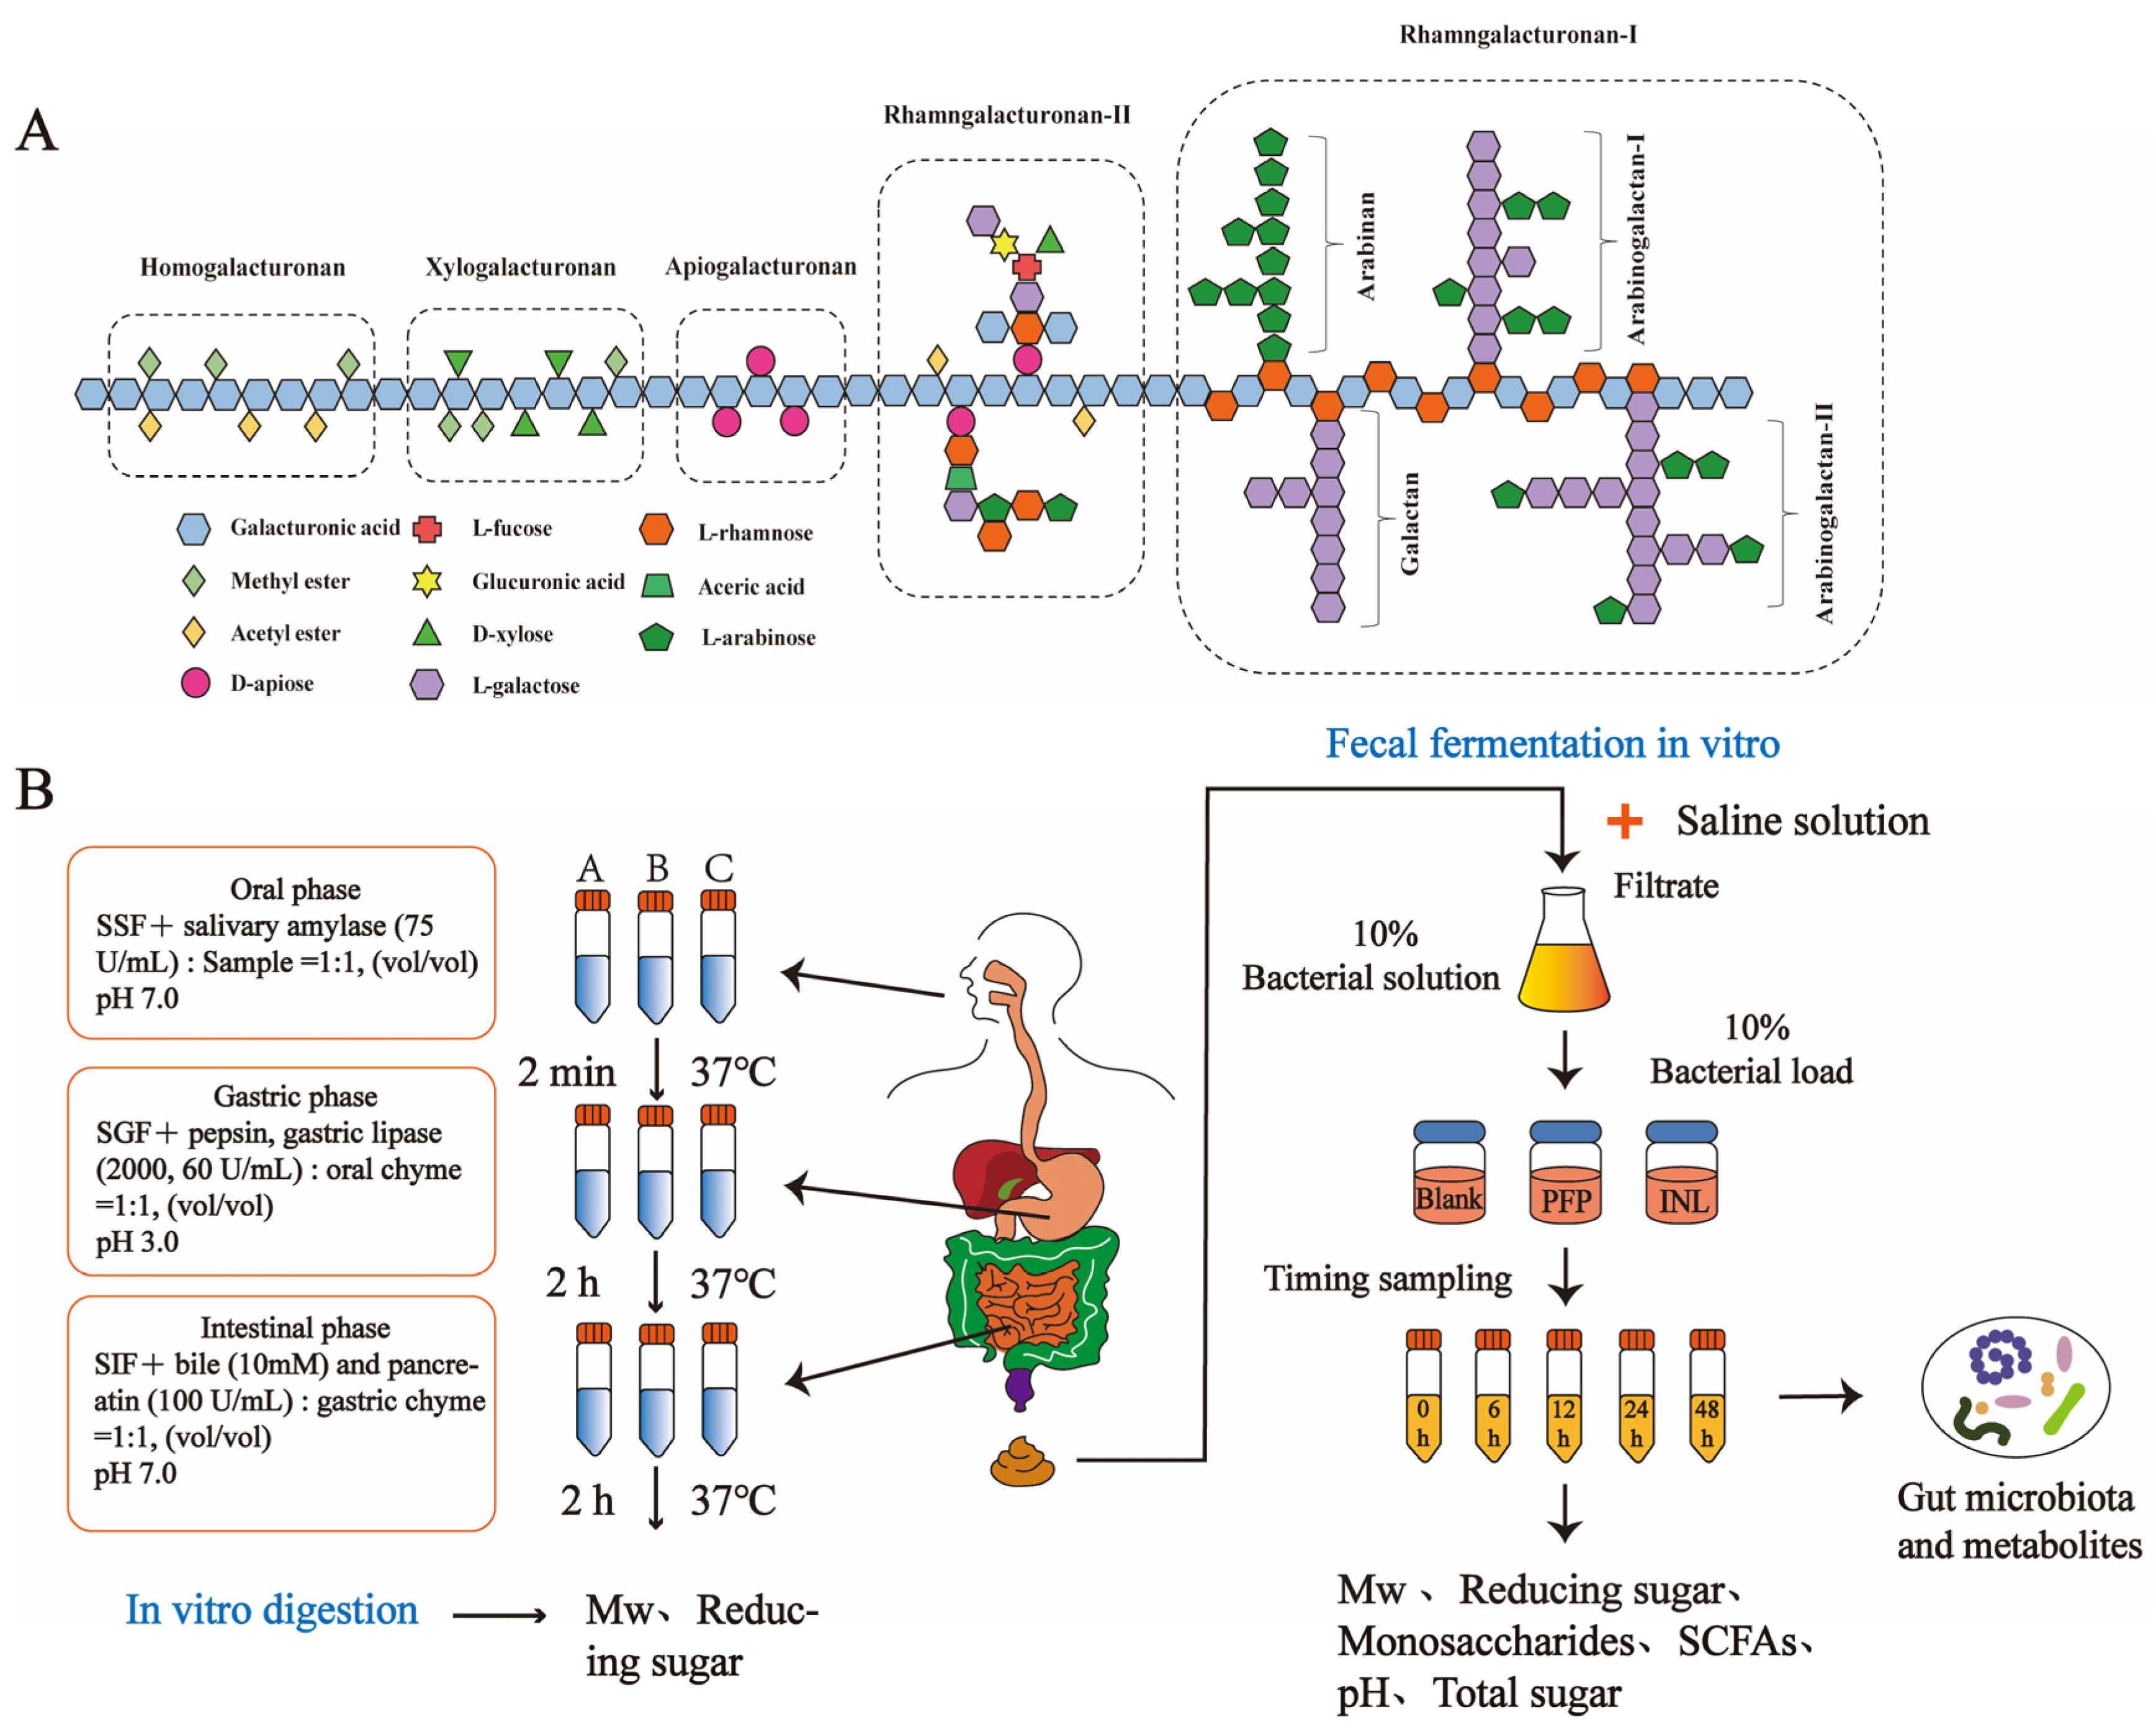
2.4. In Vitro Digestion of PFP

Based on the INFOGEST protocol, the in vitro digestion characteristics of PFP were investigated, and a 1.25 × electrolyte stock solution was prepared [18]. In vitro, salivary simulated digestive fluid (SSF), gastric digestive fluid (SGF), and small intestinal digestive fluid (SIF) consisted of a four-fold volume of 1.25 × electrolyte stock solution mixed with a one-fold volume of distilled water [18,19,20]. The in vitro digestion scheme is shown in Figure 1B.

2.4.1. In Vitro Saliva Digestion

Initially, SSF was prepared by adjusting the pH to 7.0 using 1 mol/L NaOH, followed by the addition of a suitable quantity of α-amylase to reach a final enzyme activity of 75 U/mL. Taking 10 mL of SSF mixed with 10 mL of PFP polysaccharide solution (5 mg/mL), this was set as experimental group A; taking 10 mL of PFP mixed with 10 mL of ultrapure water, this was set as experimental group B; and taking 10 mL of SSF mixed with 10 mL of ultrapure water, this was set as experimental group C. All experimental groups were incubated in a water bath set to 37 °C for the digestion process. At both 0 min and 2 min, 5 mL of the digest were extracted and quickly transferred to a boiling water bath at 100 °C for 10 min to inhibit enzymatic activity, followed by centrifugation at 8000 rpm for an additional 10 min. Each set of experiments was repeated three times and the collected samples were stored in a −20 °C refrigerator for backup.

2.4.2. In Vitro Gastric Digestion

We prepared SGF using previously formulated 1.25 × electrolyte stock solutions. The pH was adjusted to 3.0 with 1 mol/L of HCl, and appropriate amounts of lipase and pepsin were taken to achieve final enzyme activities of 60 U/mL and 2000 U/mL. The polysaccharide that underwent saliva digestion had an adjusted pH of 3.0 and was mixed with SGF at 1:1, and 3 experimental groups were set up: Group A (10 mL saliva digest + 10 mL SGF); Group B (10 mL ultrapure water + 10 mL saliva digest); and Group C (10 mL ultrapure water + 10 mL SGF). All experimental groups were incubated in a water bath set to 37 °C for the digestion process. At 0 h, 1 h, and 2 h, 5 mL of digested solution were removed and immediately placed in a boiling water bath at 100 °C for 10 min and centrifuged.

2.4.3. In Vitro Small Intestinal Digestion

Similarly, SIF was created by mixing fresh bile with 50 g of a 7% pancreatic enzyme solution (w/v) and trypsin to reach a final enzyme activity of 100 U/mL. The pH was adjusted to 7.0 using a 0.1 mol/L NaOH solution. The gastric digest from the previous phase was adjusted to pH 7.0 and thoroughly mixed with SIF in a 1:1 ratio to establish three experimental groups: Group A (10 mL gastric fluid digestive solution + 10 mL SIF); Group B (10 mL ultrapure water + 10 mL gastric fluid digestive solution); and Group C (10 mL ultrapure water + 10 mL SIF). Digestion was carried out in a 37 °C water bath. At 0 h, 1 h, and 2 h, 5 mL of the digest were withdrawn and immediately placed in a boiling water bath at 100 °C for 10 min and then centrifuged.

2.5. Determination of Physicochemical Properties of PFP During Digestion In Vitro

A total of 2 mL of the PFP digestive fluid at various stages of digestion were sampled and filtered through a 0.22 μm membrane. The Mw of each digestion product was determined, as previously described. The determination of reducing sugars was carried out using the 3,5-dinitrosalicylic acid method [21].

2.6. In Vitro Simulated Fecal Fermentation

In vitro fecal fermentation methods were measured according to the reported method with minor modifications [22,23,24]. The in vitro fecal fermentation scheme is shown in Figure 1B.
To begin with, a basic nutrient medium was prepared. A total of 1.0 g of yeast paste, 1.0 g of peptone, 0.25 g of bile salt, 0.25 g of L-cysteine, 0.05 g of NaCl, 0.02 g of K2HPO4, 0.005 g of CaCl2-6H2O, 0.005 g of MgSO4-7H2O, 1.0 g of NaHCO3, 0.01 g hemoglobin, 0.05 mg of resin cyanine, 1.0 mL of Tween 80, and 5 μL of vitamin K were added to 500 mL of ultrapure water. The pH was adjusted to 7.0 with 0.1 M HCl and sterilized at 121 °C for 15 min.
A specific volume of fresh feces was obtained from six healthy volunteers during the same timeframe, consisting of three males and three females aged between 20 and 30 years. None had consumed antibiotics or probiotics in the past three months. Equal portions of mixed feces were diluted with saline (NaCl at 9.0 g/L) to achieve a pH of 7.0, resulting in a fecal suspension at a concentration of 10% (w/v). The fecal suspension was filtered using sterile gauze and the filtrate was taken as human fecal microbial inoculum. Three experimental groups were set up and the mixed microbial suspensions were inoculated into the culture medium of each group separately. The Blank group consisted of 1 mL of bacterial suspension combined with 9 mL of medium. The inulin group (INL) included 1 mL of bacterial suspension mixed with 9 mL of medium containing 100 mg of inulin. The PFP group was composed of 1 mL of bacterial suspension and 9 mL of medium that contained 100 mg of PFP. All operations were carried out under nitrogen protection and the inoculated medium was placed in an anaerobic incubator. The fermentation broth of each group was removed at 0, 6, 12, 24, and 48 h of fermentation at 37 °C for testing and analysis, and each group of experiments was repeated three times. After stopping fermentation, centrifugation was performed at 5000 rpm for 10 min at 4 °C. The resulting precipitate was stored at −80 °C for microbiological analysis, while the supernatant was utilized to assess other parameters.

2.7. Determination of Physical and Chemical Properties of PFP During In Vitro Fermentation

2.7.1. Changes in Basic Composition, Mw, and Monosaccharides

The total soluble sugar, reducing sugar, uronic acid, and Mw of each group of fermentation broths were determined according to the previous method. The Mw and free monosaccharide content were measured.

2.7.2. Determination of pH and SCFAs

The pH of the fermentation products at different times in each group was measured using a pH meter. According to the previously reported method, SCFAs in the fermentation culture were determined by gas chromatography [22,25]. Chromatographic analysis was performed using a gas chromatograph (7820A Agilent, Santa Clara, CA, USA) fitted with an Agilent DB-FFAP column (30 m, 0.25 mm, 0.25 μm) (Agilent Technologies, Santa Clara, CA, USA). The GC analysis conditions were as follows: flame ionization detector, carrier gas N2 flow rate of 30.0 mL/min, carrier gas air flow rate of 270 mL/min, and carrier gas H2 flow rate of 40 mL/min. The detector temperature was 240 °C and the inlet temperature was 230 °C. The warming program was 90 °C (0.5 min) to 130 °C (5 °C/min), and finally held at 220 °C for 5 min at a rate of 15 °C/min. The injection volume of the sample was 1 µL, the split ratio was 1:10, and the time for each determination was 20 min. All results are expressed in mmol/L.

2.7.3. Analysis of Gut Microbiota

Fermentation broth from the Blank, INL, and PFP groups fermented for 48 h was taken and centrifuged at 10,000 rpm for 10 min to collect the flora, and DNA was extracted using a DNA extraction kit (FastDNA® Spin Kit for Soil, MP Biomedicals, Santa Ana, CA, USA). The microbiological composition of the extracted samples was analyzed by Shanghai Majorbio Bio-Pharm Technology Co., Ltd. (Shanghai, China), and the 16s bacterial rRNA genes in the V3–V4 region were amplified by PCR using universal primers and sequenced by Illumina Miseq PE300 using high-throughput sequencing. Data analysis was conducted on the I-Sanger cloud platform https://cloud.majorbio.com (accessed on 6 January 2025). The metrics analyzed include the operational taxonomic units (OTU), statistical analysis and annotation, species abundance statistics and community composition analysis, Alpha and Beta Diversity Index analysis, and Principal Component Analysis (PCoA) among the samples.

2.7.4. Metabolomics Analysis

Shanghai Majorbio Bio-Pharm Technology Co., Ltd. (Shanghai, China) conducted the determination of metabolites in the 48-hour fermentation broth. Detailed information regarding the specific methodology can be found in the referenced report [26]. Liquid chromatography–mass spectrometry (LC-MS) analysis was performed using an ExionLC AD liquid chromatography system (AB SCIEX, USA) coupled with a UPLC HSS T3 column (100 mm × 2.1 mm i.d., 1.8 µm) and a triple quadrupole mass spectrometer (Triple TOF 6600, AB SCIEX, Redwood City, CA, USA). The instrument platform for this LC-MS analysis was provided by Shanghai Majorbio Bio-Pharm Technology Co., Ltd. (Shanghai, China). Briefly, 200 µL of sample were taken and 800 µL of extraction solution (methanol/acetonitrile = 1:1 (v/v)) containing four internal standards (0.02 mg/mL L-2-chlorophenylalanine) were added. After vortexing, ultrasonic extraction was carried out at 5 °C with a frequency of 40 KHz for 30 min. The sample was then placed at −20 °C for 30 min to deproteinize, and centrifuged at 12,000 rpm at 4 °C for 15 min. The sample was dried under nitrogen. After re-dissolving with 120 μL of 50% acetonitrile, the above operation was repeated. The supernatant was transferred to a sample vial and analyzed by LC-MS. The chromatographic conditions were as follows: the chromatographic column was ACQUITY UPLC HSS T3 (100 mm × 2.1 mm, 1.8 µm; Waters, Milford, MA, USA); mobile phase A was 95% water + 5% acetonitrile (containing 0.1% formic acid), mobile phase B was 47.5% acetonitrile + 47.5% isopropanol + 5% water (containing 0.1% formic acid); the injection volume was 3 μL; and the column temperature was 40 °C. The mass spectrometry conditions were as follows: Samples were ionized by electrospray ionization. Mass spectra were collected in both positive and negative ion scanning modes, with a mass scanning range of 50–1200 m/z. Raw data were processed using the Progenesis QI v3.0 software (Waters Corporation, Milford, MA, USA) to generate a data matrix. Subsequently, metabolites were identified by referring to the HMDB database (Human Metabolome Database http://www.hmdb.ca/ (accessed on 15 January 2025)) and the Metlin database (METLIN|Scripps Research https://metlin.scripps.edu/ (accessed on 15 January 2025)). Based on the KEGG database (http://www.genome.jp/kegg/ (accessed on 15 January 2025)), differential metabolites between the two groups were selected for metabolic pathway analysis.

2.8. Statistical Analysis

The experimental data were expressed as mean ± standard deviation (SD) and all the experiments were repeated three times. Statistical analyses were performed using IBM SPSS Statistics 27. Differences between means were assessed using one-way analysis of variance (ANOVA) and Tukey’s test to determine the statistical significance of the data. p < 0.05 was defined as statistically significant.

3. Results and Discussion

3.1. Physical and Chemical Properties of PFP

The elution curves for PFP isolation and purification are shown in Figure S1. The HPGPC graph of the purified pectin showed a symmetric normal single peak, indicating that PFP is a pectin of uniform Mw and high purity (Figure 2A). Based on the standard Mw curve of the dextran standard, the average Mw of PFP was calculated to be 851.25 kDa, which is a typical biological macromolecule. Secondly, the high-performance liquid chromatography (HPLC) results showed that the monosaccharide composition of PFP mainly included galacturonic acid (GalA, 82.53%), arabinose (Ara, 7.00%), galactose (Gal, 4.89%), rhamnose (Rha, 3.59%), and glucose (Glc, 1.99%) (Figure 2B). These results differ from previous findings and may be related to the separation and purification process [6].
The research findings presented in Table 1 demonstrated that the total soluble sugar content of PFP was 95.69 ± 1.9% and the uronic acid content was 70.04 ± 1.75%. These results indicated that PFP was a pure acidic pectin polysaccharide with a high uronic acid content, aligning with the significant GalA content in its monosaccharide composition. The results of the UV spectral analysis, depicted in Figure 2C, did not reveal a peak at 280 nm, suggesting the absence of proteins in PFP. Furthermore, the FT-IR spectra (Figure 2D) showed the functional groups present in PFP, with the peak at 3423 cm−1 corresponding to the stretching vibration of -OH and the weak absorption peak at 2930 cm−1 indicating the asymmetric stretching vibrations of C-H and -CH2 [27]. The peak at 1745 cm−1 was the main characteristic absorption of the ester group, which was a C=O stretch. The strong absorption peak at 1630 cm−1 suggested that GalA was present in PFP, and the characteristic peak here belonged to the carboxyl-related products of polysaccharides containing -COOH. The peak at 1440 cm−1 belonged to the vibration of the C=C backbone, and the weak absorption peak at 1250 cm−1 came from the bending of the oxygen bridge (O-O), indicating the presence of uronic acid in PFP [28]. Furthermore, the vibrational stretch at 1105 cm−1 was associated with the C-O-C group, which suggested the presence of compounds related to the pyran ring in the polysaccharide, and the characteristic peak at 1020 cm−1 indicated the presence of the α-D-glucopyranose structure in PFP [29].

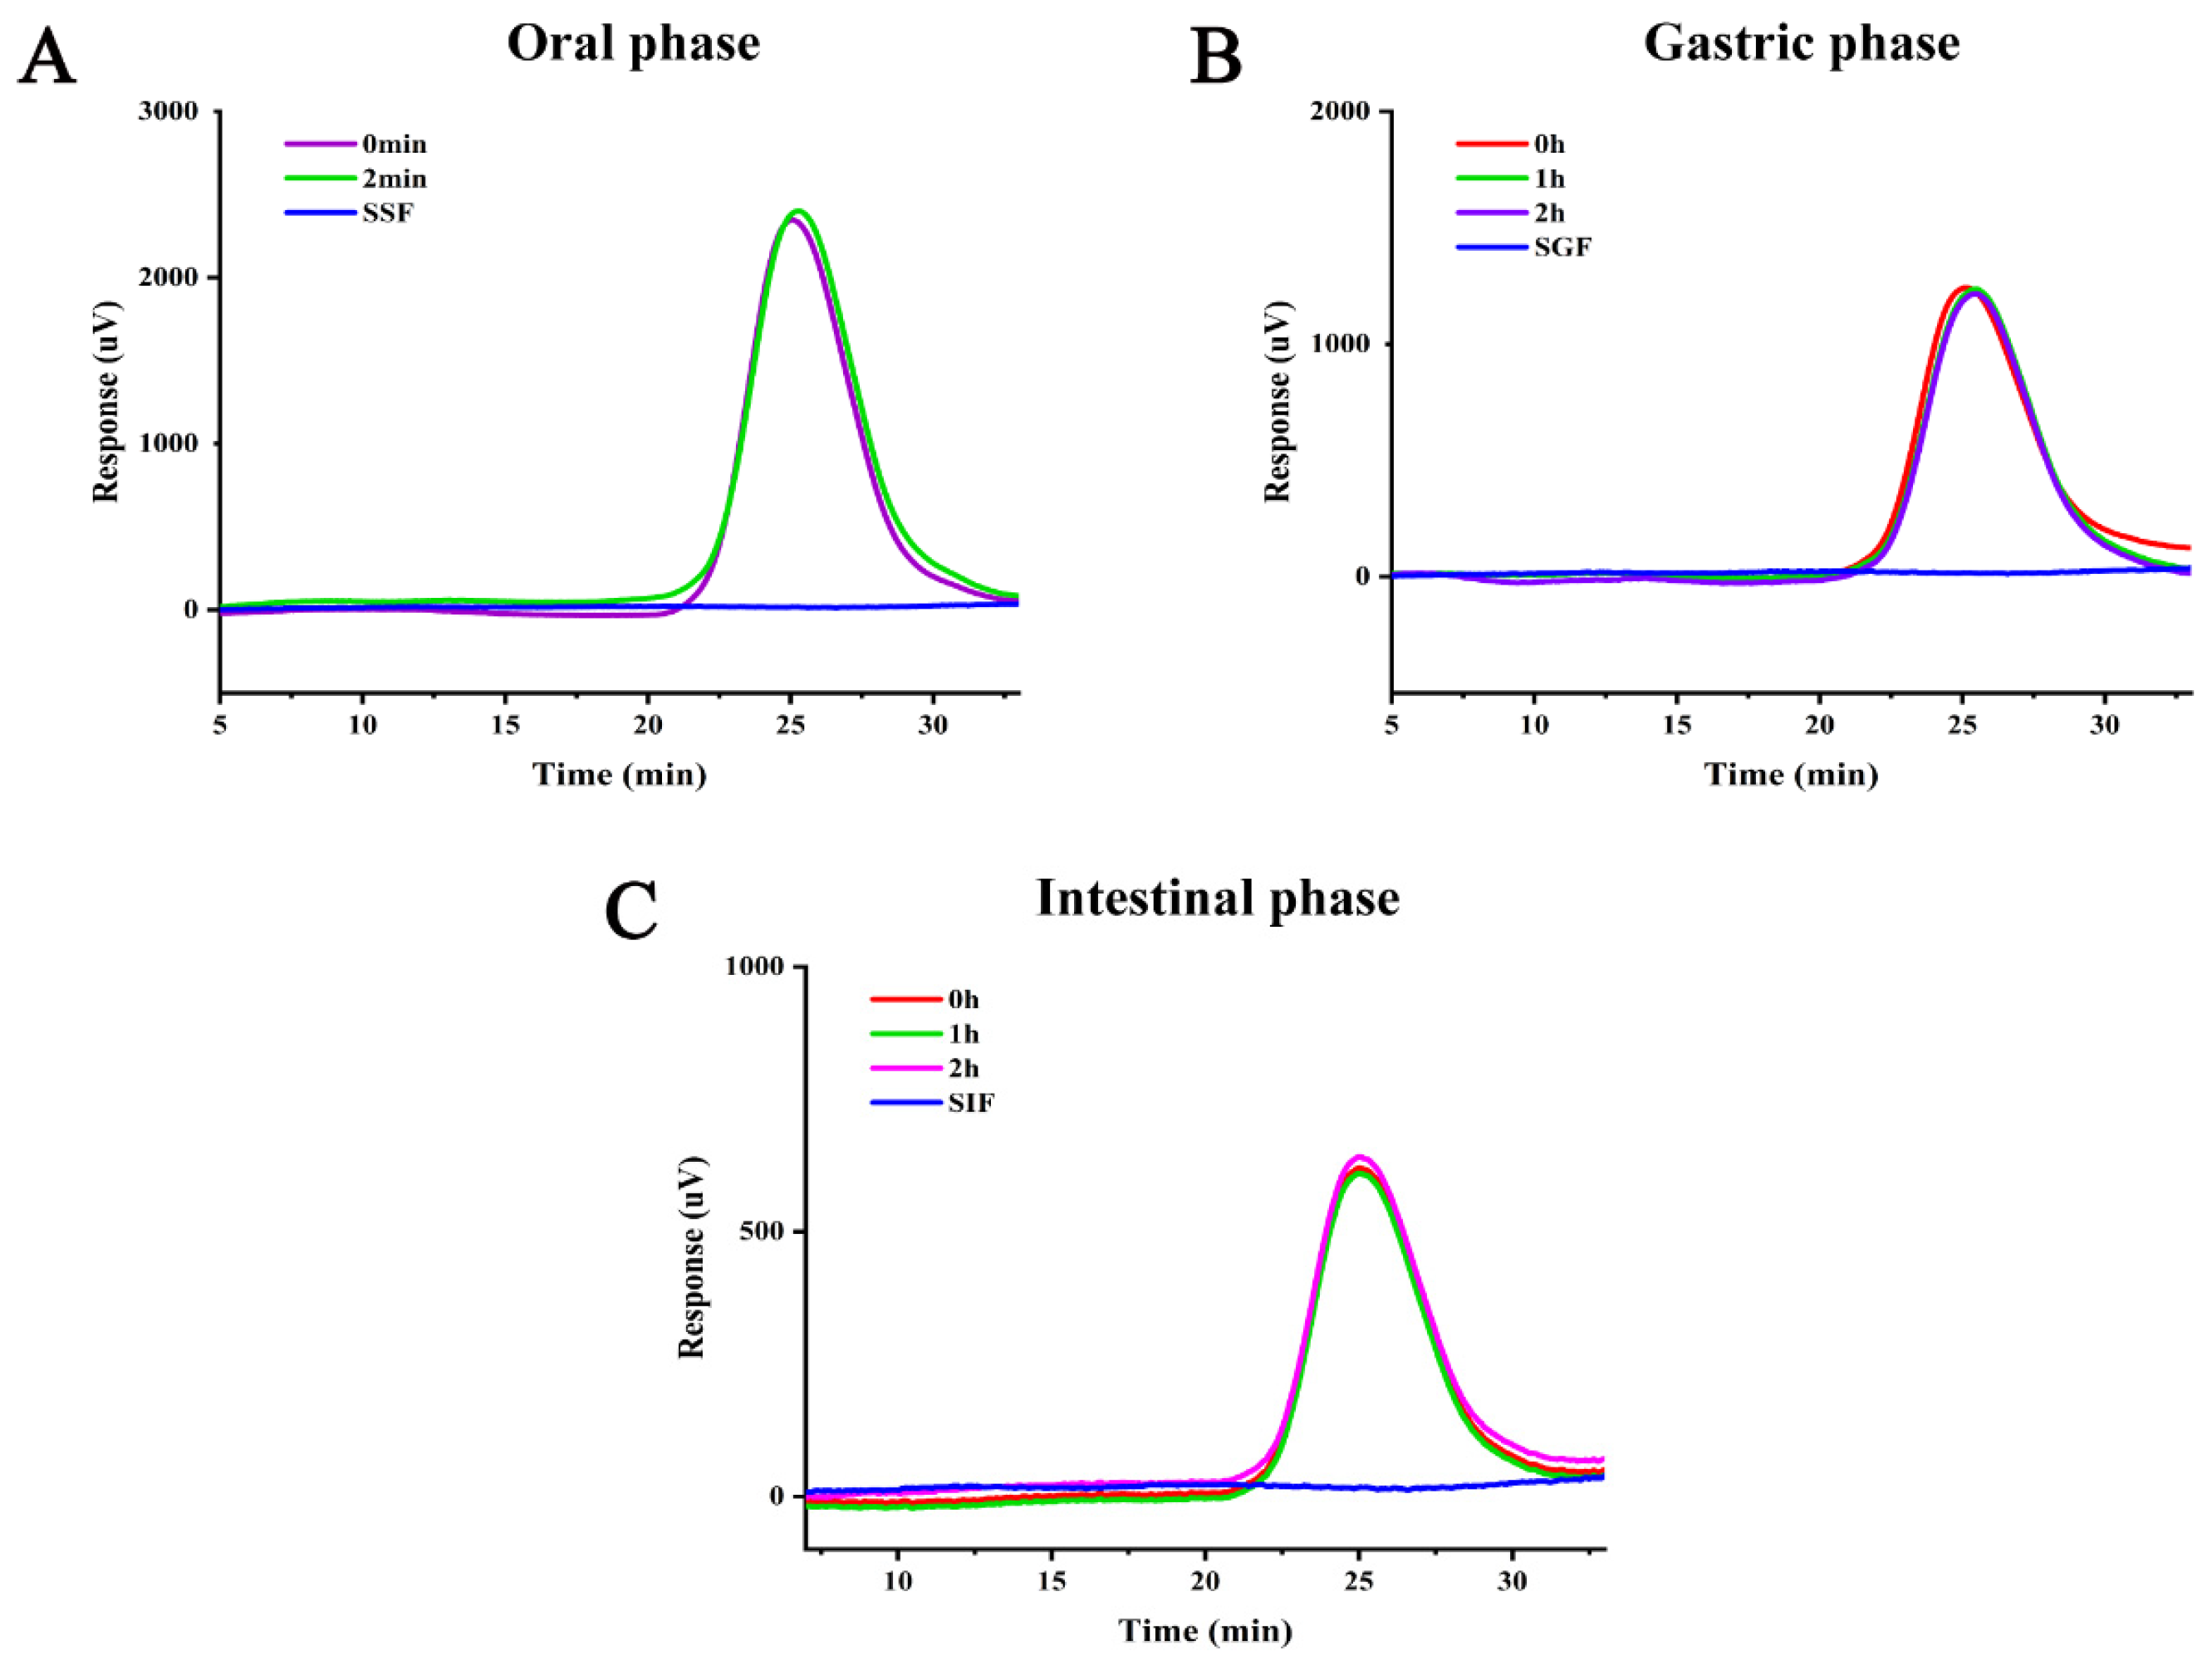
3.2. Simulated Digestive Characteristics of PFP In Vitro

3.2.1. Variations in Reducing Sugars

Like other dietary fibers, pectin travels to the distal colon, fermented by the gut microbiota, resulting in positive impacts on the human body [30]. Nonetheless, the specific luminal conditions and pH levels in the upper gastrointestinal tract may influence these heteropolysaccharides prior to their arrival in the colon, potentially resulting in chemical and physicochemical alterations that impact both the rate and degree of colonic fermentation [31]. As a result, changes in reducing sugars serve as a key indicator for assessing the digestive characteristics of PFP. The changes in reducing sugar content of PFP during simulated digestion in vitro are shown in Table 2. There were no significant changes in the simulated oral digestion stage, a slight increase in reducing sugar content in the gastric stage, and no significant changes in reducing sugar in the small intestine stage, similar to the results of Ye et al. [24]. Another study has shown that pectin is a non-digestible carbohydrate and its degradation in the human gastrointestinal tract is only mediated by a small community of microorganisms in the human gut [32]. This demonstrates that PFP is relatively stable in the GI tract and is not easily degraded.

3.2.2. Mw Analysis

The digestion of polysaccharides in the gastrointestinal tract has been shown to usually lead to a partial decrease in Mw, and the biological activity of polysaccharides is closely linked to their Mw and functional groups [33]. Therefore, the change in Mw is also an important indicator for evaluating the digestive properties of PFP. The changes in Mw of PFP during gastrointestinal digestion are shown in Figure 3A–C. As can be seen from Figure 3A, the two PFP curves after simulated saliva digestion at 0 and 2 min almost overlapped. Thus, PFP is invariant during the oral phase. Figure 3B shows that the results after digestion with simulated gastric fluid for 0–2 h were like those of simulated saliva. Figure 3C shows that the retention time of PFP did not change during digestion in the small intestine, suggesting that PFP remained stable during digestion in the salivary gastrointestinal tract. Similar studies on pectins such as peach gum polysaccharides and okra polysaccharides have previously been reported [23,34]. In summary, PFP as a pectin is resistant to gastrointestinal digestion and can arrive in the colon intact to participate in fermentation.

3.3. Characteristics of In Vitro Fermentation of PFP

3.3.1. Change of Mw

Figure 4A shows the HPGPC chromatogram of PFP in vitro with different fermentation times. As shown in Figure 4A, the retention time of PFP was delayed, and there was a significant reduction in peak area as the fermentation time increased. This suggests that the Mw of PFP decreased, and its abundance diminished, making it more susceptible to degradation by the gut microbiota. Especially at 6 h of fermentation, the characteristic peak of PFP significantly shifted to the right to 27 min, indicating that during this period, the intestinal microbiota could rapidly degrade PFP, breaking it down into small molecular fragments and thus destroying its glycosidic bonds. Specifically, PFP is rich in GalA with a large extended Mw conformation, which is a better carbon substrate and can be rapidly used by microbes during the initial phases of fermentation, and similar results have been reported [24,35,36]. Furthermore, the maximum area of PFP gradually decreased during the fermentation phase from 6 to 48 h, until it was almost completely degraded at 48 h, suggesting that PFP was used by the gut microbiota during the fermentation process.

3.3.2. Carbohydrate Consumption During Fecal Fermentation

Figure 4B shows the monosaccharide composition of fermented PFP in vitro for different times. Changes in the monosaccharide content of the fermentation broth from 0 to 48 h were mainly GalA, Gal, and Ara. The peak areas of GalA, Gal, and Ara decreased significantly over time, with GalA consumed significantly more than the other sugars, indicating that intestinal microorganisms preferentially degrade and utilize GalA, followed by Ara, Gal, and Rha. Numerous microbial strains isolated from human feces have been discovered to possess various pectinolytic enzymes such as polygalacturonases, pectin methyl esterases, and both extracellular and cell-associated pectate lyases. These enzymes play a crucial role in the breakdown and utilization of pectins present in plant food products [37].
In addition, uronic acid, total soluble sugar, and reduced sugar contents in fermentation broths at different fermentation times are also believed to be useful in assessing the consumption of carbohydrates by the gut microbiota. As shown in Table 3, as the fermentation time extends, the residual amount of total soluble sugar and uronic acid of PFP gradually decreased, and the total soluble sugar content of the reducing sugar first increased and then decreased, which is consistent with the results of Wei et al. [34]. The remaining residual uronic acid, total soluble sugar, and reducing sugar content in the PFP fermentation broth remained high and slowly decreased during 12 h. During the fermentation process from 12 to 48 h, the rate of carbohydrate decline became faster due to the decrease in Mw. At 48 h, the total soluble sugar residues of the PFP group and the INL group were 26.47% and 22.79% of the initial values, respectively, which were closer to each other, and from this point of view, this indicated that PFP was as easily utilized by microorganisms as inulin.

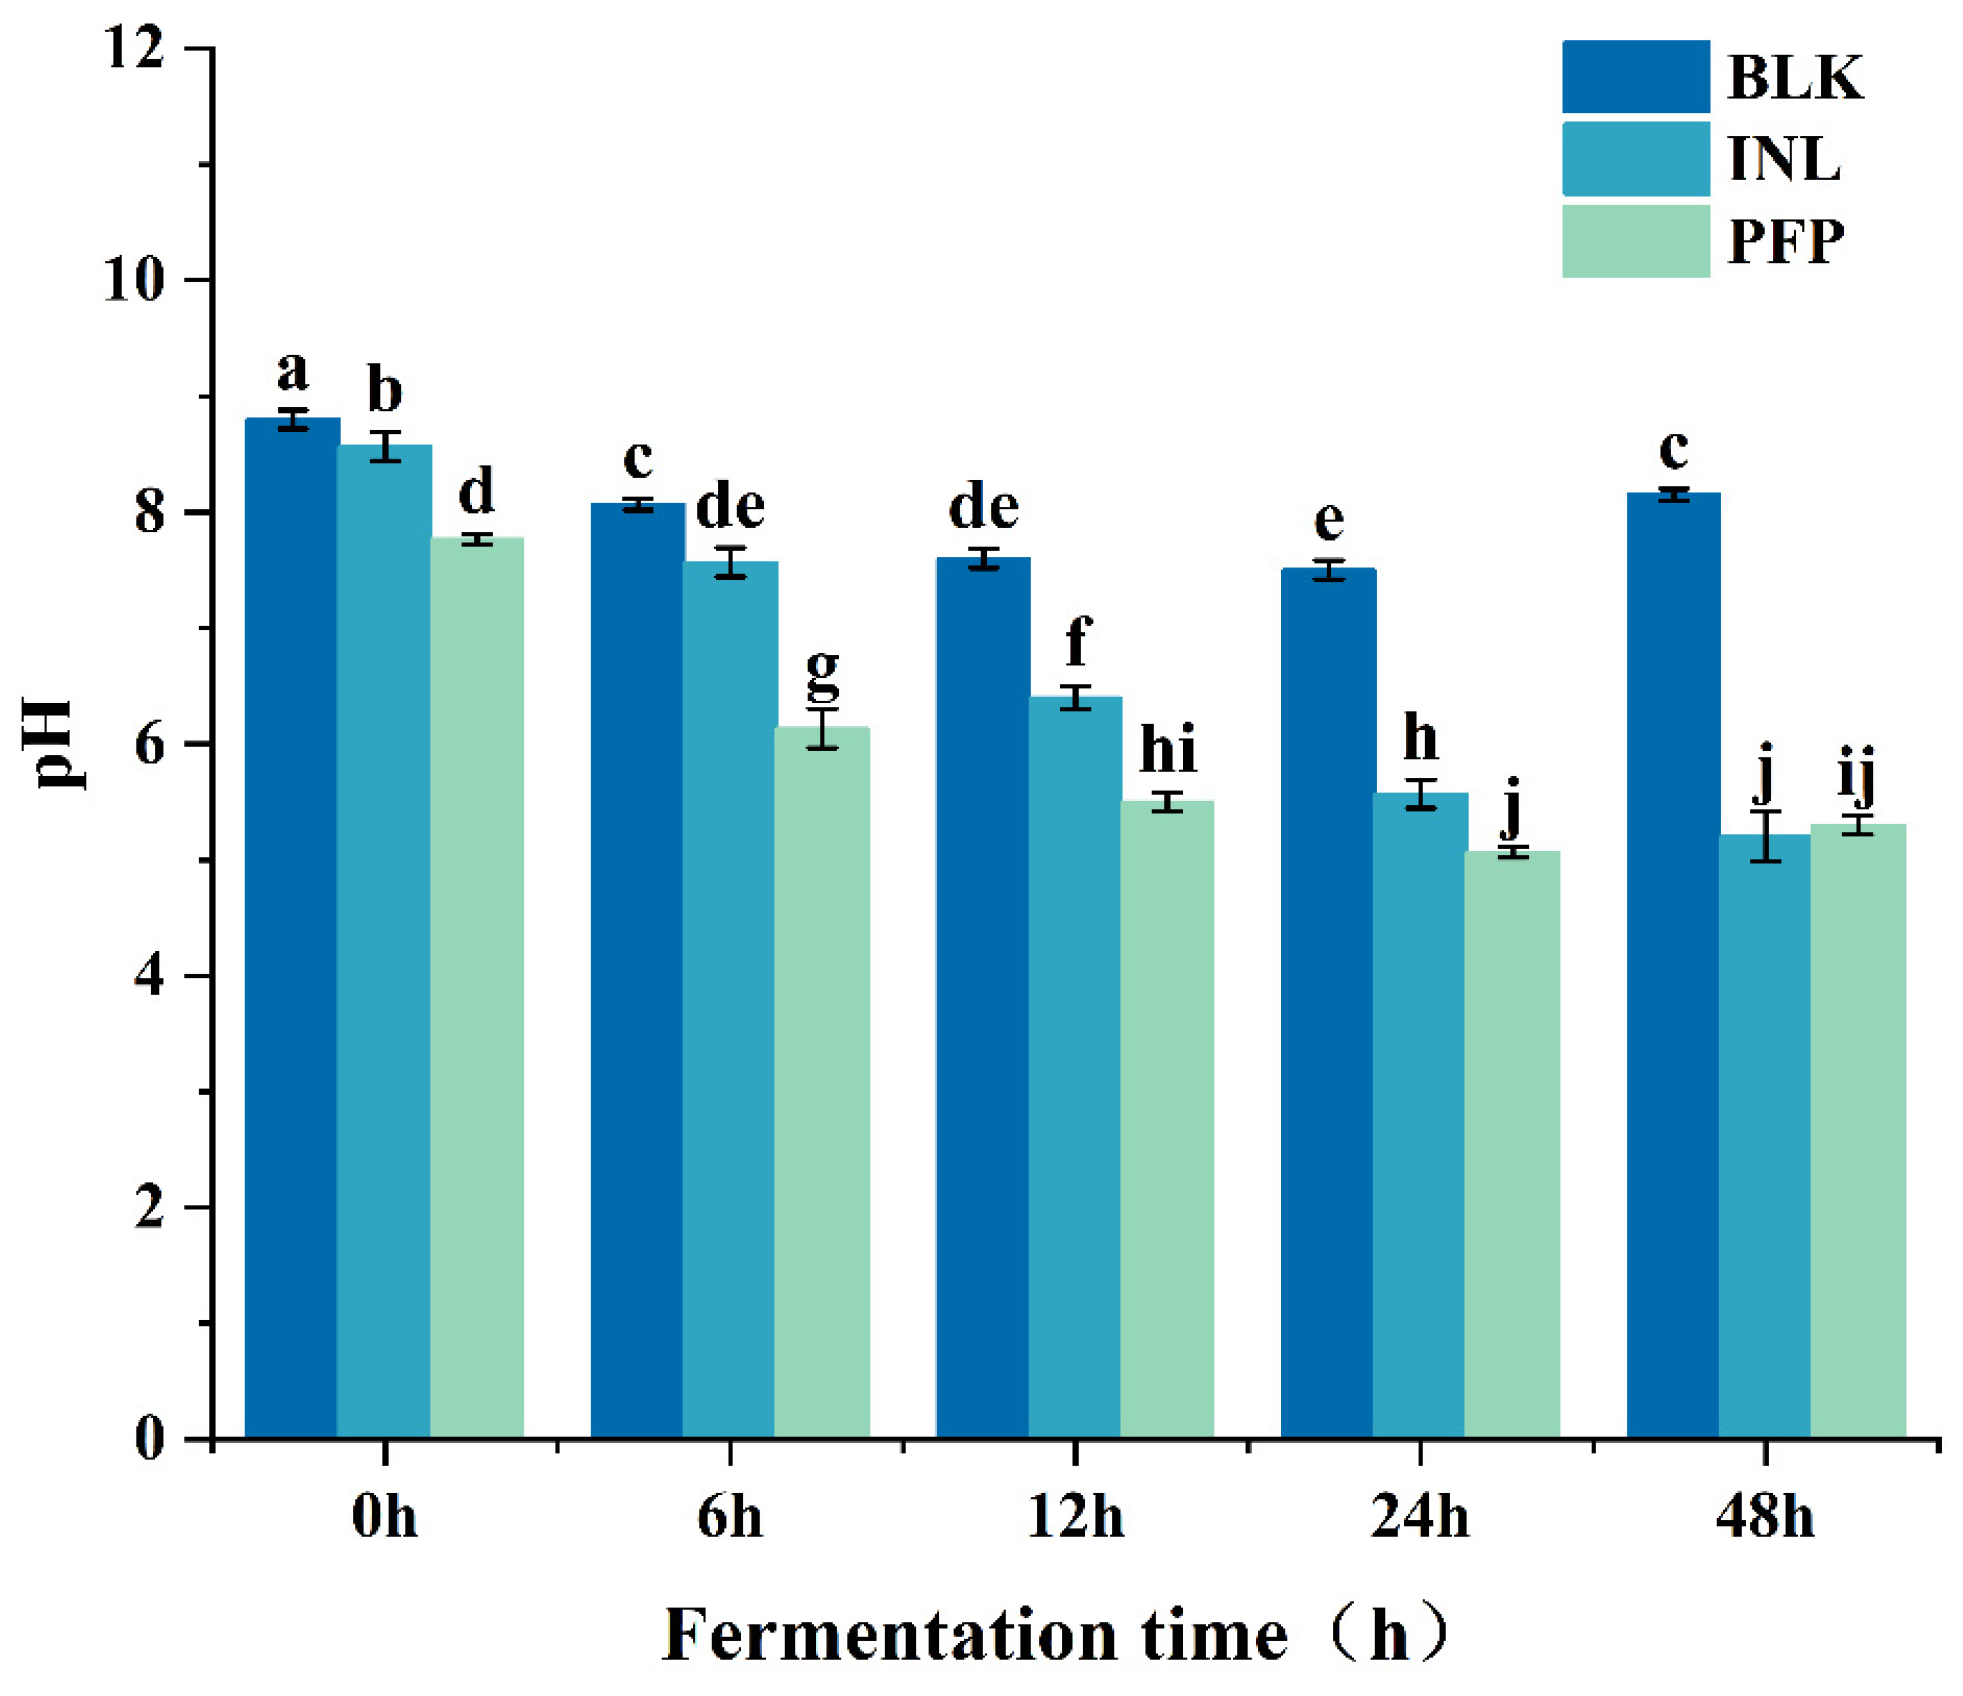
3.3.3. Change of pH and SCFAs

The variation in pH serves as a crucial parameter for tracking the polysaccharide fermentation process. As illustrated in Figure 5, at the beginning of fermentation (0 h), the initial pH of the fermentation broth in the Blank, INL, and PFP sample groups exceeded 7, which aligns with the results reported by Fang et al. [19]. The Blank and INL groups had the highest pH of the initial fermentation broth. In contrast, the pH of the initial fermentation broth of the PFP group decreased slightly as a result of the addition of the samples, which may be related to the higher uronic acid content in PFP. During the first 24 h of fermentation, the pH in the PFP group decreased from 7.4 to 5.0, showing a significant drop (p < 0.05) within this time frame, with a smaller change observed at 48 h. On the contrary, the pH in the INL group gradually decreased from 8.5 to 5.2, with ΔpH = 3.3. The Blank group experienced a slight decrease in pH from 0 to 24 h, stabilizing around 8.0 thereafter. Throughout the fermentation process, the pH of the PFP and INL groups remained consistently lower than that of the Blank group. This revealed that the presence of polysaccharides in colonic fermentation has a regulatory effect on intestinal pH.
The SCFA content of each group at the end of fermentation is shown in Table 4. The Blank group had the lowest levels of major gut flora metabolites such as acetic acid, propionic acid, and n-butyric acid, which were 8.12, 4.16, and 1.38 mmol/L, respectively. The levels of these three SCFAs were significantly elevated in both the INL and PFP groups. The contents of acetic acid, propionic acid, and n-butyric acid in the INL group were 14.29, 6.50, and 8.93 mmol/L, respectively. The PFP group had the highest levels of acetic acid, followed by propionic acid, and a smaller increase in n-butyric acid than the INL group, with 29.18, 6.92, and 3.24 mmol/L, respectively. This finding is similar to those that reported the highest concentrations of acetic acid, followed by propionic acid and n-butyric acid [38]. Furthermore, some studies have proposed an effect of sugar composition on SCFA production by fermentation, such as the fermentation of Xyl and GalA, that significantly increases the content of acetic acid and n-butyric acid [39]. There is a positive correlation between propionic acid production and Ara, Rha, and Xyl content in pectin [12]. This suggests that the elevated propionic acid content in the PFP group in this study is related to the fermentation of Ara and Rha. On the contrary, the high production of acetic acid in the PFP group corresponded to the structural domains of pectin of the high HG type, suggesting that acetic acid is produced primarily by GalA fermentation by the gut microbiota, which is in agreement with the findings of Tian et al. [40]. Other plant polysaccharides also have similar effects. For instance, aloe polysaccharides significantly increased the levels of SCFAs such as acetic acid, propionic acid, and butyric acid in the fermentation broth, and could act as signal molecules on the “gut–liver” axis to regulate fatty acid oxidation and immune cells in the liver [41]. Polysaccharides from yam can promote the production of lactic acid, acetic acid, propionic acid, and butyric acid, and regulate the intestinal microenvironment [42]. SCFAs are considered a beneficial metabolite of the gut microbiota due to their anti-inflammatory properties, effects on glucose and energy homeostasis, and enhanced insulin sensitivity [43]. Acetic acid, propionic acid, and n-butyric acid are the main SCFAs released by the gut microbiota that ferment dietary fiber and are considered beneficial for human health. Acetic acid regulates intestinal pH and protects against pathogens. Propionic acid regulates cholesterol metabolism and fights inflammation. The n-butyric acid has significant immune and anti-inflammatory properties [44]. Moreover, SCFAs also serve as an energy source for intestinal epithelial cells [45]. The findings regarding the total SCFA content revealed that the PFP groups had higher levels of total SCFAs compared to the Blank and INL groups. This suggests that incorporating PFP can significantly enhance SCFA levels, which is advantageous for human health.

3.3.4. Effects of PFP Fermentation on Intestinal Microorganisms

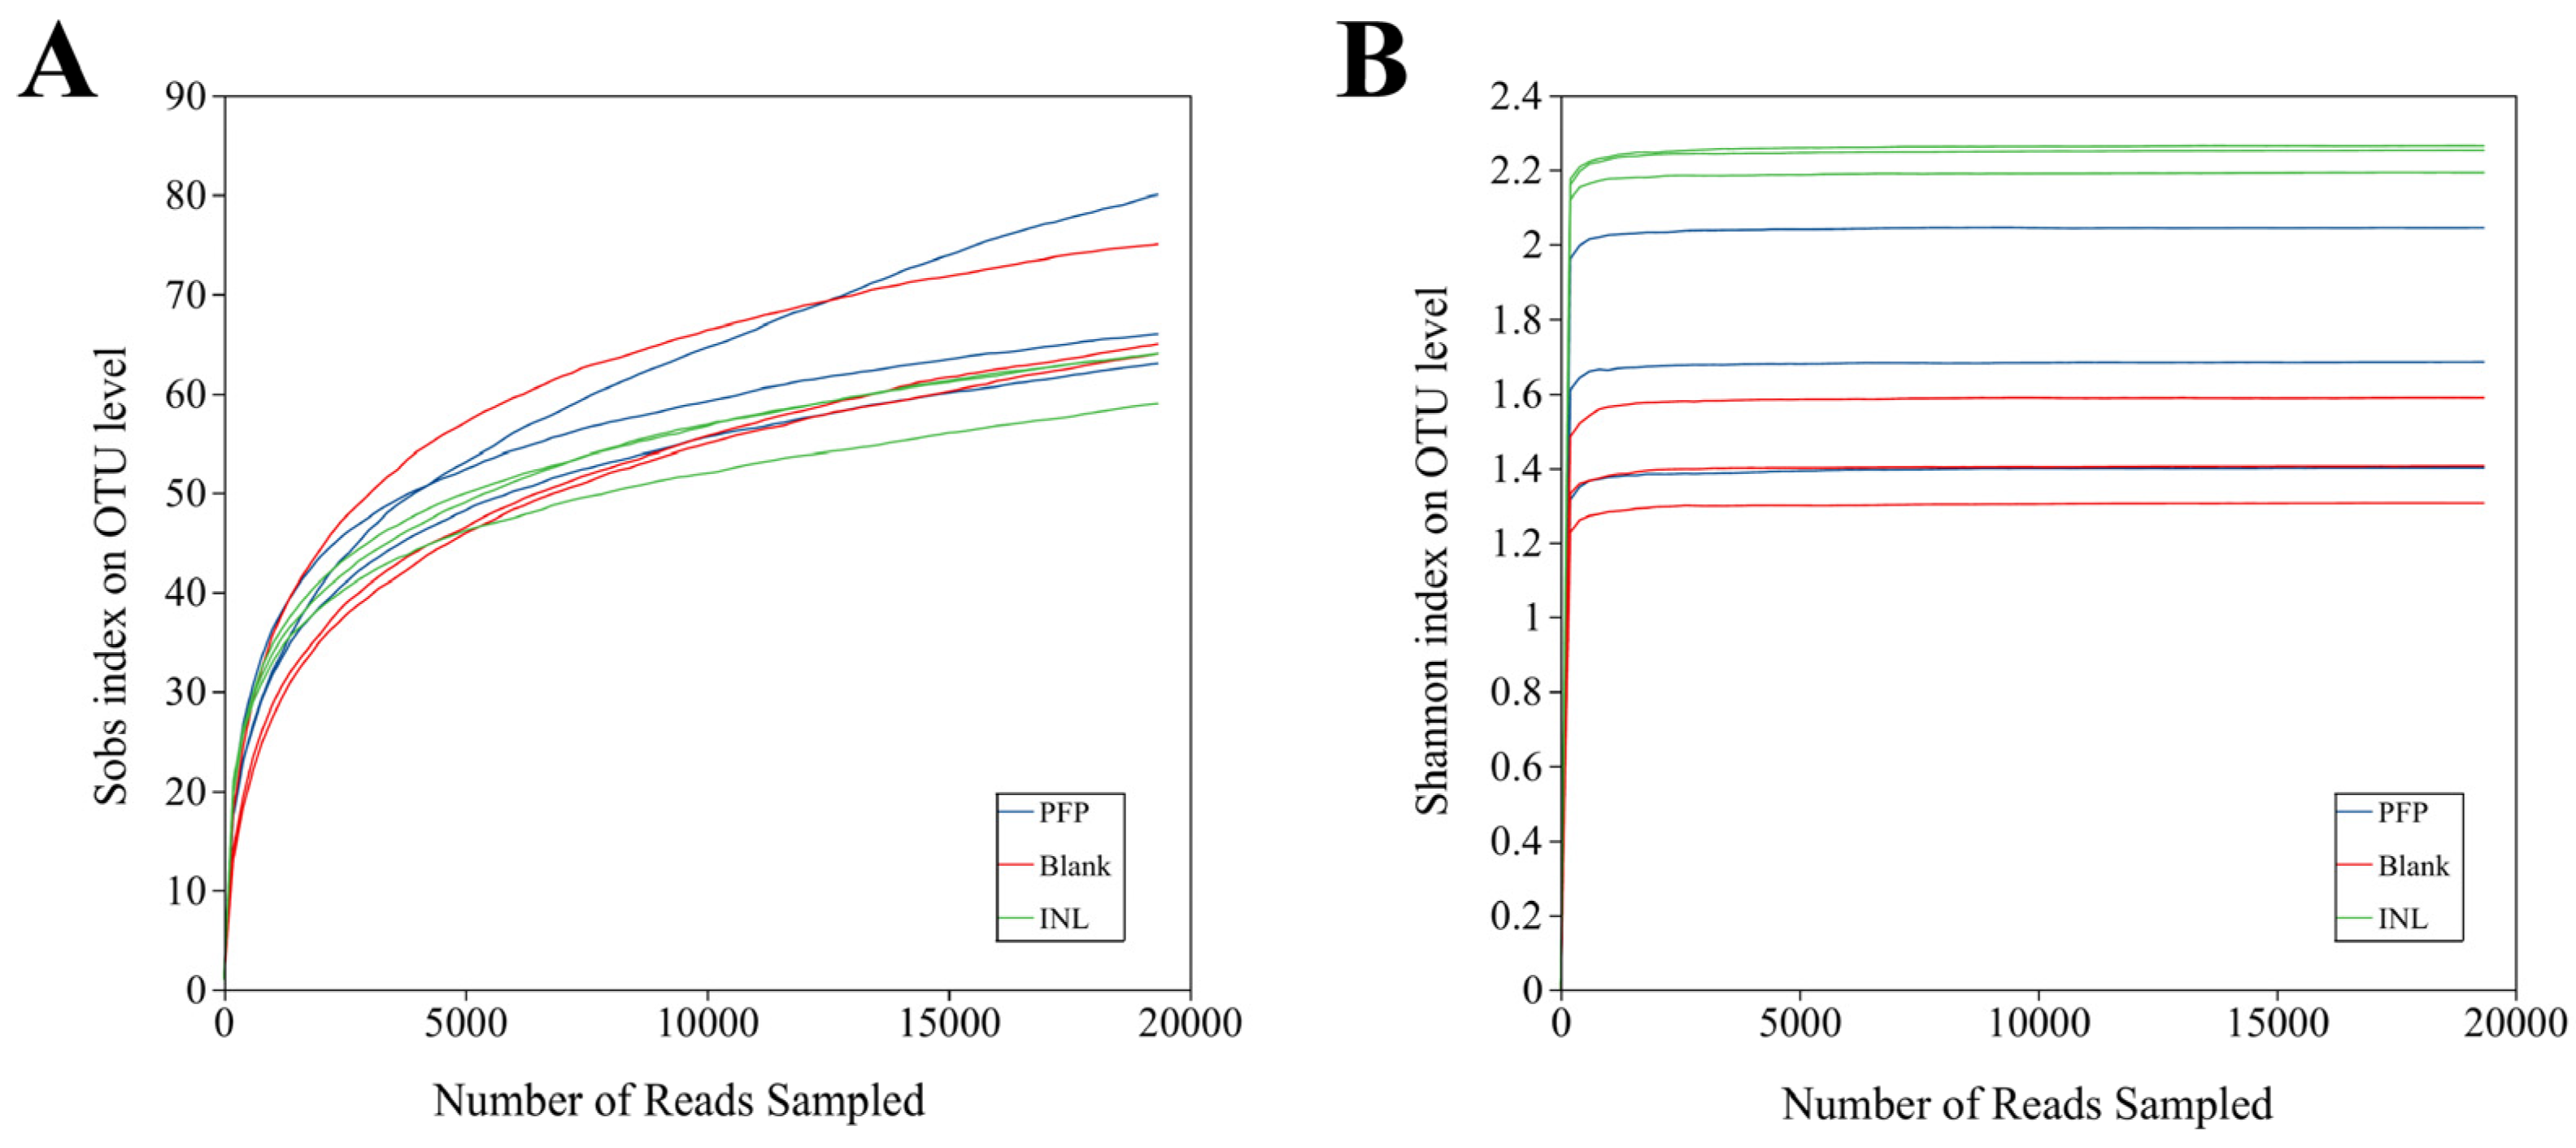
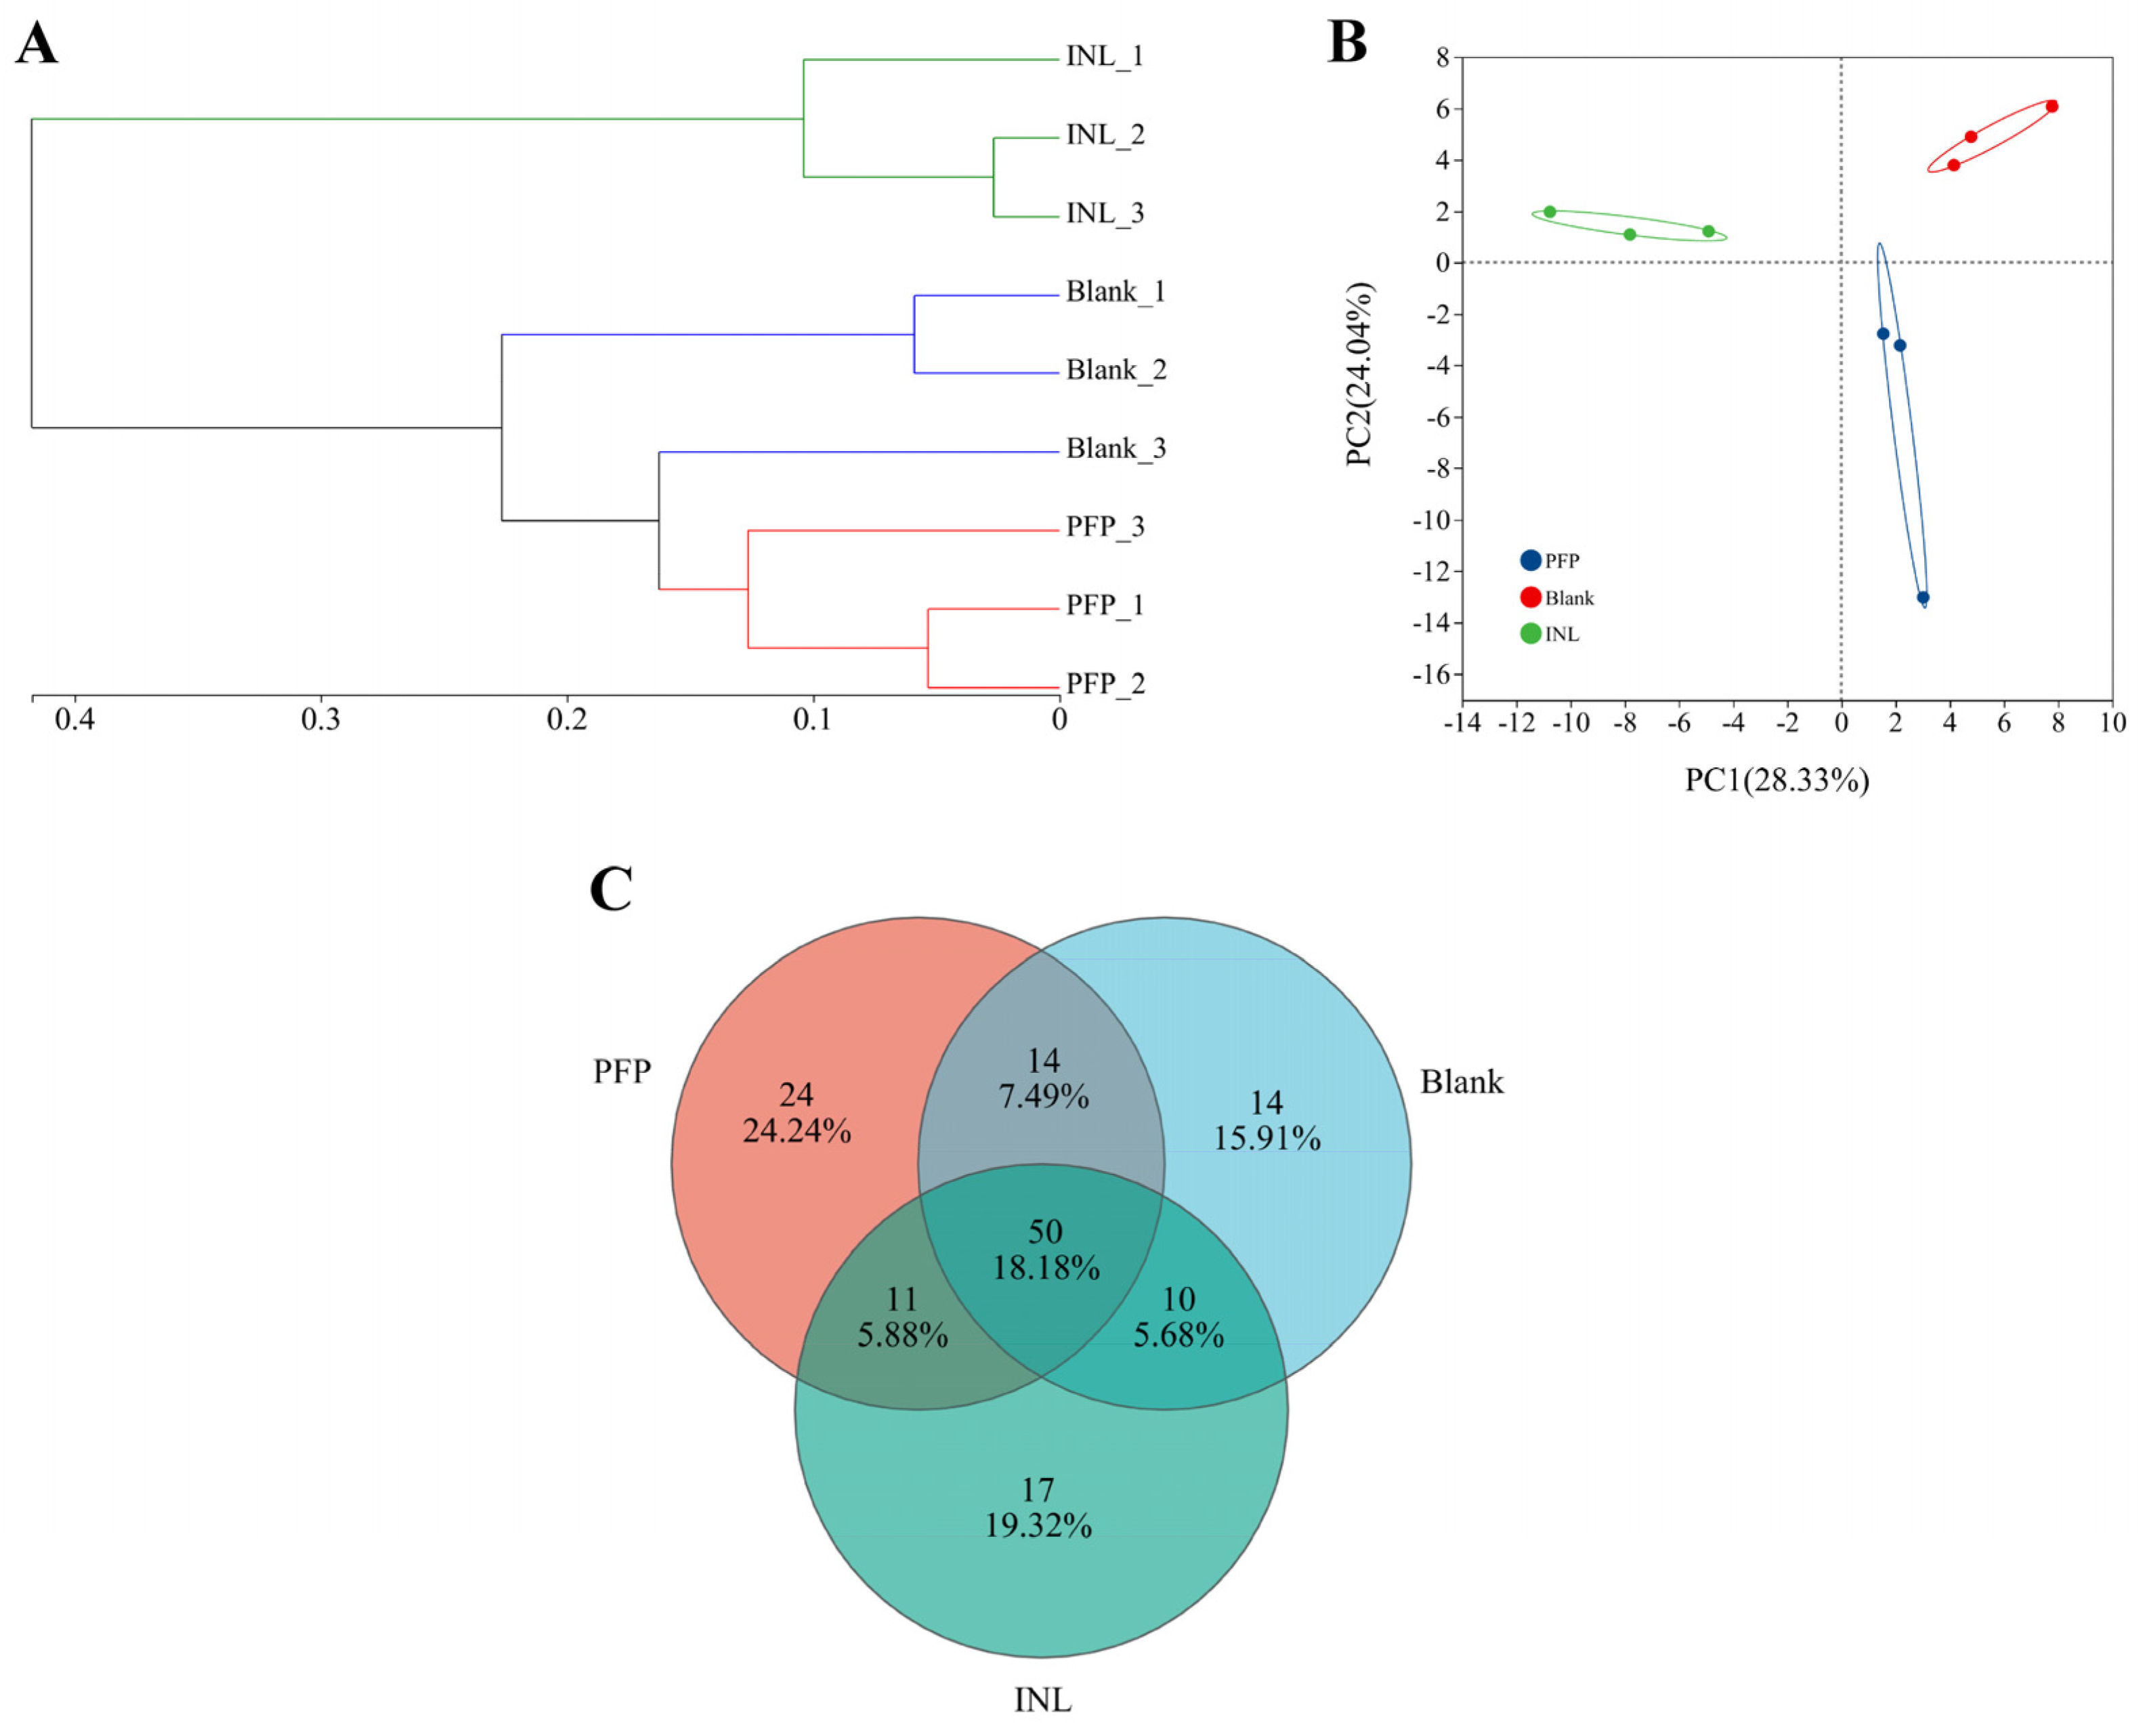
Microbial Diversity Analysis

Alpha diversity refers to the diversity within a specific region or ecosystem and is a measure of the species richness and community diversity of microorganisms in a sample. Shannon indices are commonly used to assess this diversity, with higher Shannon values indicating greater species diversity. The Sobs index was used to predict the number of microorganisms and measure the richness of the community, with larger values indicating more species. As shown in Figure 6A,B, their dilution curves reflect the sample size and sequencing depth. Both dilution curves plateau, indicating that the sequencing data have reached saturation and are able to cover most species in the gut microbiota. In addition, it is evident that as the levels of the Sobs and Shannon indices increase, bacterial α diversity also rises. The Shannon values for both the PFP and INL groups were significantly higher than those observed in the Blank group, indicating that PFP and inulin substantially altered the species diversity within the microbiota. Generally, an increase in gut microbial diversity correlates with a decreased risk of disease; thus, it can be concluded that the incorporation of PFP mitigates the likelihood of disease occurrence [46].
In addition, beta diversity, also referred to as interhabitat diversity, pertains to the variation in species composition among different habitat communities or the rate of species turnover along environmental gradients. In this study, hierarchical cluster analysis, principal coordinate analysis (PCA), and Venn diagrams were employed to elucidate the overall differences in the gut microbiota across the three groups. Hierarchical cluster analysis illustrates sample similarity through a dendrogram format and assesses clustering effectiveness based on the branch lengths of the resulting tree. As shown in Figure 7A, the INL group was a cluster by itself, which was significantly different from the other groups. The PFP group and Blank group are a cluster, indicating that some gut microbiota in the PFP group may be similar to those in the Blank group. PCA was employed to assess overall differences in the gut microbiota among the three groups. The results showed that the distance between the PFP group, INL group, and Blank group was far, and there was statistical separation among the groups (Figure 7B). The cumulative variance contribution rate of the PC1 and PC2 principal component factors is 52.37%, indicating that most of the information in each group can be explained. Furthermore, a Venn diagram was employed to assess the number of OTUs across each group. As illustrated in Figure 7C, the PFP group, INL group, and Blank group exhibit unique OTU counts of 24, 17, and 14, respectively, and the number of OTUs in the PFP group is significantly higher than those in the other two groups, indicating that the gut microbiota structure has undergone significant changes under the treatment of PFP.

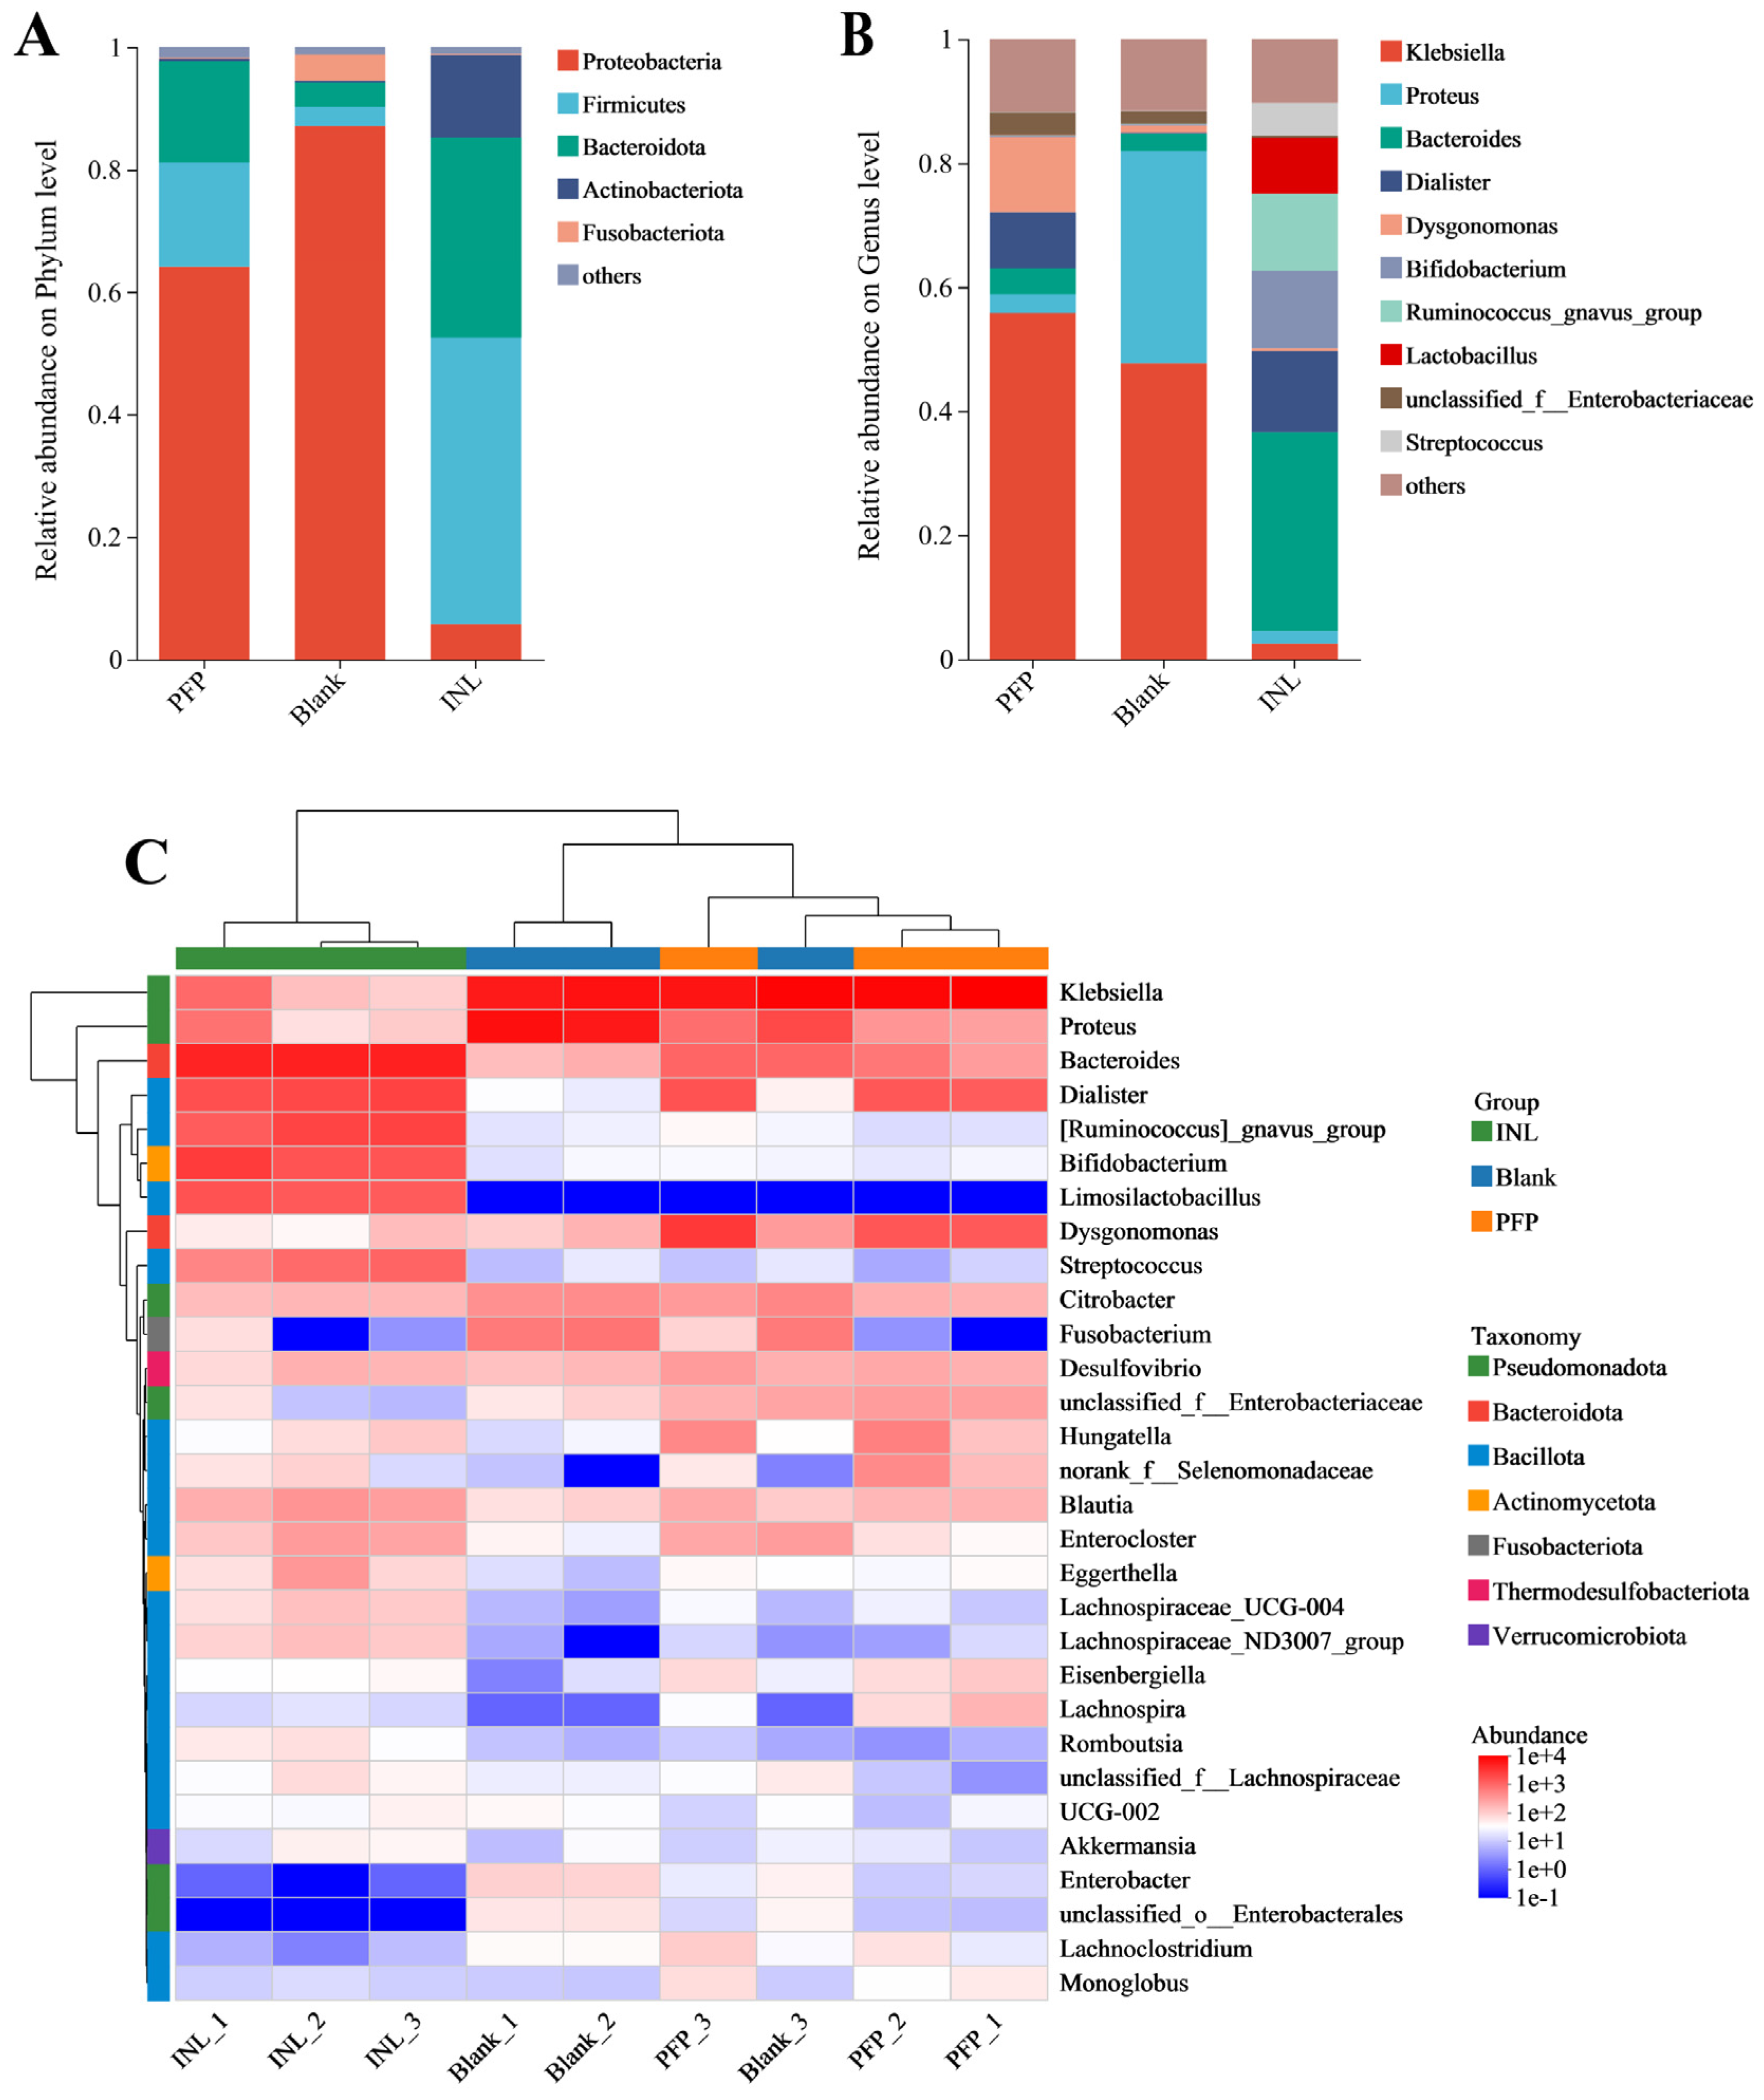
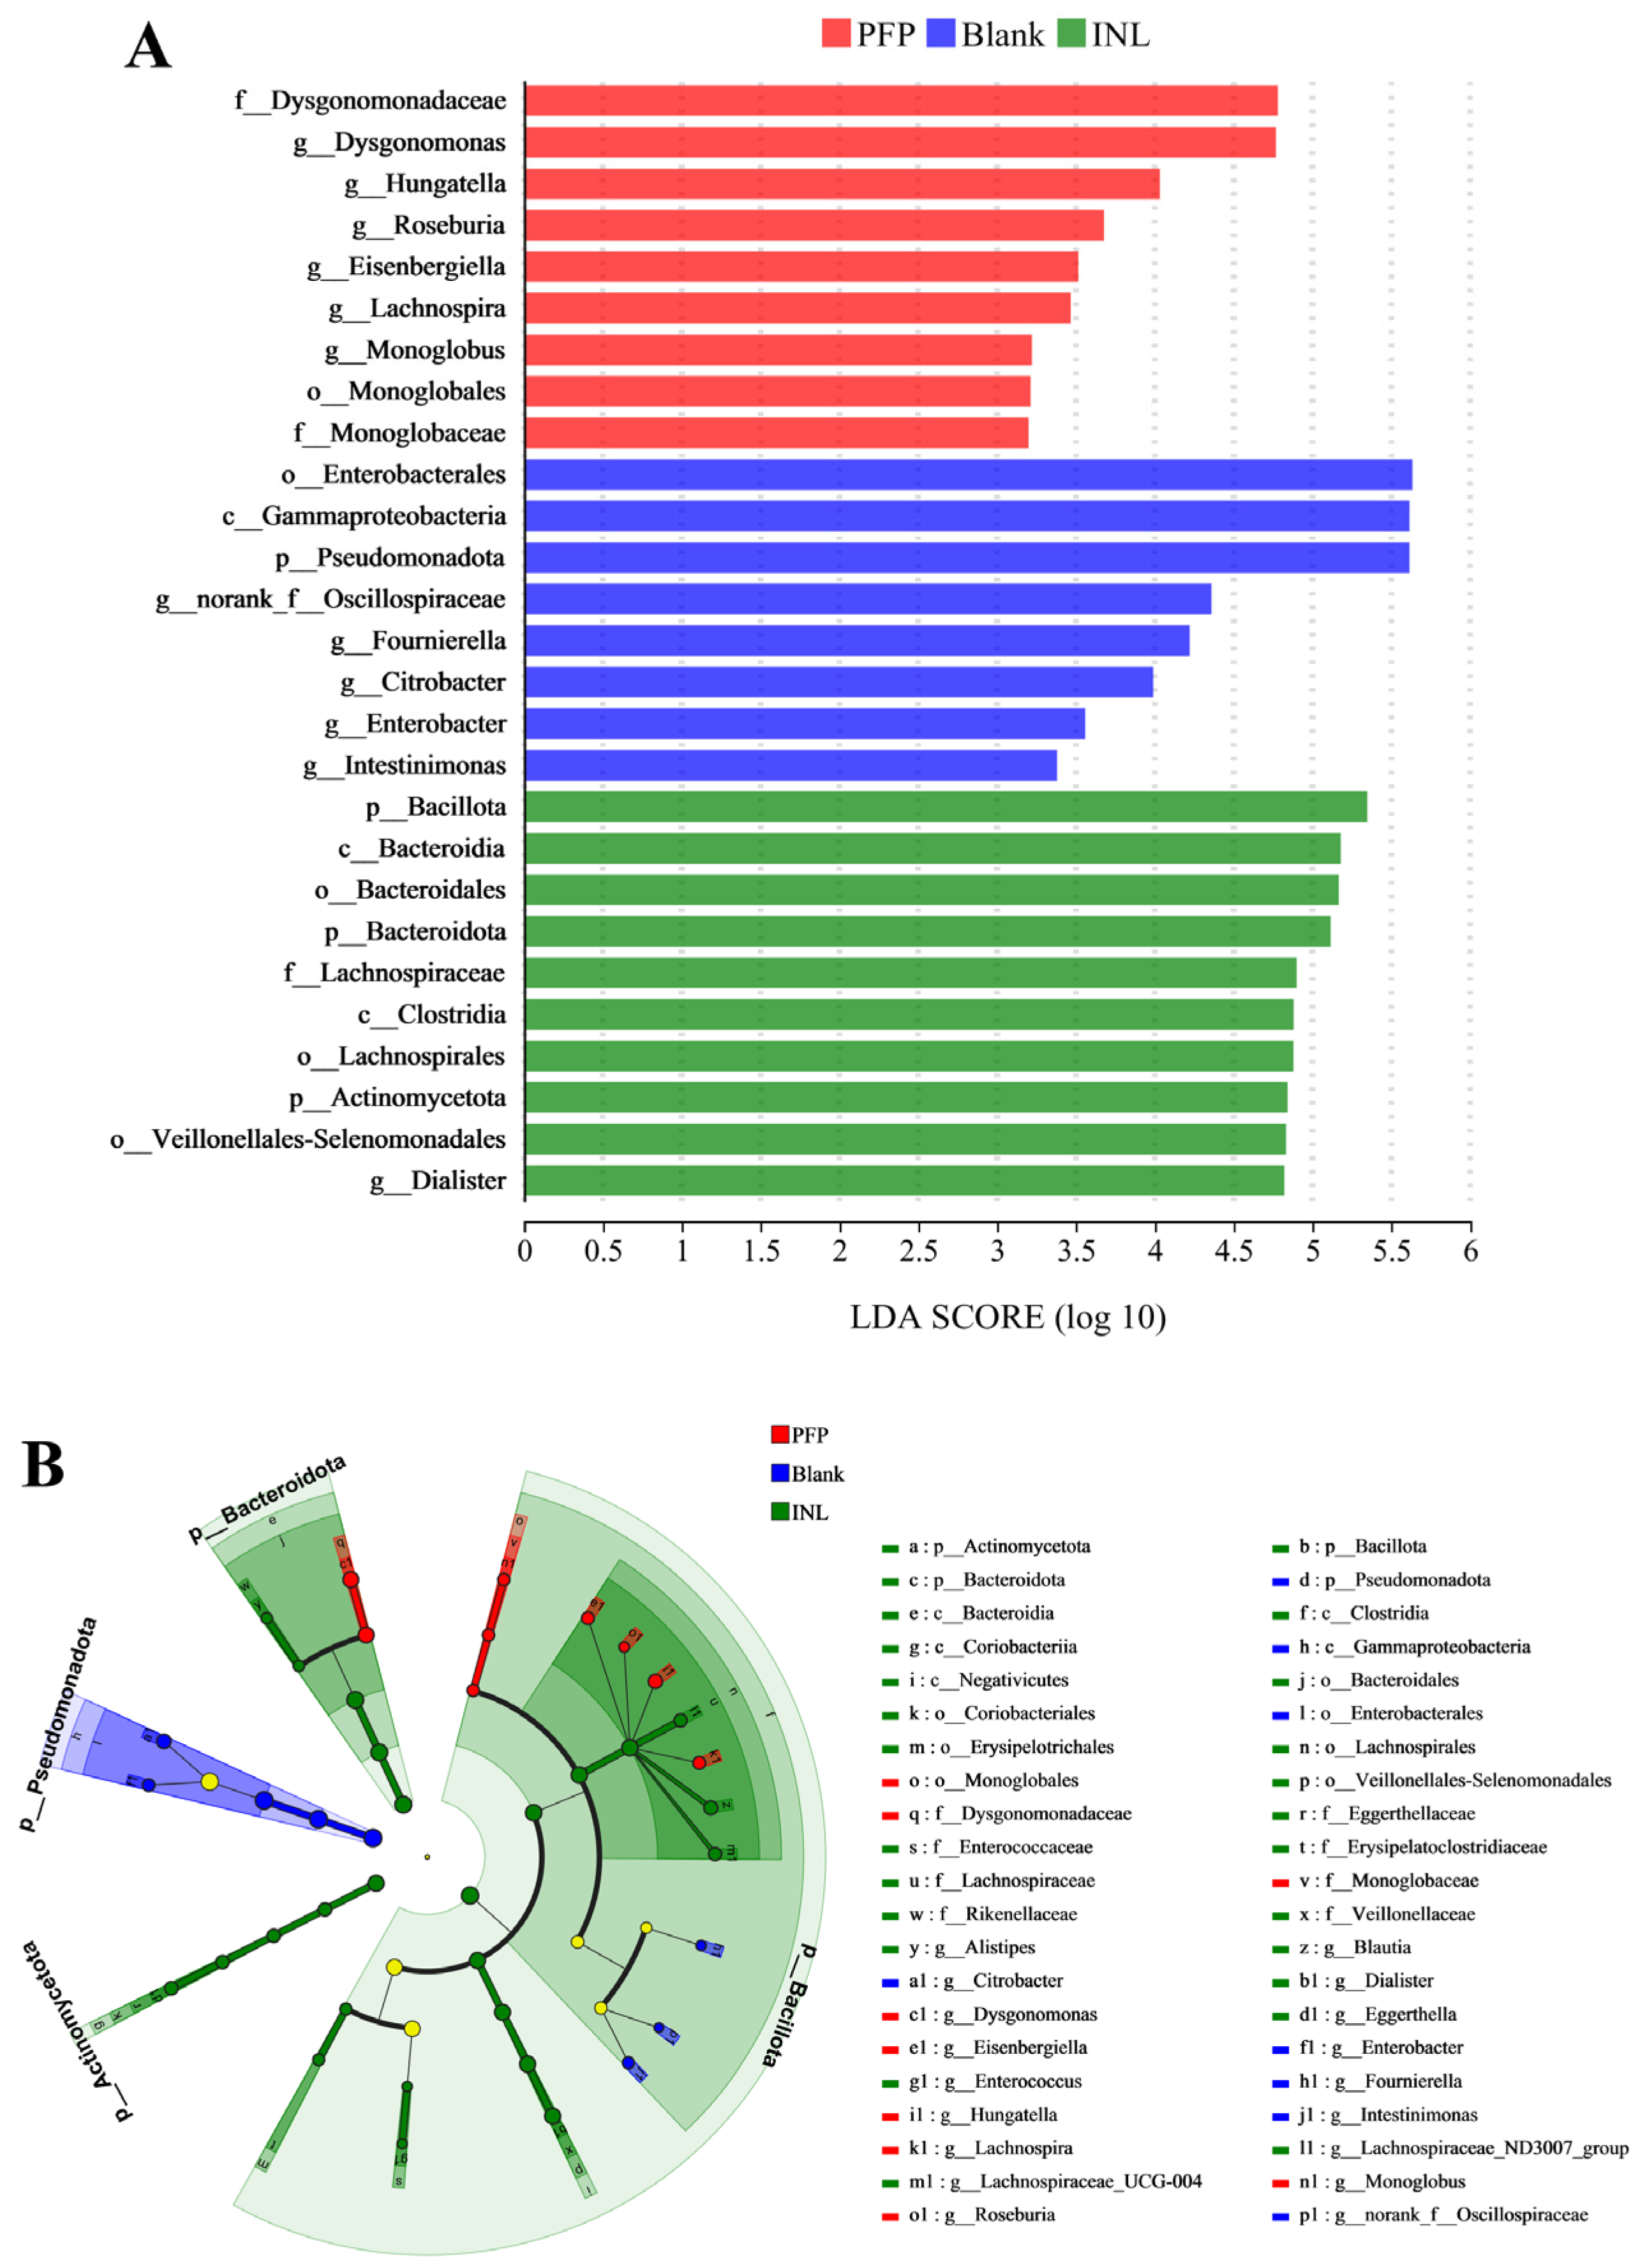
Effect of PFP on the Structure of the Gut Microbiota

Initially, we evaluated the microbial community structure of each group at the phylum level, with the results presented in Figure 8A. After 48 h of fermentation, significant changes were observed in the gut microbiota of both the PFP and INL groups. Compared to the Blank group, there was a notable increase in the abundances of Bacteroidota, Firmicutes, and Actinomycetota within the INL group (p < 0.05). Conversely, the abundances of Proteobacteria and Fusobacteriota were significantly reduced (p < 0.05). Similarly, in the PFP group, there was a marked increase in Bacteroidota and Firmicutes abundance (p < 0.05), while Proteobacteria and Fusobacteriota showed a significant decrease (p < 0.05). These findings suggest that PFP and inulin exhibit certain similarities regarding their regulatory effects on the gut microbiota at the phylum level. Studies have demonstrated that an abnormal increase in Proteobacteria is closely linked to a significant accumulation of endotoxins, which not only disrupts intestinal barrier function but may also exacerbate the progression of diabetes [47]. Furthermore, an elevation in the phylum Fusobacteriota is frequently regarded as a microbial marker indicative of malnutrition [48]. Bacteroides play an important role in the gut microbiota, encoding a series of glycosidases and polysaccharide lyases, which constitute a system similar to the sugar utilization system (SUS). The presence of these enzymes allows Bacteroides to efficiently break down and utilize complex carbohydrates, including biomacromolecules such as pectin [49]. In Bacteroides thetaiotaomicron and Bacteroides ovatus, genes for carbohydrate active enzymes (CAZymes) make up about 6% of the genome, while most organisms account for only 1–3% [50]. This indicates that Bacteroides have a strong advantage in the degradation and utilization of polysaccharides.
Secondly, to elucidate the regulatory effect of PFP on the microbial community, we evaluated the intestinal microbiota of the PFP, INL, and Blank groups following 48 h of in vitro fermentation at the genus level. The results are presented in Figure 8B. Compared to Proteus and Klebsiella, which constituted over 50% of the microbial population in the Blank group, the relative abundance of Proteus in both the PFP group and INL group decreased to below 5%. The relative abundance of Klebsiella in the INL group also decreased to less than 5%. At the same time, Bacteroides and Dialister in the two groups increased by different degrees. This finding indicates that PFP and inulin significantly altered the distribution of microorganisms. Figure 8C shows the results of bacterial cluster analysis in the different experimental groups, revealing the differences in bacterial composition among the different groups. The depth of the color represents the relative abundance change of the genus, and the darker the color, the higher the relative abundance. Compared with the Blank group, the abundance of Bacteroides, Dialister, Dysgonomonas, and other beneficial bacteria in the PFP group increased, while the abundance of conditioned bacteria such as Proteus decreased significantly. The INL group significantly increased the abundance of Bacteroides, [Ruminococcus]_gnavus_group, Dialister, Limosilactobacillus, and Bifidobacterium. It inhibited the growth of harmful bacteria such as Proteus and Klebsiella. Among them, Bifidobacterium, as an important gut beneficial bacterium, has a positive impact on human health in many aspects. It provides significant benefits to host health by improving the immune response and anti-tumor effects, and reducing susceptibility to allergies [51].
Dysgonomonas is a genus in the phylum Bacteroides that is rich in carbohydrate esterases (CEs), which play an important role in the intestinal cleavage of dietary fibers such as polysaccharides [52]. Dialister is a genus of Veillonellaceae that metabolizes complex carbohydrates and produces SCFAs such as acetic acid, propionic acid, and butyric acid [53]. Studies have shown that the addition of cereals can increase the relative abundance of the fiber-degrading bacteria Veillonellaceae in the digestive tract of infants, and the presence of these bacteria is positively correlated with acetic acid content, which is of great significance for intestinal health [54]. In addition, the abundance of Dialister in the gut correlates with levels of serotonin, which has inhibitory effects on neuropsychiatric disorders such as depression, autism, and mood control [55]. Meanwhile, low Mw longan pulp polysaccharides can increase the abundance of Dialister [56]. These findings suggest that the addition of PFP may exert its health benefits by promoting the growth of beneficial bacteria such as Dialister and Bacteroides and increasing the production of SCFAs.
Impact factor analysis and linear discriminant analysis (LDA) of multilevel species differences were performed using the linear discriminant analysis effect size (LEfSe) (Figure 9A). Bars of different colors were used to indicate species differences between groups with LDA scores (Log10) > 2 and significant abundance. The length of the bar is the LDA score, indicating the effect of significantly different species between groups. There were 8, 9, and 10 cases of OTUs in the Blank, PFP, and INL groups, respectively, and the differences were statistically significant. Among them, g_Dysgonomonas, g_Hungatella, g_Roseburia, g_Lachnospira, and g_Monoglobus are the dominant flora of the PFP group and can be used as potential biomarkers of the PFP group. A study isolated a Firmicutes strain, H. hathewayi N2-326, which can catabolize the complex polysaccharide glycosaminoglycan and is a rich source of specific glycosaminoglycan catabolic enzymes [57]. Roseburia is a genus of gut bacteria capable of breaking down complex carbohydrates, mainly producing SCFAs such as butyrate, which play an important role in maintaining intestinal health and alleviating intestinal inflammation [58]. As the main energy source of colon epithelial cells, butyrate can reduce the pH value of the colon, stimulate the proliferation of normal epithelial cells, inhibit the proliferation of colorectal cancer cells, and induce their apoptosis [59]. In addition, butyrate also improves intestinal barrier function and reduces the oxidative stress response by promoting the formation of mucin, antimicrobial peptides, and tight junction proteins, thus inhibiting the occurrence and development of colitis and colon cancer [59]. Polysaccharides from Naematelia aurantialba, a mushroom species, have been proven to enhance the abundance of Roseburia [60]. Lachnospira, a member of the phylum Firmicutes, has been noted for its ability to ferment dietary fibers such as pectin [61]. It plays an important role in carbohydrate metabolism, providing nutrients and energy to the host primarily through the production of butyrate, and is therefore considered a potential probiotic [61]. In addition, Monoglobus, a novel pectolytic bacterium recently isolated from human feces, is a beneficial microbe with the ability to ferment galacturonic acid, xylose, and arabinose [62]. The results showed that the addition of PFP could significantly increase the abundance of these beneficial bacteria, and help to maintain intestinal homeostasis and promote intestinal health.

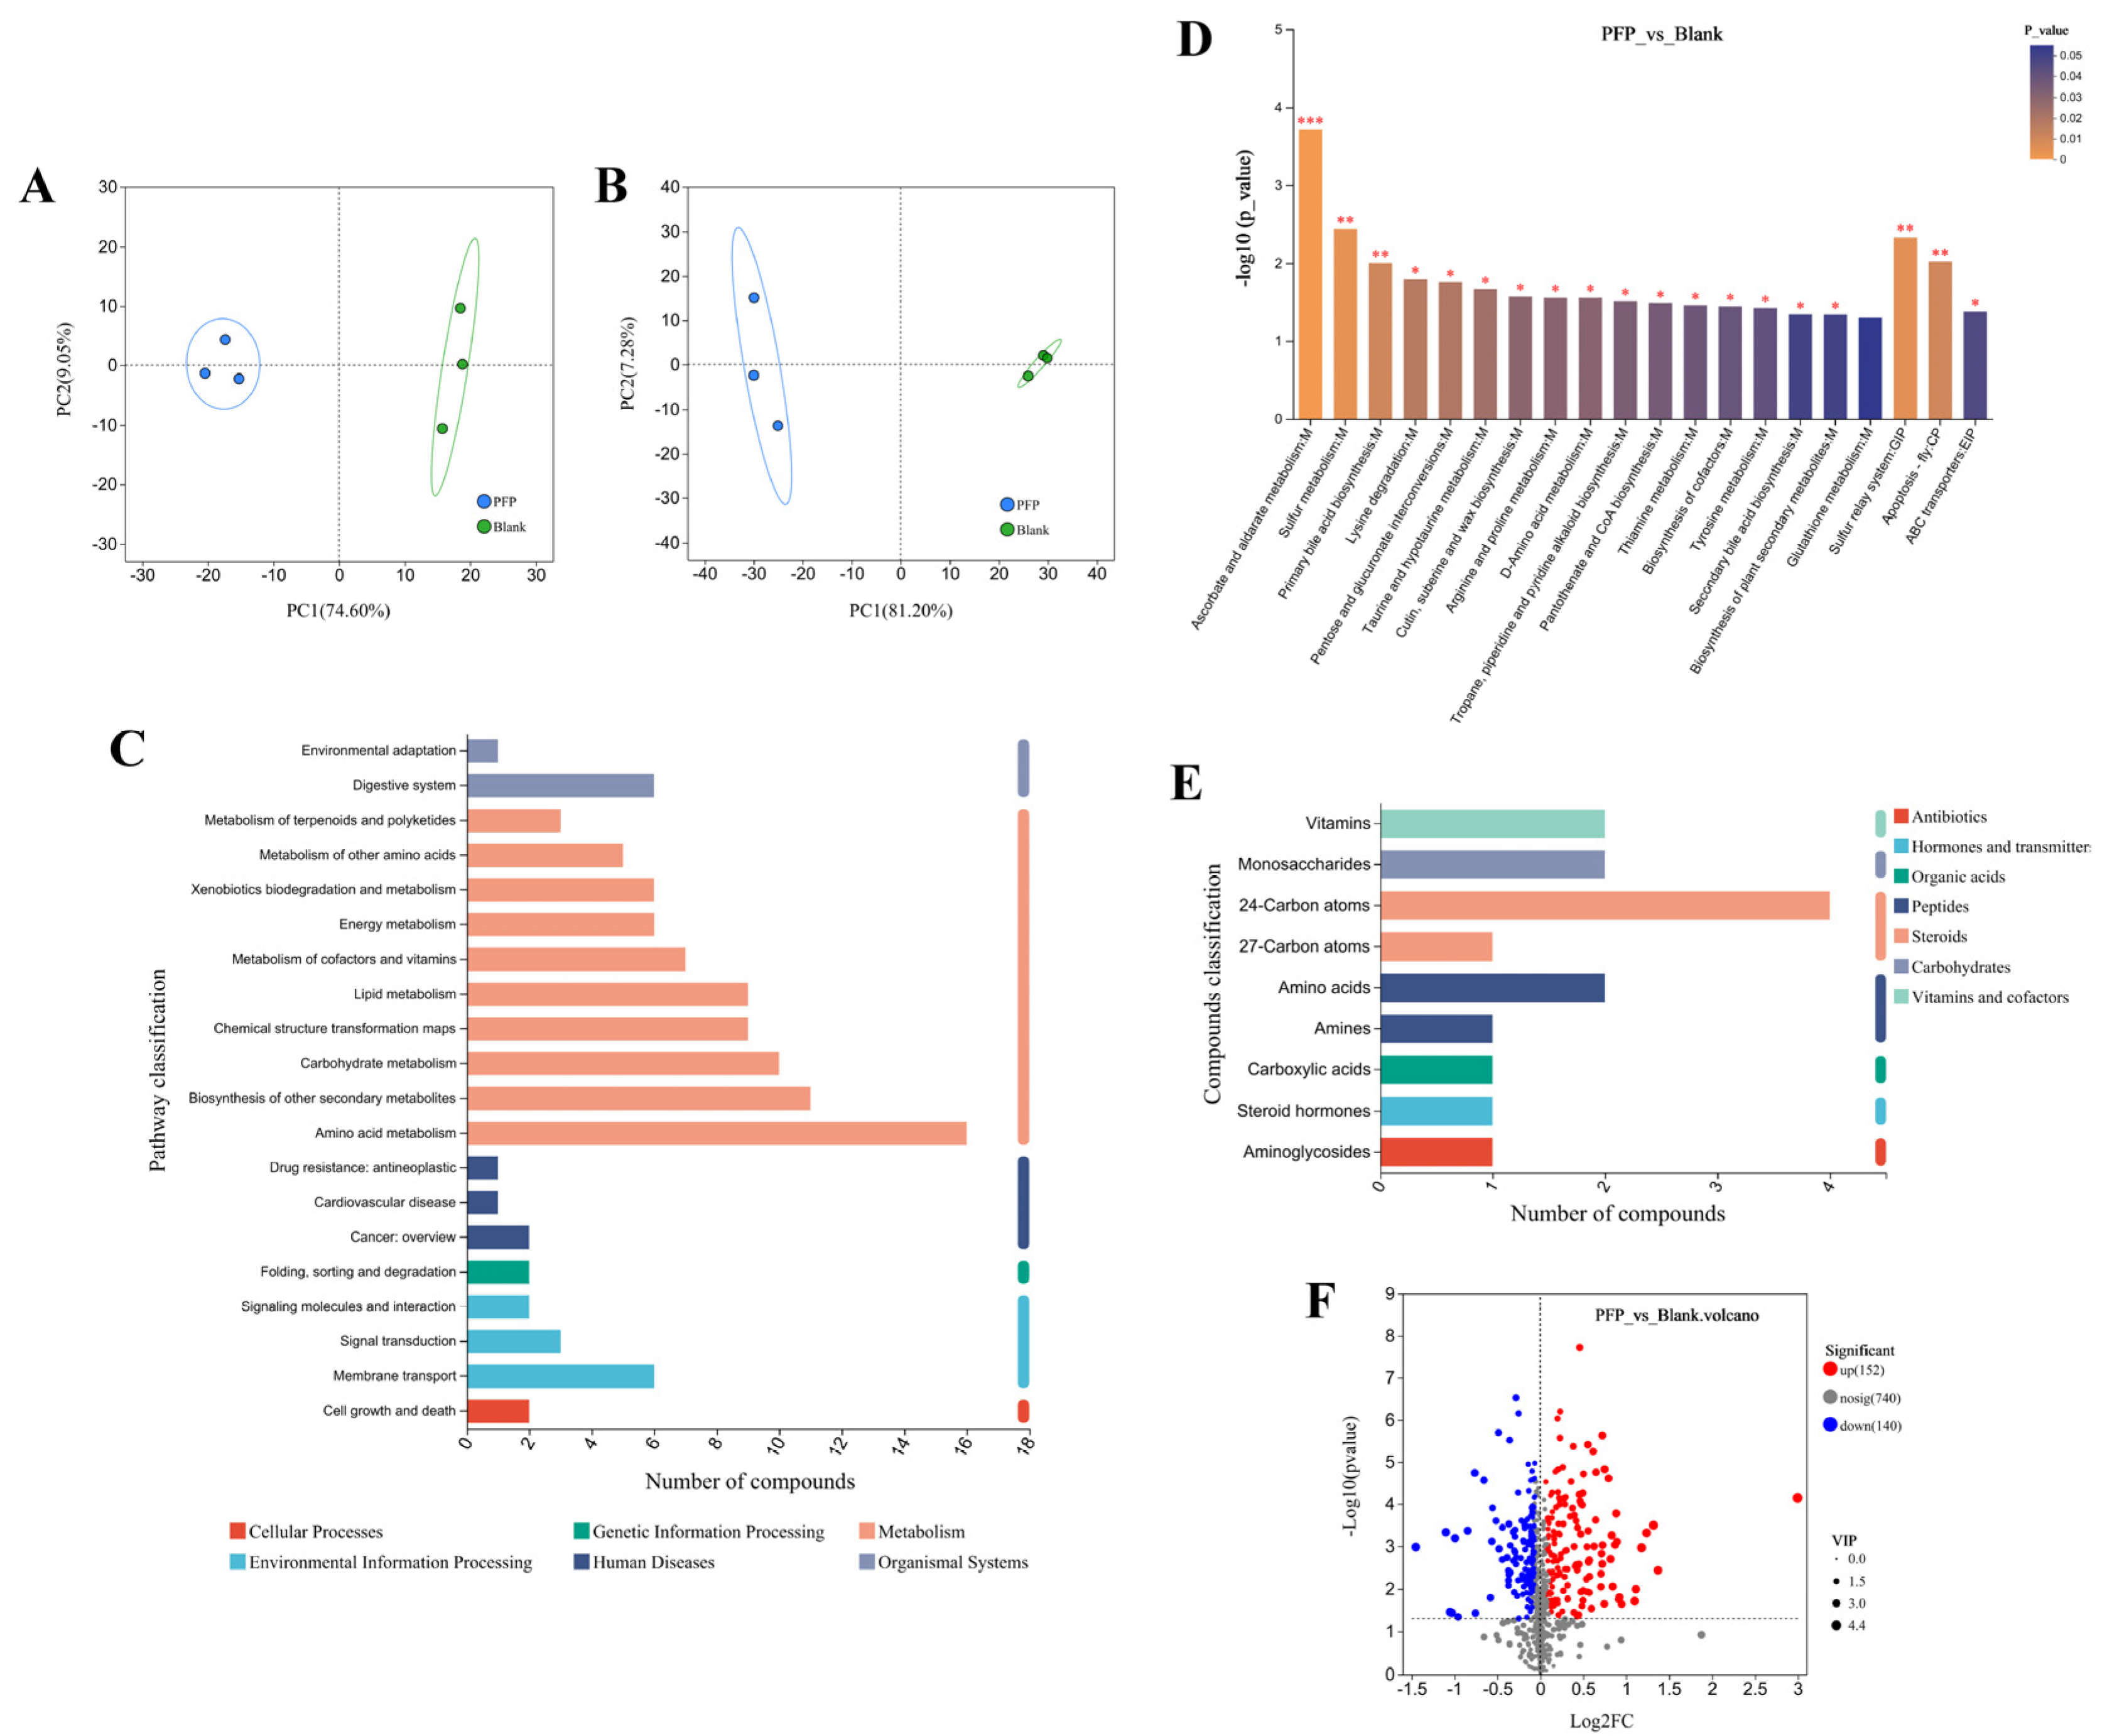
3.3.5. Microbial Metabolomics

The metabolic profiles of the fecal microbiota were systematically investigated by non-targeted metabolomics techniques using LC-MS. After data preprocessing and multivariate statistical analysis, 609 metabolites were successfully identified under positive ion mode (POS), 423 metabolites were detected under negative ion mode (NEG), and a total of 1032 metabolites were qualitatively and quantitatively obtained. The results of PCA analysis in Figure 10A,B showed that the PFP intervention group and the Blank control group showed significant separation under both ionization modes, in which the cumulative variance contribution rate of PC1 and PC2 reached 83.65% (POS) and 88.48% (NEG), respectively, fully reflecting the significant differences in metabolites between samples. This result suggests that PFP intervention may affect host–microbial co-metabolic processes by regulating the metabolic network of gut microbes, thus producing specific metabolic characteristics.
Through the pathway enrichment analysis of differential metabolites based on the Kyoto Encyclopedia of Genes and Genomes (KEGG) database, the significant differences in metabolic characteristics among different samples can be deeply understood. As shown in Figure 10C, the regulatory effect of PFP on the intestinal microbiota involves multiple metabolic pathways, covering major categories such as organismal systems, metabolism, human diseases, genetic information processing, environmental information processing, and cellular processes. Under the main category of metabolism, there are ten secondary classifications, including terpenoid and polyketide metabolism, amino acid metabolism, energy metabolism, lipid metabolism, carbohydrate metabolism, and cofactor and vitamin metabolism. Among them, lipid metabolism regulates the biosynthesis of primary bile acids, secondary bile acids, and steroid hormones; and amino acid metabolism regulates the synthesis of essential amino acids such as threonine, cysteine, lysine, valine, leucine, and isoleucine. In addition, PFP also exists in the regulation of metabolic pathways including butyric acid, vitamin B6, thiamine, and pantothenic acid. This indicates that PFP has a significant regulatory effect on the metabolic activities of the intestinal microbiota and can alter the metabolic products generated by bacteria. Figure 10D shows the statistical differences in metabolic pathways, and the results indicate that pathways such as ascorbate and aldarate metabolism, sulfur metabolism, and primary bile acid biosynthesis are significantly regulated by PFP (p < 0.01). Numerous studies have shown that plant polysaccharides can exert their biological activities by regulating specific metabolic pathways [49,63,64]. Taking Astragalus polysaccharides as an example, they can normalize the fasting blood glucose and insulin levels of high-fat diet mice by regulating the glutathione metabolic pathway and the purine metabolic pathway, thereby exerting significant protective effects against non-alcoholic fatty liver disease and obesity [65]. In terms of the repair of intestinal–liver–kidney axis injury, the polysaccharides of Polygonatum sibiricum have demonstrated unique metabolic regulatory functions, significantly influencing the pathways related to energy metabolism in the liver and kidneys, such as aspartic acid and tyrosine, and alleviating the intestinal flora disorder and liver and kidney damage caused by the co-exposure to citrinin and alcohol [66]. These research results collectively reveal the significant role of polysaccharides in maintaining the metabolic homeostasis of the body by interfering with the gut microbiota–host metabolic axis.
The differential metabolites of KEGG pathways were identified and classified. The classification statistics results are shown in Figure 10E. A total of seven types of differential metabolites were identified, including antibiotics, hormones and neurotransmitters, organic acids, peptides, steroids, carbohydrates, and vitamins and cofactors. The volcano plot can be used to analyze and compare the metabolites between the two groups by using the variable importance in projection (VIP), p value, and fold change (FC). Under the conditions of a p value < 0.05, VIP > 1, and FC > 1.2 or < 1/1.2, 292 differentially changed metabolites were screened out from 1032 major metabolites. As shown in Figure 10F, compared with the Blank group, 152 metabolites were significantly upregulated, and 140 metabolites were significantly downregulated in the PFP group. Based on the compound classification of the Human Metabolome Database (HMDB) (as shown in Figure S2), we have identified 12 categories of compounds, specifically including 56 organic acids and their derivatives, 50 lipids and lipid-like molecules, 38 organic heterocyclic compounds, 26 organic oxygen compounds, 20 benzene compounds, 12 phenylpropanoids and polyketides, four nucleosides, nucleotides, and their analogues, two with no information provided, one alkaloid and its derivatives, one lignan, neolignan, and related compounds, and one organic nitrogen compound. We selected several beneficial upregulated metabolites from those with VIP > 1, including vitamin B1 (thiamine), oxoadipic acid, S-hydroxymethylglutathione, leonuriside A, and isonicotinic acid. Thiamine is a water-soluble vitamin that is widely involved in energy metabolism and the maintenance of nervous system functions in the human body. It is absorbed in the upper part of the small intestine and converted into active forms such as thiamine pyrophosphate (TPP) and thiamine triphosphate (TTP) in the liver, serving as a cofactor for key enzymes in carbohydrate metabolism [67]. A deficiency of thiamine may lead to beriberi, neuritis, indigestion, and cardiovascular problems. Furthermore, the content of organic acids, such as oxoadipic acid in blueberries, is positively correlated with anti-cancer activity, which indicates that oxoadipic acid is beneficial to health [68]. Glutathione is a tripeptide composed of glutamic acid, cysteine, and glycine, and it has multiple physiological functions such as antioxidation, detoxification, and immune regulation. As an important endogenous antioxidant, glutathione is widely used in the food and pharmaceutical fields and can be used to delay aging and enhance immunity [69]. Research has found that leonuriside A not only possesses powerful antioxidant activity but also shows a significant inhibitory effect on the carcinogenic neurotoxin acrylamide, with its inhibitory effect even surpassing that of quercetin and catechin [70,71]. It has been reported that a series of isonicotinic acid derivatives were synthesized and their anti-tuberculosis activities were tested in vitro. Through a multi-target QSAR model, it was found that these derivatives have antibacterial activities against Mycobacterium tuberculosis, Staphylococcus aureus, Escherichia coli, etc. [72]. The fermentation metabolites of Atractylodes chinensis polysaccharides are related to energy metabolism and amino acid metabolism, significantly increasing the level of the insulin sensitizer myo-inositol [64]. Polysaccharides from Rosa roxburghii can stimulate the production of metabolites such as curcumin, 3-feruloylquinic acid, and citrulline after fermentation [49]. The above results indicate that PFP can regulate the metabolic activities of beneficial bacteria in the gut, generating probiotic metabolites with antioxidant and anti-inflammatory activities, thereby exerting beneficial effects on human health.

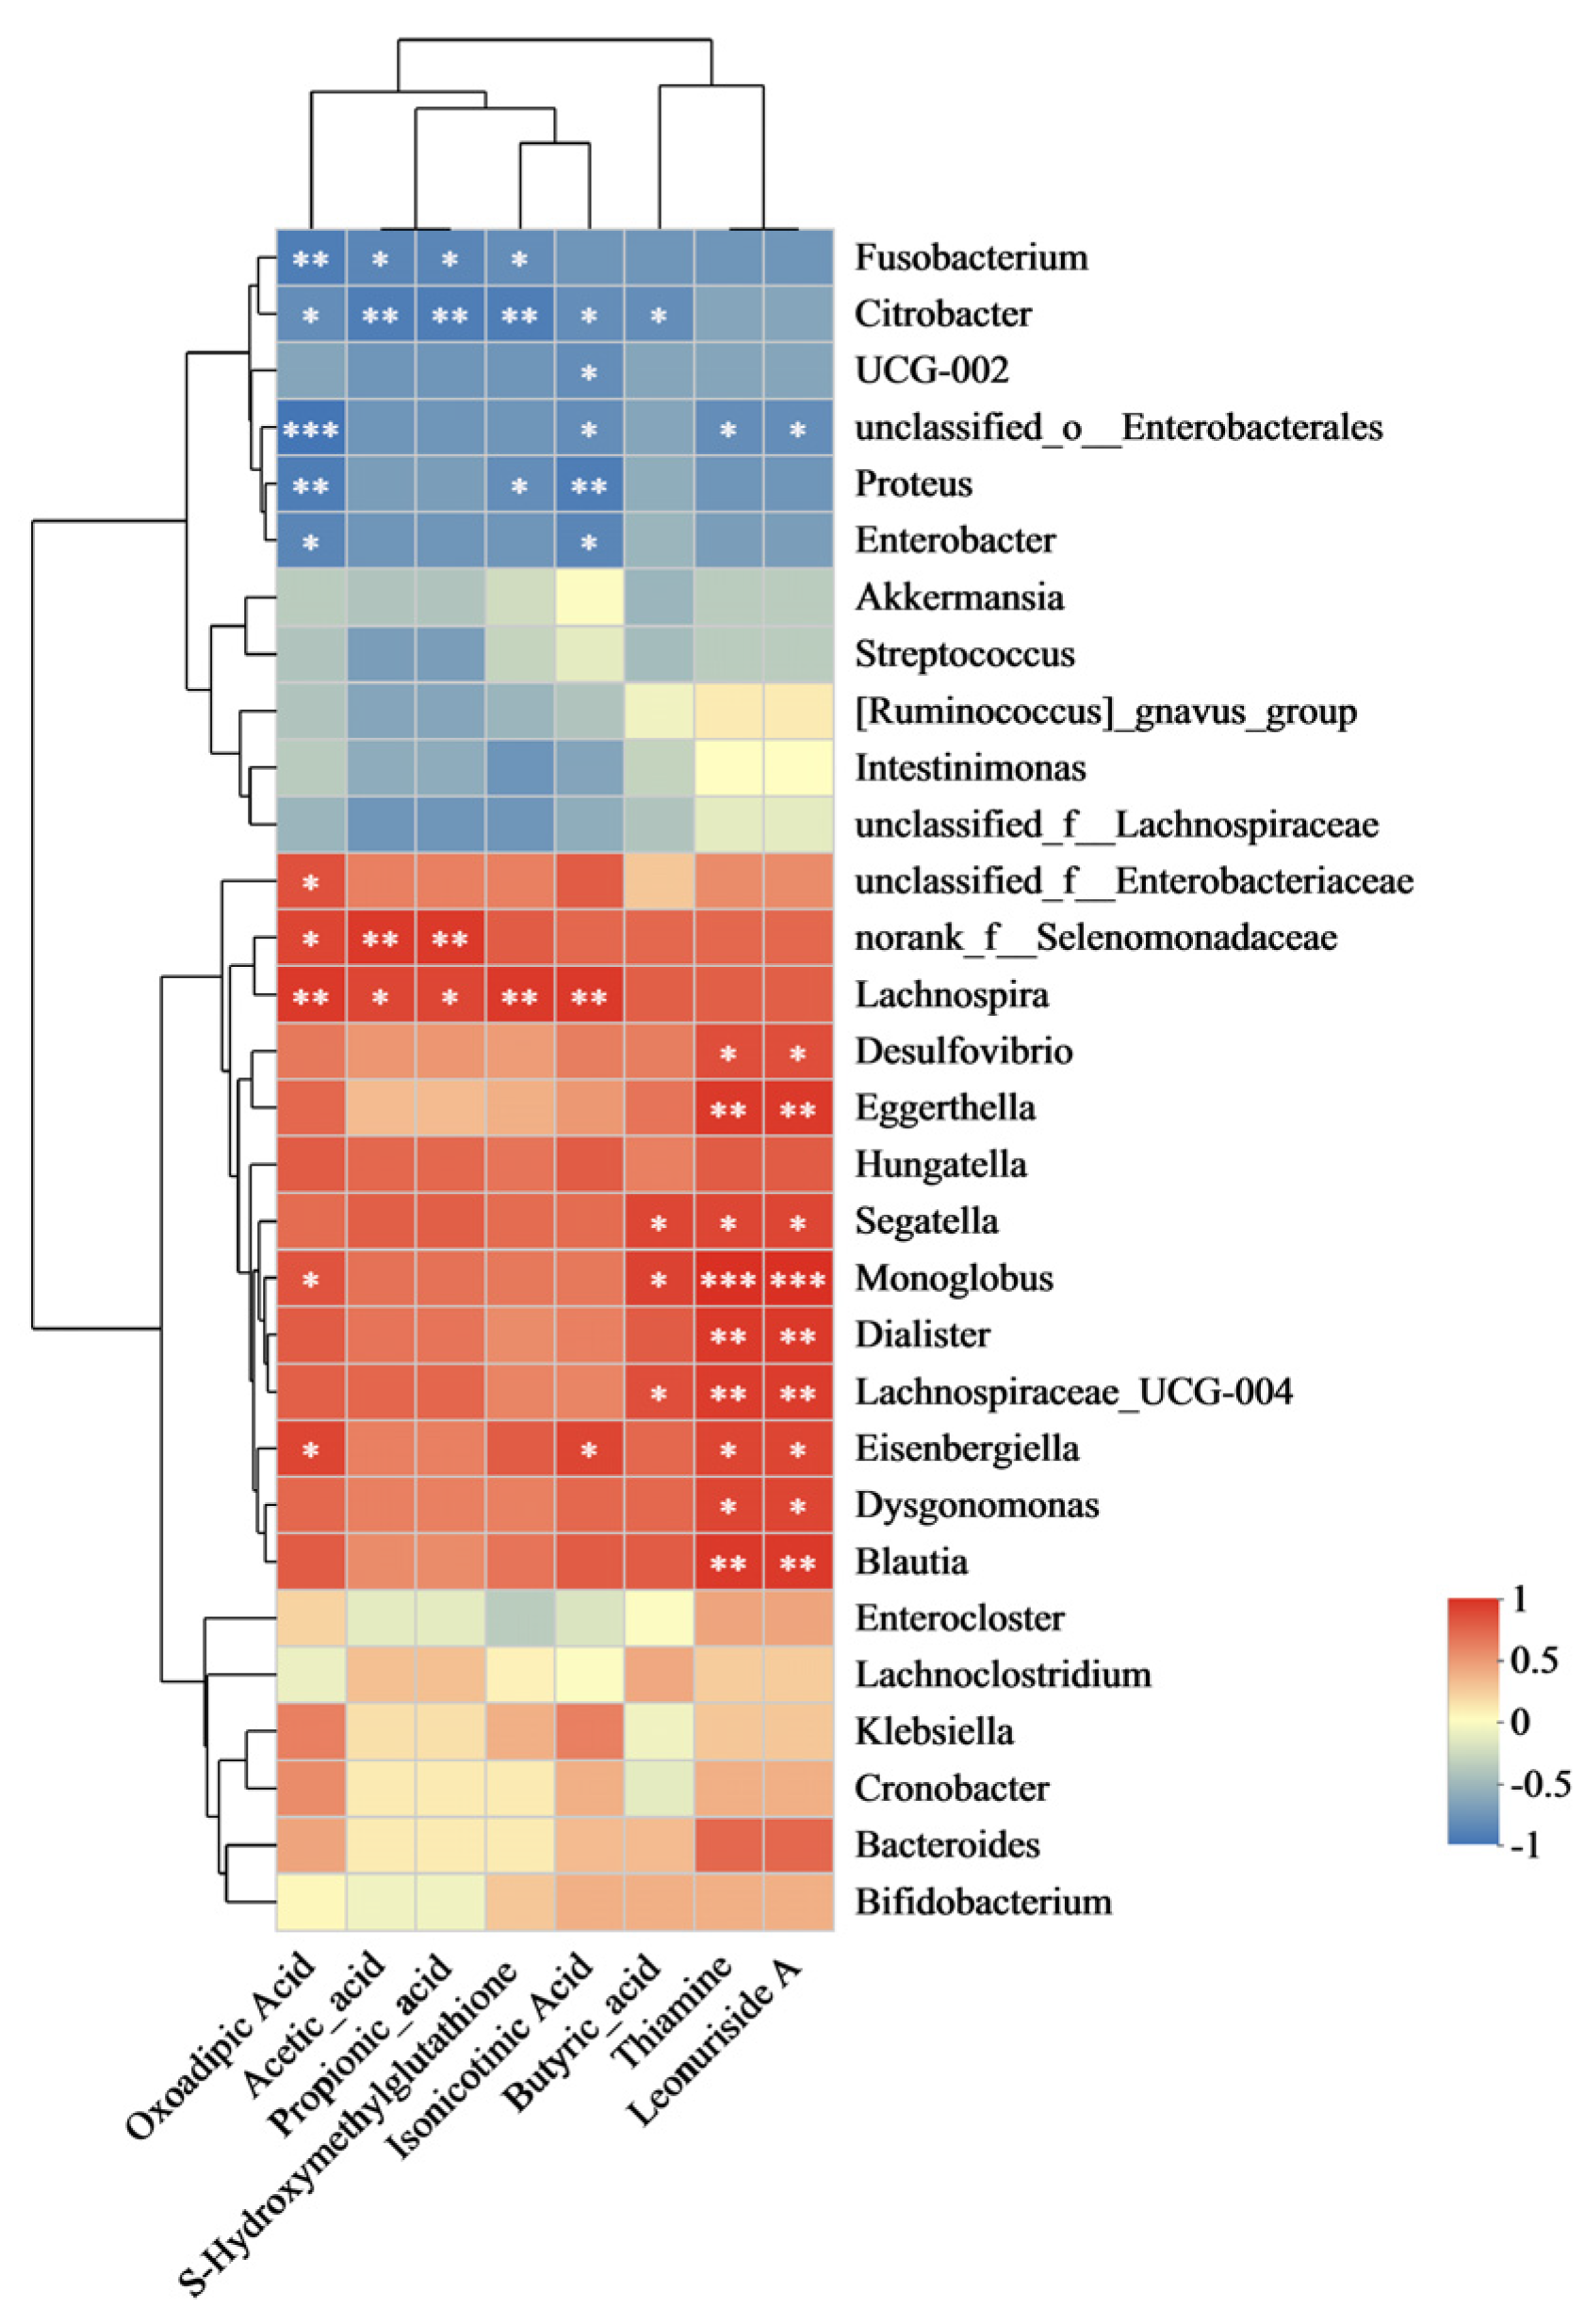
3.3.6. Correlation Between Microbiota and Metabolites

Through Spearman correlation analysis, this study explored the correlations between the top 30 abundant microorganisms at the genus level and metabolites such as SCFAs and thiamine. As shown in Figure 11, the increased abundance of microorganisms such as Monoglobus, Segatella, and Lachnospiraccae_UCG-004 was closely related to the elevated level of butyric acid. Additionally, the abundance changes of these microorganisms, along with those of Dialister, Eisenbergiella, Dysgonomonas, Blautia, and others, are significantly correlated with the elevated levels of differential metabolites such as thiamine and leonuriside A. Lachnospira and norank_f_selenomonadaceae mainly affect the production of acetic acid, propionic acid, and the metabolite oxoadipic acid. Meanwhile, Lachnospira is also related to the abundance of S-hydroxymethylglutathione and isonicotinic acid. The research results show that the intervention of PFP significantly enhanced the correlation between the microbiota and SCFAs as well as beneficial metabolic products, thereby promoting the healthy balance of the intestinal microbiota.

4. Conclusions

In this study, acidic pectin polysaccharide PFP was extracted and purified from Pyracantha fortuneana fruits by acid extraction and alcohol precipitation. The total soluble sugar content of PFP was 95.69%, and the uronic acid content was 70.04%. Its molecular weight was 851.25 kDa, which is that of a typical biological macromolecule. The results showed that PFP was not degraded during the simulated digestion process and could resist different digestive environments in the upper digestive tract, reaching the colon smoothly to participate in fermentation. The simulation fermentation results showed that, through the fermentation of PFP, the residual carbohydrate content and pH value of the fermentation broth were significantly reduced, while the contents of SCFAs such as acetic acid, propionic acid, and n-butyric acid were significantly increased. The intervention of PFP also promoted the proliferation of beneficial bacteria such as Bacteroides, Dialister, and Dysgonomonas, inhibited the growth of harmful bacteria like Proteus, and increased the concentrations of beneficial metabolites such as thiamine, leonuriside A, oxoadipic acid, S-hydroxymethylglutathione, and isonicotinic acid, which are beneficial to human health.
This study has found that PFP has great potential in generating SCFAs and regulating the composition of the intestinal microbiota and its metabolic products to promote intestinal functional health and can be used as a prebiotic. Furthermore, efforts will be devoted to in-depth exploration of the fine structure of PFP to reveal the structure–activity relationship between its structural characteristics and the intestinal microbiota. This research direction not only contributes to the analysis of the mechanism of action of PFP in the intestinal microenvironment but also provides a solid theoretical basis for the systematic study of intestinal functions and promotes further development in related fields.

Supplementary Materials

The following supporting information can be downloaded at https://www.mdpi.com/article/10.3390/foods14091529/s1: Figure S1: (A) PFP gradient elution curves of DEAE cellulose columns; (B) HPGPC profile during PFP purification. Figure S2: Compound classification of the Human Metabolome Database (HMDB).

Author Contributions

Conceptualization: Q.X. and Y.L.; project administration: Q.X. and Y.L.; methodology: Q.X., G.H., Z.G. and J.T.; data curation: Q.X. and X.Y.; writing: Q.X. and Y.L.; funding acquisition: C.W., S.Q. and X.W. All data were generated in-house, and no paper mill was used. All authors have read and agreed to the published version of the manuscript.

Funding

This study was supported by the National Natural Science Foundation of China (No. 32460591), the National Natural Science Foundation of China (No. 32160566) and the National Natural Science Foundation of China (No. 32060518), Guizhou Provincial Science and Technology Projects (ZK [2022] General 114), the Open Foundation of Key Laboratory of Wuliangye-flavor Liquor Solid-state Fermentation, China National Light Industry (2021JJ014), and the Science and Technology Talent Team Project on the application of characteristic microbiology resources in the provincial industry of Guizhou (CXTD [2023]029).

Institutional Review Board Statement

The Human Medicine Experimental Ethical Committee of Guizhou University approved the method of fecal sample collection used in this study (approval code: HMEE-GZU-2023-T064, approved on 13 March 2023). It is hereby confirmed that this study was conducted in strict compliance with the protocol aimed at safeguarding the rights and privacy of all participants.

Informed Consent Statement

Informed consent was obtained from all subjects involved in the study.

Data Availability Statement

The original contributions presented in this study are included in the article/Supplementary Materials. Further inquiries can be directed to the corresponding author.

Conflicts of Interest

The authors declare no conflict of interest.

Abbreviations

The following abbreviations are mainly used in this manuscript:
AraArabinoseMwMolecular weight
AGAApiogalacturonanPFPPyracantha fortuneana polysaccharide
CAZymesCarbohydrate active enzymesPMP1-pheny-3-methyl-5-pyrazolone
DEAEDEAE cellulose DE-23RibRibose
FT-IRFourier transform infraredRhaRhamnose
FucFucoseRG-IRhamnogalacturonan I
GlcGlucoseRG-IIRhamnogalacturonan II
GlcAGlucuronic acidROSReactive oxygen species
GalGalactoseSSFSimulated salivary fluid
GalAGalacturonic acidSGFSimulated gastric fluid
SUSSugar utilization systemSIFSimulated intestinal fluid
QSARQuantitative structure–activity relationshipLC-MSLiquid chromatography–mass spectrometry
HPLCHigh performance liquid chromatographyHPGPCHigh-performance gel permeation chromatography
HGHomogalacturonanUVUltraviolet–Visible
IBDInflammatory bowel diseaseXylXylose
INLinulinXGAXylogalacturonan
LDALinear discriminant analysisSCFAsShort-chain fatty acids
KEGGKyoto Encyclopedia of Genes and GenomesHMDBHuman Metabolome Database

References

  1. Xu, H.; Zhao, C.F.; Tian, G.G.; Qian, L.R.; Yu, L.J. Characterization of active constituents in Pyracantha fortuneana fruit extract and their effects on hyperlipidaemia, obesity, and oxidative stress in rodents. J. Funct. Food. 2016, 22, 278–290. [Google Scholar] [CrossRef]
  2. Wang, L.; Li, R.; Zhang, Q.; Liu, J.; Tao, T.; Zhang, T.; Wu, C.; Ren, Q.; Pu, X.; Peng, W. Pyracantha fortuneana (Maxim.) Li: A comprehensive review of its phytochemistry, pharmacological properties, and product development. Front. Sustain. Food Syst. 2022, 6, 940900. [Google Scholar] [CrossRef]
  3. Li, H.; Fang, W.; Wang, Z.; Chen, Y. Physicochemical, biological properties, and flavour profile of Rosa roxburghii Tratt, Pyracantha fortuneana, and Rosa laevigata Michx fruits: A comprehensive review. Food Chem. 2022, 366, 130509. [Google Scholar] [CrossRef]
  4. Yuan, C.; Wang, C.; Bu, Y.; Xiang, T.; Huang, X.; Wang, Z.; Yi, F.; Ren, G.; Liu, G.; Song, F. Antioxidative and immunoprotective effects of Pyracantha fortuneana (Maxim.) Li polysaccharides in mice. Immunol. Lett. 2010, 133, 14–18. [Google Scholar] [CrossRef]
  5. Yao, Y.; Shu, C.; Feng, G.; Wang, Q.; Yan, Y.; Yi, Y.; Wang, H.; Zhang, X.; Wang, L. Polysaccharides from Pyracantha fortuneana and its biological activity. Int. J. Biol. Macromol. 2020, 150, 1162–1174. [Google Scholar] [CrossRef]
  6. Lv, Y.; Yao, L.; Qiu, M.; Li, L.; Qiu, S.; Liu, Y.; Wei, C. Physicochemical properties, structural characteristics and bioactivities of Pyracantha fortuneana polysaccharides prepared by six methods. Ind. Crop. Prod. 2024, 208, 117933. [Google Scholar] [CrossRef]
  7. Wu, D.; Zheng, J.; Mao, G.; Hu, W.; Ye, X.; Linhardt, R.J.; Chen, S. Rethinking the impact of RG-I mainly from fruits and vegetables on dietary health. Crit. Rev. Food Sci. Nutr. 2020, 60, 2938–2960. [Google Scholar] [CrossRef] [PubMed]
  8. Wu, D.; Ye, X.; Linhardt, R.J.; Liu, X.; Zhu, K.; Yu, C.; Ding, T.; Liu, D.; He, Q.; Chen, S. Dietary pectic substances enhance gut health by its polycomponent: A review. Compr. Rev. Food. Sci. Food Saf. 2021, 20, 2015–2039. [Google Scholar] [CrossRef] [PubMed]
  9. Sahasrabudhe, N.M.; Beukema, M.; Tian, L.; Troost, B.; Scholte, J.; Bruininx, E.; Bruggeman, G.; van den Berg, M.; Scheurink, A.; Schols, H.A.; et al. Dietary Fiber Pectin Directly Blocks Toll-Like Receptor 2-1 and Prevents Doxorubicin-Induced Ileitis. Front. Immunol. 2018, 9, 383. [Google Scholar] [CrossRef]
  10. Cui, J.; Zhao, C.; Feng, L.; Han, Y.; Du, H.; Xiao, H.; Zheng, J. Pectins from fruits: Relationships between extraction methods, structural characteristics, and functional properties. Trends Food Sci. Technol. 2021, 110, 39–54. [Google Scholar] [CrossRef]
  11. Yeung, Y.K.; Kang, Y.; So, B.R.; Jung, S.K.; Chang, Y.H. Structural, antioxidant, prebiotic and anti-inflammatory properties of pectic oligosaccharides hydrolyzed from okra pectin by Fenton reaction. Food Hydrocoll. 2021, 118, 106779. [Google Scholar] [CrossRef]
  12. Zhao, Y.; Bi, J.; Yi, J.; Wu, X.; Ma, Y.; Li, R. Pectin and homogalacturonan with small molecular mass modulate microbial community and generate high SCFAs via in vitro gut fermentation. Carbohydr. Polym. 2021, 269, 118326. [Google Scholar] [CrossRef]
  13. Wang, X.; Zhang, Y.; Liu, Z.; Zhao, M.; Liu, P. Purification, Characterization, and Antioxidant Activity of Polysaccharides Isolated from Cortex Periplocae. Molecules 2017, 22, 1866. [Google Scholar] [CrossRef] [PubMed]
  14. DuBois, M.; Gilles, K.A.; Hamilton, J.K.; Rebers, P.T.; Smith, F. Colorimetric method for determination of sugars and related substances. Anal. Chem. 1956, 28, 350–356. [Google Scholar] [CrossRef]
  15. Yuan, Q.; Lin, S.; Fu, Y.; Nie, X.; Liu, W.; Su, Y.; Han, Q.; Zhao, L.; Zhang, Q.; Lin, D. Effects of extraction methods on the physicochemical characteristics and biological activities of polysaccharides from okra (Abelmoschus esculentus). Int. J. Biol. Macromol. 2019, 127, 178–186. [Google Scholar] [CrossRef]
  16. Filisetti-Cozzi, T.M.; Carpita, N.C. Measurement of uronic acids without interference from neutral sugars. Anal. Biochem. 1991, 197, 157–162. [Google Scholar] [CrossRef]
  17. Wei, C.; Zhang, Y.; He, L.; Cheng, J.; Li, J.; Tao, W.; Mao, G.; Zhang, H.; Linhardt, R.J.; Ye, X. Structural characterization and anti-proliferative activities of partially degraded polysaccharides from peach gum. Carbohydr. Polym. 2019, 203, 193–202. [Google Scholar] [CrossRef]
  18. Brodkorb, A.; Egger, L.; Alminger, M.; Alvito, P.; Assunção, R.; Ballance, S.; Bohn, T.; Bourlieu-Lacanal, C.; Boutrou, R.; Carrière, F. INFOGEST static in vitro simulation of gastrointestinal food digestion. Nat. Protoc. 2019, 14, 991–1014. [Google Scholar] [CrossRef]
  19. Fang, C.; Chen, G.; Kan, J. Characterization and in vitro simulated gastrointestinal digestion and fermentation of Mentha haplocalyx polysaccharide. Int. J. Biol. Macromol. 2022, 222, 360–372. [Google Scholar] [CrossRef]
  20. Minekus, M.; Alminger, M.; Alvito, P.; Ballance, S.; Bohn, T.; Bourlieu, C.; Carrière, F.; Boutrou, R.; Corredig, M.; Dupont, D. A standardised static in vitro digestion method suitable for food–an international consensus. Food Funct. 2014, 5, 1113–1124. [Google Scholar] [CrossRef]
  21. Miller, G.L. Use of dinitrosalicylic acid reagent for determination of reducing sugar. Anal. Chem. 1959, 31, 426–428. [Google Scholar] [CrossRef]
  22. Chen, G.; Xie, M.; Wan, P.; Chen, D.; Ye, H.; Chen, L.; Zeng, X.; Liu, Z. Digestion under saliva, simulated gastric and small intestinal conditions and fermentation in vitro by human intestinal microbiota of polysaccharides from Fuzhuan brick tea. Food Chem. 2018, 244, 331–339. [Google Scholar] [CrossRef] [PubMed]
  23. Wu, D.; Nie, X.; Gan, R.; Guo, H.; Fu, Y.; Yuan, Q.; Zhang, Q.; Qin, W. In vitro digestion and fecal fermentation behaviors of a pectic polysaccharide from okra (Abelmoschus esculentus) and its impacts on human gut microbiota. Food Hydrocoll. 2021, 114, 106577. [Google Scholar] [CrossRef]
  24. Ye, K.; Fu, C.; Ma, S.; Du, H.; Chen, S.; Liu, D.; Ma, G.; Xiao, H. Comprehensive assessment of Hypsizygus marmoreus polysaccharides through simulated digestion and gut microbiota fermentation in vitro. Food Hydrocoll. 2023, 144, 108989. [Google Scholar] [CrossRef]
  25. Wei, C.; Liao, N.; Zhang, Y.; Ye, X.; Li, S.; Hu, Y.; Liu, D.; Linhardt, R.J.; Wang, X.; Chen, S. In vitro fermentation behaviors of fucosylated chondroitin sulfate from Pearsonothuria graeffei by human gut microflora. Int. J. Biol. Macromol. 2017, 102, 1195–1201. [Google Scholar] [CrossRef] [PubMed]
  26. Xie, M.; Chen, W.; Lai, X.; Dai, H.; Sun, H.; Zhou, X.; Chen, T. Metabolic responses and their correlations with phytochelatins in Amaranthus hypochondriacus under cadmium stress. Environ. Pollut. 2019, 252, 1791–1800. [Google Scholar] [CrossRef]
  27. Chen, X.; Zhang, H.; Du, W.; Qian, L.; Xu, Y.; Huang, Y.; Xiong, Q.; Li, H.; Yuan, J. Comparison of different extraction methods for polysaccharides from Crataegus pinnatifida Bunge. Int. J. Biol. Macromol. 2020, 150, 1011–1019. [Google Scholar] [CrossRef]
  28. Vasilieva, T.; Sigarev, A.; Kosyakov, D.; Ul Yanovskii, N.; Anikeenko, E.; Chuhchin, D.; Ladesov, A.; Hein, A.M.; Miasnikov, V. Formation of low molecular weight oligomers from chitin and chitosan stimulated by plasma-assisted processes. Carbohydr. Polym. 2017, 163, 54–61. [Google Scholar] [CrossRef] [PubMed]
  29. Gong, P.; Wu, Y.; Liu, Y.; Lv, S.; You, Y.; Zhou, Z.; Chen, X.; Li, H. Structure and hypoglycemic effect of a neutral polysaccharide isolated from sea cucumber Stichopus japonicus. Int. J. Biol. Macromol. 2022, 216, 14–23. [Google Scholar] [CrossRef]
  30. Holloway, W.D.; Tasman-Jones, C.; Maher, K. Pectin digestion in humans. Am. J. Clin. Nutr. 1983, 37, 253–255. [Google Scholar] [CrossRef]
  31. Ferreira-Lazarte, A.; Moreno, F.J.; Cueva, C.; Gil-Sánchez, I.; Villamiel, M. Behaviour of citrus pectin during its gastrointestinal digestion and fermentation in a dynamic simulator (simgi®). Carbohydr. Polym. 2019, 207, 382–390. [Google Scholar] [CrossRef] [PubMed]
  32. Elshahed, M.S.; Miron, A.; Aprotosoaie, A.C.; Farag, M.A. Pectin in diet: Interactions with the human microbiome, role in gut homeostasis, and nutrient-drug interactions. Carbohydr. Polym. 2021, 255, 117388. [Google Scholar] [CrossRef] [PubMed]
  33. Yuan, Q.; He, Y.; Xiang, P.; Wang, S.; Cao, Z.; Gou, T.; Shen, M.; Zhao, L.; Qin, W.; Gan, R.; et al. Effects of simulated saliva-gastrointestinal digestion on the physicochemical properties and bioactivities of okra polysaccharides. Carbohydr. Polym. 2020, 238, 116183. [Google Scholar] [CrossRef] [PubMed]
  34. Wei, C.; Yao, L.; Zhang, L.; Zhang, Y.; Luo, Q.; Qiu, S.; Zeng, X.; Chen, S.; Ye, X. In Vitro Digestion and Fecal Fermentation of Peach Gum Polysaccharides with Different Molecular Weights and Their Impacts on Gut Microbiota. Foods 2022, 11, 3970. [Google Scholar] [CrossRef]
  35. Fu, C.; Ye, K.; Ma, S.; Du, H.; Chen, S.; Liu, D.; Ma, G.; Xiao, H. Simulated gastrointestinal digestion and gut microbiota fermentation of polysaccharides from Agaricus bisporus. Food Chem. 2023, 418, 135849. [Google Scholar] [CrossRef]
  36. Zhao, Y.; Bi, J.; Zhao, X.; Engelsen, S.B.; Wu, X.; Ma, Y.; Guo, Y.; Du, Q.; Yi, J. New insight into pectic fractions of cell wall: Impact of extraction on pectin structure and in vitro gut fermentation. Int. J. Biol. Macromol. 2023, 253, 127515. [Google Scholar] [CrossRef]
  37. Williams, B.A.; Grant, L.J.; Gidley, M.J.; Mikkelsen, D. Gut Fermentation of Dietary Fibres: Physico-Chemistry of Plant Cell Walls and Implications for Health. Int. J. Mol. Sci. 2017, 18, 2203. [Google Scholar] [CrossRef]
  38. Cui, J.; Lian, Y.; Zhao, C.; Du, H.; Han, Y.; Gao, W.; Xiao, H.; Zheng, J. Dietary Fibers from Fruits and Vegetables and Their Health Benefits via Modulation of Gut Microbiota. Compr. Rev. Food. Sci. Food Saf. 2019, 18, 1514–1532. [Google Scholar] [CrossRef]
  39. Hu, J.; Nie, S.; Li, C.; Xie, M. In vitro fermentation of polysaccharide from the seeds of Plantago asiatica L. by human fecal microbiota. Food Hydrocoll. 2013, 33, 384–392. [Google Scholar] [CrossRef]
  40. Tian, L.; Scholte, J.; Borewicz, K.; van den Bogert, T.; Smidt, H.; Scheurink, A.; Gruppen, H.; Schols, H.A. Effects of pectin supplementation on the fermentation patterns of different structural carbohydrates in rats. Mol. Nutr. Food Res. 2016, 60, 2256–2266. [Google Scholar] [CrossRef]
  41. Liu, C.; Du, P.; Cheng, Y.; Guo, Y.; Hu, B.; Yao, W.; Zhu, X.; Qian, H. Study on fecal fermentation characteristics of aloe polysaccharides in vitro and their predictive modeling. Carbohydr. Polym. 2021, 256, 117571. [Google Scholar] [CrossRef] [PubMed]
  42. Bai, Y.; Zhou, Y.; Zhang, R.; Chen, Y.; Wang, F.; Zhang, M. Gut microbial fermentation promotes the intestinal anti-inflammatory activity of Chinese yam polysaccharides. Food Chem. 2023, 402, 134003. [Google Scholar] [CrossRef]
  43. Jakobsdottir, G.; Xu, J.; Molin, G.; Ahrné, S.; Nyman, M. High-Fat Diet Reduces the Formation of Butyrate, but Increases Succinate, Inflammation, Liver Fat and Cholesterol in Rats, while Dietary Fibre Counteracts These Effects. PLoS ONE 2013, 8, e80476. [Google Scholar] [CrossRef]
  44. Tan, J.; Mckenzie, C.; Potamitis, M.; Thorburn, A.; Mackay, C.; Macia, L. The Role of Short-Chain Fatty Acids in Health and Disease. Adv. Immunol. 2014, 121, 91–119. [Google Scholar] [PubMed]
  45. den Besten, G.; van Eunen, K.; Groen, A.K.; Venema, K.; Reijngoud, D.; Bakker, B.M. The role of short-chain fatty acids in the interplay between diet, gut microbiota, and host energy metabolism. J. Lipid Res. 2013, 54, 2325–2340. [Google Scholar] [CrossRef] [PubMed]
  46. Le Chatelier, E.; Nielsen, T.; Qin, J.; Prifti, E.; Hildebrand, F.; Falony, G.; Almeida, M.; Arumugam, M.; Batto, J.; Kennedy, S.; et al. Richness of human gut microbiome correlates with metabolic markers. Nature 2013, 500, 541. [Google Scholar] [CrossRef]
  47. Meroni, M.; Longo, M.; Dongiovanni, P. Alcohol or Gut Microbiota: Who Is the Guilty? Int. J. Mol. Sci. 2019, 20, 4568. [Google Scholar] [CrossRef]
  48. Muñoz-Fernandez, S.S.; Garcez, F.B.; Alencar, J.C.G.; Bastos, A.A.; Morley, J.E.; Cederholm, T.; Aprahamian, I.; de Souza, H.P.; Avelino-Silva, T.J.; Bindels, L.B.; et al. Gut microbiota disturbances in hospitalized older adults with malnutrition and clinical outcomes. Nutrition 2024, 122, 112369. [Google Scholar] [CrossRef]
  49. Chen, Z.; Yuan, X.; Tu, T.; Wang, L.; Mao, Y.; Luo, Y.; Qiu, S.; Song, A. Characterization and prebiotic potential of polysaccharides from Rosa roxburghii Tratt pomace by ultrasound-assisted extraction. Int. J. Biol. Macromol. 2024, 268, 131910. [Google Scholar] [CrossRef]
  50. Wardman, J.F.; Bains, R.K.; Rahfeld, P.; Withers, S.G. Carbohydrate-active enzymes (CAZymes) in the gut microbiome. Nat. Rev. Microbiol. 2022, 20, 542–556. [Google Scholar] [CrossRef]
  51. Li, L.; Chen, X.; Zhu, J.; Zhang, S.; Chen, S.; Liu, X.; Li, L.; Yan, J. Advances and challenges in interaction between heteroglycans and Bifidobacterium: Utilization strategies, intestinal health and future perspectives. Trends Food Sci. Technol. 2023, 134, 112–122. [Google Scholar] [CrossRef]
  52. Kmezik, C.; Mazurkewich, S.; Meents, T.; McKee, L.S.; Idström, A.; Armeni, M.; Savolainen, O.; Brändén, G.; Larsbrink, J. A polysaccharide utilization locus from the gut bacterium Dysgonomonas mossii encodes functionally distinct carbohydrate esterases. J. Biol. Chem. 2021, 296, 100500. [Google Scholar] [CrossRef]
  53. Yu, Y.; Wu, L.; Liu, X.; Zhao, L.; Li, L.; Jin, M.; Yu, X.; Liu, F.; Li, Y.; Li, L.; et al. In vitro simulated digestion and fermentation characteristics of pectic polysaccharides from fresh passion fruit (Passiflora edulis f. flavicarpa L.) peel. Food Chem. 2024, 452, 139606. [Google Scholar] [CrossRef] [PubMed]
  54. Gamage, H.K.A.H.; Tetu, S.G.; Chong, R.W.W.; Ashton, J.; Packer, N.H.; Paulsen, I.T. Cereal products derived from wheat, sorghum, rice and oats alter the infant gut microbiota in vitro. Sci Rep. 2017, 7, 14312. [Google Scholar] [CrossRef] [PubMed]
  55. Valles-Colomer, M.; Falony, G.; Darzi, Y.; Tigchelaar, E.F.; Wang, J.; Tito, R.Y.; Schiweck, C.; Kurilshikov, A.; Joossens, M.; Wijmenga, C.; et al. The neuroactive potential of the human gut microbiota in quality of life and depression. Nat. Microbiol. 2019, 4, 623–632. [Google Scholar] [CrossRef]
  56. Xia, C.; Xu, X.; Zhang, R.; Su, D.; Jia, X.; Deng, M.; Lee, Y.; Zhang, M.; Huang, F. Effects of molecular weight on simulated digestion and fecal fermentation of polysaccharides from longan pulp in vitro. Int. J. Biol. Macromol. 2025, 306, 141711. [Google Scholar] [CrossRef]
  57. Rawat, P.S.; Li, Y.; Zhang, W.X.; Meng, X.F.; Liu, W.F. Hungatella hathewayi, an Efficient Glycosaminoglycan-Degrading Firmicutes from Human Gut and Its Chondroitin ABC Exolyase with High Activity and Broad Substrate Specificity. Appl. Environ. Microbiol. 2022, 88, e01546-22. [Google Scholar] [CrossRef]
  58. Sheridan, P.O.; Martin, J.C.; Lawley, T.D.; Browne, H.P.; Harris, H.; Bernalier-Donadille, A.; Duncan, S.H.; O’Toole, P.W.; Scott, K.P.; Flint, H.J. Polysaccharide utilization loci and nutritional specialization in a dominant group of butyrate-producing human colonic Firmicutes. Microb. Genom. 2016, 2, e000043. [Google Scholar] [CrossRef]
  59. Zha, Z.; Lv, Y.; Tang, H.; Li, T.; Miao, Y.; Cheng, J.; Wang, G.; Tan, Y.; Zhu, Y.; Xing, X.; et al. An orally administered butyrate-releasing xylan derivative reduces inflammation in dextran sulphate sodium-induced murine colitis. Int. J. Biol. Macromol. 2020, 156, 1217–1233. [Google Scholar] [CrossRef]
  60. Sun, T.; Liang, X.; Xu, X.; Wang, L.; Xiao, W.; Ma, Y.; Wang, R.; Gu, Y.; Li, S.; Qiu, Y.; et al. In vitro digestion and fecal fermentation of basidiospore-derived exopolysaccharides from Naematelia aurantialba. Int. J. Biol. Macromol. 2024, 261, 129756. [Google Scholar] [CrossRef]
  61. Liang, X.; Liu, M.; Yao, A.; Cui, W.; Wei, Y.; Guo, S.; Duan, J.; Kang, H.; Zhou, X.; Su, S.; et al. In vitro fermentation characteristics and interaction of neutral and acidic polysaccharides from Lycii fructus on human gut microbiota. Food Hydrocoll. 2024, 152, 109940. [Google Scholar] [CrossRef]
  62. Kim, C.C.; Kelly, W.J.; Patchett, M.L.; Tannock, G.W.; Jordens, Z.; Stoklosinski, H.M.; Taylor, J.W.; Sims, I.M.; Bell, T.J.; Rosendale, D.I. Monoglobus pectinilyticus gen. nov., sp nov., a pectinolytic bacterium isolated from human faeces. Int. J. Syst. Evol. Microbiol. 2017, 67, 4992–4998. [Google Scholar] [CrossRef]
  63. Ji, X.; Hou, C.; Zhang, X.; Han, L.; Yin, S.; Peng, Q.; Wang, M. Microbiome-metabolomic analysis of the impact of Zizyphus jujuba cv. Muzao polysaccharides consumption on colorectal cancer mice fecal microbiota and metabolites. Int. J. Biol. Macromol. 2019, 131, 1067–1076. [Google Scholar] [CrossRef]
  64. Zhang, X.; Ma, Q.; Jia, L.; He, H.; Zhang, T.; Jia, W.; Zhu, L.; Qi, W.; Wang, N. Effects of in vitro fermentation of Atractylodes chinensis (DC.) Koidz. polysaccharide on fecal microbiota and metabolites in patients with type 2 diabetes mellitus. Int. J. Biol. Macromol. 2023, 253, 126860. [Google Scholar] [CrossRef]
  65. Hong, Y.; Li, B.B.; Zheng, N.N.; Wu, G.S.; Ma, J.L.; Tao, X.; Chen, L.L.; Zhong, J.; Sheng, L.L.; Li, H.K. Integrated Metagenomic and Metabolomic Analyses of the Effect of Astragalus Polysaccharides on Alleviating High-Fat Diet-Induced Metabolic Disorders. Front. Pharmacol. 2020, 11, 833. [Google Scholar] [CrossRef]
  66. Ye, Y.; Xu, Y.; Ji, J.; Zhang, Y.; Feng, Y.; Sun, X. Polysaccharides extracted from Polygonatum sibiricum alleviate intestine-liver-kidney axis injury induced by citrinin and alcohol co-exposure in mice. Food Chem. Toxicol. 2025, 197, 115314. [Google Scholar] [CrossRef] [PubMed]
  67. Jian, Y.; Song, J.; Chen, Z.; Zhou, D.; Kong, Y.; Liu, Y.; Zhang, Y.; Bai, H.; Ding, Z. Dietary thiamine enhances thiamine transport, carbohydrate absorption, glycolysis, and antioxidant properties in Macrobrachium nipponense when fed a high-carbohydrate diet. Aquacult. Rep. 2024, 39, 102400. [Google Scholar] [CrossRef]
  68. Das, P.R.; Darwish, A.G.; Ismail, A.; Haikal, A.M.; Gajjar, P.; Balasubramani, S.P.; Sheikh, M.B.; Tsolova, V.; Soliman, K.F.A.; Sherif, S.M.; et al. Diversity in blueberry genotypes and developmental stages enables discrepancy in the bioactive compounds, metabolites, and cytotoxicity. Food Chem. 2022, 374, 131632. [Google Scholar] [CrossRef] [PubMed]
  69. Gao, H.; Zhang, J.; Huang, Z.; Zhang, X.; Rao, Z.; Xu, M. The maintenance of redox homeostasis to regulate efficient glutathione metabolism in Corynebacterium glutamicum. Chem. Eng. J. 2025, 506, 160237. [Google Scholar] [CrossRef]
  70. Sugaya, K.; Hashimoto, F.; Ono, M.; Ito, Y.; Masuoka, C.; Nohara, T. Anti-Oxidative Constituents from Leonurii Herba (Leonurus japonicus). Food Sci. Technol. Int. 1998, 4, 278–281. [Google Scholar] [CrossRef]
  71. Nie, H.; Huang, S.; Li, X.; Gong, J.; Wu, F.; Yin, J.; Liao, Y.; Wu, S.; Luo, Y. Identification of compounds from chufa (Eleocharis dulcis) peels with inhibitory acrylamide formation activity. Rev. Bras. Farmacogn. 2019, 29, 483–487. [Google Scholar] [CrossRef]
  72. Judge, V.; Narasimhan, B.; Ahuja, M.; Sriram, D.; Yogeeswari, P.; De Clercq, E.; Pannecouque, C.; Balzarini, J. Isonicotinic acid hydrazide derivatives: Synthesis, antimicrobial activity, and QSAR studies. Med. Chem. Res. 2012, 21, 1451–1470. [Google Scholar] [CrossRef]
Figure 1. (A) Structural diagram of typical regions in pectin; (B) experimental scheme of PFP digestion and fermentation in vitro. Note: SSF (simulated saliva digestive fluid), SGF (simulated gastric digestive fluid), SIF (simulated intestinal digestive fluid), Mw (molecular weight), SCFAs (short-chain fatty acids). A, B, and C represent different experimental groups. The in vitro gastrointestinal digestion method shown in (B) follows the INFOGEST protocol.
Foods 14 01529 g001
Figure 2. (A) HPGPC chromatogram of PFP, (B) HPLC analysis of the monosaccharide composition of PFP and the standard product, (C) UV spectra of PFP, and (D) FT-IR spectra of PFP.
Foods 14 01529 g002
Figure 3. Molecular weight changes of PFP during oral (A), gastric (B), and intestinal (C) digestion.
Foods 14 01529 g003
Figure 4. (A) HPGPC chromatogram of PFP in fermentation broth at different times in vitro; (B) changes of monosaccharide composition during in vitro fermentation of PFP at different times.
Foods 14 01529 g004
Figure 5. Changes in pH of PFP and inulin sugar at different fermentation times. Different letters indicate significant differences in pH (p < 0.05).
Foods 14 01529 g005
Figure 6. Microbial α diversity dilution curve: (A) Sobs, and (B) Shannon.
Foods 14 01529 g006
Figure 7. Microbial β diversity analysis: (A) sample level clustering, (B) PCA analysis, and (C) Venn diagram.
Foods 14 01529 g007
Figure 8. Microbial composition at the (A) phylum and (B) genus level, and (C) changes in the most abundant microbiota at the genus level.
Foods 14 01529 g008
Figure 9. LEfSe showed significant differences in microbiota between the different groups. (A) LDA score; (B) LEfSe multilevel species hierarchy tree. Note: Yellow dots indicate species without significant differences.
Foods 14 01529 g009
Figure 10. Metabolite PCA analysis, showing the (A) positive ion model and (B) negative ion model; (C) KEGG functional pathway analysis; (D) differential metabolites of PFP vs. Blank; (E) differential metabolite categories based on KEGG pathways; (F) volcano plot of differential metabolites. *, p < 0.05; **, p < 0.01; ***, p < 0.001.
Foods 14 01529 g010
Figure 11. Correlation analysis of gut microbiota and metabolites. *, p < 0.05; **, p < 0.01; ***, p < 0.001.
Foods 14 01529 g011
Table 1. Mw, physicochemical index, and monosaccharide composition of PFP.
PFPData
Mw (Da)8.51 × 10⁵ ± 0.19
DM (%)69.93 ± 0.17
Chemical composition (%)
Total soluble sugars95.69 ± 1.9
Uronic acid70.04 ± 1.75
Monosaccharide composition (%)
Rha3.59 ± 0.06 d
GalA82.53 ± 0.24 a
Glc1.99 ± 0.10 e
Gal4.89 ± 0.08 c
Ara7.00 ± 0.01 b
Note: Mw: molecular weight, DM: degree of methylation, Rha: rhamnose, GalA: galacturonic acid, Glc: glucose, Gal: galactose, Ara: arabinose. Different letters indicate significant differences (p < 0.05).
Table 2. Changes in reducing sugar content during simulated digestion of PFP in vitro.
ProcessTimeReducing Sugar (mg/mL)
Saliva digestion0 min0.0659 ± 0.0017 b
2 min0.0679 ± 0.0010 b
Gastric juice digestion0 h0.0859 ± 0.0004 a
1 h0.0870 ± 0.0007 a
2 h0.0870 ± 0.0001 a
Small intestinal digestion0 h0.0463 ± 0.0004 c
1 h0.0475 ± 0.0011 c
2 h0.0492 ± 0.0008 c
Different letters indicate significant differences (p < 0.05).
Table 3. Changes in the sugar content of PFP and inulin under different fermentation times.
Fermentation Time (h)Remaining Total Soluble Sugar
(% Initial)
Residual Uronic Acid
(% Initial)
Reducing Sugar (mg/mL)
PFPINL
0100 ± 0 a100 ± 0 a100 ± 0 a0.24 ± 0.001 e
680.91 ± 0.58 b95.67 ± 1.74 b77.59 ± 1.32 b0.29 ± 0.002 c
1280.16 ± 0.56 c88.04 ± 1.51 c69.23 ± 2.15 c0.33 ± 0.002 b
2459.46 ± 0.49 d53.57 ± 0.85 d62.91 ± 0.39 d0.36 ± 0.001 a
4826.47 ± 0.13 e22.79 ± 0.45 e48.07 ± 1.2 e0.27 ± 0 d
Different letters indicate significant differences (p < 0.05). INL in the picture is inulin.
Table 4. Individual and total SCFA content of PFP after fermentation.
SampleAcetic Acid
(mmol/L)
Propionic Acid
(mmol/L)
Isobutyric Acid
(mmol/L)
Butyric Acid
(mmol/L)
Isovaleric Acid
(mmol/L)
Valeric Acid
(mmol/L)
Total SCFAs
(mmol/L)
Blank8.12 ± 1.15 aD4.16 ± 0.48 bF0.98 ± 0.03 cH1.38 ± 0.22 cH0.81 ± 0.08 cH0.78 ± 0.05 cH16.23
INL14.29 ± 0.41 aB6.50 ± 0.42 cE0.91 ± 0.00 dH8.93 ± 0.66 bC0.66 ± 0.02 dH0.78 ± 0.01 dH32.07
PFP29.18 ± 0.64 aA6.92 ± 0.11 bE1.00 ± 0.01 dH3.24 ± 0.08 cG0.87 ± 0.02 dH1.23 ± 0.02 dH42.44
Analyzed in at least three replicates (n = 3). Lowercase letters indicate significant differences between samples in the same group (p < 0.05), and uppercase letters indicate significant differences between sample groups (p < 0.05).
Disclaimer/Publisher’s Note: The statements, opinions and data contained in all publications are solely those of the individual author(s) and contributor(s) and not of MDPI and/or the editor(s). MDPI and/or the editor(s) disclaim responsibility for any injury to people or property resulting from any ideas, methods, instructions or products referred to in the content.

