1. Introduction
Litchi belongs to the subtropical Sapindaceae family of fruits, mainly ripening in the summer, and is categorized as a non-respiratory trans-variable fruit, and its largest production area is in China, where litchi is not only abundant with nutrients, but also of high edible value [
1]. Due to the strong respiration of litchi itself [
2], its metabolic activity is particularly vigorous under high temperature conditions, resulting in rapid variations in the flavor and quality of the fruit [
3]. A high temperature after harvesting will accelerate the enzymatic reaction as well as increase the water loss rate of litchi pericarp, which will decrease the content of anthocyanin glycosides in the pericarp, and ultimately lead to browning or even rotting [
4]. As a result, the commercial value of the fruit and its edible quality will be significantly reduced. In the traditional marketing pattern, litchi typically enter fruit markets or stores in large-scale batches, at which time refrigerated trucks are often utilized to maintain their freshness [
5]. However, in an e-commerce environment, consumers are mostly individuals who buy litchi mainly for personal consumption rather than for commercial purposes, so the demand is relatively small. For such small orders, using refrigerated trucks for delivery is not cost-effective. Instead, “foam container + ice packs” has become a common way of transporting litchi in e-commerce logistics [
6,
7].
In the meantime, this form of packaging should pay attention to some problems. Firstly, the temperature stability inside the foam container is poor, due to the accelerated melting speed of the ice packs, it is difficult to maintain a low-temperature state for a long time. In addition, there are many factors affecting the internal temperature of the foam container, making accurate prediction and control of e-commerce logistics process packaging environment temperature becomes complicated and uncertain [
8]. These include, but are not limited to, the number of ice packs at the initial time, the temperature and weight of the litchi at the time of pre-cooling, the characteristics of the foam container (e.g., the material of the foam container, the degree of foaming, and the physical dimensions and thickness of the foam container, etc.), and whether or not additional insulation measures (e.g., the addition of heat-insulating film) have been used. These issues increase the possibility of transporting litchi under high temperature conditions [
9]. Increasing temperature in the packaging environment will cause the vapor pressure on the surface of the litchi pericarp increase, thus prompting the water in the pericarp to migrate outward more easily, exacerbating the water loss phenomenon [
10,
11]. The water loss process will accelerate the degradation of anthocyanin in the litchi pericarp, leading to a decrease in the red pigment content of the litchi pericarp and browning [
12]. Additionally, packing under high temperature environment enhances the activity of intracellular enzymes as well as the metabolic rate of the plant. Under such conditions, the activities of PPO (Peroxidase Oxidase) and POD (Polyphenol Oxidase) were higher [
13], resulting in more vigorous physiological activities in litchi, which further accelerated the deterioration of the pericarp condition and promoted the rapid consumption of litchi’s own organic matter, ultimately affecting its flavor and the structural hardness of the fruit [
14]. At the same time, the increase in temperature inside the package also accelerates the growth rate of fungus on the pericarp of litchi, triggering the problem of decay [
15]. Once the litchi pericarp starts to break and rot, it will change the nutrient distribution inside the package, providing a suitable growth environment for more putrefactive fungi, leading to their massive reproduction [
16]. During e-commerce logistics transportation, too much litchi will also put the lower layer under more pressure [
17]. When this pressure exceeds a certain limit, it may cause friction or extrusion damage to the bottom layer of litchi, not only by increasing the risk of damage to the fruit skin, but also by providing an opportunity for the invasion of spoilage fungus [
18], which ultimately results in a more serious situation of fruit rot. In addition, in the case of poor road conditions, litchi will also collide with each other to transfer vibration because of vibration, these are unfavorable to litchi e-commerce logistics preservation. According to logistics statistics, annual losses due to improper treatment in China account for about 20% of the current year’s litchi production [
19,
20]. In the context of pursuing the goals of “carbon peak” and subsequent “carbon neutrality”, there is a crucial need for further academic inquiry into strategies that could effectively reduce fresh fruit loss during litchi transportation and minimize cold loss associated with packaging. This necessitates a comprehensive and in-depth exploration of practical and viable solutions to enhance resource efficiency and mitigate environmental impact.
In summary, the ‘foam container + ice pack’ is a prevalent packaging method in fresh fruit e-commerce logistics, effectively extending litchi’s post-harvest shelf life. Nonetheless, this method presents unresolved issues, such as the unclear impact of packaging on environmental conditions and litchi quality making it complicated to standardized technical protocols [
9]. There has been some global research on optimizing packaging and transport strategies for fruits and vegetables. Kyle et al. [
21] found that foam trays reduce vibration sensitivity in apples during transit, EPS trays provided better shock protection to the apple as compared to the MF (Molded Fiber) tray, reducing the impact acceleration by more than 70%. Xie et al. [
22] demonstrated that ice packs better preserve the quality of flat peaches in foam containers compared to ice films. Zhang et al. [
23] advocated the use of spaced ice pack arrangements in foam containers to improve cold source utilization and maintain oyster weight. Survival of oysters transported for 2 d in this case reached 92%, Singh [
24,
25] and Batt [
26] investigated the vibration simulation and damage response of EPS and MF foam materials on fruits and vegetables. Feng [
27] examined the impact of different ice quantities on the logistics temperature of pasteurized milk during air transport, recommending a 20% ice ratio for 24 h flights and no more than 40% for durations exceeding 48 h.
Pre-cooling treatment plays a pivotal role in the “first mile” in the realization of fresh transportation of litchi [
28]. Through the implementation of pre-cooling, could effectively eliminate the field heat carried by litchi and reduce its temperature, while significantly inhibiting the respiratory rate of litchi [
29,
30]. In view of the high specific heat capacity of litchi itself, the pre-cooled litchi has a stronger resistance to temperature increase, thus enhancing the adaptability to high-temperature environments. Therefore, the pre-cooled litchi could more effectively maintain the stability of its quality and color in the subsequent logistics distribution. Research on post-harvest pre-cooling optimization includes Zhang et al. [
31], who found CWPC (Cold-water precooling) and RPC (Refrigerator precooling) methods extend yellow peach shelf life. Zhang et al. utilized CFD (Computational Fluid Dynamics) to study apple pressure differential pre-cooling efficiency, offering insights for stacking and packaging strategies. Liu et al. [
32] conducted a thermodynamic analysis on cherry forced-air pre-cooling, providing recommendations for energy consumption and efficiency control. Tao et al. explored the effects of different pre-cooling methods on cabbage [
33] and grape quality [
34], concluding that VPC (Vacuum Pre-cooling) is suitable for cabbage preservation, while FAPC (Forced-air Pre-cooling) better delays grape softening and nutrient loss.
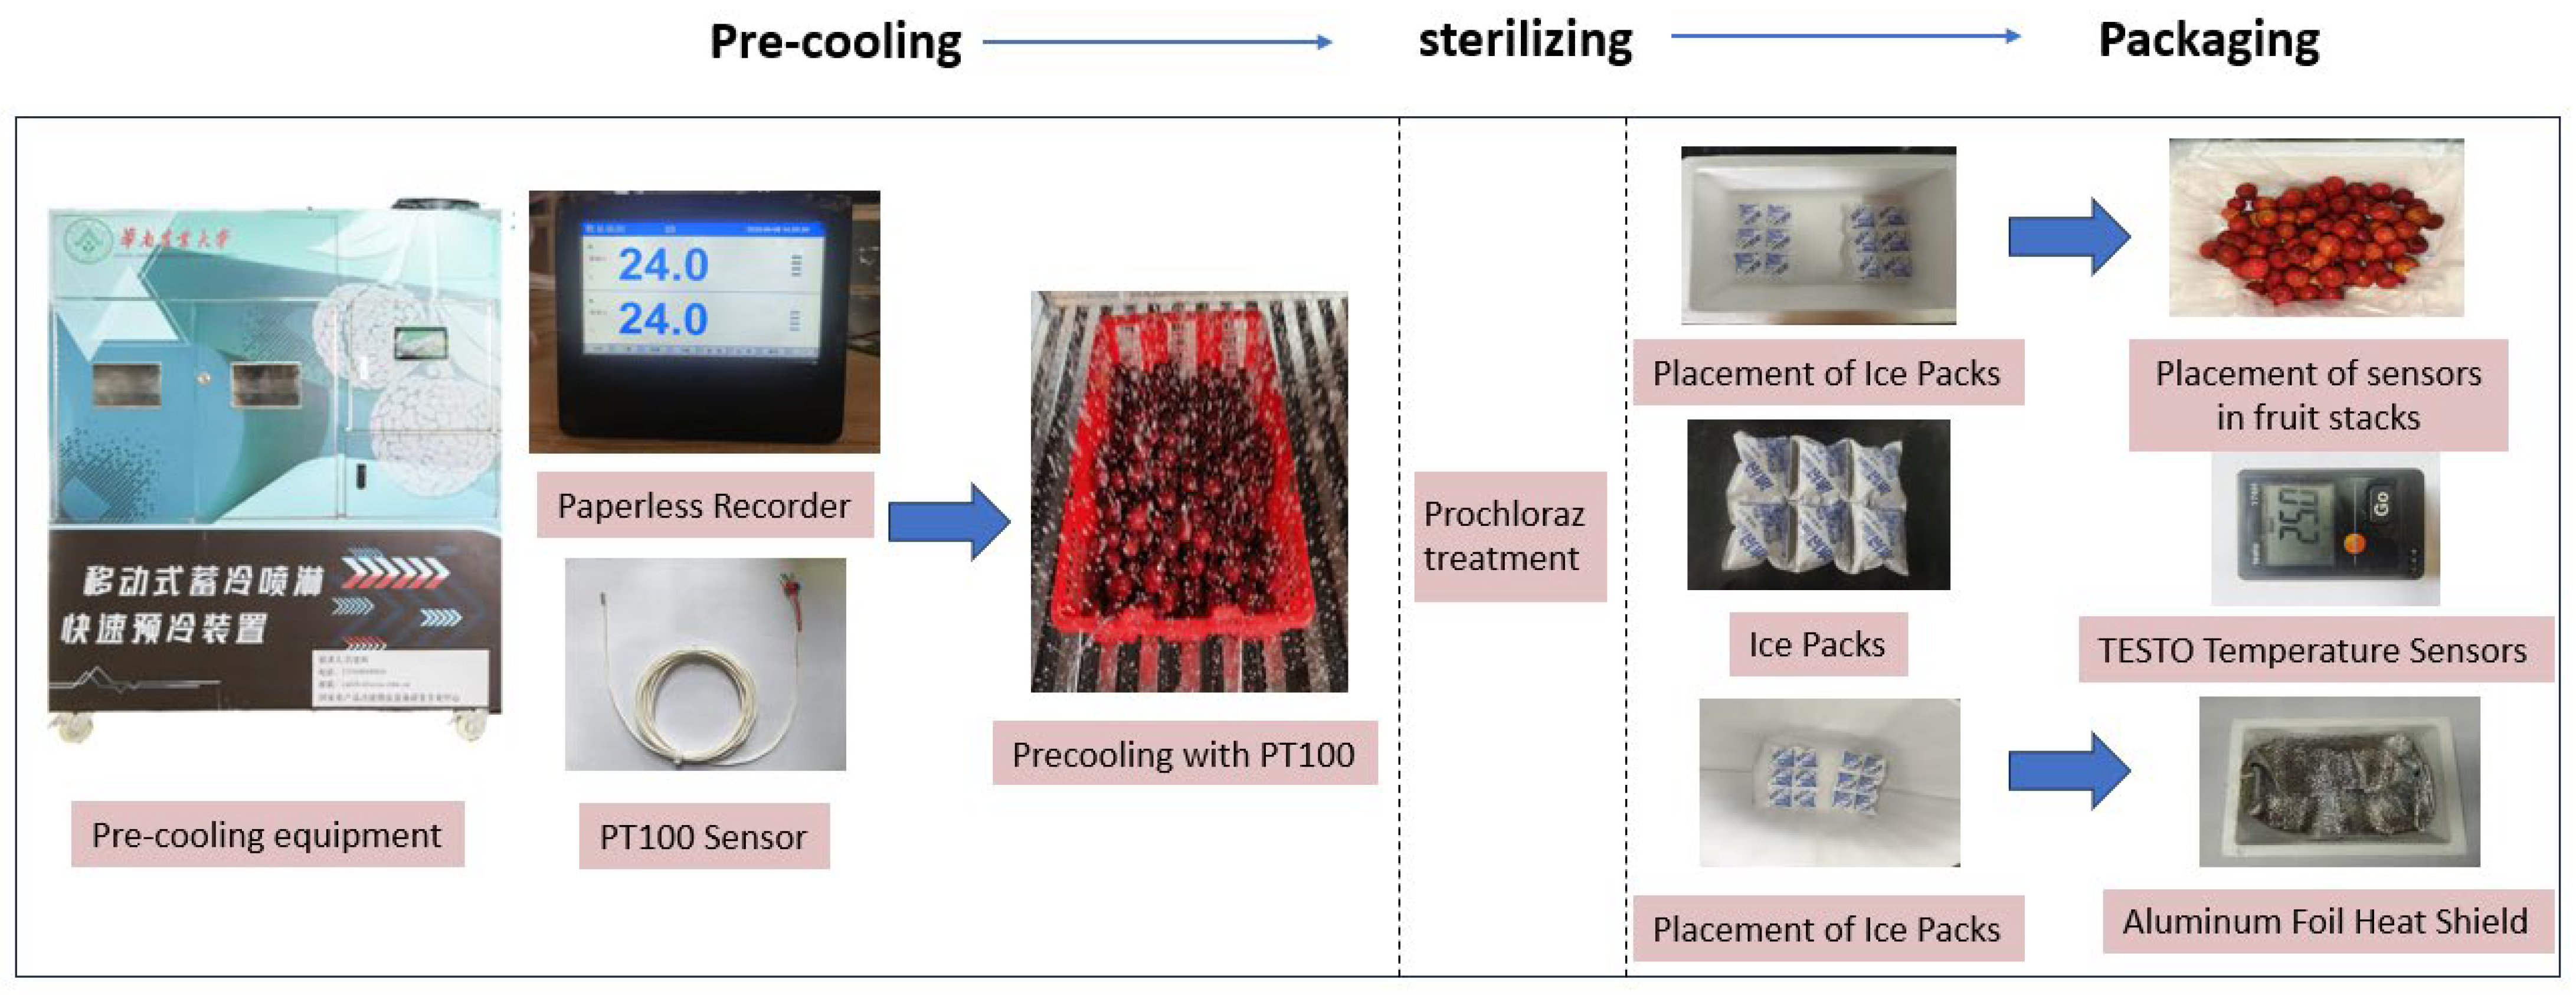
In conclusion, the efforts of scholars to decreasethe loss of agricultural products in the logistics process have provided valuable insights into litchi logistics and pre-cooling treatment, serving as a theoretical foundation for this study. By using the pre-cooling device [
35] developed by South China Agricultural University (SCAU), experiments were designed to investigate the effects of different pre-cooling and packaging treatments on logistics temperature retention and litchi quality variation. The research aims to provide theoretical references for delaying litchi browning and decay, optimizing logistics packaging strategies, and reducing agricultural product losses.
3. Results and Analysis
3.1. Average Internal Packaging Temperature
The average in-package temperature variation for each test group are shown in
Table 3 below.
The daily average temperature differences among the experimental groups were pronounced during the first two days. As observed in Group E, the precooling termination temperature had a substantial impact on the inside temperature. When the precooling termination temperature was 15 °C, the daily average temperature reached 16.45 °C, significantly higher than that of other groups (
p < 0.05). Litchis possess a high specific heat capacity, meaning that lower precooling termination temperatures result in greater stored cooling capacity, which is more conducive to maintaining a low-temperature inside environment [
43,
44].
Group B exhibited daily average temperatures approximately 1.13 °C and 1.44 °C lower than Group A during the first two days, respectively. Increasing the weight of litchi is equivalent to enhancing the initial cold storage capacity inside the foam container, because litchi itself has a higher specific heat capacity and has been pre-cooled to have a lower temperature, which is helpful for the foam container to better maintain the low-temperature environment.
Group F averaged approximately 3.07° C and 1.87 °C less than Group A on days 0 and 1. By increasing the number of ice packs, the initial cold storage capacity of the foam container improved, which is conducive to prolonging the time of cold release and obtaining a longer-lasting low-temperature environment.
Throughout the experimental period, Groups C and D demonstrated the most effective maintenance of low-temperature conditions. On the first day, the average packaging environment temperature in Group C was 4.13 °C lower than in Group A, while Group D was 2.39 °C lower than Group B. This suggests that the use of aluminum foil insulation effectively blocks external heat from entering the logistics environment, thereby preventing temperature increases. Furthermore, the temperature difference between Groups C and D was minimal, remaining within 0.5 °C, indicating that the weight of litchis has slight impact on the logistics environment temperature when aluminum foil insulation is employed.
3.2. Relative Conductivity
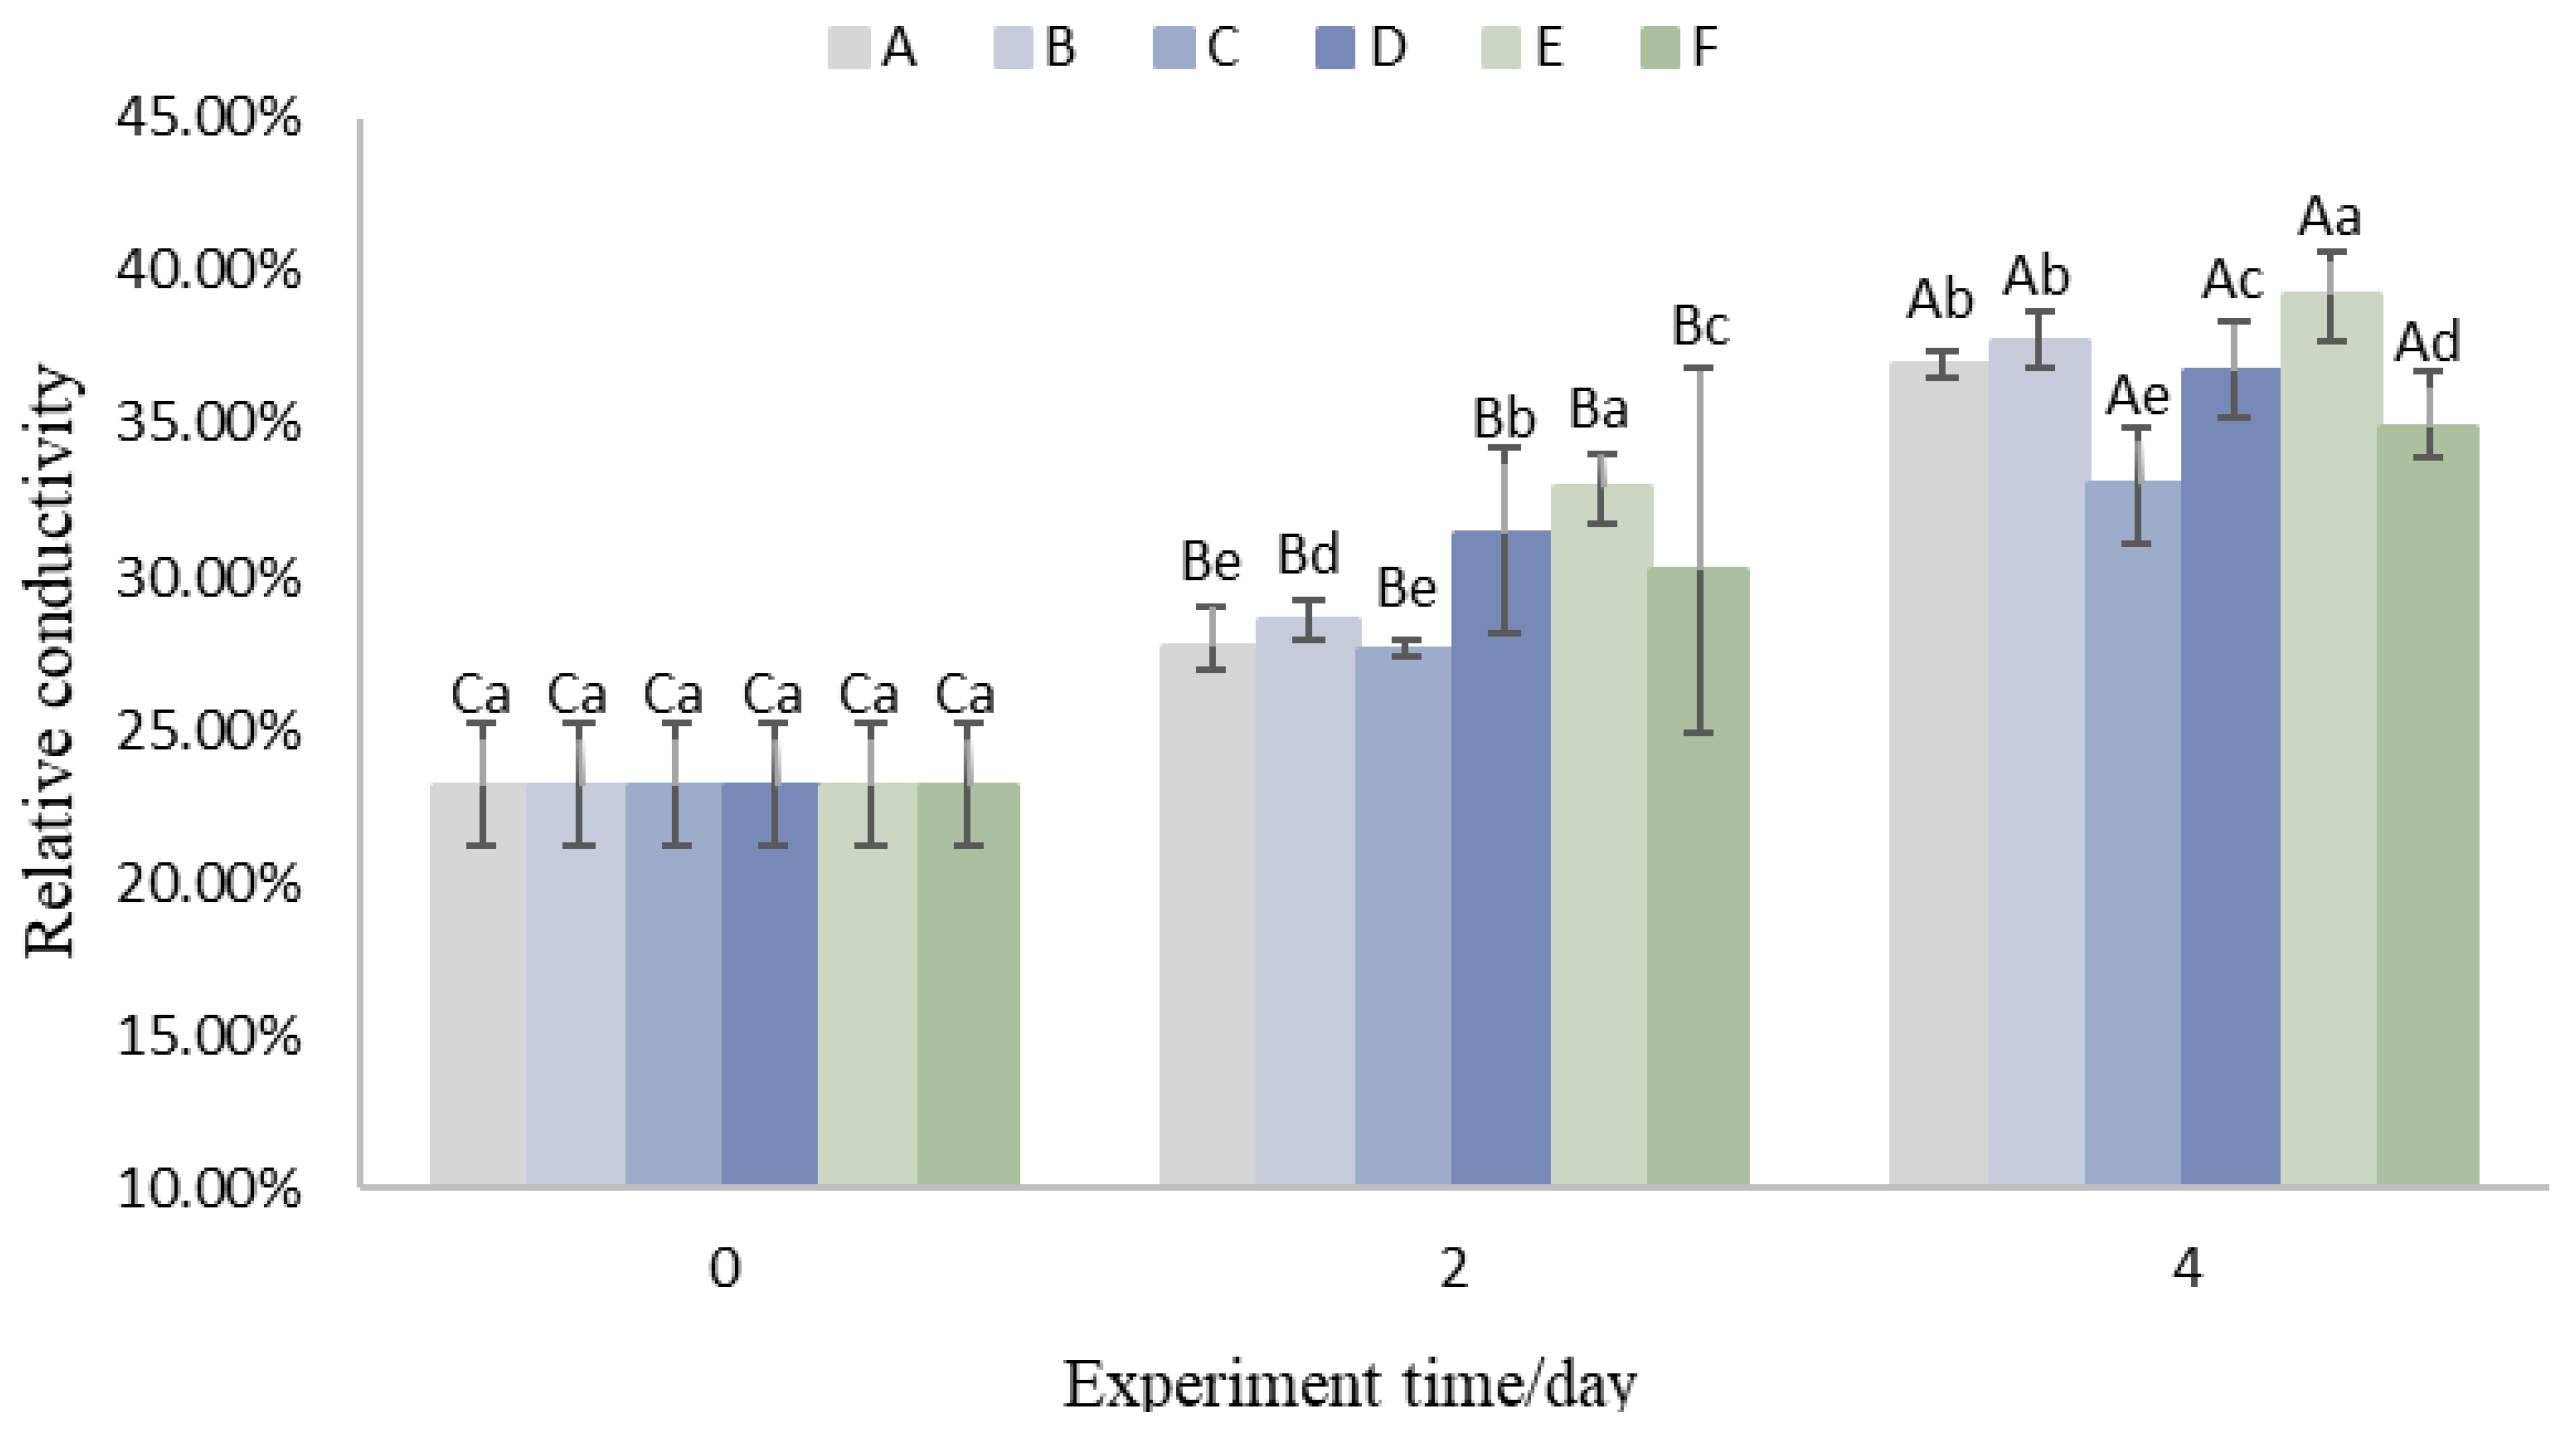
Mechanical damage disrupts cell membranes, which causes an increase in membrane permeability, and electrolyte efflux from the cell improves the relative conductivity, so measuring the relative conductivity of the pericarp could also indirectly reflect the degree of pericarp damage. As shown in
Figure 3, the relative conductivity of the pericarp in all experimental groups exhibited an increasing trend over storage time.
A comparison between Groups A and B, as well as Groups C and D, revealed that increasing the weight of litchis during logistics accelerated the rate of increase in relative conductivity. By the fourth day, the relative conductivity increase in Group B was 0.86% higher than in Group A, while Group D was 4.12% higher than Group C. This suggests that increasing the weight of litchis within the packaging accelerates the rise in relative conductivity, likely due to increased compression and mechanical damage to the pericarp.
Furthermore, a comparison between Groups A and C, as well as Groups B and D, indicated that Groups A and B exhibited higher relative conductivity values. This demonstrates that the use of aluminum foil insulation significantly reduces the rate of increase in relative conductivity. Group E showed the fastest rate of increase in relative conductivity among all experimental groups, reaching 39.21% by the fourth day. This suggests that lowering the pre-cooling end temperature reduced the variation in the relative conductivity of the Litchi pericarp, probably because lowering the pre-cooling temperature facilitates the maintenance of low temperatures in the packaging environment, which is an important influence on physiological activity, and enzyme activities may be inefficient because of the influence of low temperatures [
13].
3.3. Browning Index and Marketable Fruit Rate
As shown in
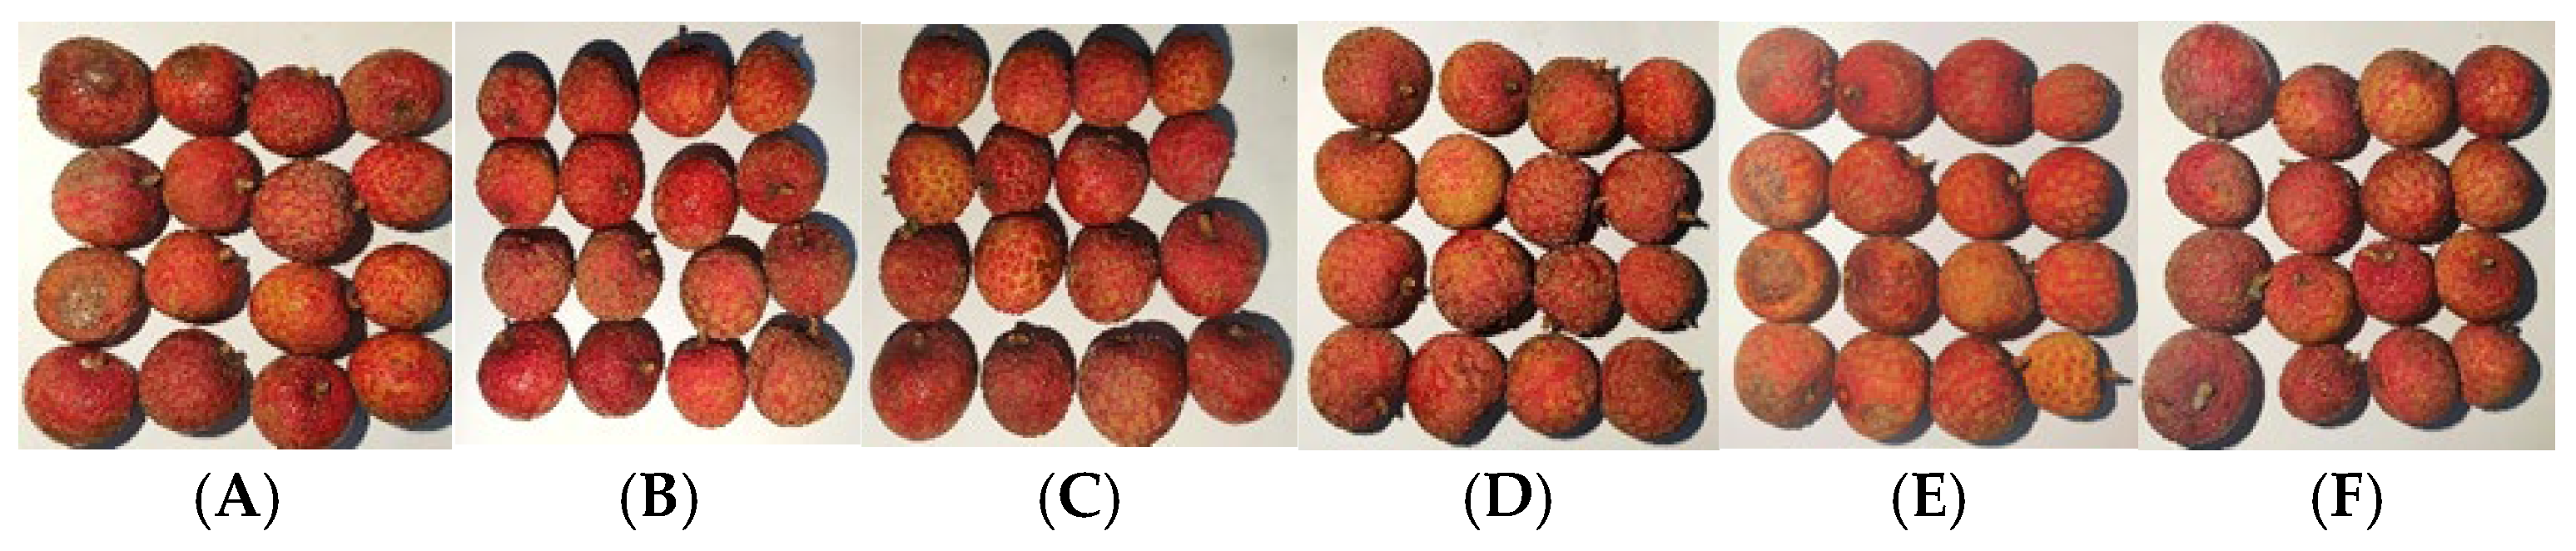
Figure 4, with the increase in storage time, the browning index of all experimental groups continuously rises, and the marketable fruit rate continuously decreases. Experimental Group E has a faster browning speed and a lower marketable fruit rate throughout the experiment. This result indicates that a higher pre-cooling temperature of the fruit is not conducive to reducing the post-harvest physiological metabolism rate of litchi, leading to an accelerated browning and fruit spoilage during the foam container logistics process, as shown in
Figure 5. Additionally, compared to groups A and B, groups C and D have a slower browning speed. On the second day, the average browning index of Group C is 0.11 lower than that of Group A, and the marketable fruit rate of Group C is always higher than that of Group A. The average browning index of Group D is 0.13 lower than that of Group B, indicating that the use of aluminum foil insulation could effectively reduce the browning speed of litchi in the early stage of logistics. Comparing groups A and F, the browning index of Group F is also consistently lower than that of Group A during the 4-day storage period. On the second day, the browning degree of Group A is more severe than that of Group F, indicating that increasing the number of ice packs could also slow down the browning speed of litchi to a certain extent. The variation in the browning index of litchi basically conforms to the pattern of temperature variations within the packaging environment. When the environmental temperature increases, the physiological metabolism and water loss process in the fruit pericarp cells are accelerated [
29], resulting in the decrease in anthocyanins in the cell vacuole and the acceleration of fruit browning [
12].
3.4. Total Soluble Solids (TSS)
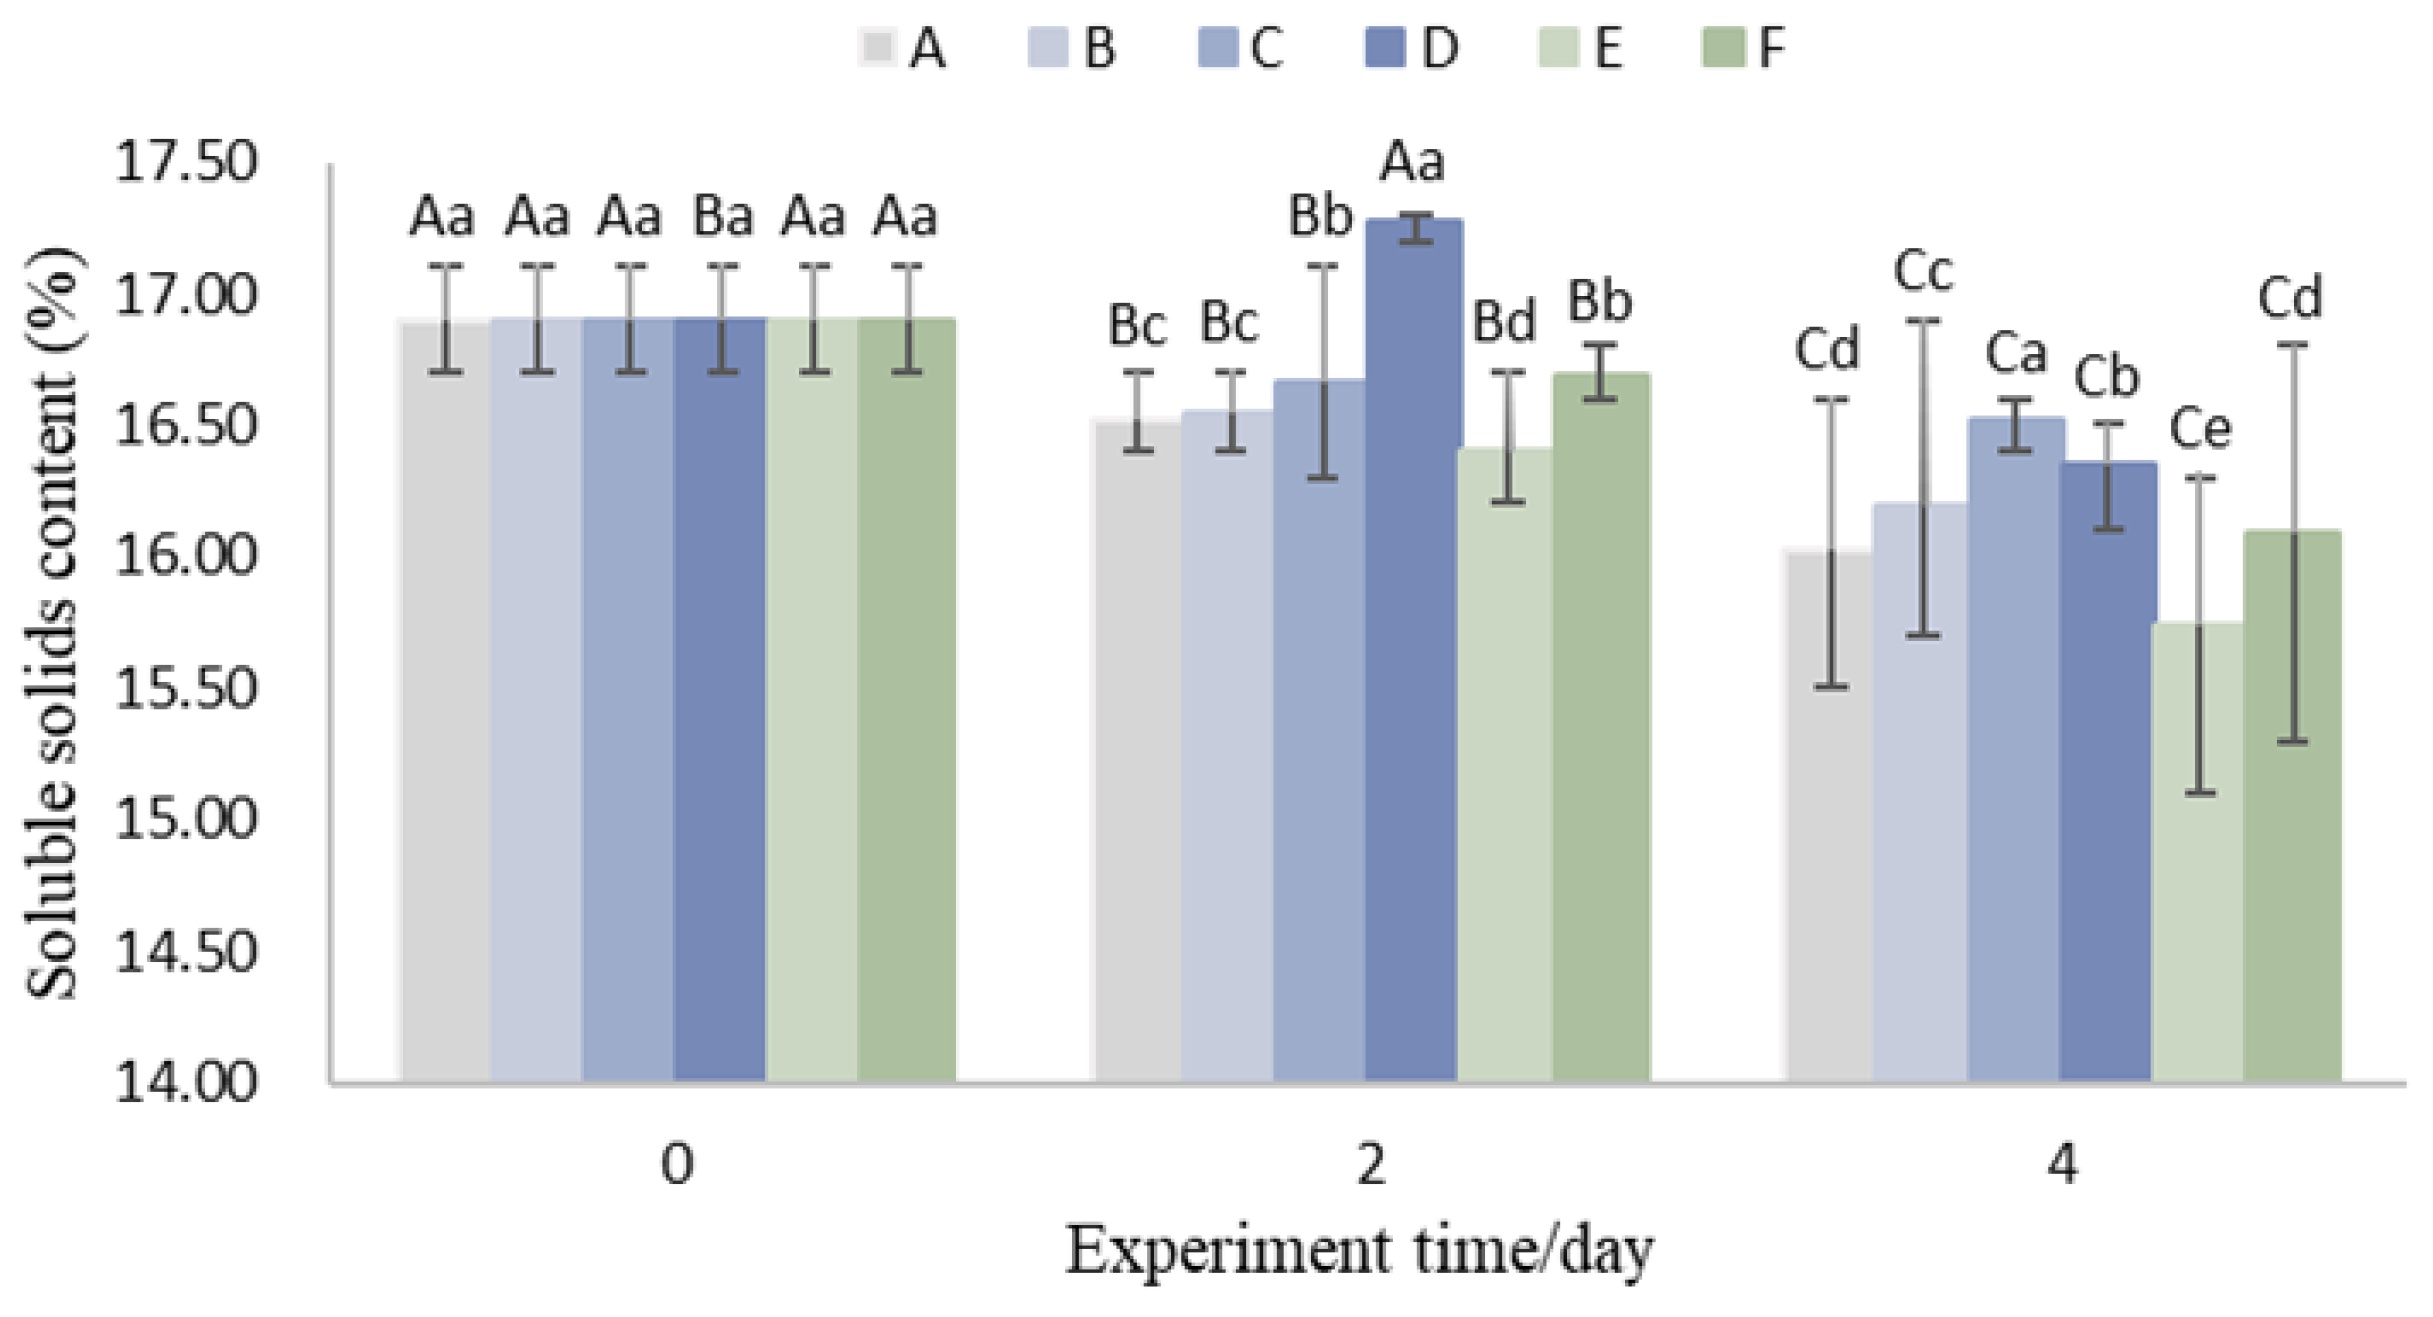
As shown in
Figure 6, the total soluble solids (TSS) content of litchis in all experimental groups exhibited an overall declining trend with increasing storage time. The results from Group E indicate that the TSS content in the 15 °C precooling group decreased more rapidly throughout the storage period. Compared to Group A, the TSS content in Group E was 0.23% and 0.31% lower on the second and fourth days, respectively. This is attributed to the incomplete removal of field heat, which led to heightened metabolic activity and accelerated consumption of internal substances in the litchis, consistent with the findings of Peng et al. [
45].
Groups C and D, which utilized aluminum foil insulation, exhibited higher TSS content compared to Groups A and B, which did not use insulation. This suggests that maintaining a lower ambient temperature through aluminum foil insulation helps suppress litchi respiration and internal substance consumption. However, no significant patterns were observed when comparing Group A with Group B or Group C with Group D, indicating that increasing the weight of litchis has little effect on maintaining internal substance quality during logistics. As mentioned earlier, while increasing litchi weight helps maintain a low-temperature environment, the resulting compression and abrasion may enhance the permeability of plant cells, allowing more oxygen and microorganisms to accelerate internal substance degradation [
46]. Thus, the impact of litchi weight on internal substance preservation during logistics is dual-sided.
In comparison to Group A, Group F, which included two additional ice packs, showed a 23% slower rate of TSS decline during the first two days. This demonstrates that increasing the number of ice packs during logistics could effectively reduce the rate of internal substance consumption in litchis.
3.5. Total Fungal Colony Count on Fruit Pericarp
As shown in
Figure 7, the total number of fungal colonies of the pericarp increased with time. The increase in the colony number has a certain correlation with the variation in ambient air temperature in the package, and the higher average daily temperature accelerates the germination, growth and spread of fungal spores [
47]. Among them, the 15 °C pre-cooling Group, Group E, reached a pericarp colony count of 3.87 Lg (CFU/g) on day 2, which was larger than the colony count of this experimental group throughout the experimental cycle, indicating that lowering the pre-cooling temperature could enhance the environmental inhibitory factors for microbial growth and thus inhibit the growth activities of microorganisms [
16,
48].
Group C was compared to Group A. On day 2, Group C had a lower colony count of 0.13 Lg (CFU/g) compared to Group A. Group D was compared to Group B. Group D had a lower colony count of 0.12 Lg (CFU/g) compared to Group B. The results of this study indicate that the use of aluminum foil insulating film could also enhance the environmental inhibitors of microbial growth and thus inhibit the growth activities of microorganisms. This suggests that the use of aluminum foil insulation film better reduces the risk of microbial growth during the pre-transportation period. The microbial growth rate of Group F compared with Group A decreased significantly, which indicates that increasing the number of ice packs bring about the lower temperatures and also inhibit the growth of the fungal flora.
3.6. Color Difference and Firmness
As shown in
Figure 8, the lightness (
L*) and redness (
a*) values of litchi fruits exhibited an overall declining trend with increasing storage time, while the yellowness (
b*) value showed a relatively slow increasing trend. The firmness also decreased over time.
From
Figure 8a, it could be observed that the variation in lightness (
L*) is correlated with the precooling termination temperature. As the precooling termination temperature decreased, the rate of decline in the lightness (
L*) of litchi pericarp also accelerated. By the fourth day, the
L* value of Group E decreased by 0.49° more than that of Group A.
From
Figure 8b, it is evident that Groups C and D, which used aluminum foil insulation, exhibited higher
a* values compared to Groups A and B, which did not use insulation. This indicates that the litchis in Groups C and D maintained better red coloration. Additionally, the precooling termination temperature significantly influenced the decline in
a* values. The
a* value of Group E (15 °C precooling) decreased by 8.27 over four days, while that of Group A (5 °C precooling) decreased by 5.86. The rate of decline in Group E was 41.09% faster than that in Group A, consistent with the findings of Li et al. [
49].
The variation in redness (
a*) is highly sensitive to temperature. Increased temperature leads to variations in vapor pressure, creating a driving force for epidermal water loss [
50]. This water loss accelerates the degradation of anthocyanins in the vacuoles of litchi pericarp cells, resulting in a reduction of the
a* value [
12].
As shown in
Figure 8c, there is a correlation between the variation in yellowness
b* and the weight of litchi. A comparison between Groups A and B, as well as Groups C and D, reveals that increasing the weight of litchis accelerates the rate of increase in
b* during logistics. From
Figure 8d, it could be observed that the firmness gradually decreases during the logistics process. The use of aluminum foil insulation or a lower precooling termination temperature slows down the softening rate of litchis. However, increasing the weight of litchis has little effect on firmness and may instead lead to mechanical damage, resulting in color deterioration [
16]. Additionally, increasing the number of ice packs could also reduce the softening rate of litchis. In summary, the variations in color difference (
L*,
a*,
b*) and firmness of litchis are consistent with the influence of logistics strategies on temperature. Maintaining a low-temperature environment is crucial for preserving the color and firmness of litchis.
3.7. Correlation Analysis and PCA Comprehensive Evaluation
As shown in
Figure 9, the packaging temperature exhibited strong correlations with most quality indicators. Among these, six indicators showed correlations exceeding 0.76 with the packaging environment temperature. However, the correlations between packaging temperature and firmness (0.02) as well as pericarp lightness (
L*) (0.19) were relatively weak.
Among the quality indicators, redness (a*), relative conductivity, browning index, marketable fruit rate, total soluble solids (TSS), and pericarp microbial count demonstrated significant inter-correlations, all exceeding 0.62. This indicates that there are notable interrelationships among fruit decay, browning, and pericarp relative conductivity during logistics. The variations in lightness (L*) and redness (a*) showed a correlation of 0.78, suggesting a numerical relationship between the reduction in a* and L* during the browning process. Additionally, yellowness (b*) exhibited significant correlations with pericarp microbial count and relative conductivity, implying associations among b* values, pericarp tissue damage, and microbial growth.
The pericarp microbial count, TSS content, marketable fruit rate, browning index, and relative conductivity showed average correlations greater than 0.6 with all other indicators, indicating that these metrics effectively represent overall quality variations. In contrast, firmness exhibited an average correlation of only 0.15 with other indicators, suggesting its limited association with overall quality metrics.
By the use of SPASS 26.0 software, PCA analysis was conducted on indicators such as TSS content, L*, a*, b*, epidermal microbial count, relative conductivity, browning index, good fruit rate, and firmness to establish a comprehensive evaluation index. These indicators are denoted as Q1, Q2, Q3, Q4, Q5, Q6, Q7, Q8, and Q9, respectively.
As shown in
Figure 10, the quality data were standardized by the software to obtain nine feature components, of which the proportion of variance explained by component 1, component 2 and component 3 were 71.95%, 14.97 and 6.59%, respectively, for a total of 93.51%. This indicates that these three components could respond well to the characteristics of litchi quality, and the use of these three components for the comprehensive evaluation of different experimental treatments could have a favorable representation. The eigenvalues of FAC1, FAC2, and FAC3 are 8.42, 1.75, and 0.77, respectively.
Table 4 presents the loadings of each quality indicator on FAC1, FAC2, and FAC3.
Table 5 shows the final score of each experimental group. The value of F is the score obtained by weighing the variance explanation ratio and eigenvalue of the principal component. The subscript in the experimental group column represents the corresponding experimental time in days. From the data in the comprehensive score table, it could be seen that on both the 2nd and 4th day, the comprehensive quality score of Group E is lower. This indicates that ensuring the pre-cooling temperature is an important link in the foam container logistics process, and the residual field heat will significantly accelerate the deterioration speed of litchi quality. On the 2nd day of logistics, groups C and D, which used aluminum foil insulation film, performed better. When the logistics time came to the 4th day, Group F with 4 ice packs performed better than groups C and D. This may be because the aluminum foil insulation layer reduces the heat transfer rate between the litchi logistics environment and the outside world. When the logistics time is long and the internal low temperature could no longer be maintained, the respiratory heat generation of litchi itself cannot be dissipated to the outside, but will more easily cause the temperature rise in the packaging environment in the later stage. This phenomenon could also be observed in
Table 3. In addition, at the early stage of logistics, the weight of litchi has little effect on the variation in comprehensive quality, but in the later stage of logistics, it will accelerate the decline speed of comprehensive quality.
4. Discussion
In the multifaceted and dynamic realm of e-commerce logistics, effectively preserving the quality of litchis has emerged as an urgent and pivotal issue to address. The research findings of this paper suggest that strategies such as reducing the final pre-cooling temperature, increasing the number of ice packs, enhancing litchi weight, and utilizing aluminum foil insulating films are considered to have positive effects on environmental and quality maintenance. However, the actual efficacy of these measures is far from being simply intuitive, necessitating an in-depth exploration of their underlying mechanisms and potential impacts.
Reducing the final precooling temperature could eliminate the field heat carried by litchis. Rapid cooling could effectively slow down the metabolic rate of litchis, thereby delaying the process of quality decline [
29,
30]. According to the research results in this paper, the browning index of litchis after 15 °C precooling treatment is 0.39 higher than that of 5 °C treatment on the second day. However, it should be noted that excessively low temperatures may cause irreversible damage to the cellular structure of litchis, leading to the leakage of intracellular substances, which in turn affects the taste and nutritional value of litchis [
51]. The research results of Hu et al. [
52] found that precooling temperatures below 5 °C could cause chilling injury to the pericarp of litchis, resulting in increased permeability of the pericarp membrane and relative conductivity. Therefore, when determining the final precooling temperature, it is necessary to carefully balance the relationship between the cooling rate and the risk of cellular damage.
Increasing the number of ice packs and the weight of litchi could enhance the low temperature maintenance function and provide a more stable cold storage environment for litchi. Ice packs work by absorbing surrounding heat and slowly releasing cold, which helps to maintain a stable temperature during transportation. In the results of this paper, the average package temperature on the day of storage in the four ice pack test group was 3.07 °C lower than that in the two ice pack group. Increasing the weight of litchi could also reduce the packaging temperature, it is difficult to achieve the cooling effect of the ice packs, on the day of storage, the average packaging temperature of the 5000 g Group B was 1.13 °C lower than that of the 2500 g Group A. Although increasing the amount of lichi could increase the initial cold storage capacity in the package, lichi and ice packs are different, lichi couldn’t release cold through the phase change, the ice in the ice packs in the liquefaction of the phase change will show latent heat properties, and could absorb more heat. In addition, the experimental results of this paper show that increasing the weight of lichi accelerates the change in indicators such as pericarp
b* value and hardness value, which is obviously not good. By increasing the weight of lichi, the lichi inside the package has to face more crushing problems, especially those stacked in the lower layer, which will increase the risk of mechanical damage to the pericarp and microbial growth during storage. In addition, the results of the study by Fadiji et al. [
7] concluded that the degree of mechanical damage increases when agricultural products are transported in the presence of vibration, and the effects of the increase in the weight of the lichi are greater, which accelerates the changes in the appearance and quality of the lichi, which is exposed to a greater risk of mold and browning.
The use of aluminum foil insulation could reduce the growth of fungi inside the package. The experimental results showed that at 2 days of storage, the number of fungi in the experimental group using aluminum foil insulation film was less than that of the unused group. The use of aluminum foil insulation film could better prevent the exchange of heat between the inside and outside of the package in order to maintain the low temperature inside the package. The results of the study by Si et al. [
53] showed that temperature is the most important factor affecting the growth of microorganisms in agricultural products, high temperature will accelerate the reproduction and metabolism of microorganisms, and the appearance of the agricultural products in the process of continuous change will also increase the microorganisms of the environmental capacity, and ultimately lead to the decay of the agricultural products. Therefore, in the actual logistics process, the use of aluminum foil heat insulation film to increase the heat insulation capacity of the foam box is of great significance to the preservation of lichi logistics.
Subsequent research should deeply analyze the specific relationship between mechanical damage of litchi and transportation parameters, including transportation speed, road surface factors, litchi weight and packaging structure, etc. It is necessary to carry out research on vibration mitigation strategies for the logistics process in response to litchi’s unique resonance frequency.
5. Conclusions
In this paper, the effects of litchi weight, pre-cooling temperature, the use of aluminum foil insulation film and the number of ice packs on the physiological and packaging environmental changes in litchi were discussed by experimental methods. The main conclusions are as follows:
(1) Increasing the weight of pre-cooled litchi, increasing the initial number of ice packs, reducing the final pre-cooling temperature and using aluminum foil insulation film could better maintain the low temperature in the foam container environment. Among them, the pre-cooling temperature has a greater impact on the ambient temperature. The average packaging environment temperature of the 15 °C pre-cooling end temperature group is 5.00 °C higher than that of the 5 °C pre-cooling treatment group.
(2) The variation in final pre-cooling temperature has significant effects on browning index, marketable fruit rate, soluble solid content, a* value, L* value and epidermal microbial count. Compared with the variations in logistics factors in other experimental groups, the variation in final pre-cooling temperature has the greatest impact on these indicators.
(3) More litchi causes an increase in the relative conductivity of the pericarp. Compared with the 5000 g group and the 2500 g group, the maximum absolute difference in relative conductivity in four days of storage could reach 4.12%. In addition, increasing the weight of litchi will increase the yellowness b* value and cause variations in fruit color.
(4) Increasing the number of ice packs could alleviate the browning speed of litchi pericarp. When the number of ice packs increases from 2 to 4, the consumption speed of soluble solids in litchi decreases by 23%. In addition, increasing the number of ice packs also has a certain inhibitory effect on the growth of epidermal microbial count in the first two days of logistics.
(5) The average temperature in the packaging environment on the day when the aluminum foil insulation layer is used is less than 7.9 °C. Under the condition of 5 °C pre-cooling, the use of aluminum foil insulation layer could further reduce the heat variation between the inside and the outside. In addition, this measure could also reduce the epidermal microbial count by about 0.12 Lg (CFU/g) on the second day due to its early low-temperature effect. In the later stage of storage, it could delay the decline of redness a* value and reduce the speed of browning and fruit decay.


 ,
, 


