
Investigation and Determination of Kinetic Parameters of Sweeteners Based on Steviol Glycosides by Isoconversional Methods

 ,
,  ,
, 
Abstract

1. Introduction
2. Materials and Methods
2.1. Materials
2.2. Kinetic Study
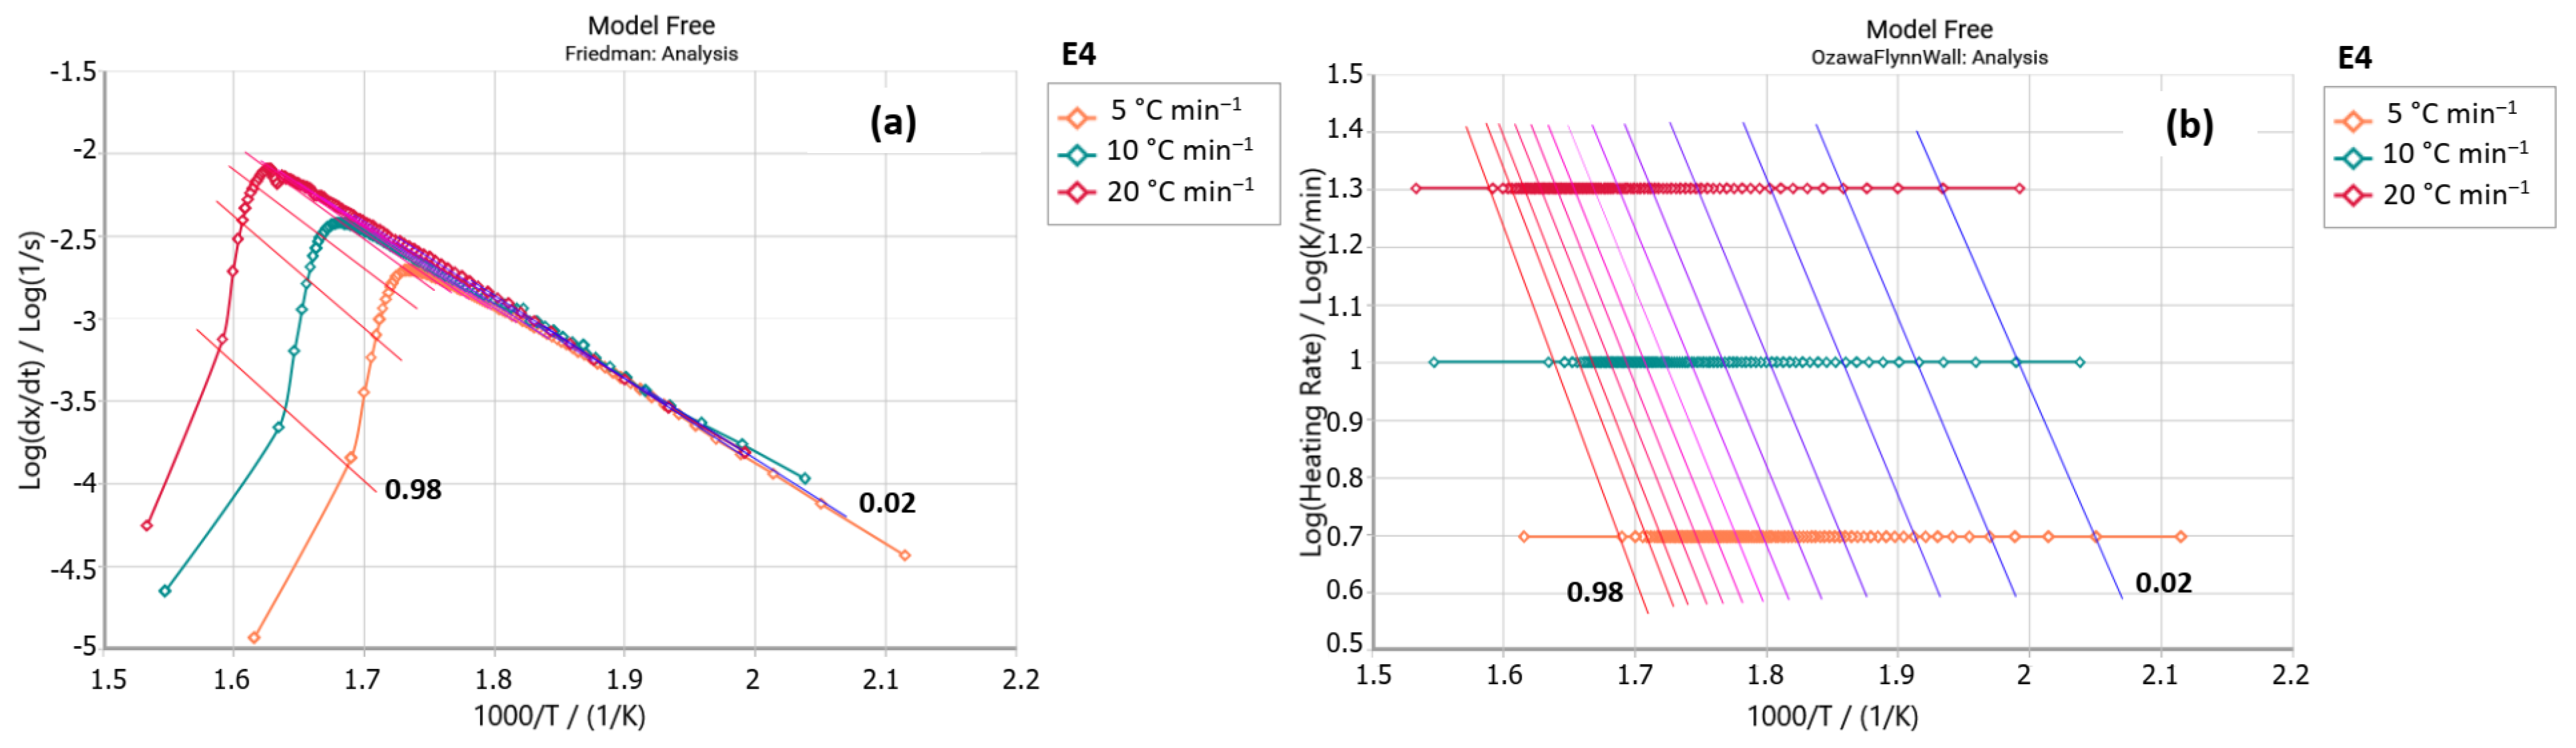
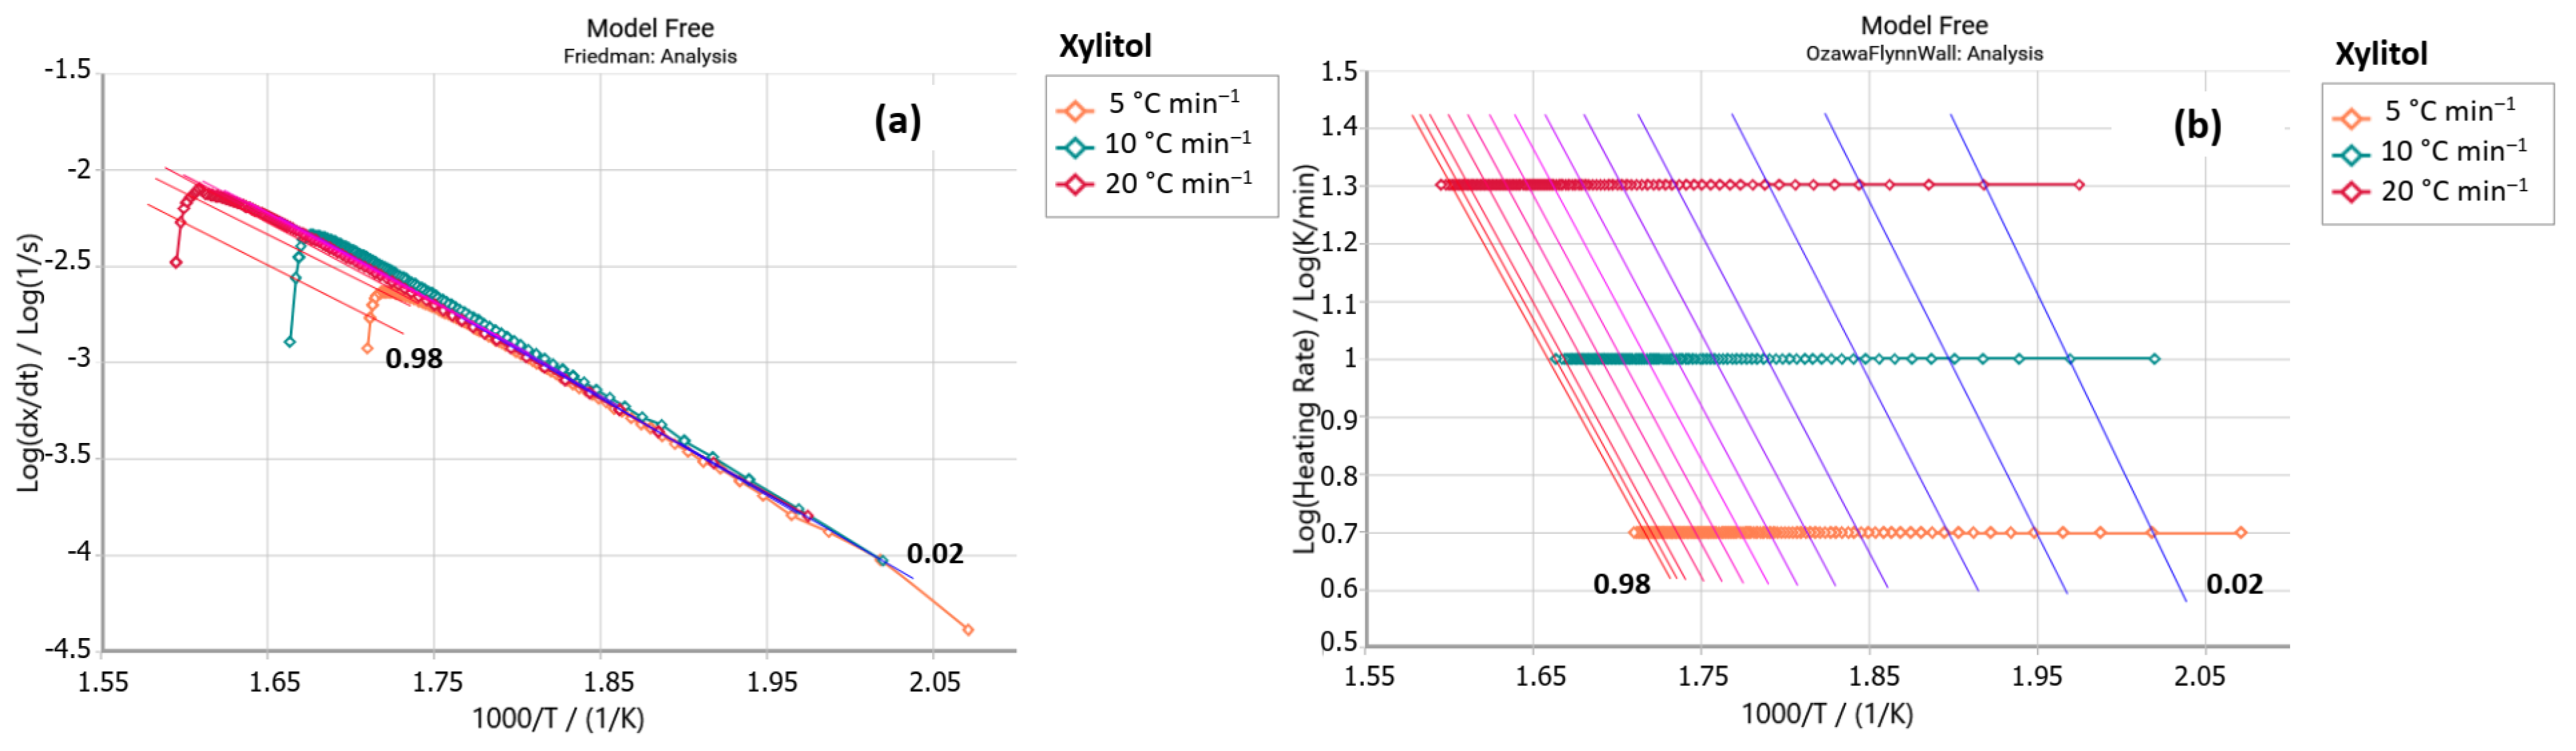
2.2.1. Friedman Method
2.2.2. Ozawa–Flynn–Wall Method (OFW)
3. Results and Discussion
4. Conclusions
Supplementary Materials
Author Contributions
Funding
Institutional Review Board Statement
Informed Consent Statement
Data Availability Statement
Acknowledgments
Conflicts of Interest
References
- IMARC—Stevia Market Size, Share, Trends and Forecast by Extract Type, End Use, and Region, 2025–2033. Available online: https://www.imarcgroup.com/stevia-market (accessed on 5 February 2025).
- Pezzotti, G.; Zhu, W.; Aoki, T.; Miyamoto, A.; Fujita, I.; Nakagawa, M.; Kobayashi, T. Raman Spectroscopic Analysis of Steviol Glycosides: Spectral Database and Quality Control Algorithms. Foods 2024, 13, 3068. [Google Scholar] [CrossRef] [PubMed]
- Sun, Y.; Liang, J.; Zhang, Z.; Sun, D.; Li, H.; Chen, L. Extraction, Physicochemical Properties, Bioactivities and Application of Natural Sweeteners: A Review. Food Chem. 2024, 457, 140103. [Google Scholar] [CrossRef]
- Moussa, H.A.K.; Espinola, D.O.G.; Hernández, S.G.; Hönnicke, M.G. Seeking for Non-friendly Chemical Elements in Tabletop Sugar and Zero to Low-calorie Sweetener Sachets. X-Ray Spectrom. 2024, 53, 204–211. [Google Scholar] [CrossRef]
- Tanaviyutpakdee, P.; Phitwongtaewan, P.; Phungsiangdee, Y.; Karnpanit, W.; Phattanakulanun, P.; Yomvachirasin, T.; Srianujata, S. Risk of Exposure to Steviol Glycosides Through Consumption of Foods and Beverages: A Survey of the Thai Population. Food Sci. Nutr. 2025, 13, e4681. [Google Scholar] [CrossRef]
- Vyazovkin, S.; Burnham, A.K.; Favergeon, L.; Koga, N.; Moukhina, E.; Pérez-Maqueda, L.A.; Sbirrazzuoli, N. ICTAC Kinetics Committee Recommendations for Analysis of Multi-Step Kinetics. Thermochim. Acta. 2020, 689, 178597. [Google Scholar] [CrossRef]
- Koga, N.; Vyazovkin, S.; Burnham, A.K.; Favergeon, L.; Muravyev, N.V.; Pérez-Maqueda, L.A.; Saggese, C.; Sánchez-Jiménez, P.E. ICTAC Kinetics Committee Recommendations for Analysis of Thermal Decomposition Kinetics. Thermochim. Acta. 2023, 719, 179384. [Google Scholar] [CrossRef]
- Wendlandt, W. Thermal Analysis, 3rd ed.; Jonh Wiey & Sons: New York, NY, USA, 1986. [Google Scholar]
- Coats, A.W.; Redfern, J.P. Kinetic Parameters from Thermogravimetric Data. Nature 1964, 201, 68–69. [Google Scholar] [CrossRef]
- Doyle, C.D. Kinetic Analysis of Thermogravimetric Data. J. Appl. Polym. Sci. 1961, 5, 285–292. [Google Scholar] [CrossRef]
- Ingraham, T.R.; Marier, P. Activation Energy Calculation from a Linearly-increasing-temperature Experiment. Can. J. Chem. Eng. 1964, 42, 161–163. [Google Scholar] [CrossRef]
- Conceição, M.M.; Fernandes, V.J., Jr.; Sinfrônio, F.S.M.; Santos, J.C.O.; Silva, M.C.D.; Fonseca, V.M.; Souza, A.G. Evaluation of Isothermal Kinetic of Sweetener. J. Therm. Anal. Calorim. 2005, 79, 263–266. [Google Scholar] [CrossRef]
- de Carvalho, L.C.; Segato, M.P.; Nunes, R.S.; Novak, C.; Cavalheiro, É.T.G. Thermoanalytical Studies of Some Sweeteners. J. Therm. Anal. Calorim. 2009, 97, 359–365. [Google Scholar] [CrossRef]
- Cheng, Y.D.; Lin, S.Y. Isothermal Fourier Transform Infrared Microspectrosopic Studies on the Stability Kinetics of Solid-State Intramolecular Cyclization of Aspartame Sweetener. J. Agric. Food Chem. 2000, 48, 631–635. [Google Scholar] [CrossRef]
- Santana, N.d.S.; Mothé, C.G.; de Souza, M.N.; Mothé, M.G. An Investigation by Thermal Analysis of Glycosidic Natural Sweeteners. J. Therm. Anal. Calorim. 2022, 147, 13275–13287. [Google Scholar] [CrossRef]
- Santana, N.d.S.; Mothé, C.G.; Nele de Souza, M.; Mothé, M.G. Thermal and Rheological Study of Artificial and Natural Powder Tabletop Sweeteners. Food Res. Int. 2022, 162, 112039. [Google Scholar] [CrossRef]
- Soejarto, D.D.; Addo, E.M.; Kinghorn, A.D. Highly Sweet Compounds of Plant Origin: From Ethnobotanical Observations to Wide Utilization. J. Ethnopharmacol. 2019, 243, 112056. [Google Scholar] [CrossRef]
- Carocho, M.; Morales, P.; Ferreira, I.C.F.R. Sweeteners as Food Additives in the XXI Century: A Review of What Is Known, and What Is to Come. Food Chem. Toxicol. 2017, 107, 302–317. [Google Scholar] [CrossRef]
- Mathur, S.; Kumar, D.; Kumar, V.; Dantas, A.; Verma, R.; Kuca, K. Xylitol: Production Strategies with Emphasis on Biotechnological Approach, Scale up, and Market Trends. Sustain. Chem. Pharm. 2023, 35, 101203. [Google Scholar] [CrossRef]
- EFSA. Scientific Opinion on the Safety of Steviol Glycosides for the Proposed Uses as a Food Additive. EFSA J. 2010, 8, 1537. [Google Scholar] [CrossRef]
- Mazi, T.A.; Stanhope, K.L. Erythritol: An In-Depth Discussion of Its Potential to Be a Beneficial Dietary Component. Nutrients 2023, 15, 204. [Google Scholar] [CrossRef]
- Santana, N.d.S.; Monteiro, S.N.; da Silva, T.C.; Mothé, M.G. Kinetic Study of Commercial Tabletop Sweeteners Using Thermal Analysis. Biol. Life Sci. Forum 2024, 40, 35. [Google Scholar]
- Ozawa, T. Estimation of Activation Energy by Isoconversion Methods. Thermochim. Acta. 1992, 203, 159–165. [Google Scholar] [CrossRef]
- Ozawa, T. Some Demonstrations of the Effect of the Heating Rate on Thermoanalytical Curves. J. Therm. Anal. 1976, 9, 217–227. [Google Scholar] [CrossRef]
- Ozawa, T. Kinetic Analysis by Repeated Temperature Scanning. Part 1. Theory and Methods. Thermochim. Acta. 2000, 356, 173–180. [Google Scholar] [CrossRef]
- Opfermann, J.; Kaisersberger, E. An Advantageous Variant of the Ozawa-Flynn-Wall Analysis. Thermochim. Acta. 1992, 203, 167–175. [Google Scholar] [CrossRef]
- Flynn, J.H.; Wall, L.A. General Treatment of the Thermogravimetry of Polymers. J. Res. Natl. Bur. Stand. A Phys. Chem. 1966, 70A, 487. [Google Scholar] [CrossRef]
- Pure Circle About Stevia. Available online: https://www.purecircle.com/na/en-us/purecirclesteviainstitute/about-stevia.html (accessed on 8 February 2025).
- Younes, M.; Aquilina, G.; Engel, K.; Fowler, P.; Frutos Fernandez, M.J.; Fürst, P.; Gürtler, R.; Gundert-Remy, U.; Husøy, T.; Manco, M.; et al. Safety of a Proposed Amendment of the Specifications for Steviol Glycosides (E 960) as a Food Additive: To Expand the List of Steviol Glycosides to All Those Identified in the Leaves of Stevia Rebaudiana Bertoni. EFSA J. 2020, 18, e06106. [Google Scholar] [CrossRef]
- FDA. Steviol Glycosides; FDA: Washington, DC, USA, 2004.
- Fisher, T.; Hajaligol, M.; Waymack, B.; Kellogg, D. Pyrolysis Behavior and Kinetics of Biomass Derived Materials. J. Anal. Appl. Pyrolysis. 2002, 62, 331–349. [Google Scholar] [CrossRef]
- Flammersheim, H.-J.; Opfermann, J.R. Kinetic Evaluation of DSC Curves for Reacting Systems with Variable Stoichiometric Compositions. Thermochim. Acta. 2002, 388, 389–400. [Google Scholar] [CrossRef]
- Flammersheim, H.J.; Opfermann, J. Formal Kinetic Evaluation of Reactions with Partial Diffusion Control. Thermochim. Acta. 1999, 337, 141–148. [Google Scholar] [CrossRef]
- Mothé, C.G.; Miranda, I.C. Aproveitamento Energético e Caracterização de Resíduos de Biomassa, 1st ed.; Publit Ltd.a: Rio de Janeiro, Brazil, 2013; ISBN 978-85-7773-652-2. [Google Scholar]
- Mothé, C.G.; de Miranda, I.C. Study of Kinetic Parameters of Thermal Decomposition of Bagasse and Sugarcane Straw Using Friedman and Ozawa–Flynn–Wall Isoconversional Methods. J. Therm. Anal. Calorim. 2013, 113, 497–505. [Google Scholar] [CrossRef]
- Mothé, C.G.; de Miranda, I.C. Decomposition through Pyrolysis Process of Coconut Fiber and Rice Husk and Determination of Kinetic Parameters According Isoconversional Methods. J. Therm. Anal. Calorim. 2018, 131, 601–609. [Google Scholar] [CrossRef]
- Wang, C.; Liu, Y.; Zhao, X.; Liu, B. Current Advances and Future Aspects of Sweetener Synergy: Properties, Evaluation Methods and Molecular Mechanisms. Appl. Sci. 2022, 12, 5096. [Google Scholar] [CrossRef]
- den Hartog, G.J.M.; Boots, A.W.; Adam-Perrot, A.; Brouns, F.; Verkooijen, I.W.C.M.; Weseler, A.R.; Haenen, G.R.M.M.; Bast, A. Erythritol Is a Sweet Antioxidant. Nutrition 2010, 26, 449–458. [Google Scholar] [CrossRef] [PubMed]


| Sweetener | Chemical Structure | Characteristics |
|---|---|---|
| steviol glycosides | 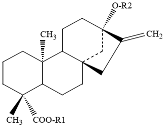 |
|
| erythritol | 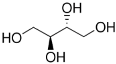 |
|
| xylitol | 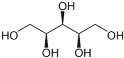 |
|
| Friedman | Ozawa-Flynn-Wall | |||||||
|---|---|---|---|---|---|---|---|---|
| Stevioside | E3 | Stevioside | E3 | |||||
| α | Ea [kJ mol−1] | ln A [s−1] | Ea [kJ mol−1] | ln A [s−1] | Ea [kJ mol−1] | ln A [s−1] | Ea [kJ mol−1] | ln A [s−1] |
| 0.1 | 151.65 | 11.62 | 128.43 | 9.30 | 146.37 | 11.18 | 144.23 | 10.73 |
| 0.2 | 144.79 | 10.89 | 124.47 | 8.99 | 145.27 | 10.99 | 134.51 | 9.84 |
| 0.3 | 130.58 | 9.56 | 130.94 | 9.62 | 142.16 | 10.66 | 132.21 | 9.66 |
| 0.4 | 136.83 | 10.17 | 142.68 | 10.73 | 139.24 | 10.38 | 133.18 | 9.78 |
| 0.5 | 144.88 | 10.93 | 151.71 | 11.57 | 140.18 | 10.47 | 136.31 | 10.09 |
| 0.6 | 163.87 | 12.66 | 159.40 | 12.27 | 145.90 | 11.00 | 140.22 | 10.46 |
| 0.7 | 174.36 | 13.57 | 177.02 | 13.83 | 152.24 | 11.58 | 145.92 | 10.99 |
| 0.8 | 178.24 | 13.87 | 178.24 | 13.92 | 159.58 | 12.23 | 152.81 | 11.62 |
| 0.9 | 224.30 | 17.70 | 229.58 | 18.27 | 170.93 | 13.19 | 167.94 | 12.95 |
| Friedman | Ozawa-Flynn-Wall | |||||||
|---|---|---|---|---|---|---|---|---|
| E2 | Erythritol | E2 | Erythritol | |||||
| α | Ea [kJ mol−1] | ln A [s−1] | Ea [kJ mol−1] | ln A [s−1] | Ea [kJ mol−1] | ln A [s−1] | Ea [kJ mol−1] | ln A [s−1] |
| 0.1 | 97.67 | 7.05 | 97.41 | 6.98 | 100.27 | 7.34 | 101.26 | 7.44 |
| 0.2 | 96.24 | 6.89 | 97.78 | 7.04 | 99.41 | 7.27 | 101.42 | 7.46 |
| 0.3 | 96.53 | 6.96 | 97.66 | 7.07 | 98.80 | 7.22 | 101.69 | 7.51 |
| 0.4 | 94.51 | 6.82 | 98.45 | 7.19 | 98.46 | 7.21 | 102.18 | 7.58 |
| 0.5 | 93.36 | 6.77 | 99.01 | 7.31 | 98.08 | 7.21 | 102.73 | 7.66 |
| 0.6 | 92.85 | 6.81 | 99.74 | 7.46 | 97.70 | 7.21 | 103.36 | 7.75 |
| 0.7 | 91.83 | 6.82 | 100.49 | 7.64 | 97.33 | 7.22 | 104.03 | 7.86 |
| 0.8 | 92.26 | 7.01 | 101.38 | 7.88 | 96.98 | 7.24 | 104.74 | 7.99 |
| 0.9 | 91.96 | 7.18 | 102.88 | 8.28 | 96.51 | 7.29 | 105.52 | 8.15 |
| Friedman | Ozawa-Flynn-Wall | |||||||
|---|---|---|---|---|---|---|---|---|
| E4 | Xylitol | E4 | Xylitol | |||||
| α | Ea [kJ mol−1] | ln A [s−1] | Ea [kJ mol−1] | ln A [s−1] | Ea [kJ mol−1] | ln A [s−1] | Ea [kJ mol−1] | ln A [s−1] |
| 0.1 | 97.22 | 6.34 | 95.21 | 6.07 | 96.92 | 6.37 | 98.86 | 6.48 |
| 0.2 | 95.83 | 6.23 | 92.48 | 5.87 | 96.77 | 6.39 | 96.59 | 6.31 |
| 0.3 | 95.62 | 6.24 | 90.91 | 5.78 | 96.54 | 6.39 | 95.34 | 6.23 |
| 0.4 | 97.22 | 6.43 | 89.71 | 5.74 | 96.79 | 6.44 | 94.42 | 6.18 |
| 0.5 | 99.87 | 6.74 | 88.66 | 5.72 | 97.49 | 6.53 | 93.70 | 6.16 |
| 0.6 | 102.78 | 7.08 | 87.87 | 5.75 | 98.47 | 6.65 | 93.08 | 6.15 |
| 0.7 | 104.52 | 7.33 | 86.99 | 5.79 | 99.59 | 6.80 | 92.52 | 6.16 |
| 0.8 | 107.90 | 7.77 | 85.67 | 5.84 | 100.25 | 6.92 | 91.90 | 6.18 |
| 0.9 | 117.41 | 8.75 | 87.51 | 6.27 | 102.29 | 7.15 | 91.19 | 6.21 |
| Sample | Kinetic Model | R2 | Fexp | Ea/[kJ mol−1] | ln A/[s−1] | Reaction Order | |||||||||
|---|---|---|---|---|---|---|---|---|---|---|---|---|---|---|---|
| Ea1 | Ea2 | Ea3 | Ea4 | A1 | A2 | A3 | A3 | n1 | n2 | n3 | n4 | ||||
| stevioside | F1Fn | 0.99983 | 1.206 | 123.66 | 193.85 | - | - | 9.27 | 15.64 | - | - | 1 | 1.80 | - | - |
| FnFnFn | 0.99986 | 1.017 | 123.08 | 133.51 | 170.15 | - | 9.52 | 10.19 | 13.37 | - | 1.38 | 0.47 | 1.40 | - | |
| FnFnFnFn | 0.99986 | 1.000 | 118.34 | 209.53 | 319.72 | 69.08 | 8.73 | 17.27 | 27.64 | 4.07 | 0.94 | 1.19 | 5.71 | 1.41 | |
| Sample | Kinetic Model | R2 | Fexp | Ea/[kJ mol−1] | ln A/[s−1] | Reaction Order | ||||||
|---|---|---|---|---|---|---|---|---|---|---|---|---|
| Ea1 | Ea2 | Ea3 | A1 | A2 | A3 | n1 | n2 | n3 | ||||
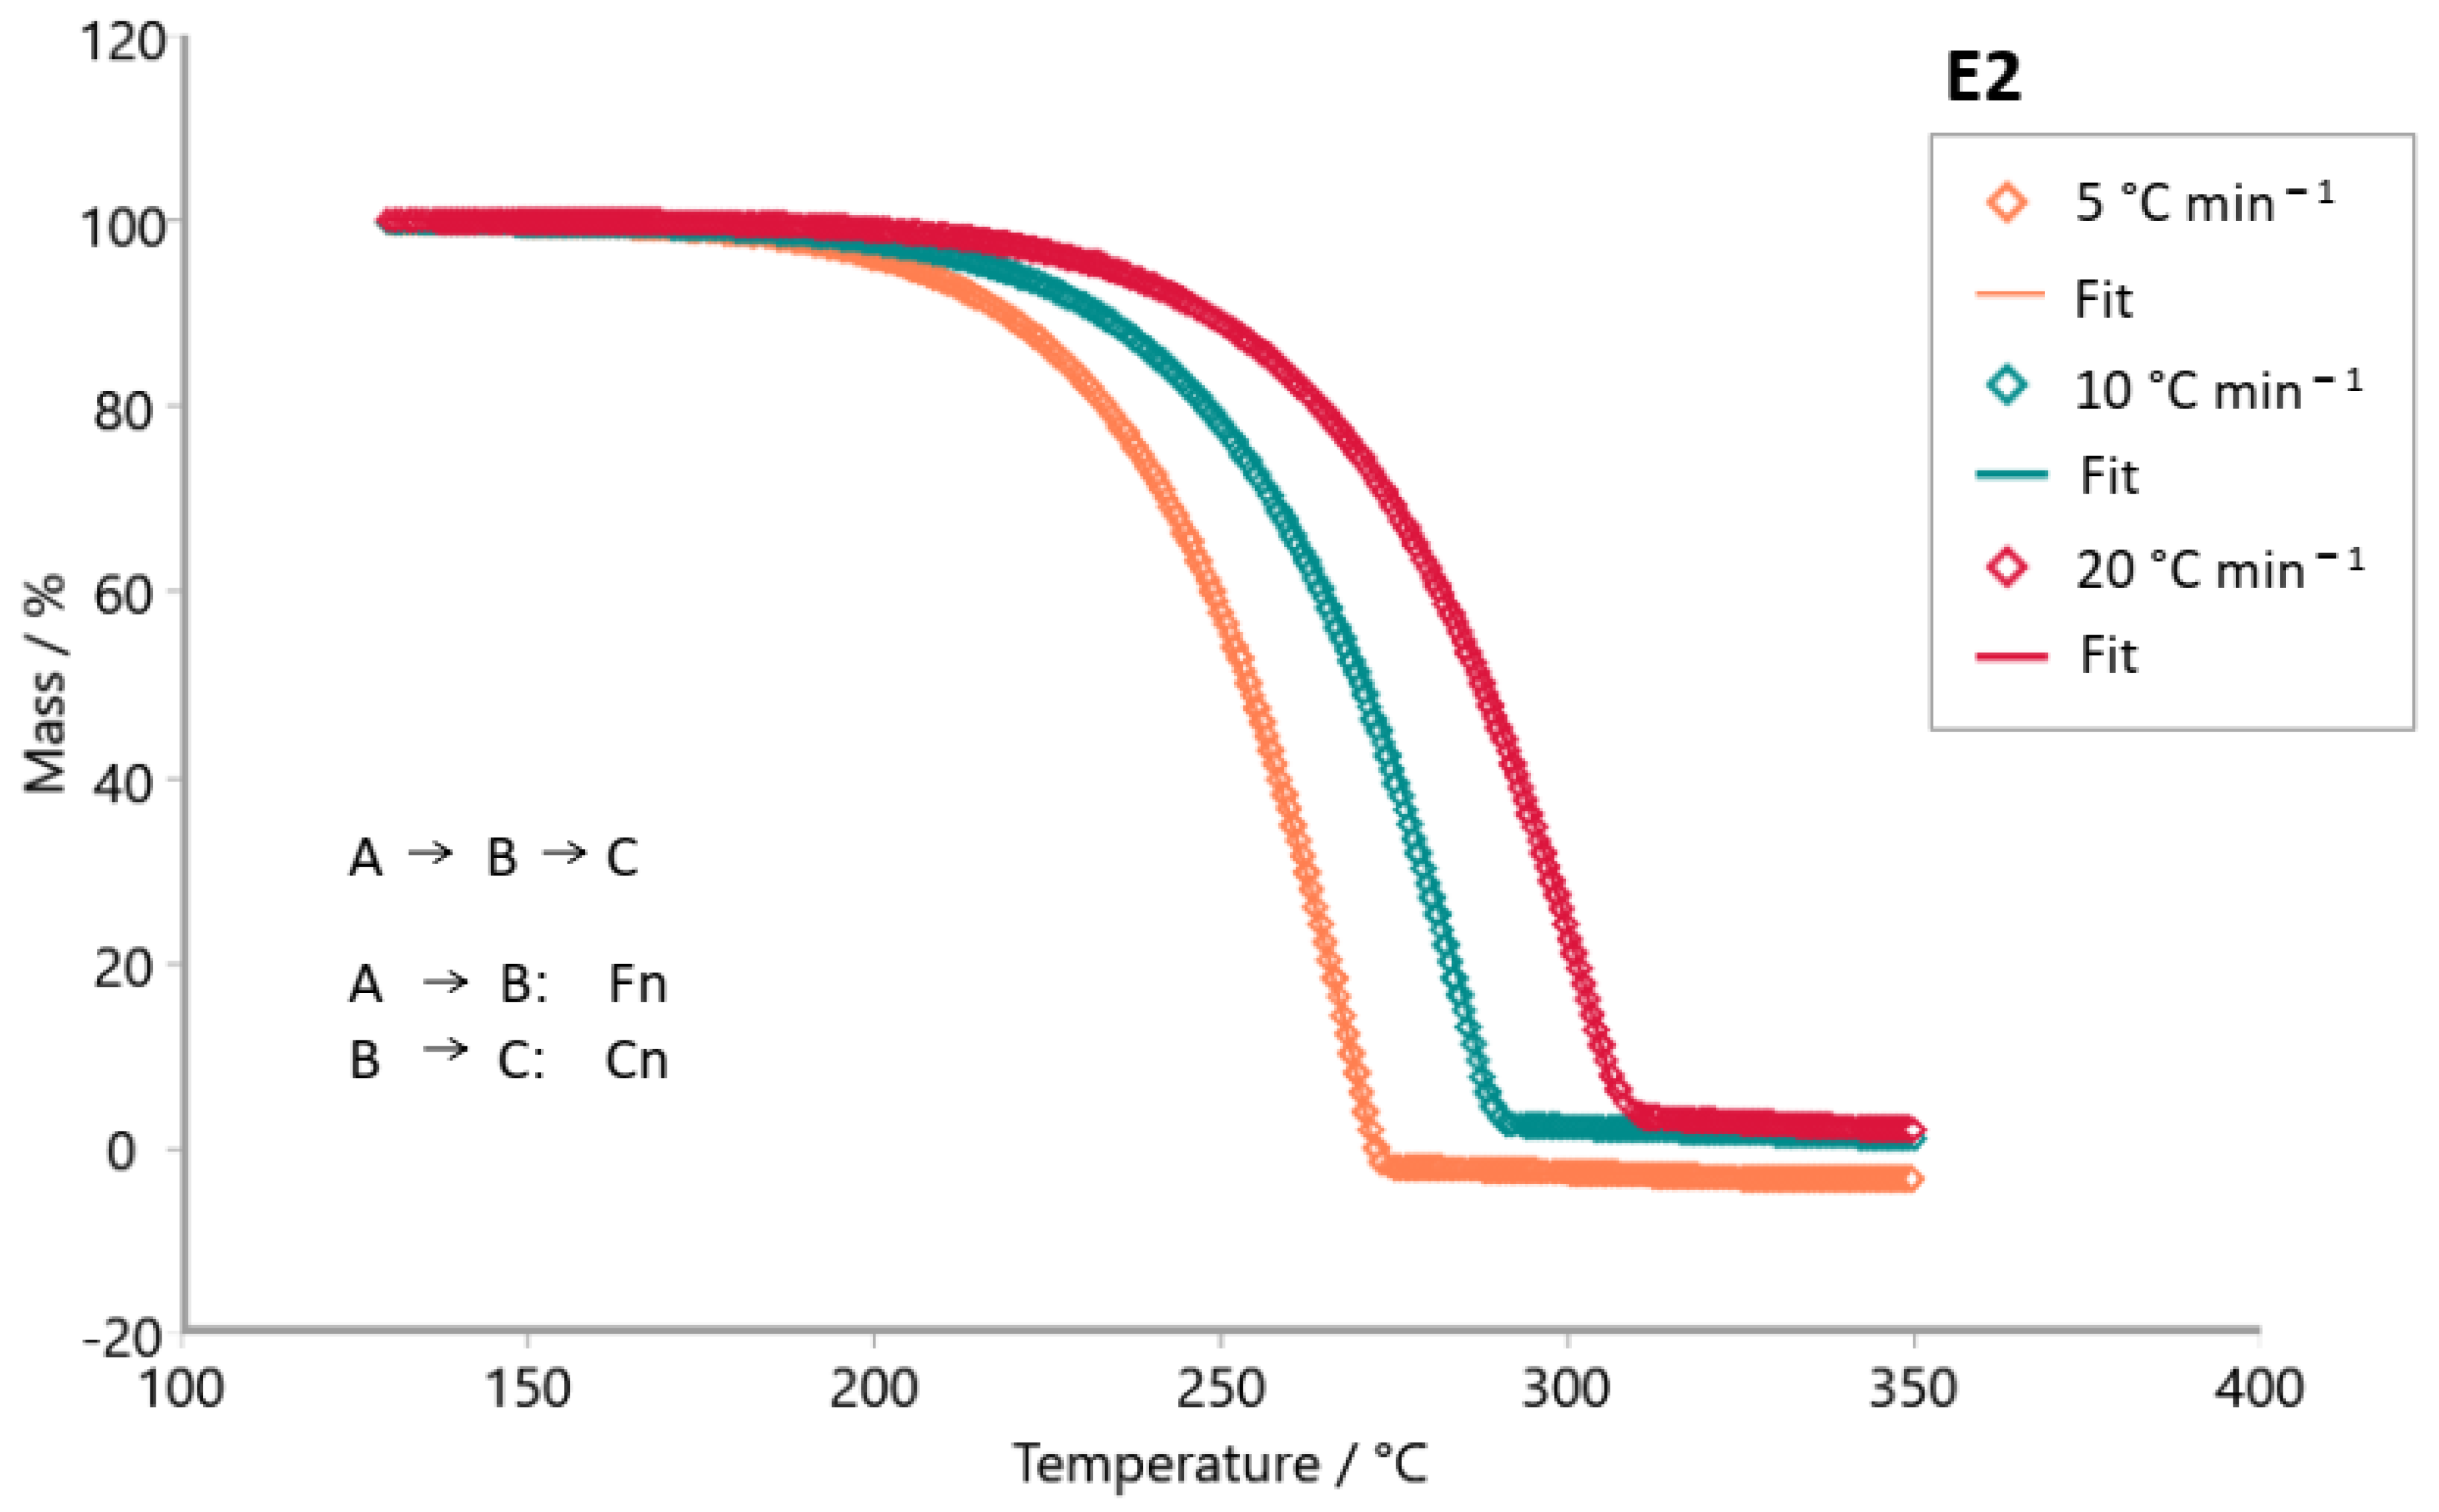
| E2 | F1Fn | 0.99920 | 23.91 | 102.85 | 110.52 | - | 7.82 | 8.30 | - | 1 | 0.30 | - |
| FnFn | 0.99985 | 4.49 | 84.56 | 120.54 | - | 5.84 | 9.33 | - | 0.39 | 0.44 | - | |
| FnCn | 0.99997 | 1.00 | 95.68 | 94.54 | - | 6.96 | 6.43 | - | 0.57 | 0.01 | - | |
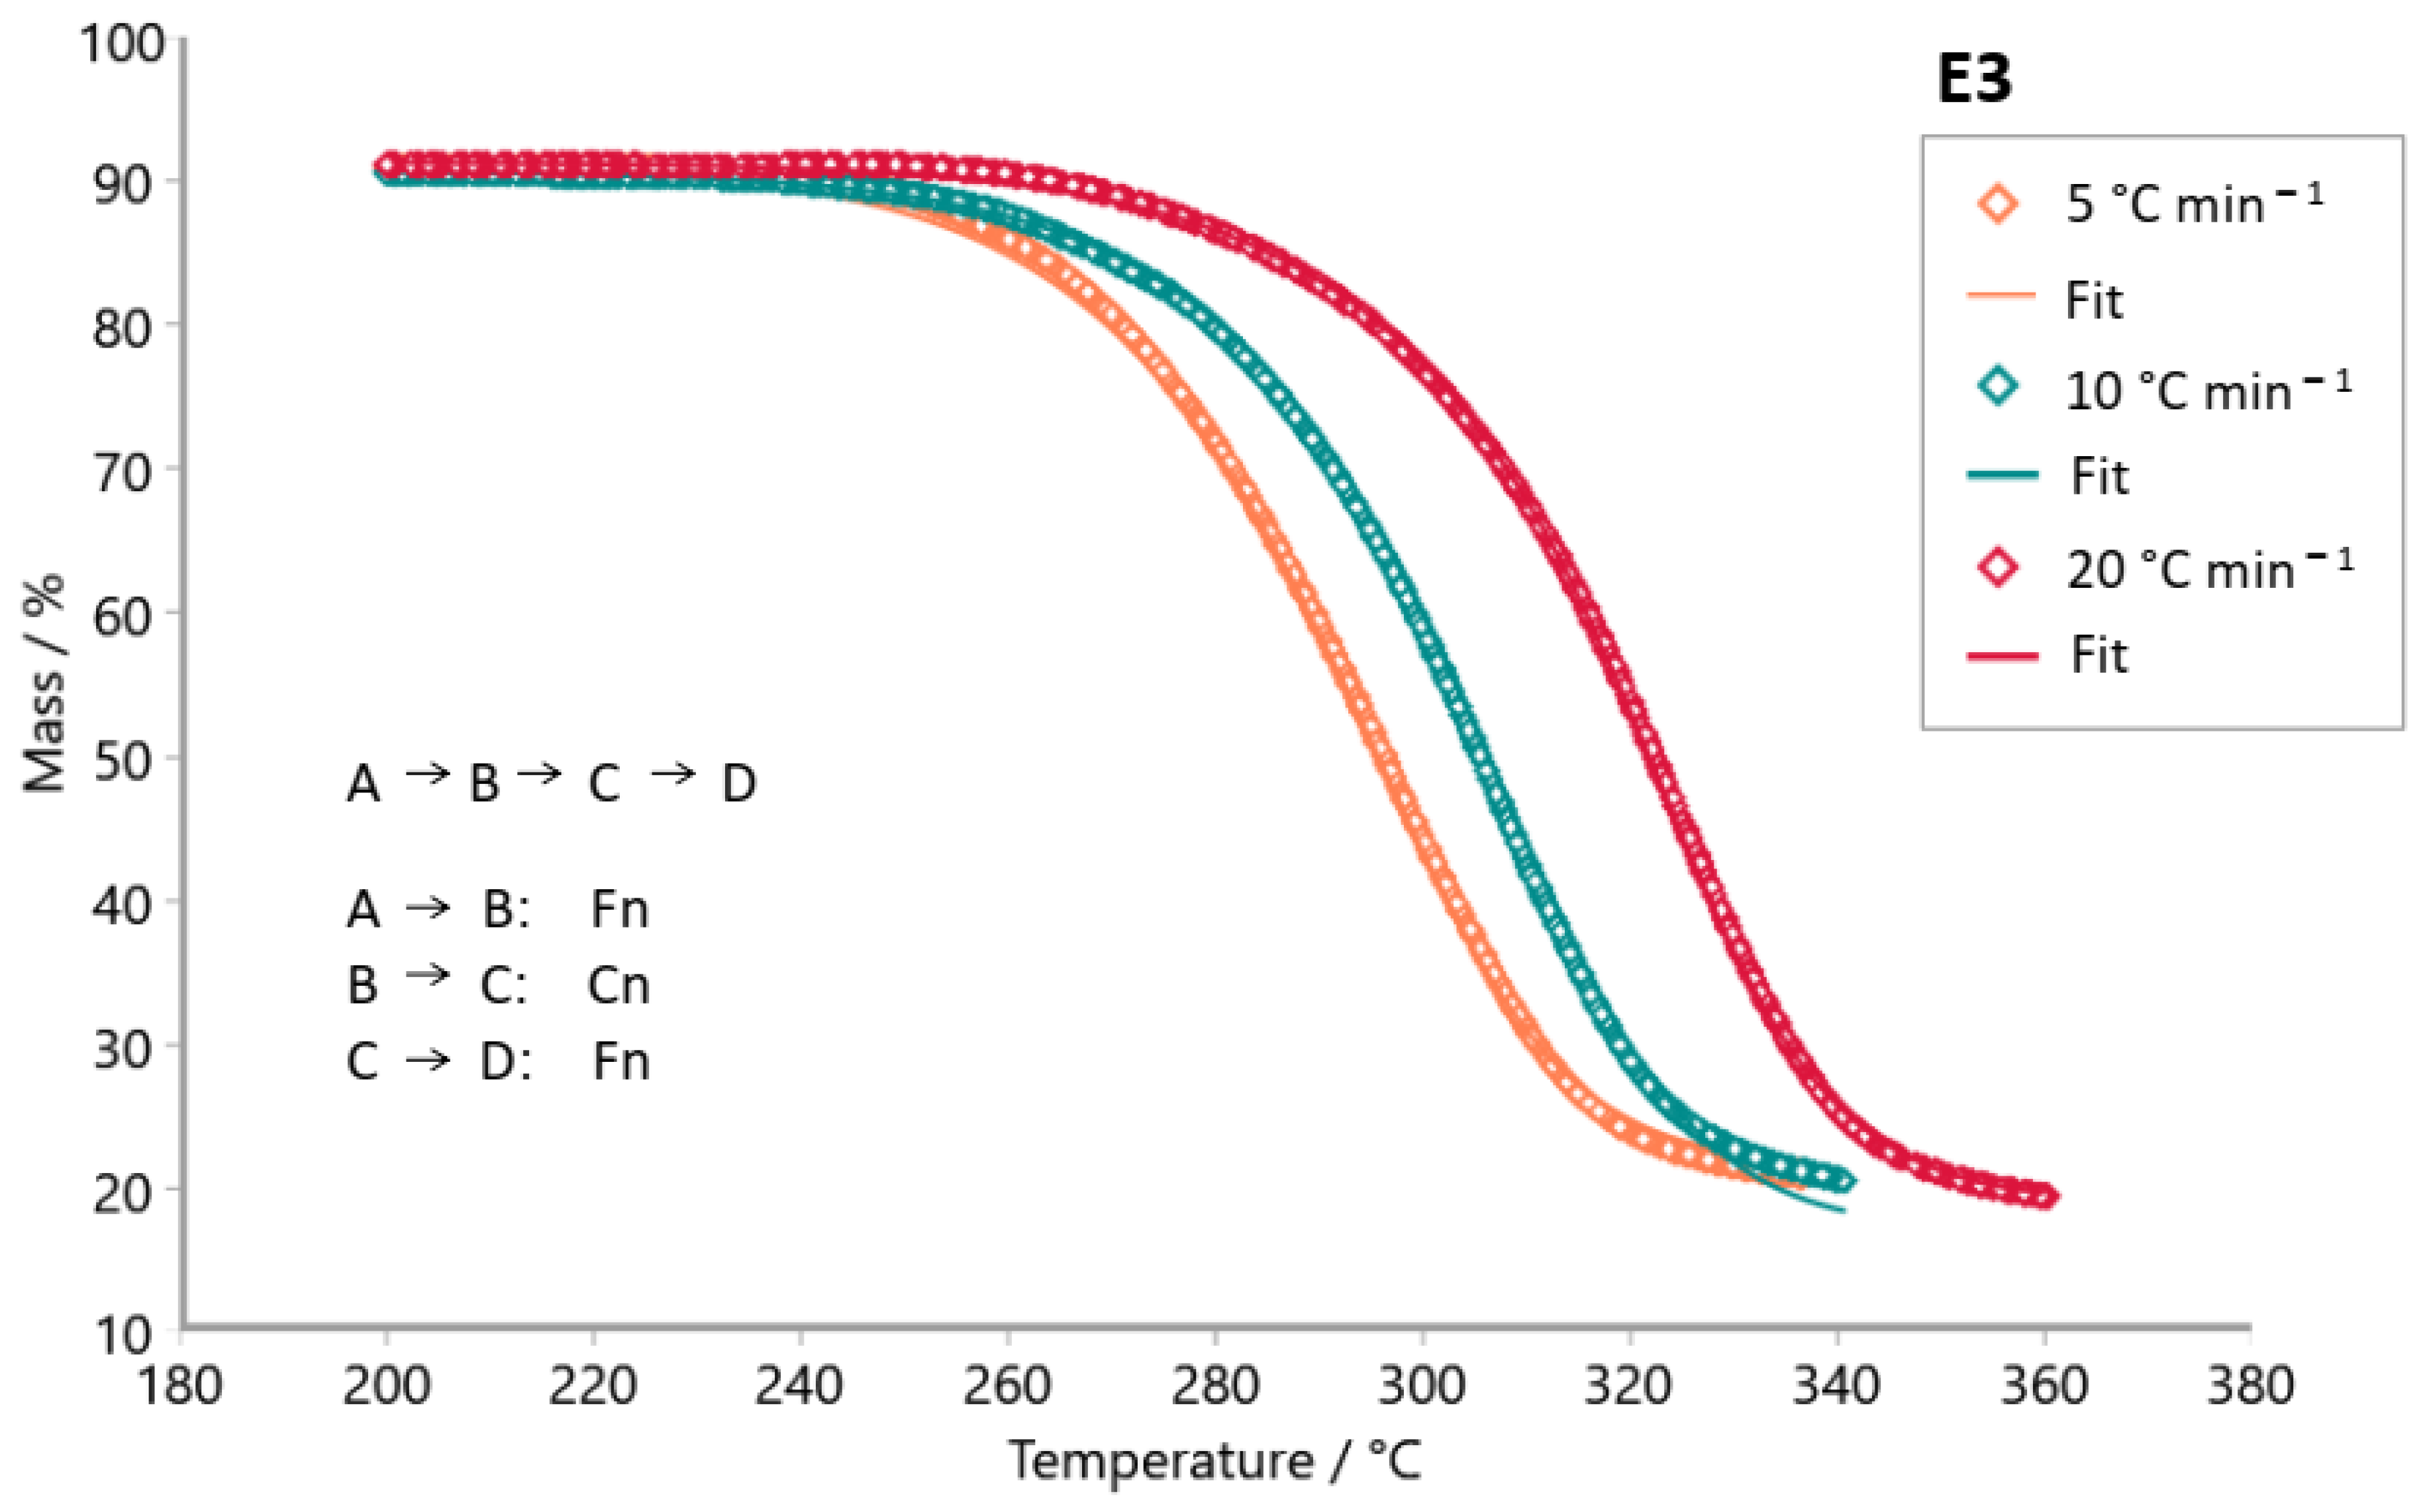
| E3 | F1Fn | 0.99940 | 1.72 | 143.04 | 139.80 | - | 10.99 | 10.80 | - | 1 | 1.55 | - |
| FnCn | 0.99942 | 1.68 | 137.55 | 133.32 | - | 10.49 | 10.15 | - | 0.97 | 1.62 | - | |
| FnCnFn | 0.99965 | 1.00 | 141.05 | 55.88 | 162.20 | 10.87 | 2.81 | 12.64 | 0.91 | 0.36 | 1.36 | |
| E4 | F1Fn | 0.99962 | 12.37 | 100.82 | 113.65 | - | 6.95 | 7.87 | - | 1 | 0.32 | - |
| FnFn | 0.99992 | 2.44 | 86.11 | 122.60 | - | 5.45 | 8.71 | - | 0.42 | 0.50 | - | |
| FnFnFn | 0.99997 | 1.00 | 88.80 | 103.48 | 147.41 | 5.72 | 6.92 | 11.68 | 0.50 | 0.14 | 1.86 | |
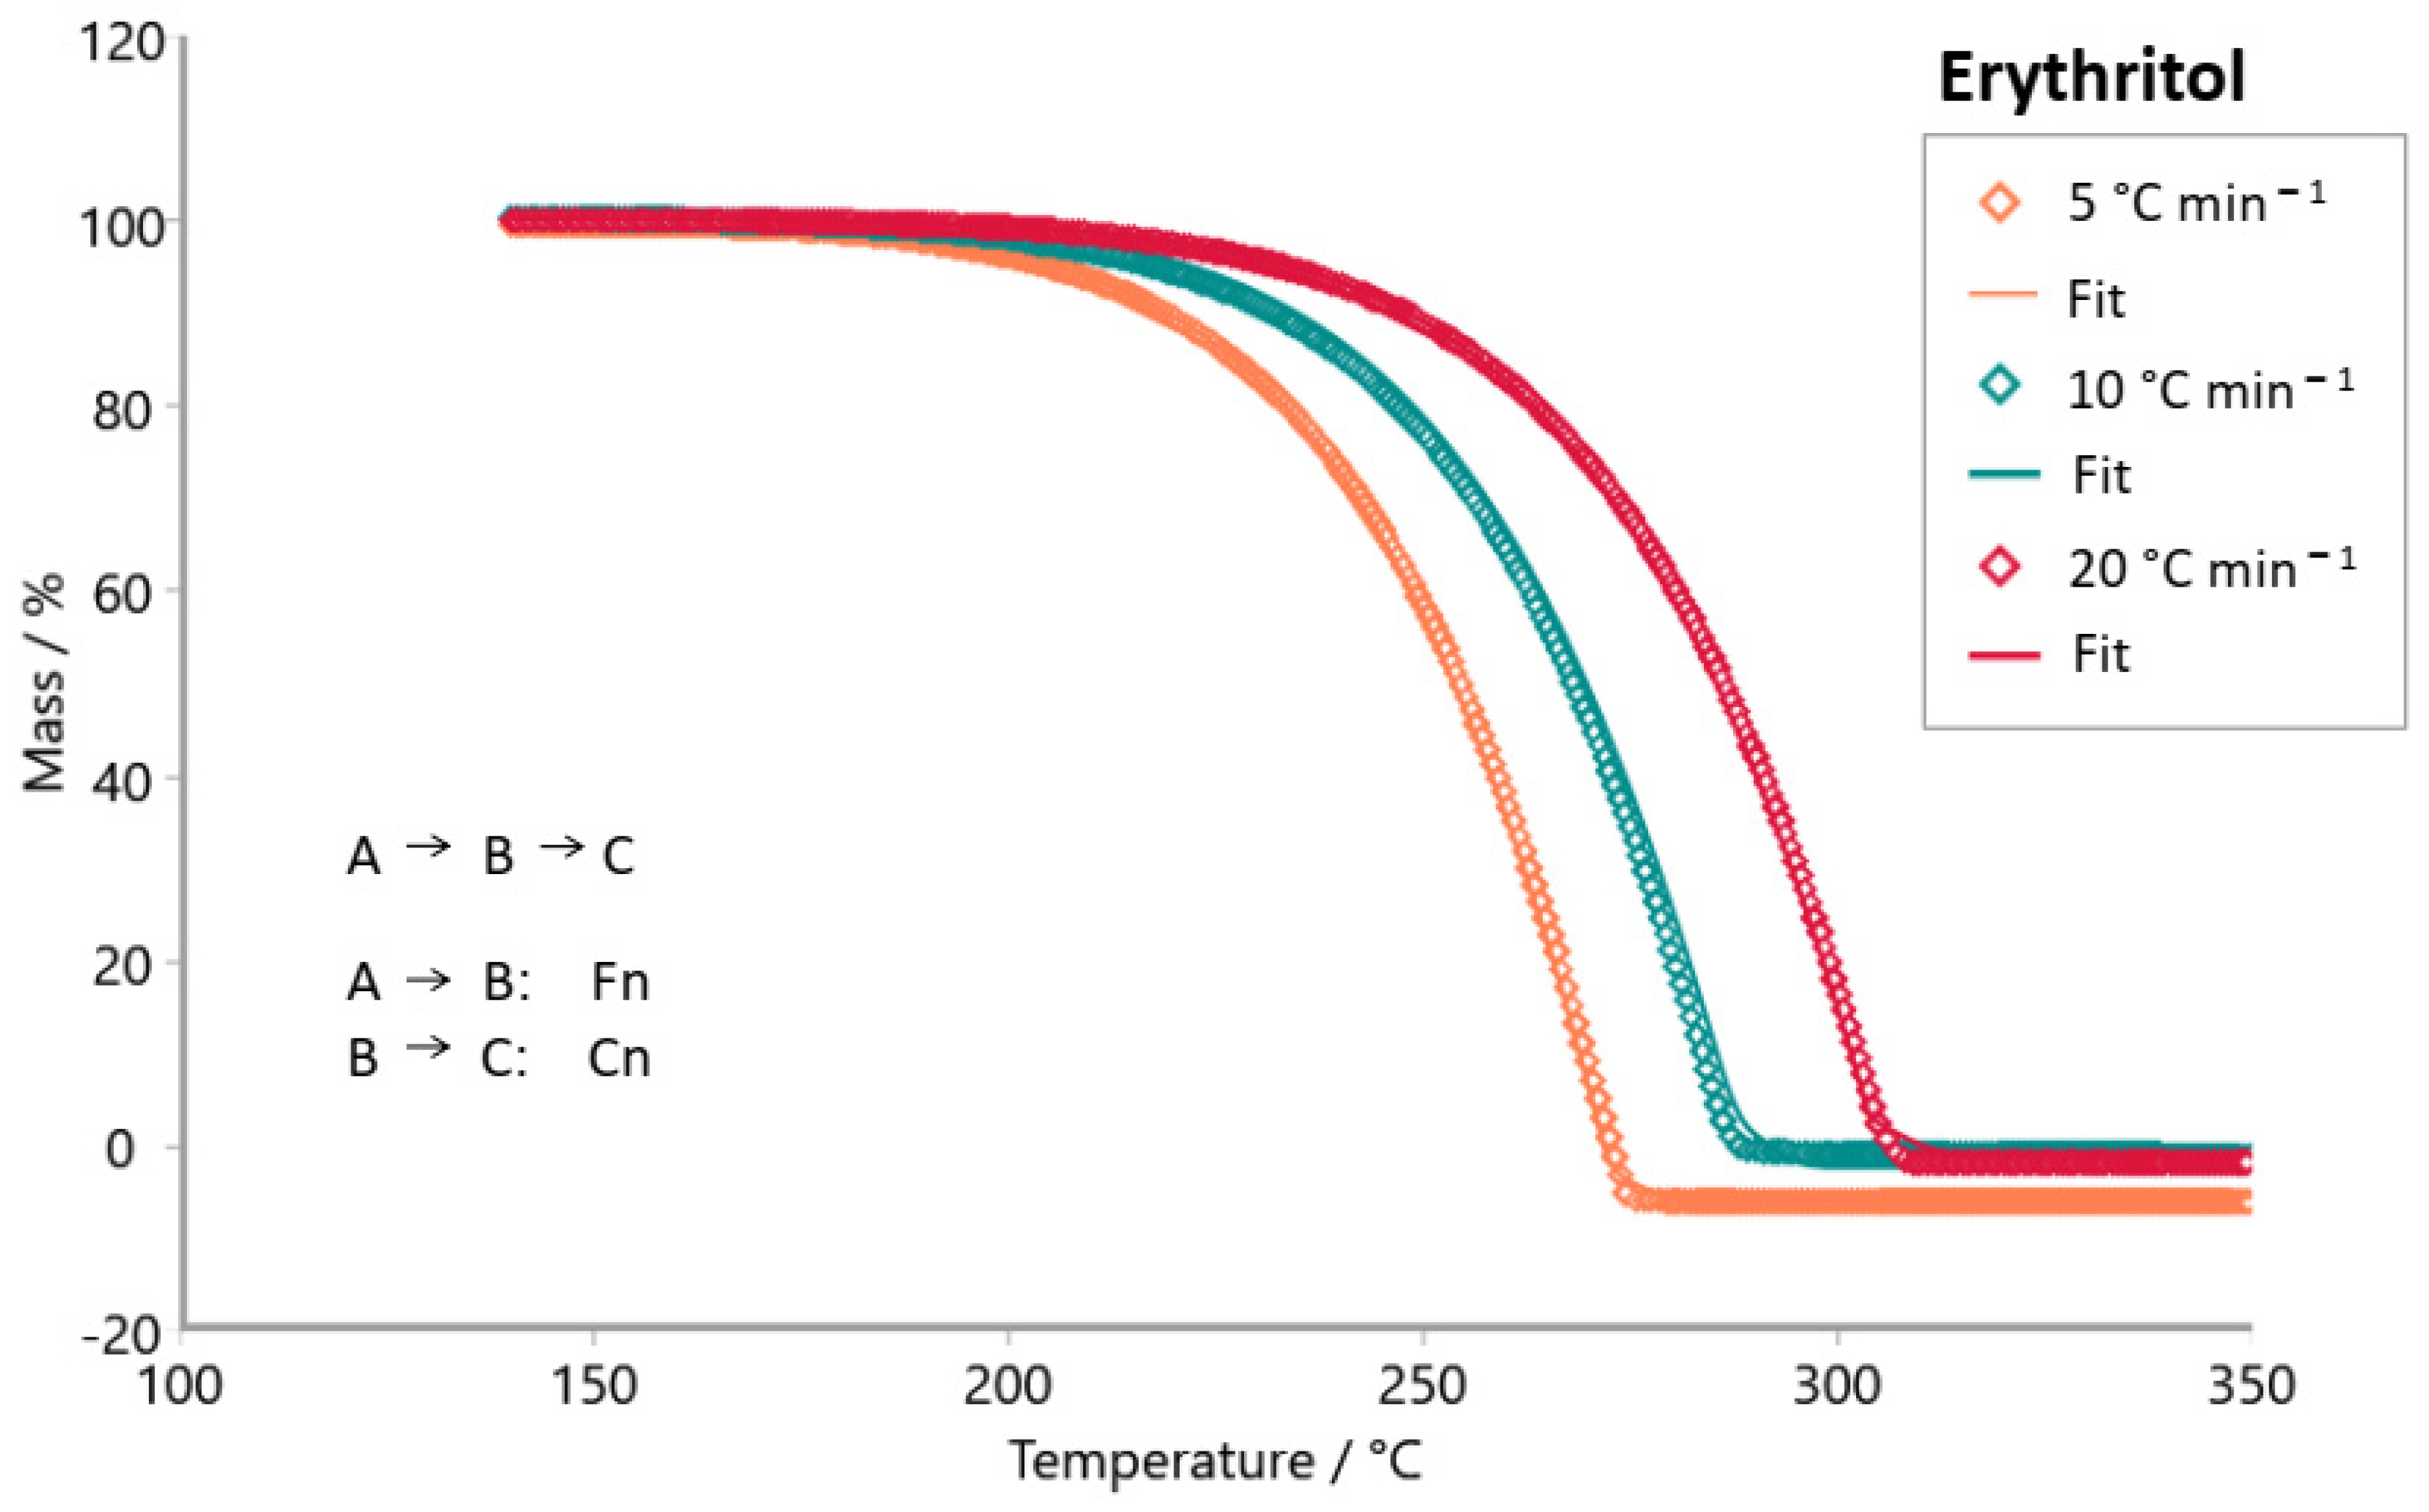
| erythritol | F1Fn | 0.99894 | 3.09 | 104.63 | 116.87 | - | 7.99 | 8.89 | - | 1 | 0.28 | - |
| FnFn | 0.99955 | 1.34 | 99.79 | −175.54 | - | 7.22 | −17.08 | - | 0.27 | 2.70 | - | |
| FnCn | 0.99966 | 1.00 | 98.56 | 100.16 | - | 7.26 | 6.98 | - | 0.2 | 0.01 | - | |
| Sample | Kinetic Model | R2 | Fexp | Ea/[kJ mol−1] | ln A/[s−1] | Reaction Order | ||||||
|---|---|---|---|---|---|---|---|---|---|---|---|---|
| Ea1 | Ea2 | Ea3 | A1 | A2 | A3 | n1 | n2 | n3 | ||||
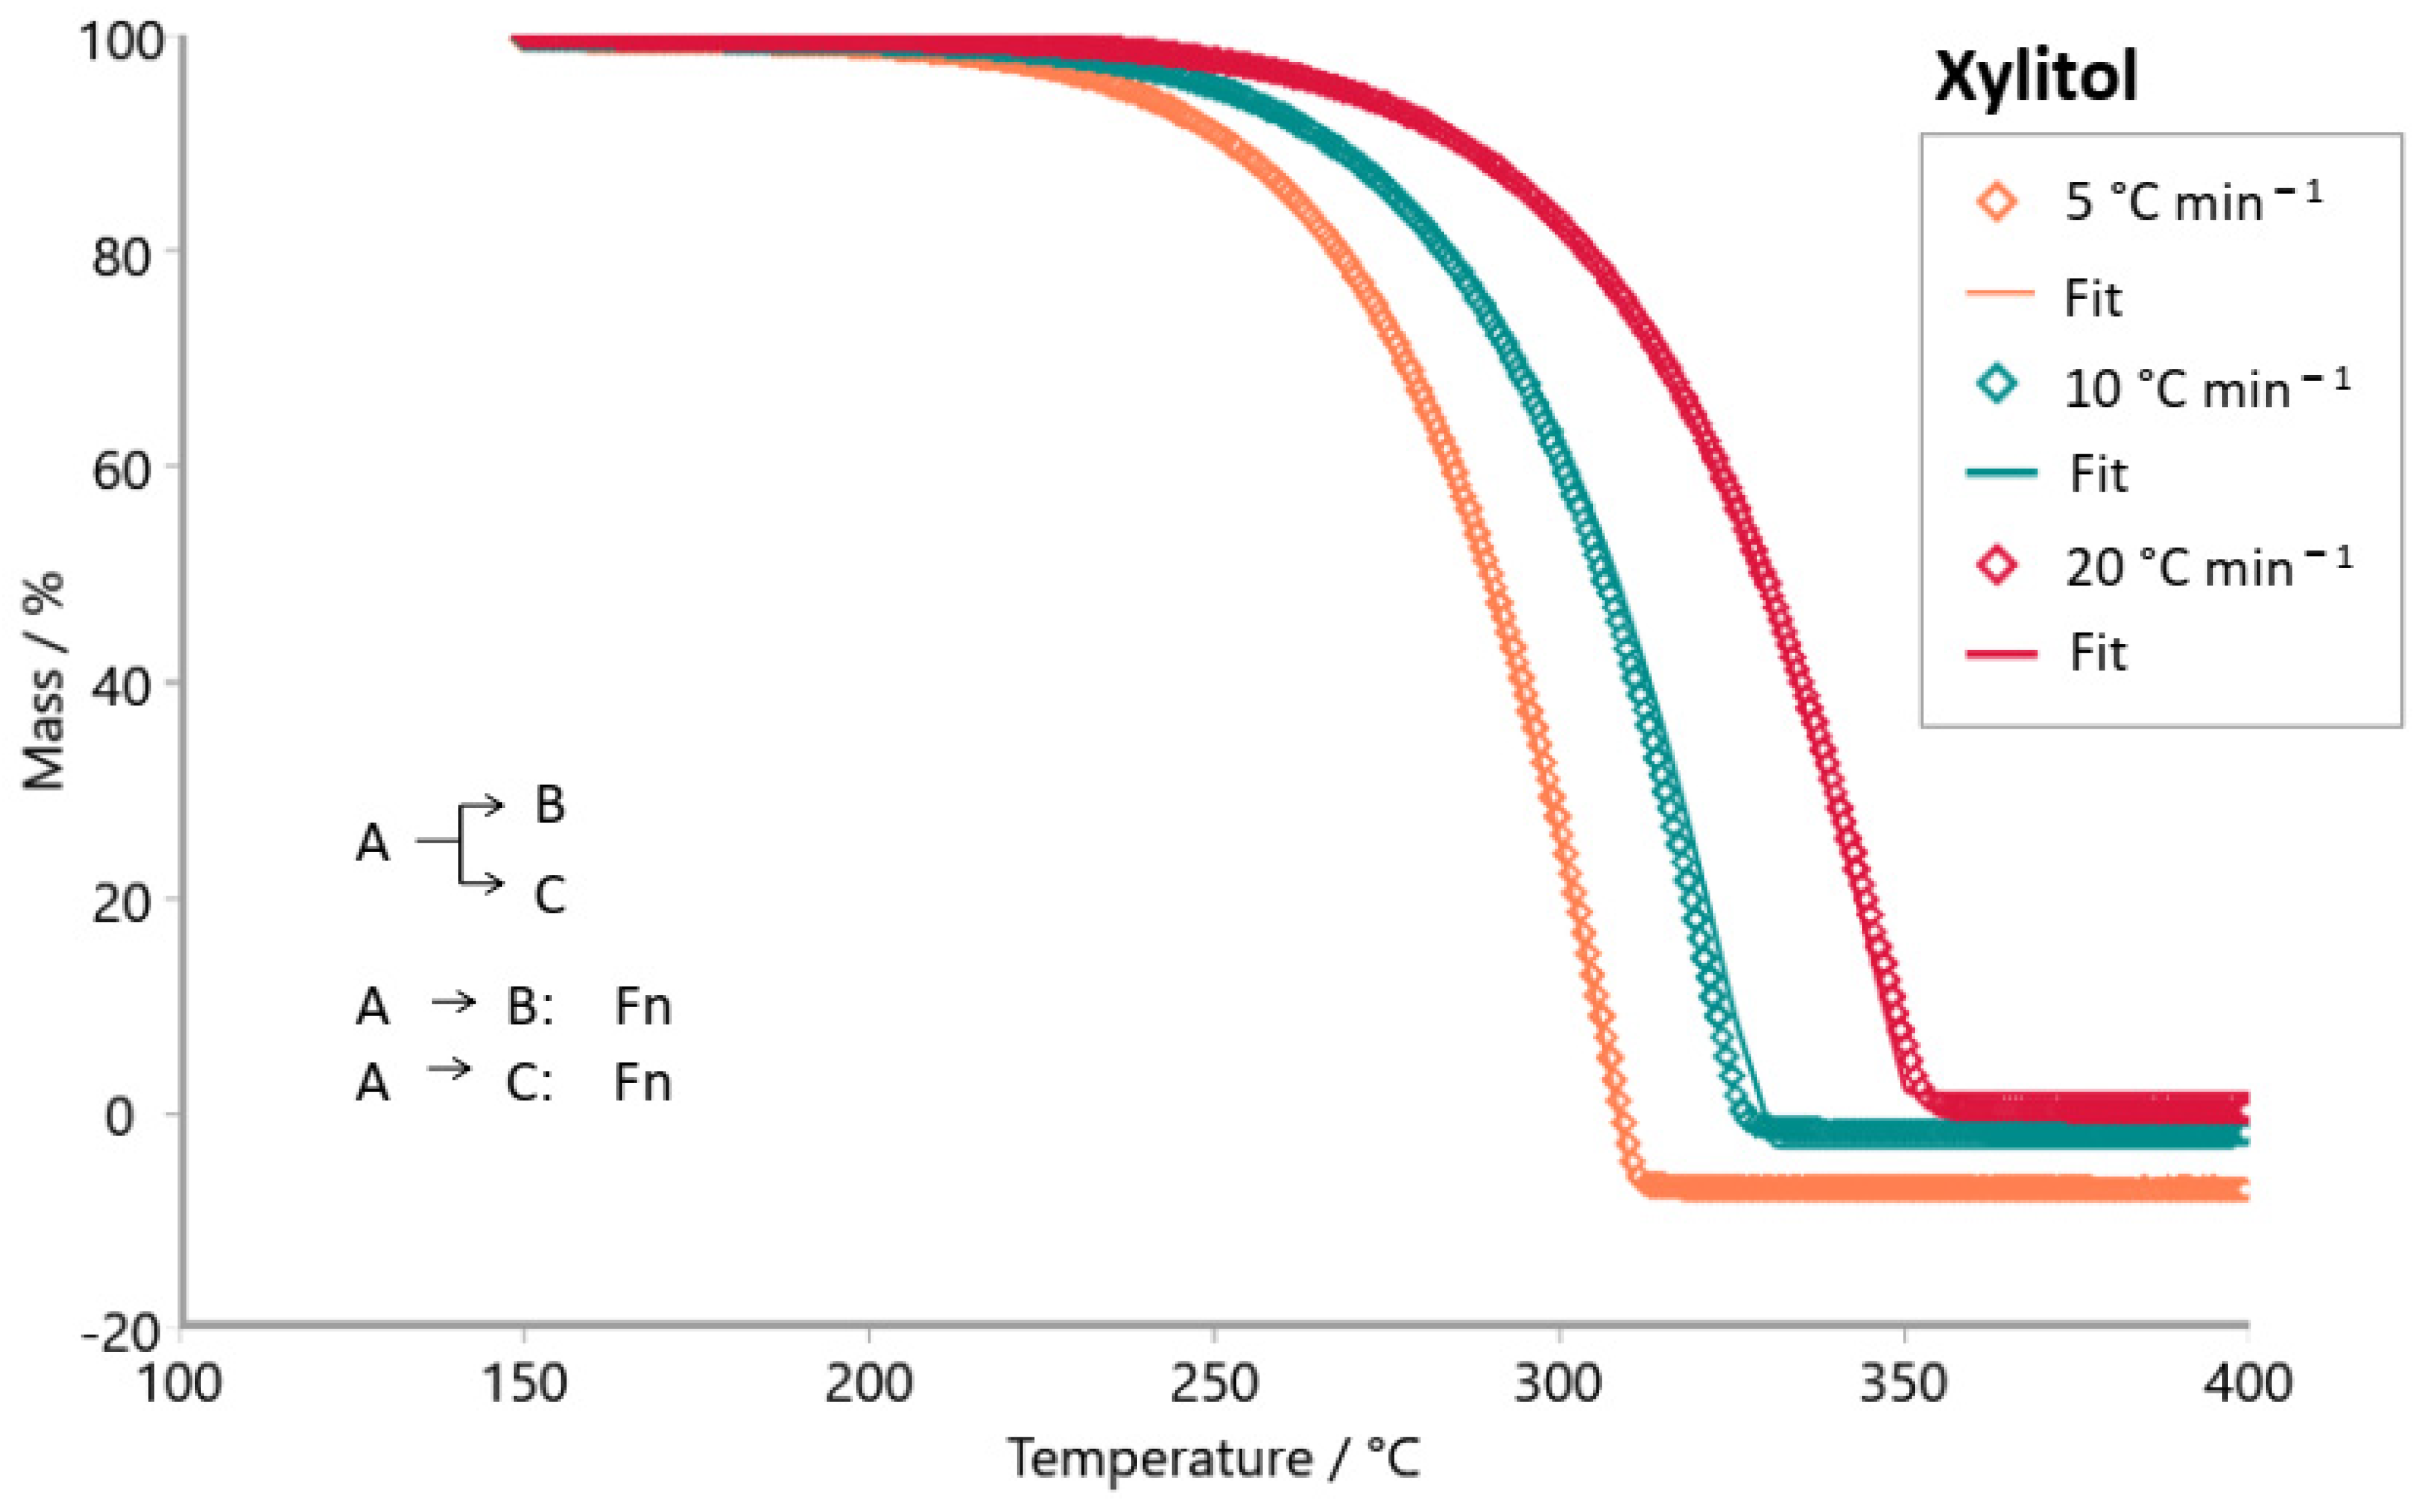
| xylitol | F1Fn | 0.99957 | 1.000 | 85.77 | 94.42 | - | −10.41 | 5.96 | - | 1 | 0.08 | - |
| FnFn | 0.99957 | 1.002 | 96.88 | 93.97 | - | 5.15 | 5.88 | - | 0.25 | 0.06 | - | |
Disclaimer/Publisher’s Note: The statements, opinions and data contained in all publications are solely those of the individual author(s) and contributor(s) and not of MDPI and/or the editor(s). MDPI and/or the editor(s) disclaim responsibility for any injury to people or property resulting from any ideas, methods, instructions or products referred to in the content. |
© 2025 by the authors. Licensee MDPI, Basel, Switzerland. This article is an open access article distributed under the terms and conditions of the Creative Commons Attribution (CC BY) license (https://creativecommons.org/licenses/by/4.0/).
Share and Cite
Santana, N.d.S.; Monteiro, S.N.; Silva, T.C.d.; Mothé, M.G. Investigation and Determination of Kinetic Parameters of Sweeteners Based on Steviol Glycosides by Isoconversional Methods. Foods 2025, 14, 1233. https://doi.org/10.3390/foods14071233
Santana NdS, Monteiro SN, Silva TCd, Mothé MG. Investigation and Determination of Kinetic Parameters of Sweeteners Based on Steviol Glycosides by Isoconversional Methods. Foods. 2025; 14(7):1233. https://doi.org/10.3390/foods14071233
Chicago/Turabian StyleSantana, Naienne da Silva, Sergio Neves Monteiro, Tatiana Carestiato da Silva, and Michelle Gonçalves Mothé. 2025. "Investigation and Determination of Kinetic Parameters of Sweeteners Based on Steviol Glycosides by Isoconversional Methods" Foods 14, no. 7: 1233. https://doi.org/10.3390/foods14071233
APA StyleSantana, N. d. S., Monteiro, S. N., Silva, T. C. d., & Mothé, M. G. (2025). Investigation and Determination of Kinetic Parameters of Sweeteners Based on Steviol Glycosides by Isoconversional Methods. Foods, 14(7), 1233. https://doi.org/10.3390/foods14071233