
Changes in Quality and Safety Indexes During Rice Harvest and Discussion on Drying Technology

Abstract
1. Introduction
2. Materials and Methods
2.1. General Situation of Experimental Site
2.2. Experimental Material
2.3. Experimental Method
2.3.1. Drying Process
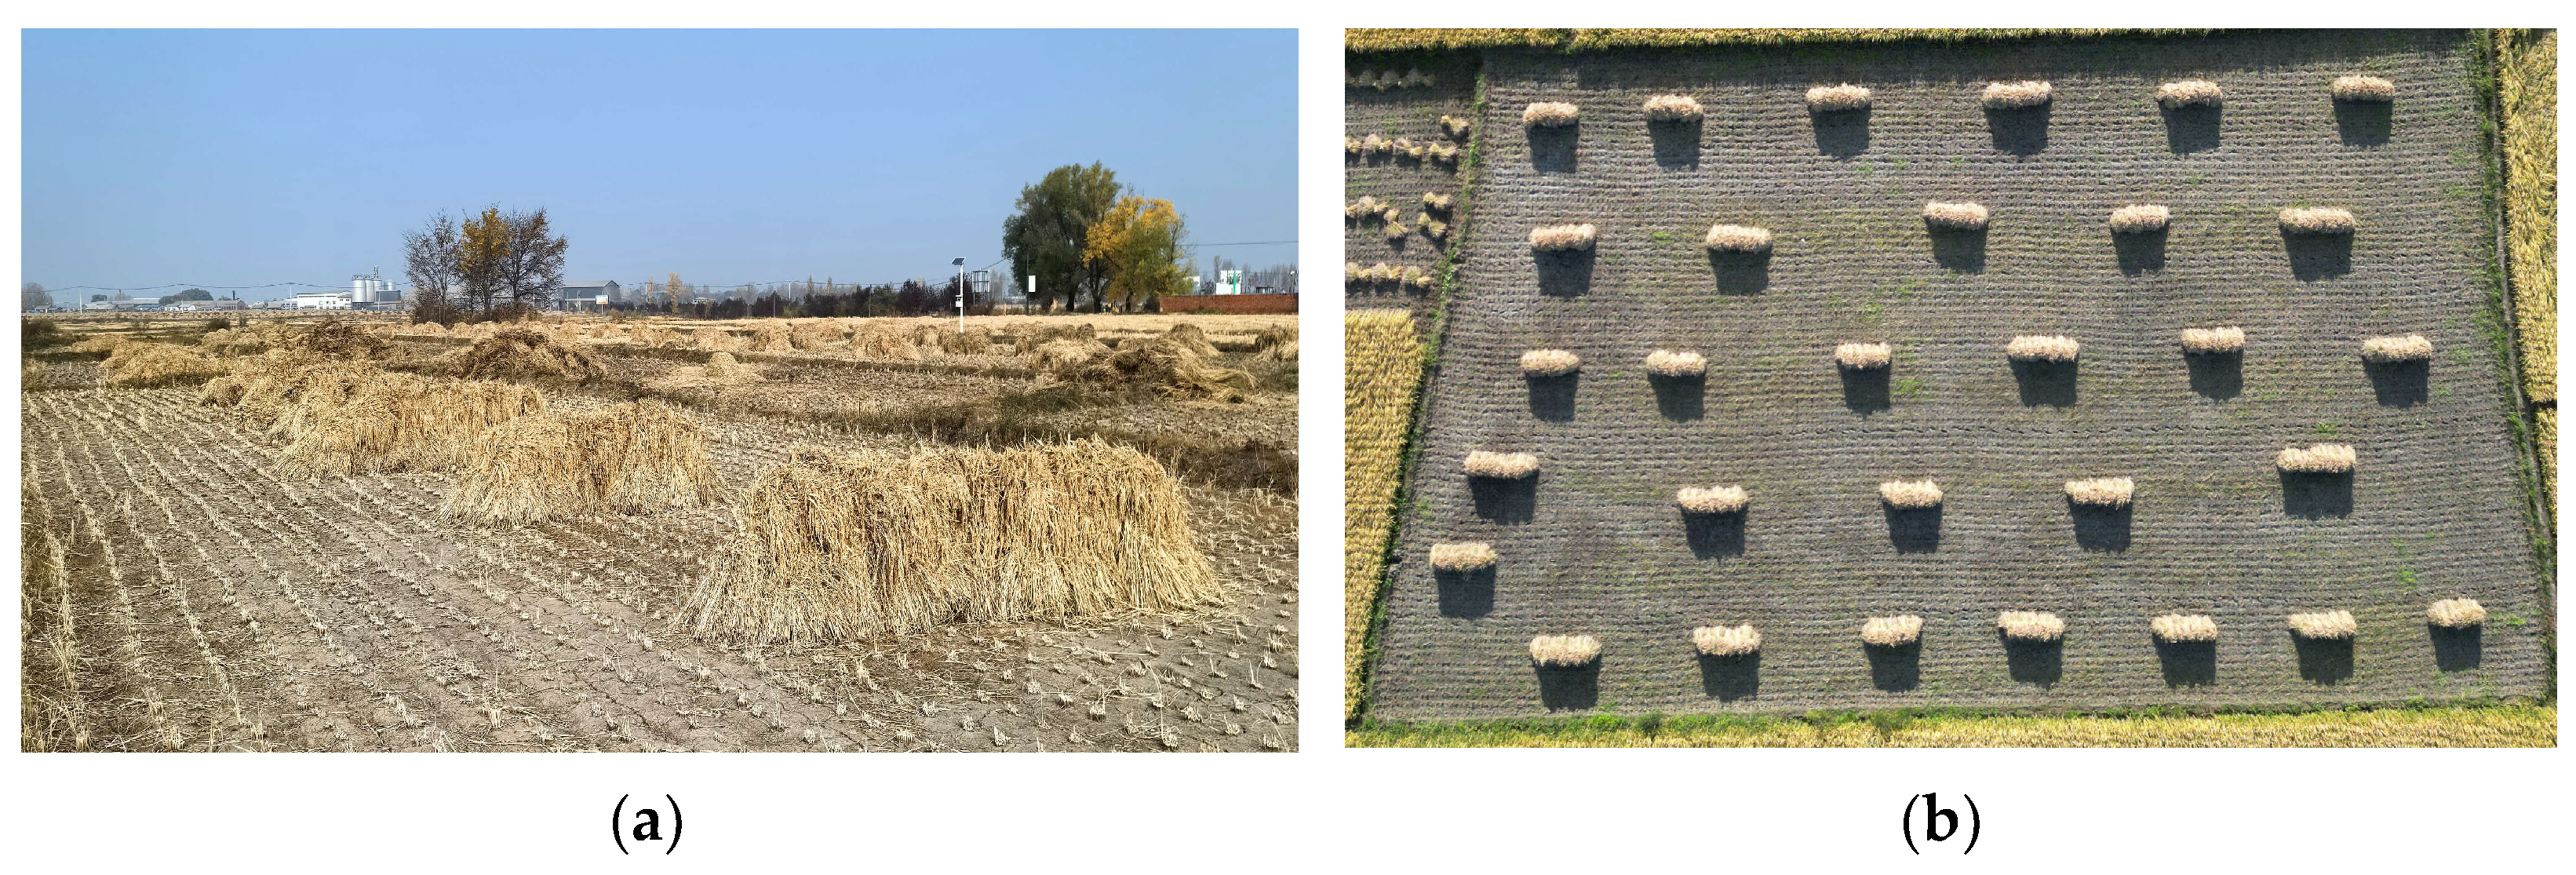
Natural Drying
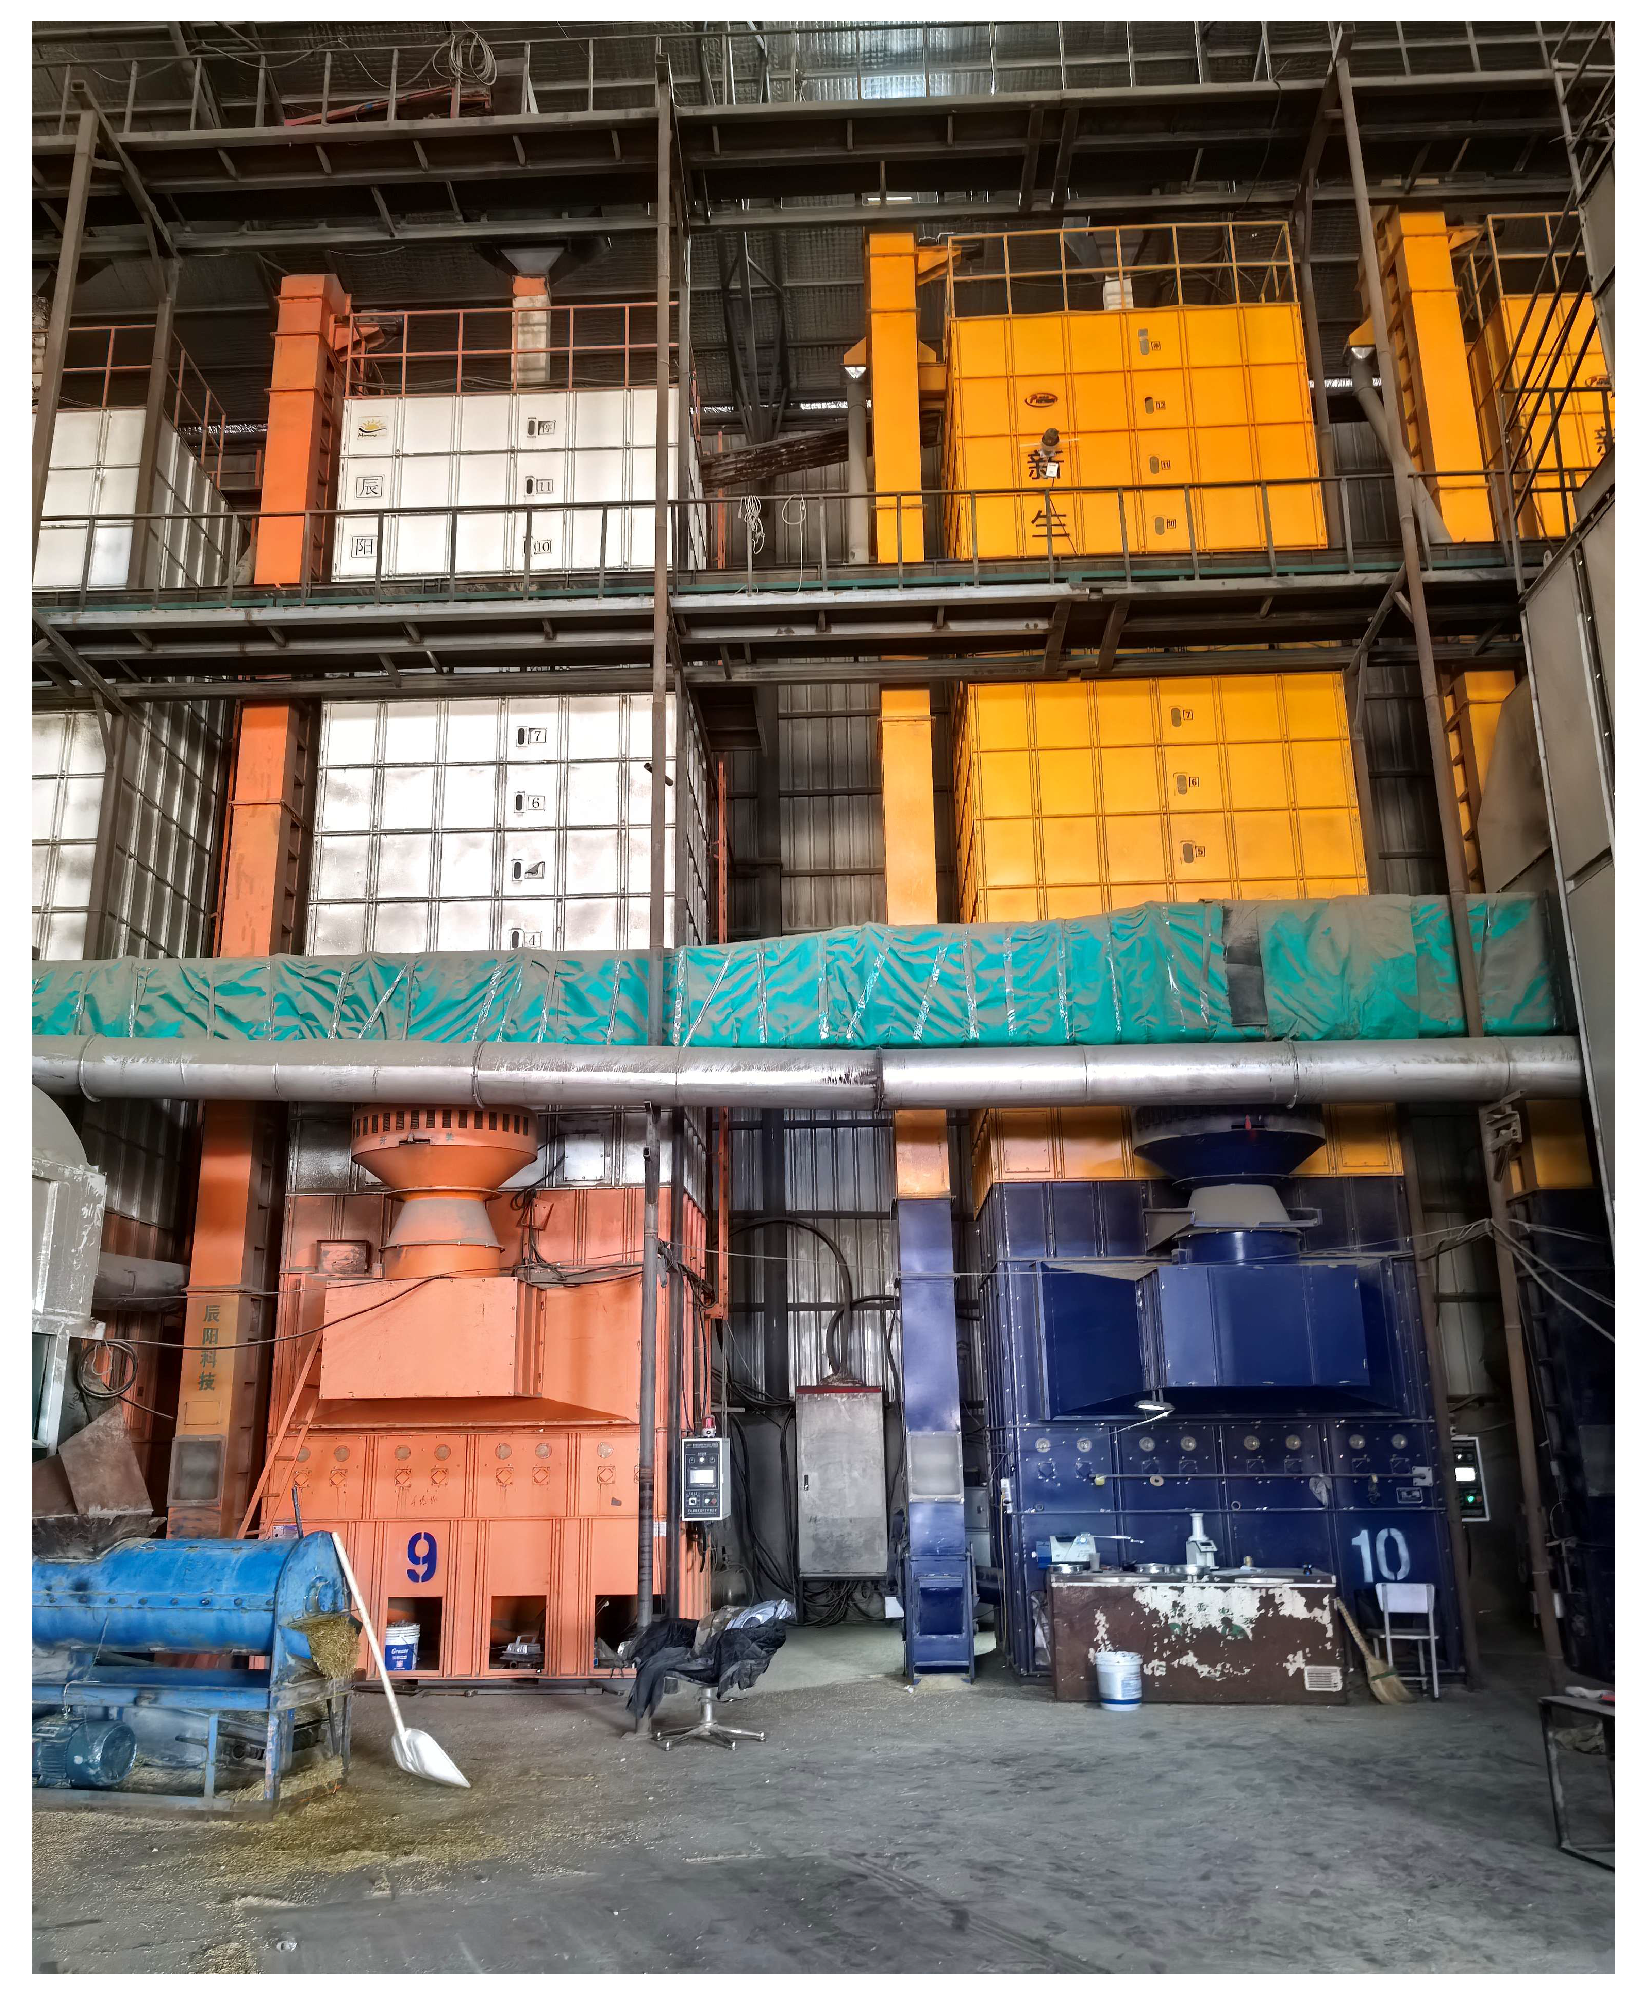
Mechanical Drying
2.3.2. Quality Index
Moisture Content
Dry-Basis 1000-Grain Weight
Yellowing Rate
RVA Characteristic Spectrum (Viscosity Characteristics of Rice)
Antioxidant Enzyme Activity
2.3.3. Safety Index
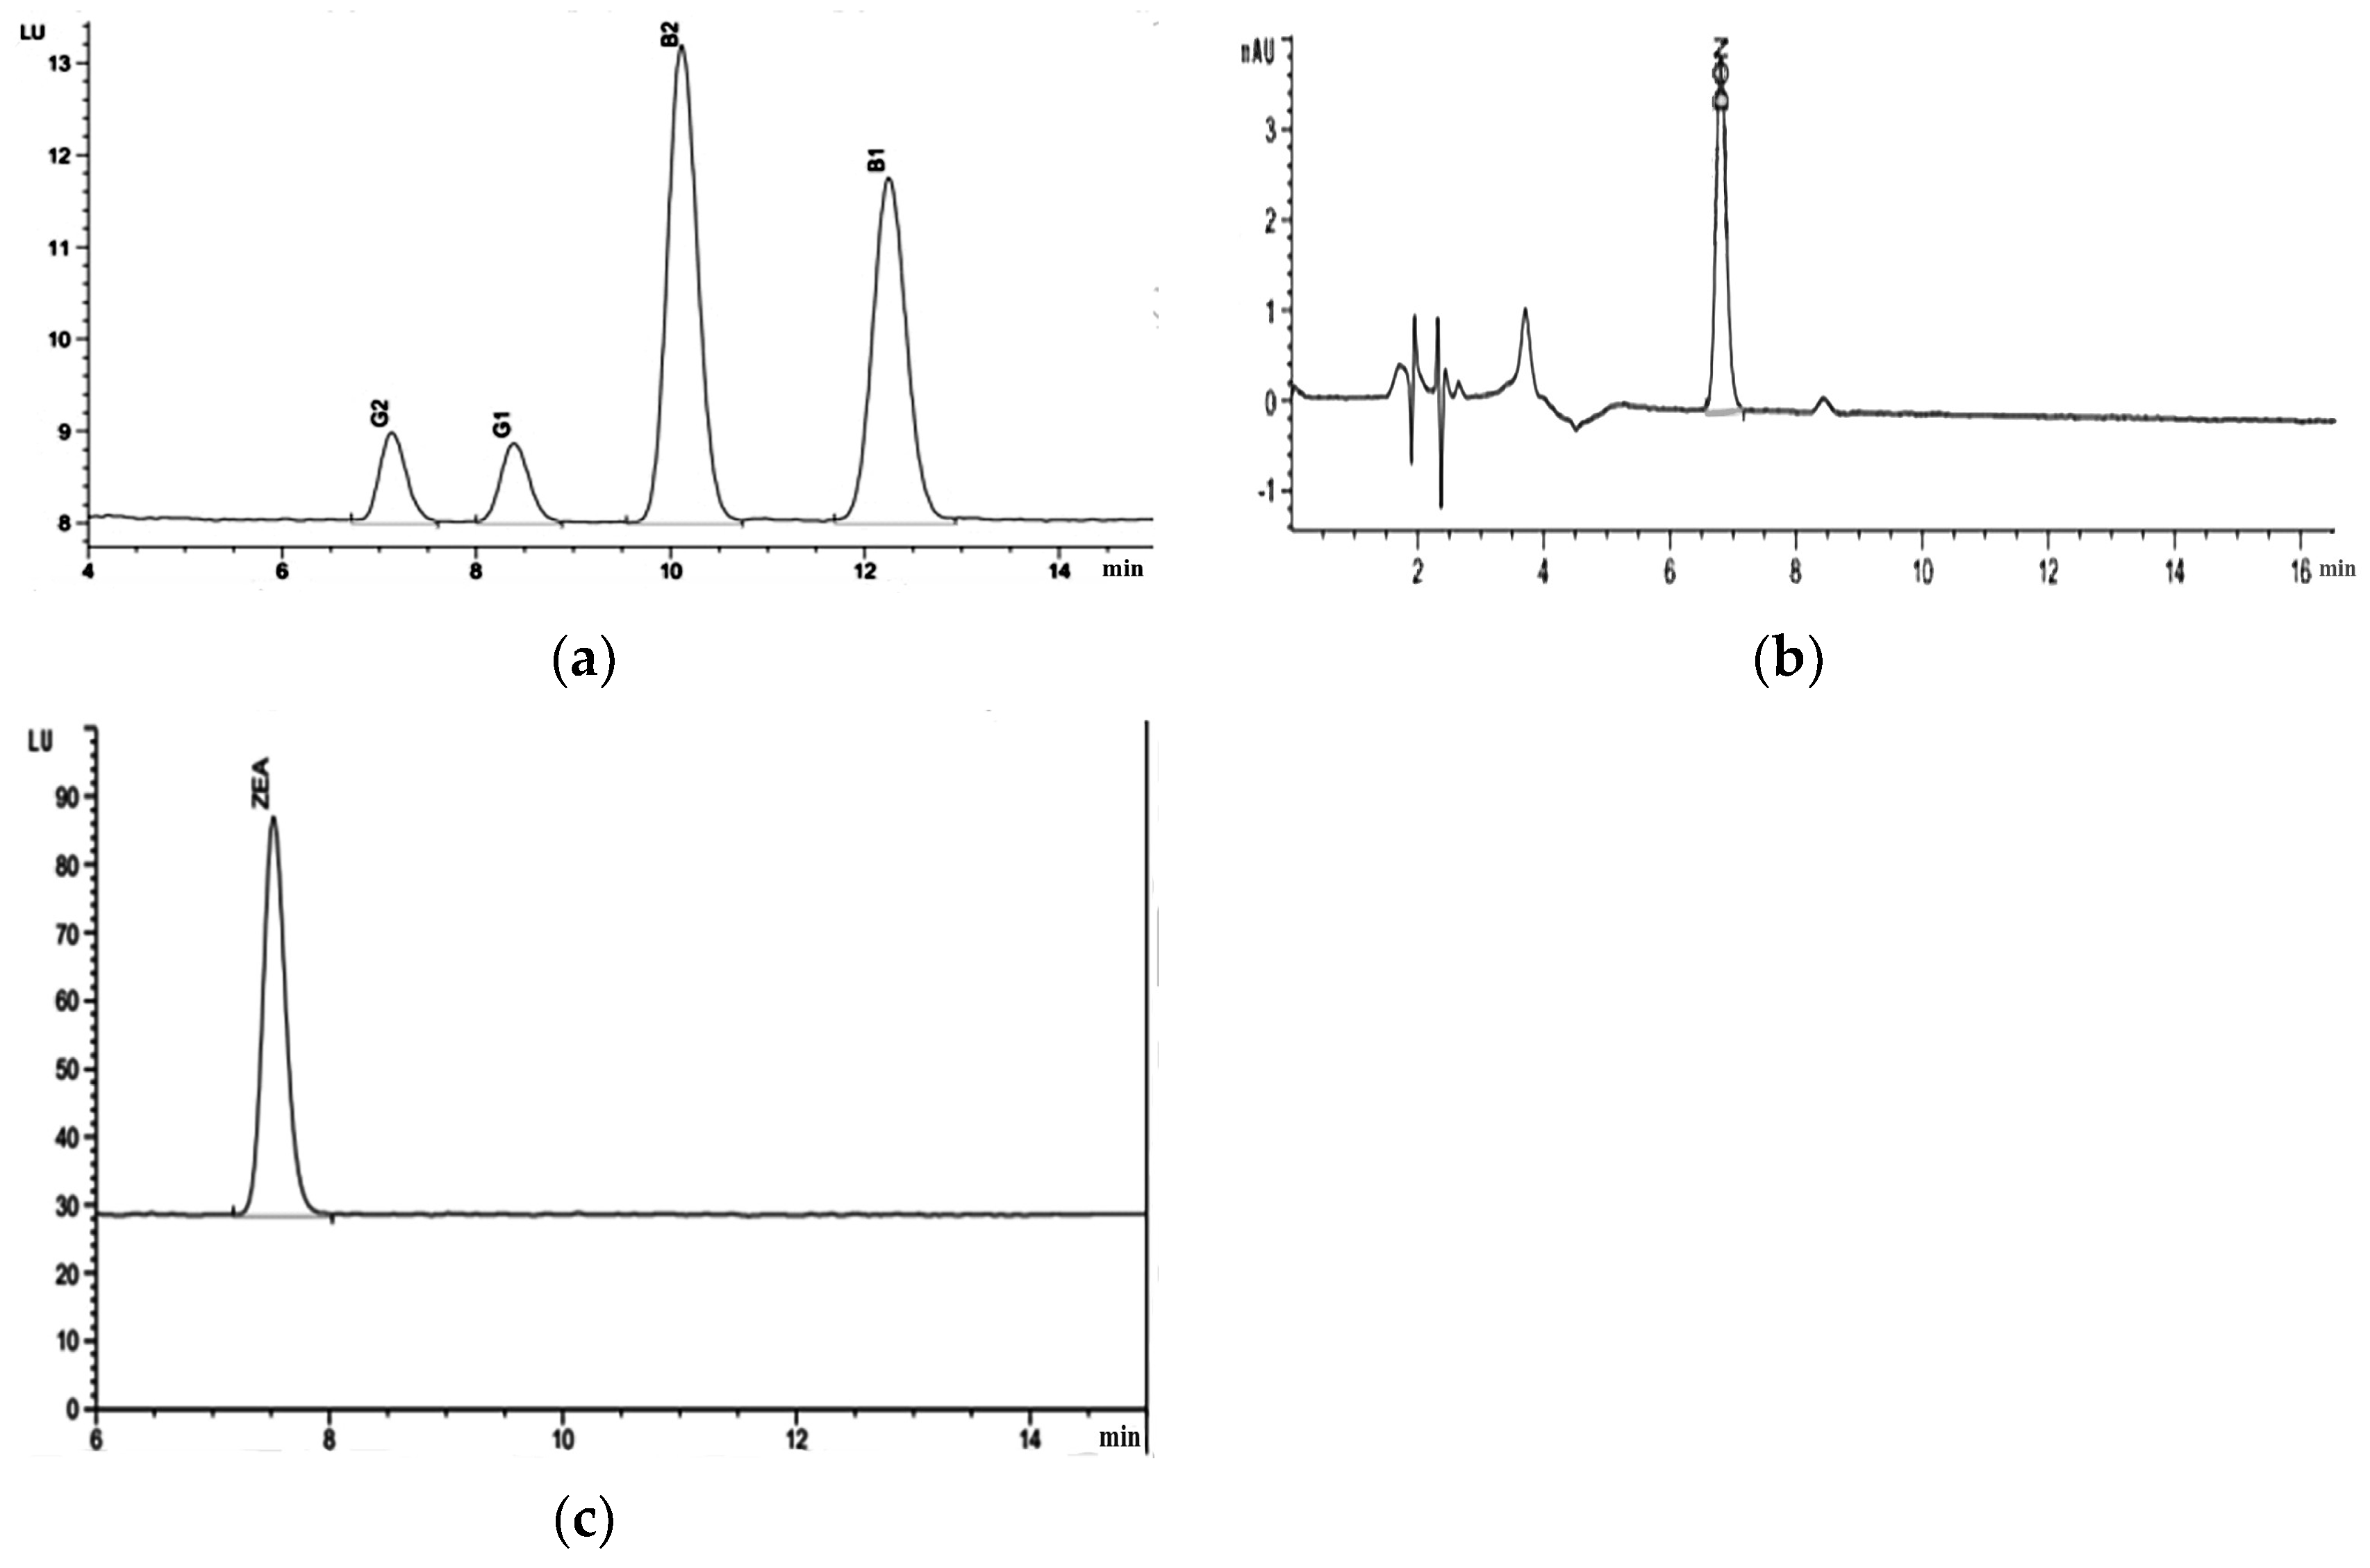
Determination of Aflatoxin B1
- Materials and Instruments
- HPLC Reference Conditions
- Sample Preparation
- Purification
Determination of Vomitoxin
- Materials and Instruments
- HPLC Reference Conditions
- Sample Preparation
- Purification
- Elution
Determination of Zearalenone
- Materials and Instruments
- HPLC Reference Conditions
- Sample Preparation
- Purification
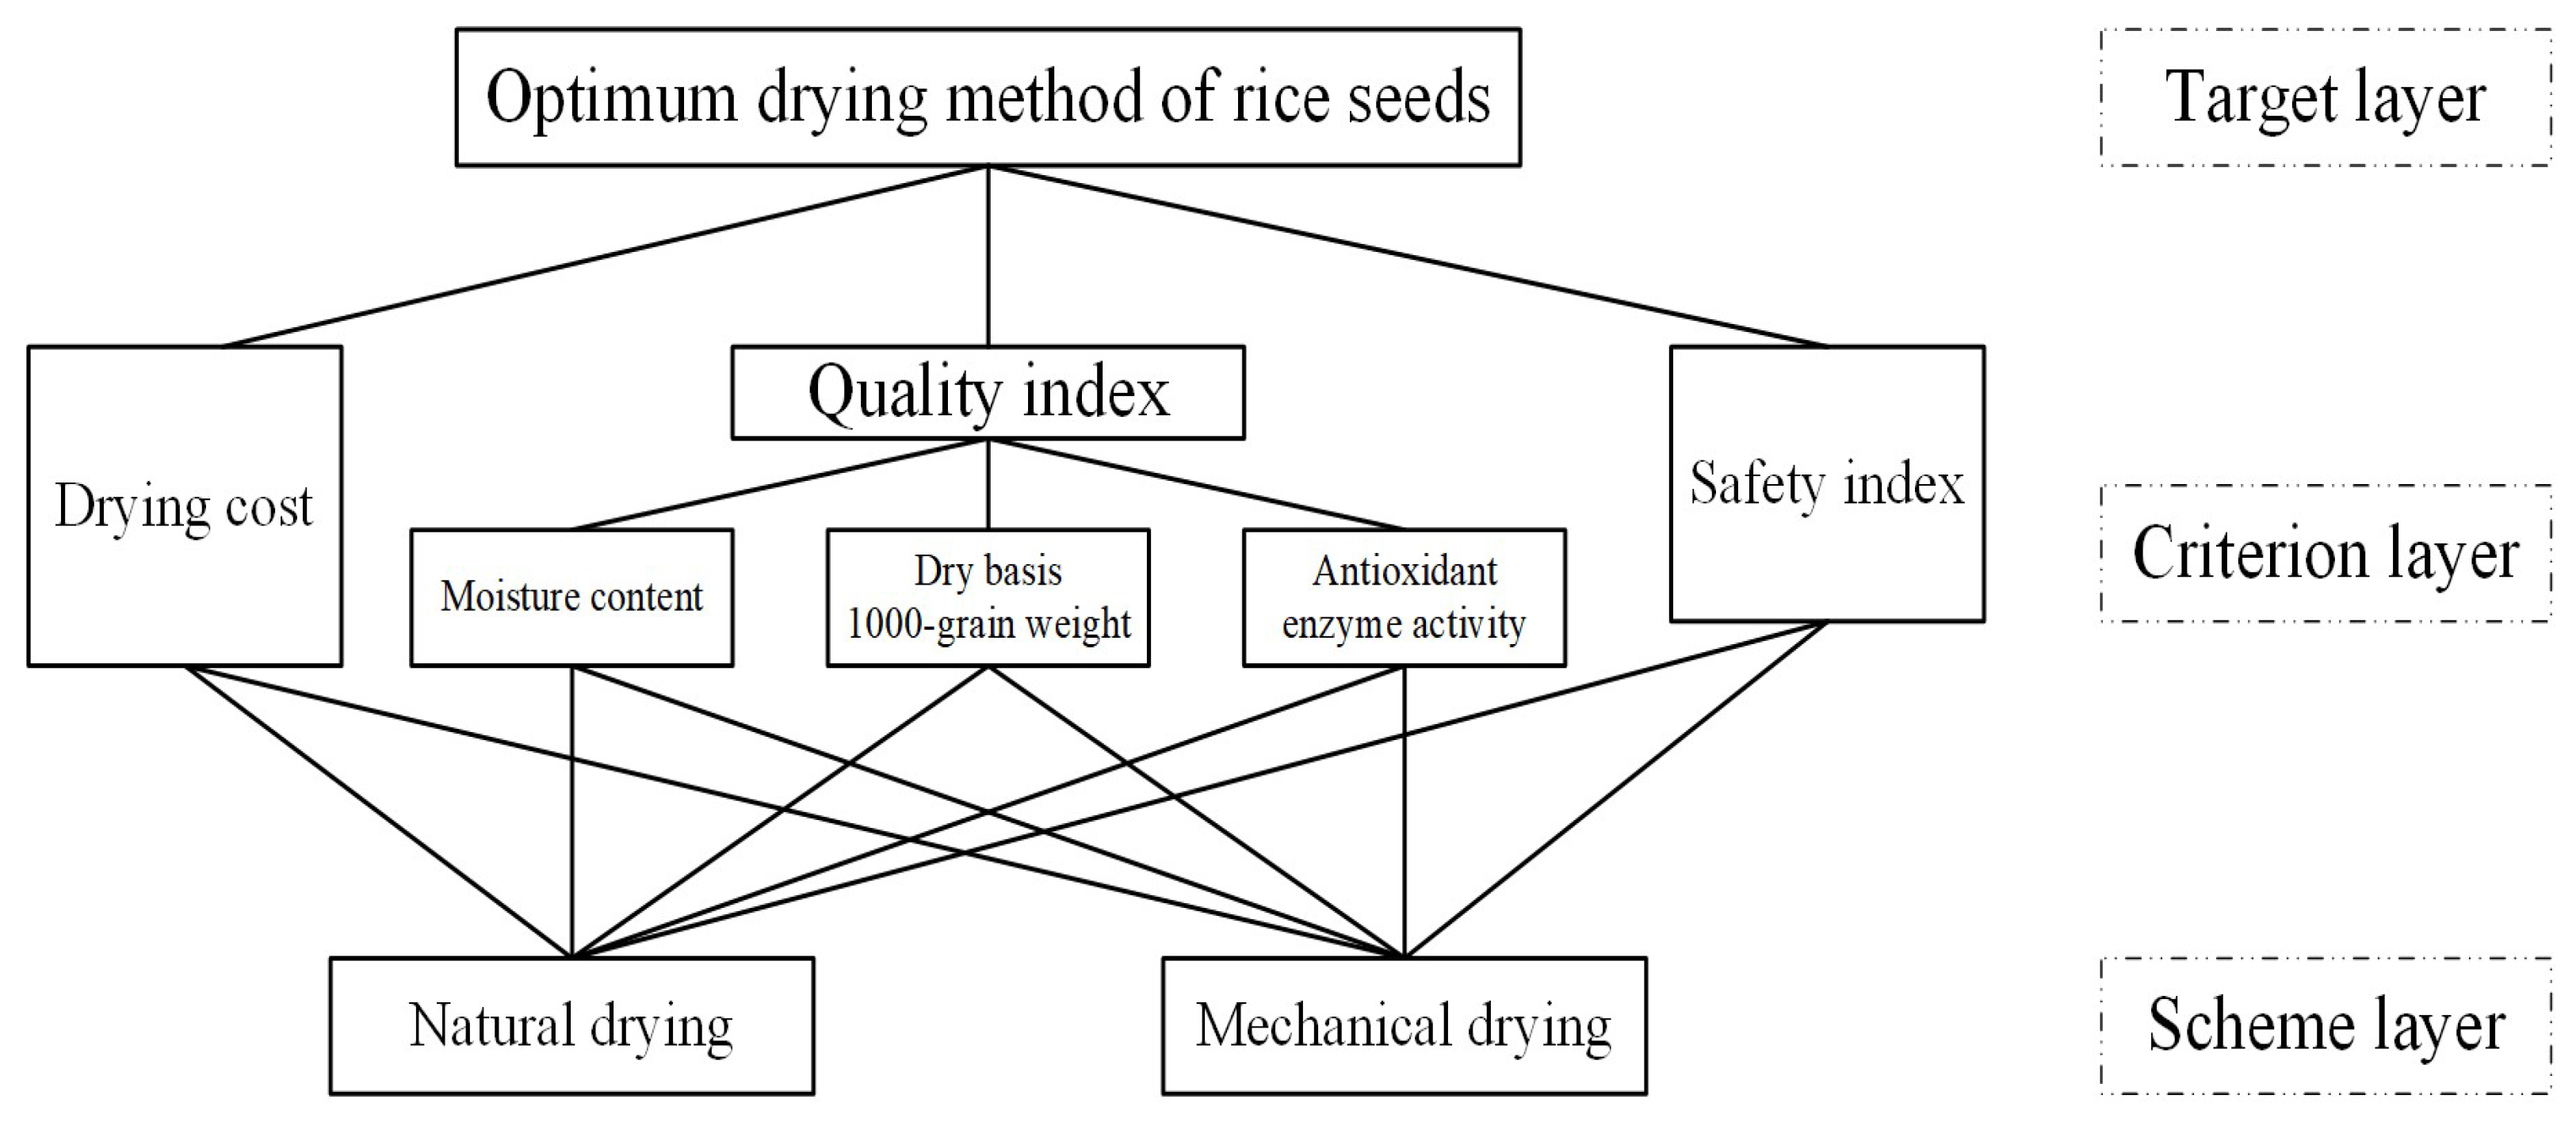
2.3.4. Comprehensive Scoring Method
Establish a Hierarchical Model
Construction of Judgment Matrix
Matrix Consistency Test
Data Standardization and Comprehensive Score Calculation
3. Results
3.1. Changes in Rice Grain Quality and Safety Indicators Under Natural Drying Conditions
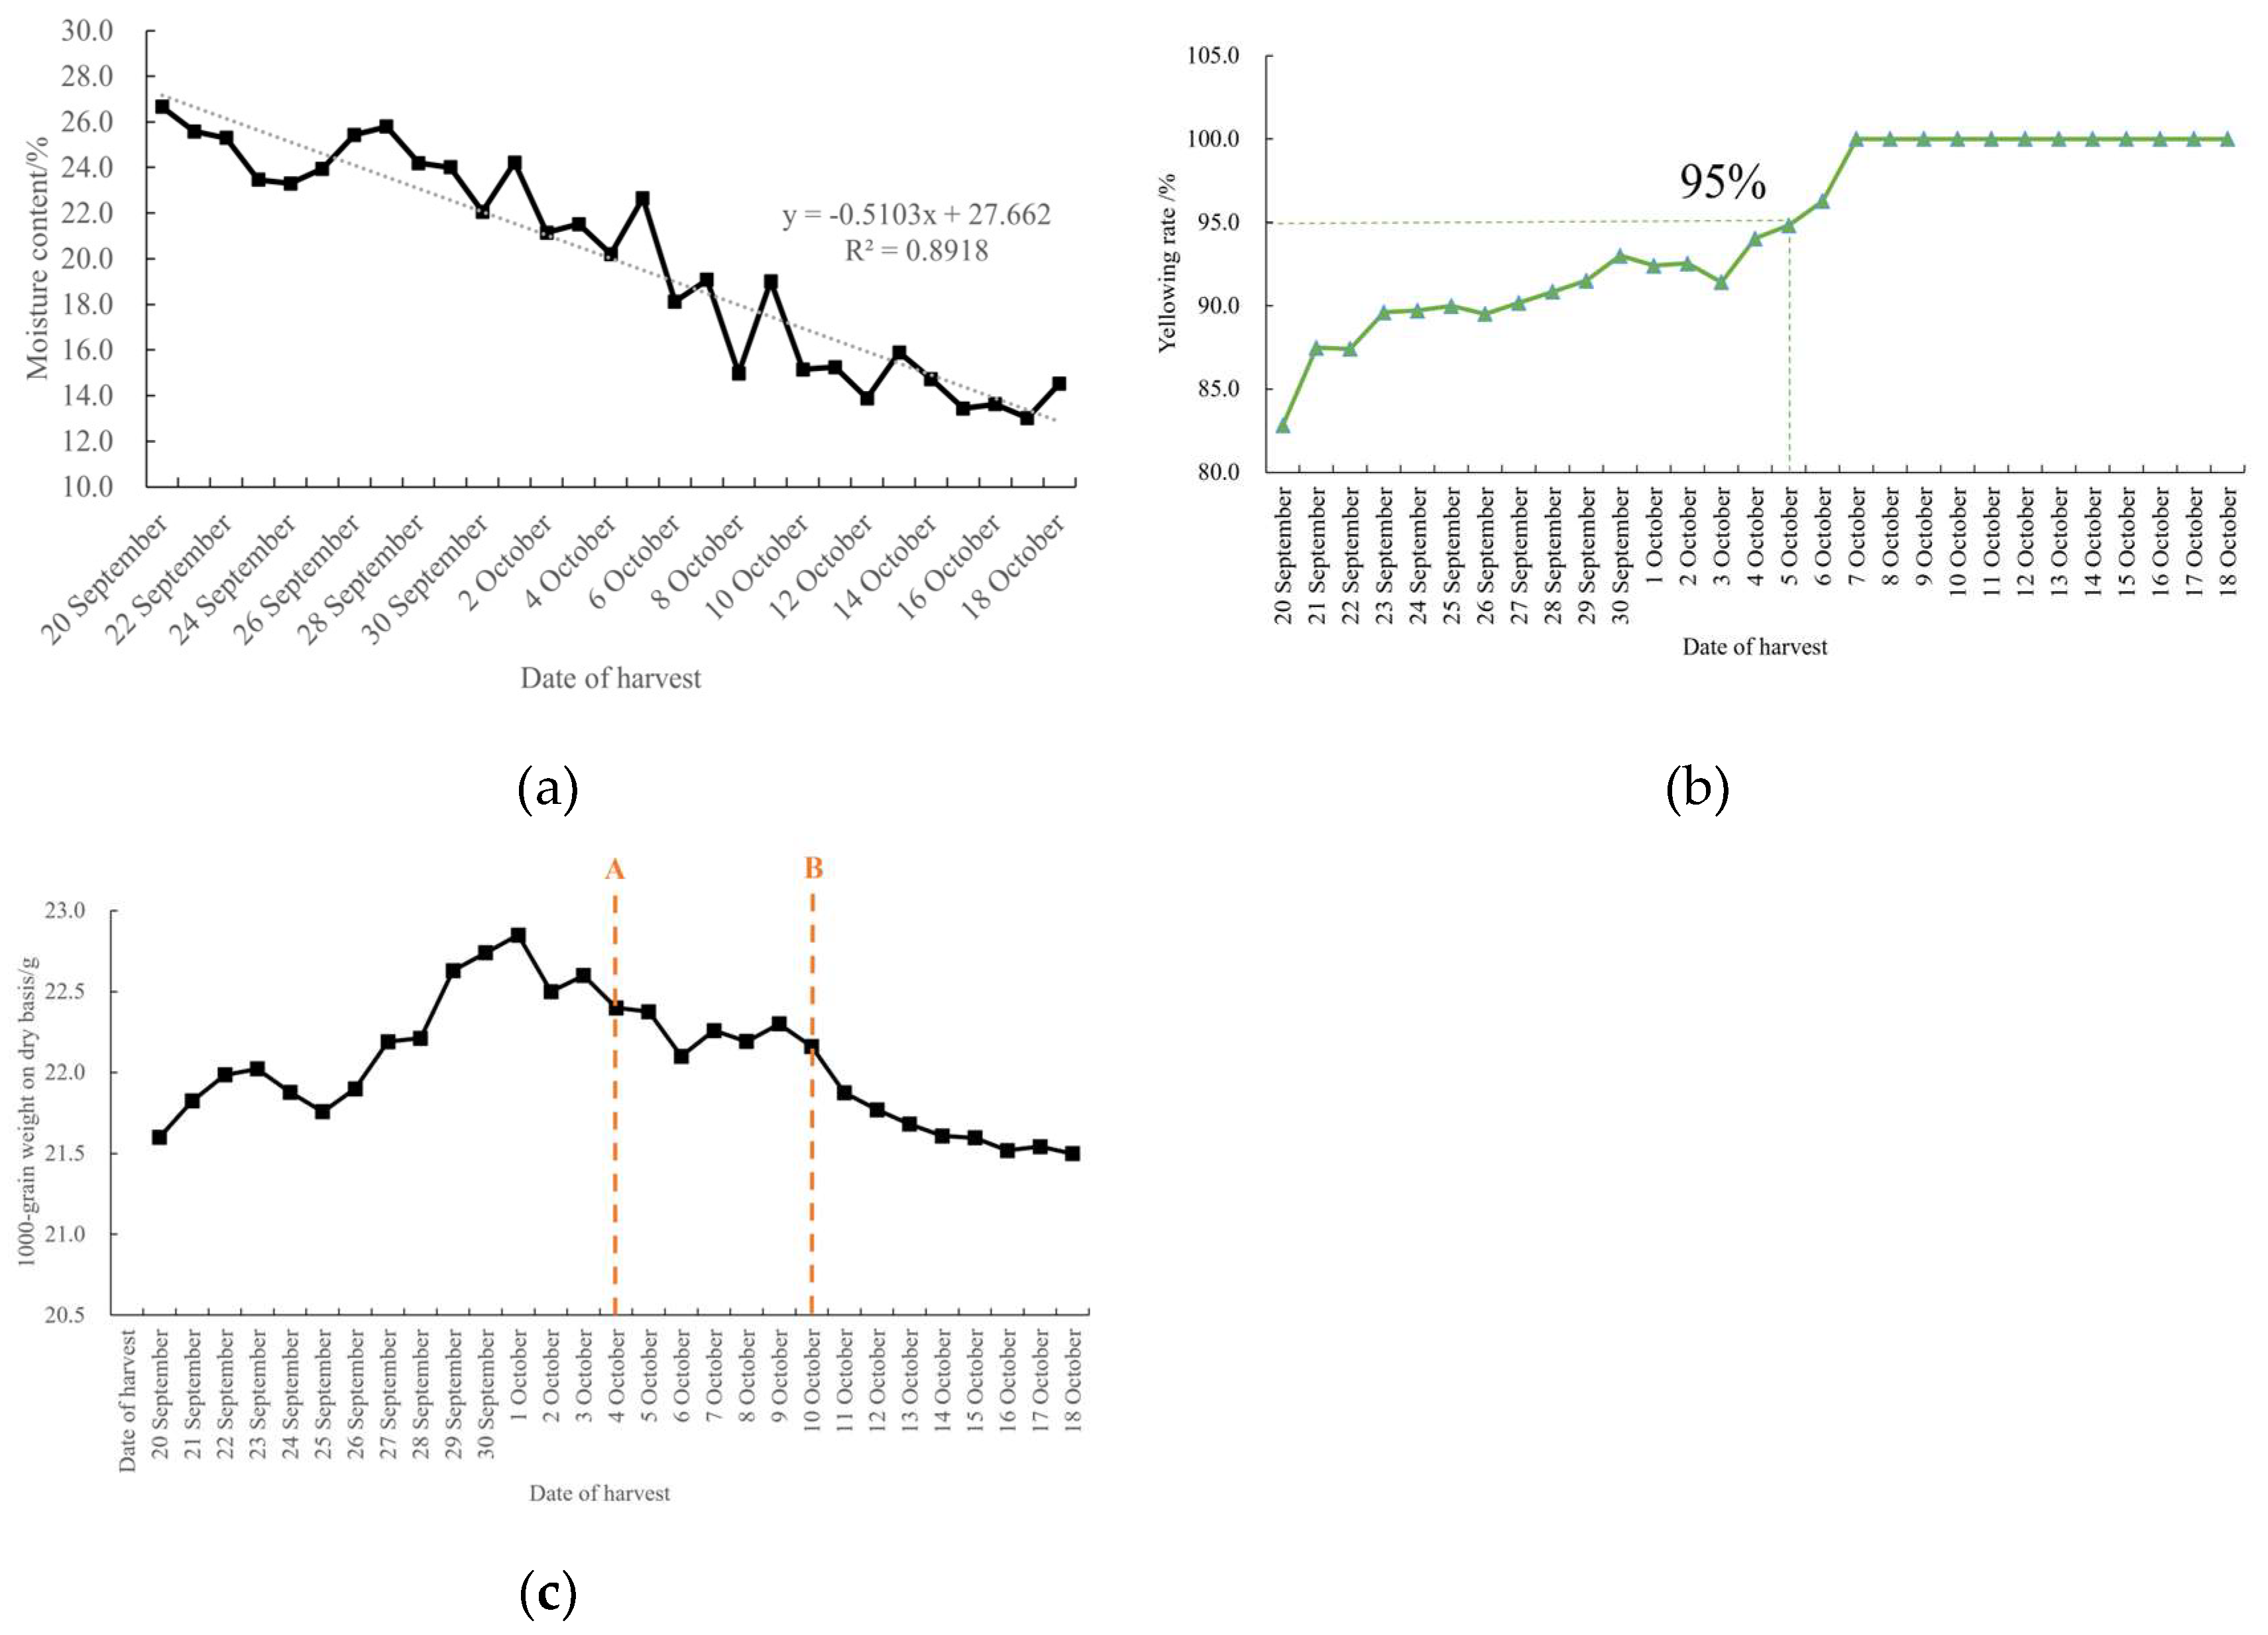
3.1.1. Changes in Moisture Content, Dry-Basis 1000-Grain Weight, and Yellowing Rate
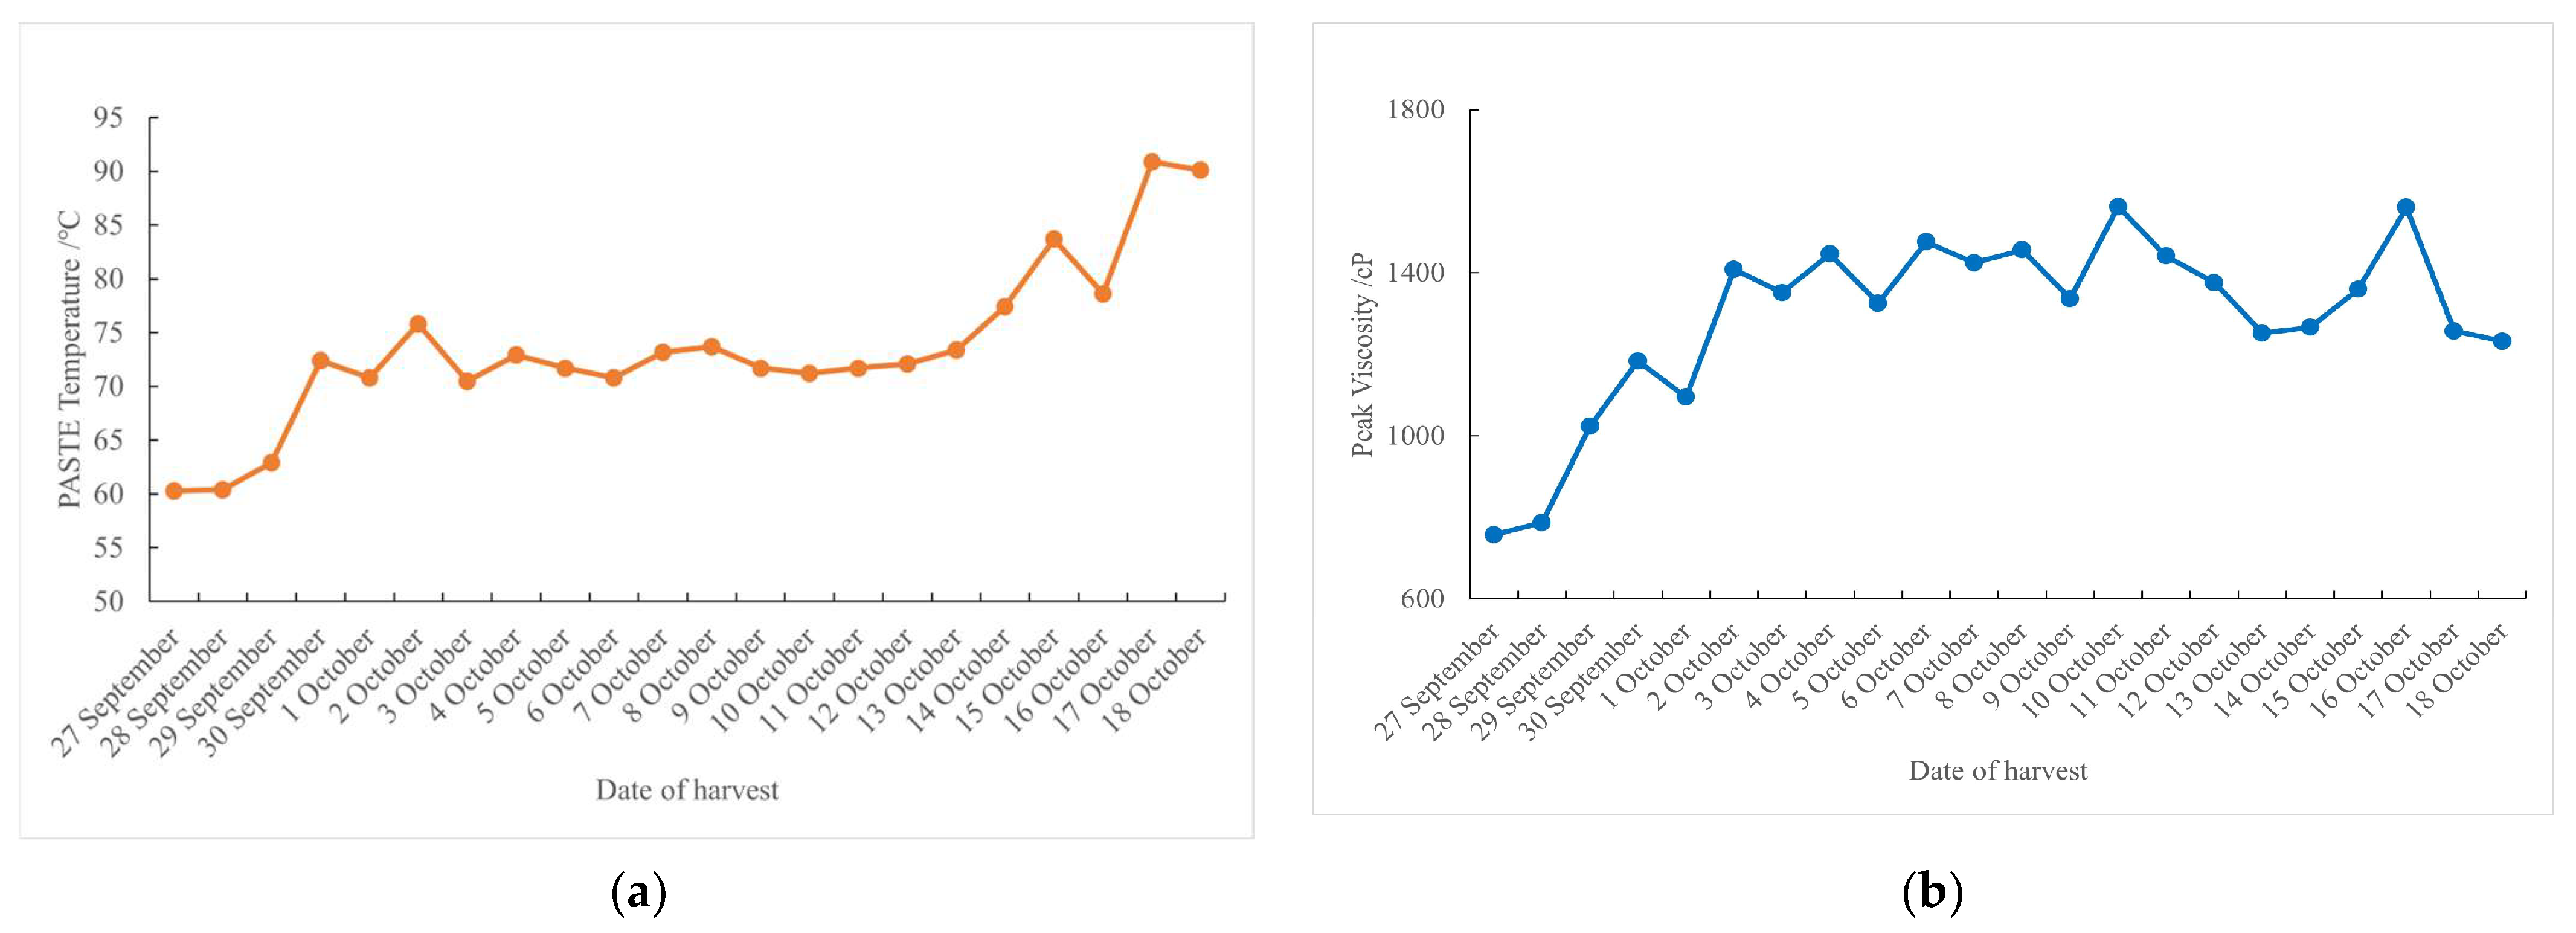
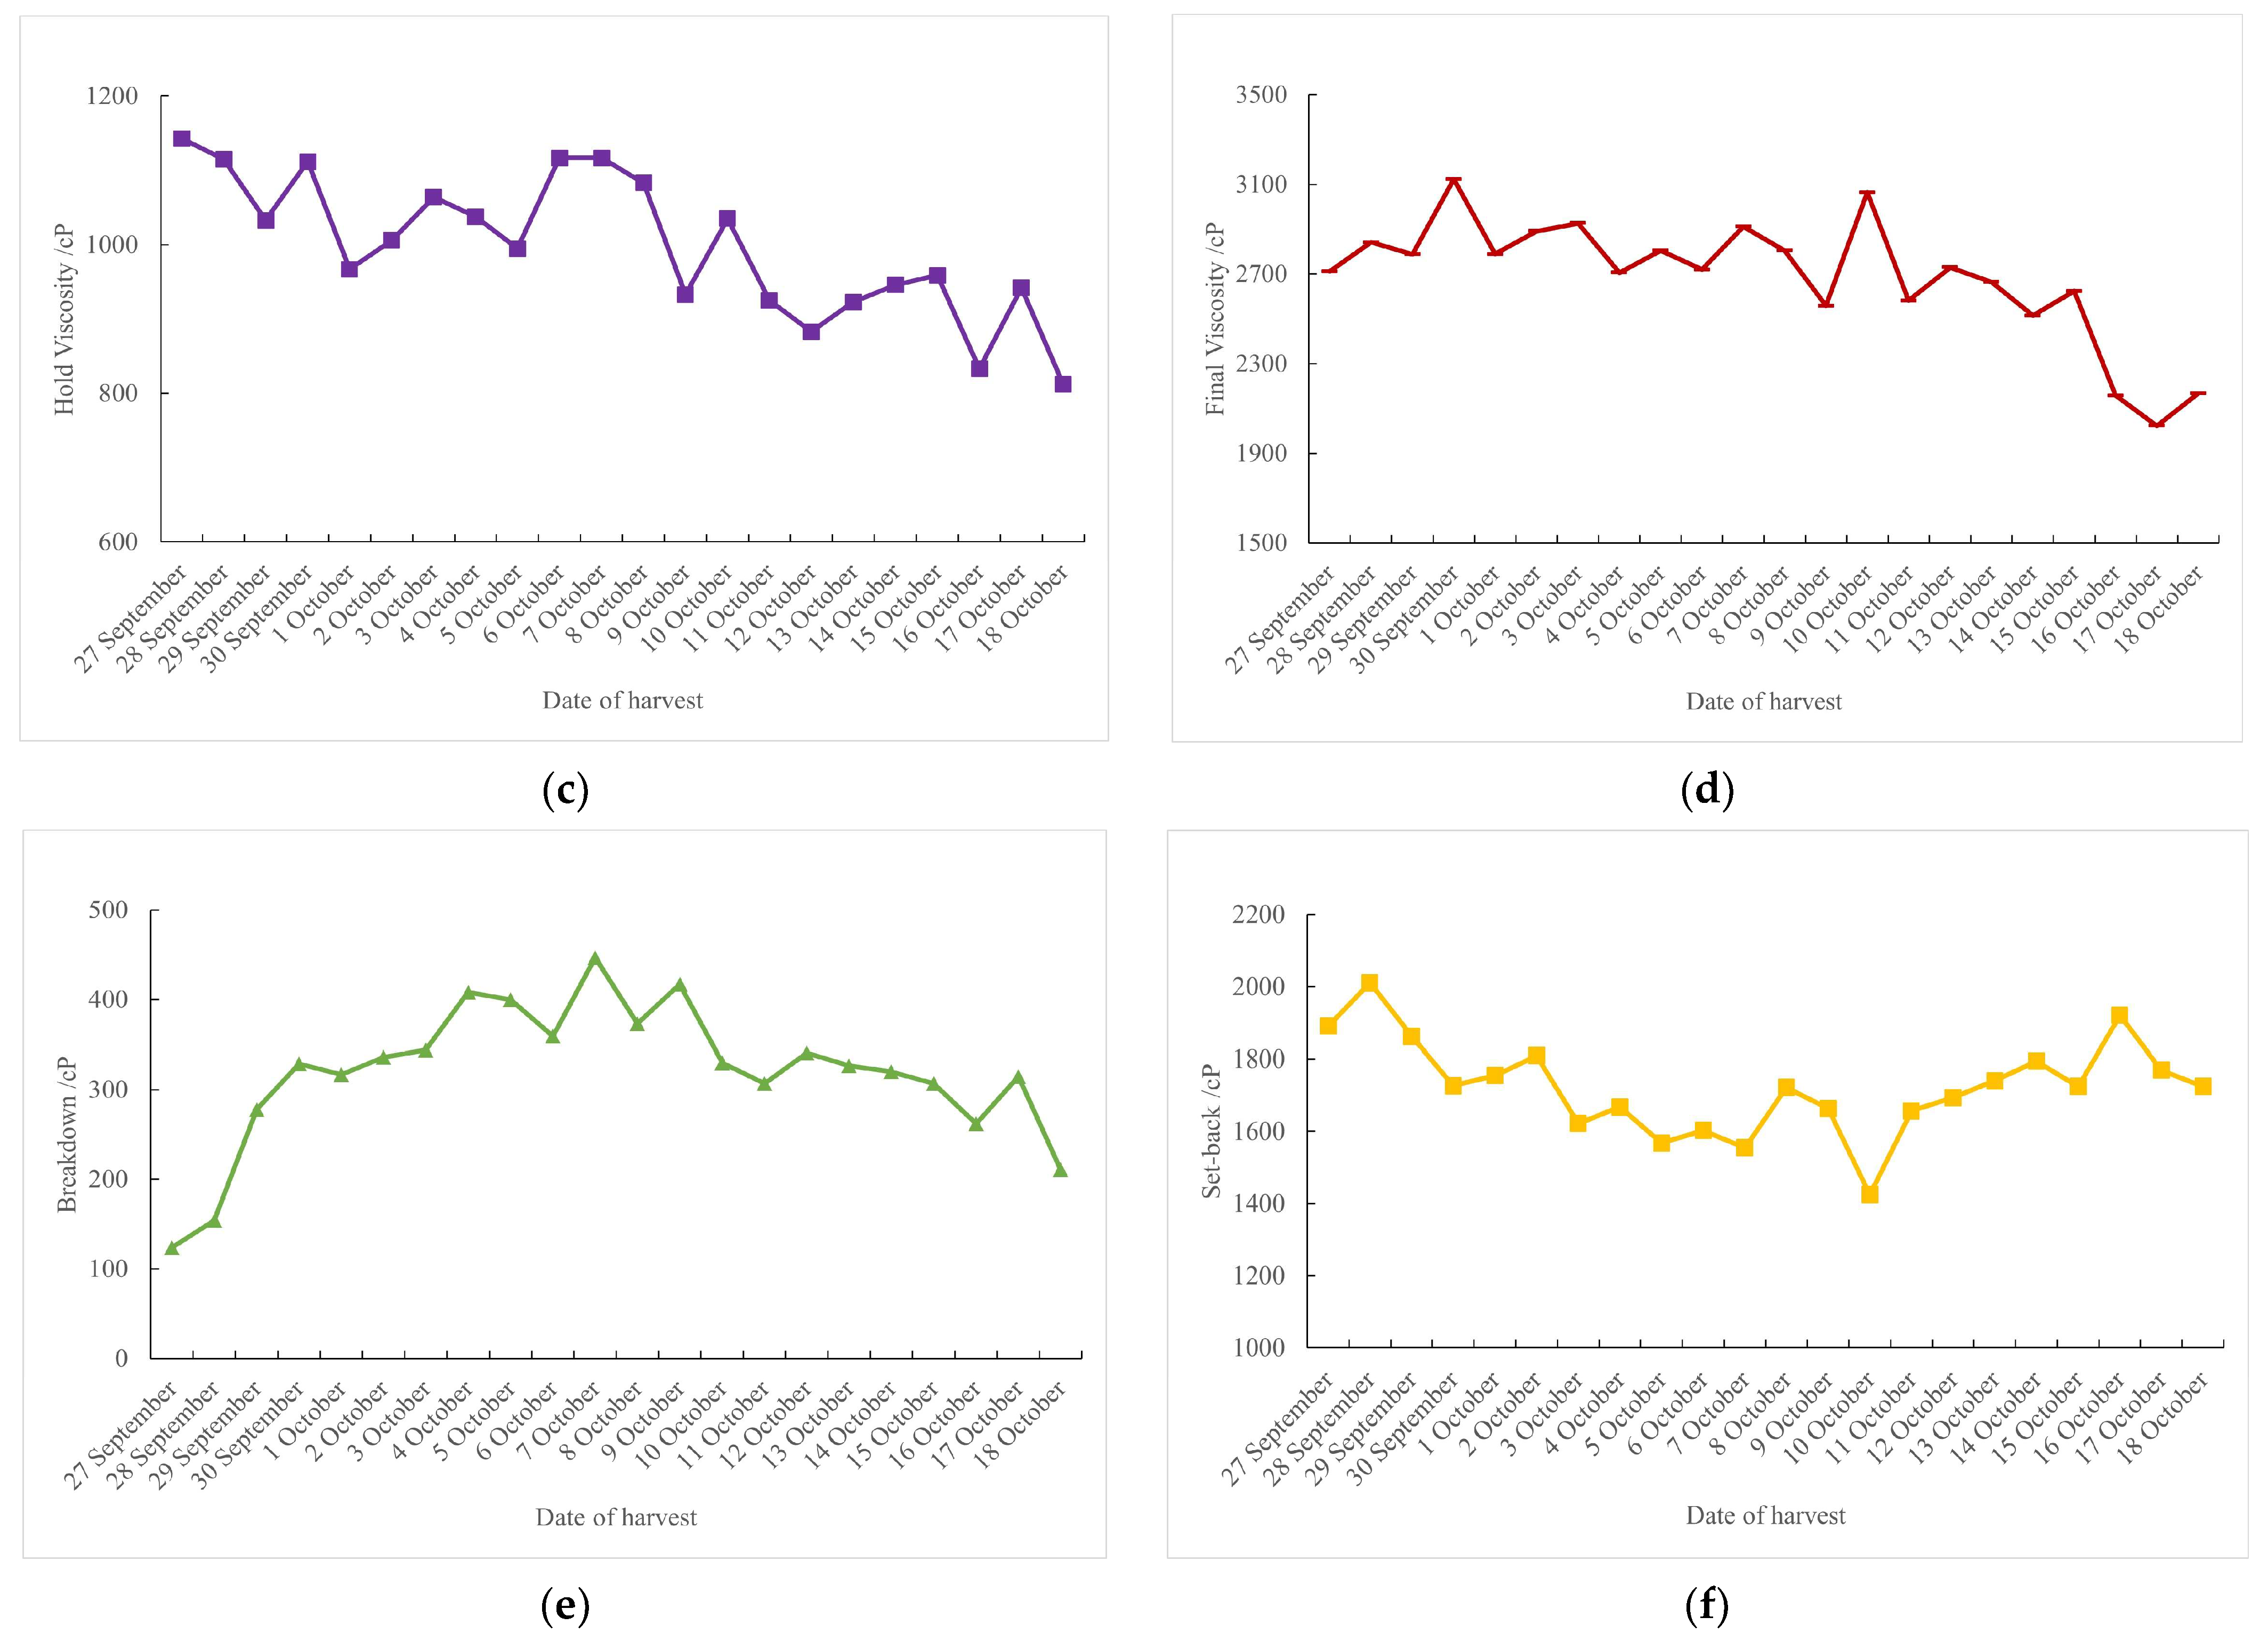
3.1.2. Variation of RVA Characteristic Spectrum (Viscosity Characteristics of Rice)
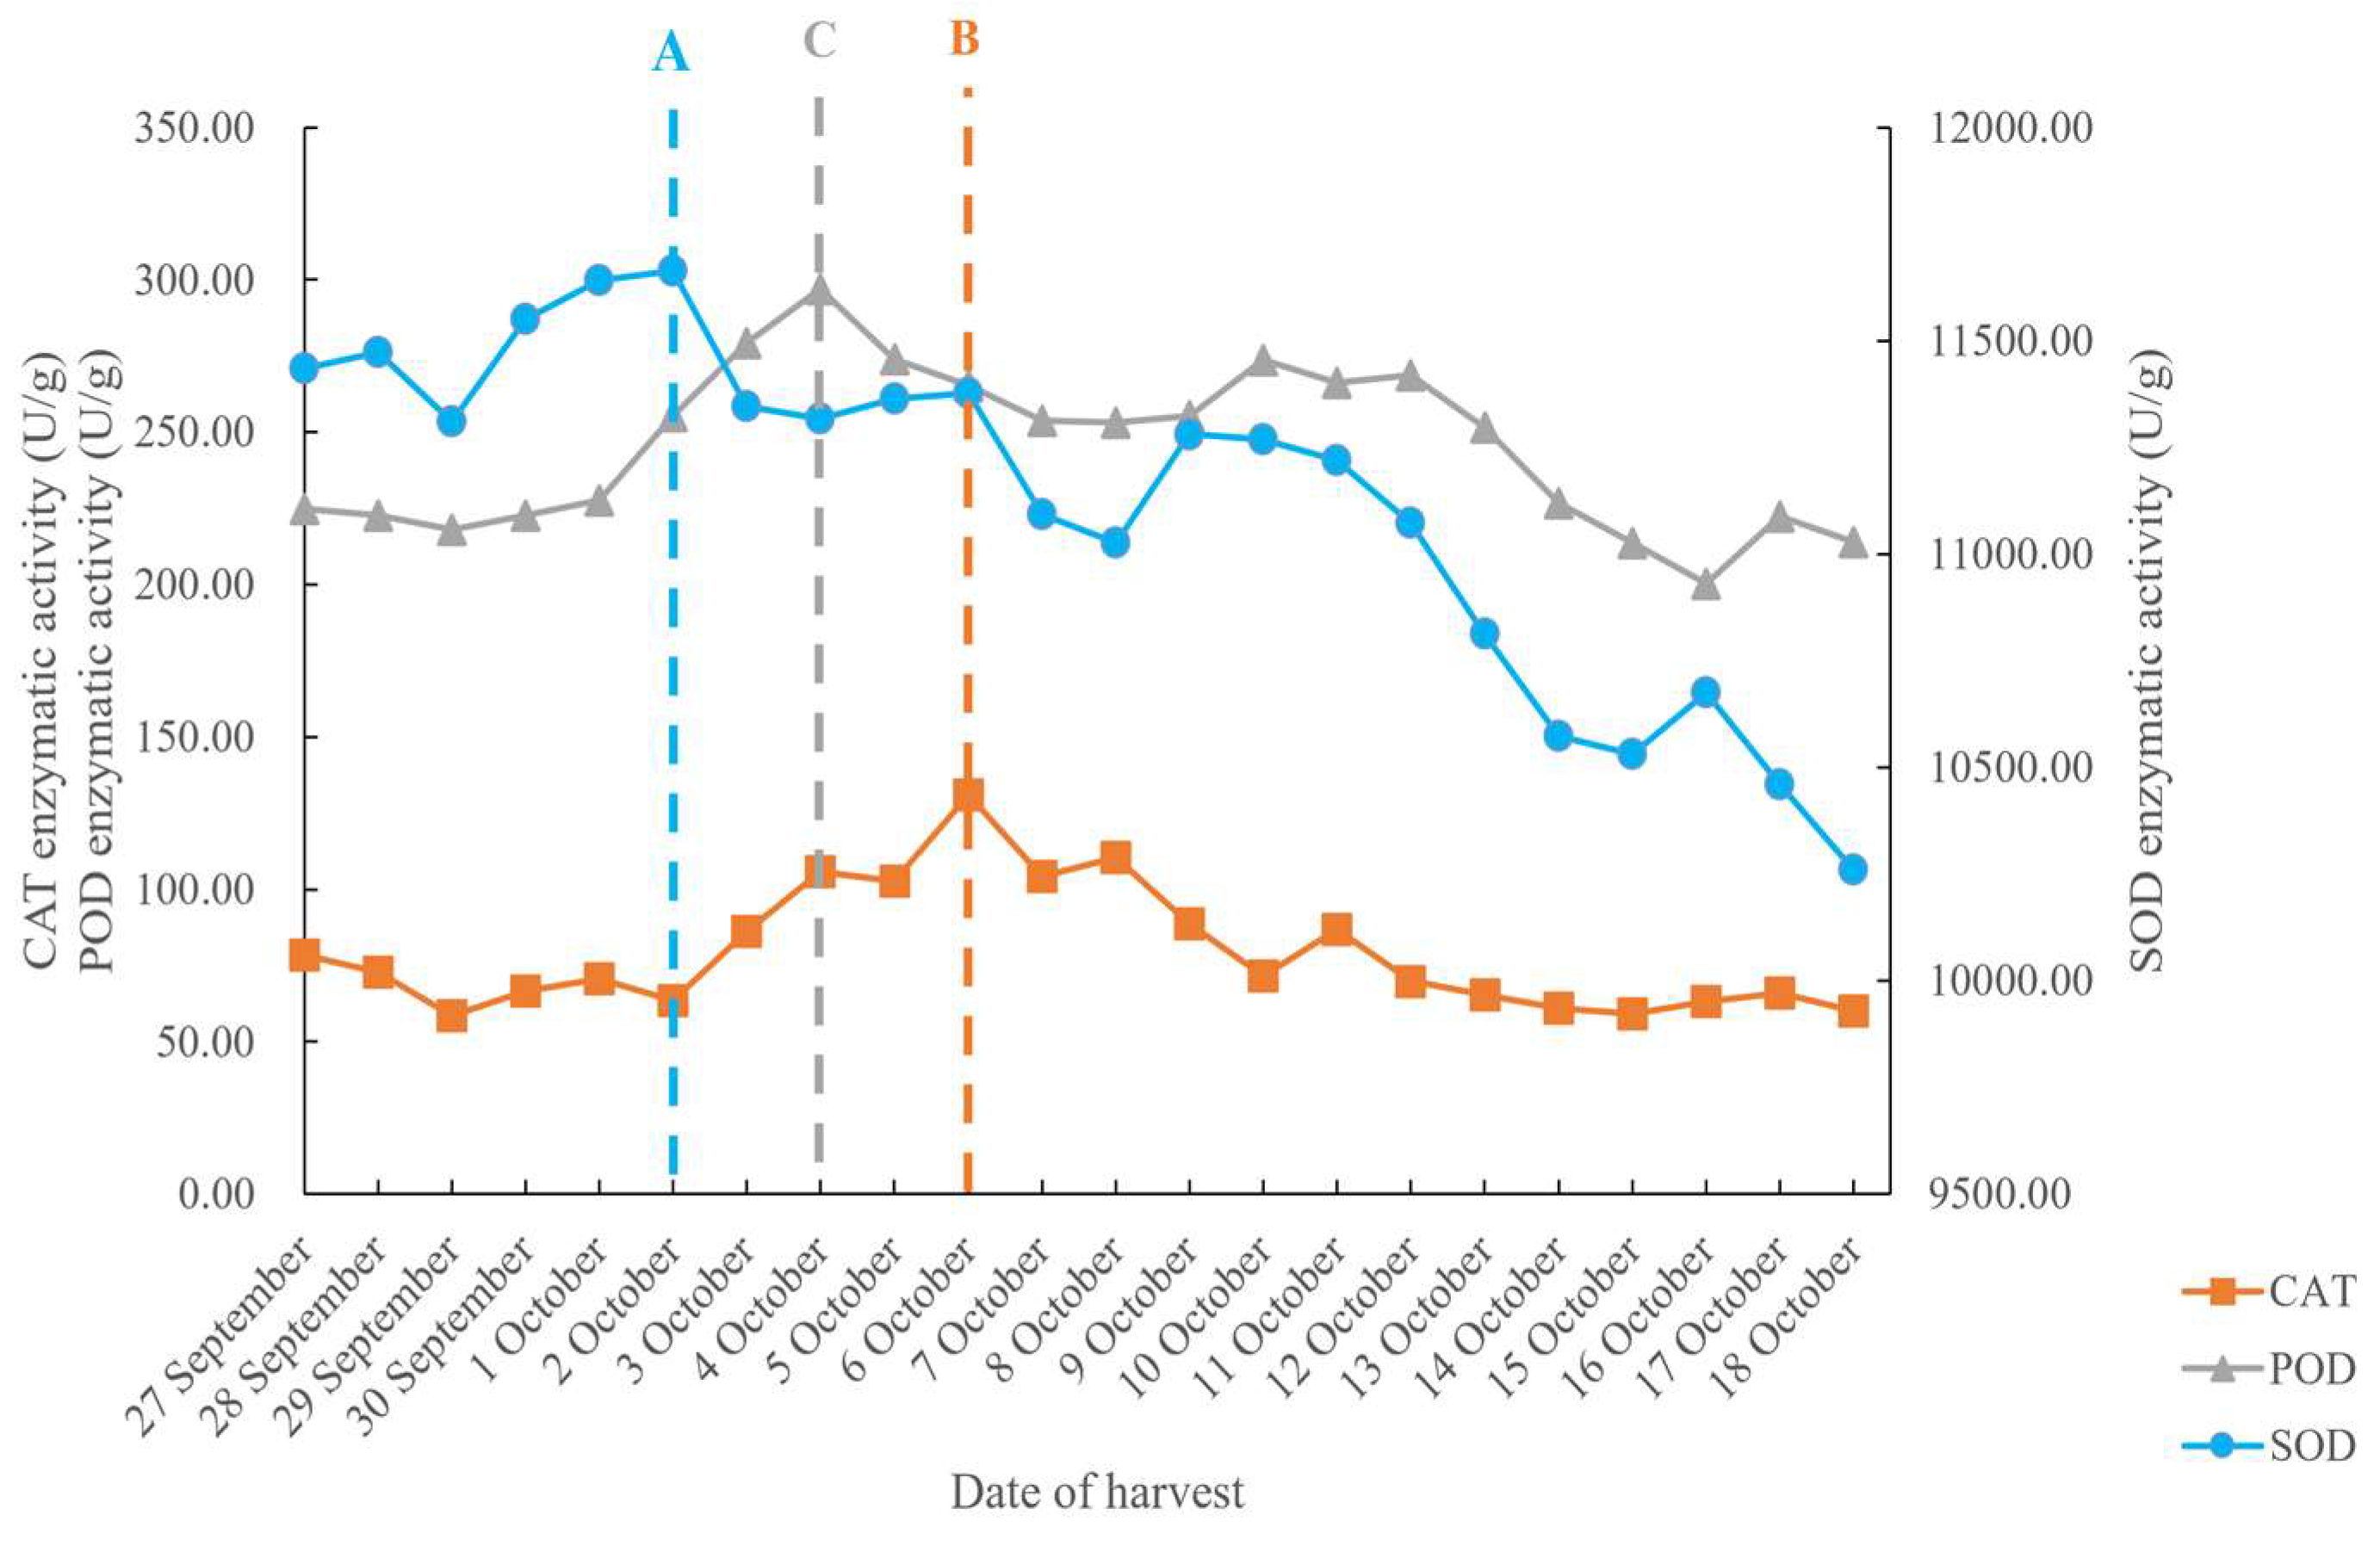
3.1.3. Changes in Antioxidant Enzyme Activity
3.1.4. Changes in Mycotoxin Content
3.2. Changes in Rice Grain Quality and Safety Index Under Mechanical Drying Conditions
- The moisture content decreased from 28.25% (w.b.) to 15.61% (w.b.) during mechanical drying. The initial weight entering the tower was 15 tons and the final weight leaving the tower was 12 tons.
- During mechanical drying, the activity of antioxidant enzymes exhibited an overall downward trend, as shown in Table 4.
- No toxin contamination was detected in the samples collected during mechanical drying.
- The changes in the RVA characteristic spectrum (viscosity characteristics of rice) during mechanical drying are shown in Table 5.
3.3. Cost Calculation
3.4. Comprehensive Score of Different Drying Methods of Rice Grains
4. Discussion
4.1. Comprehensive Comparison of Rice Grain Quality and Safety Index Under Different Drying Methods
- Drying time and energy consumption: As shown in Table 8, the mechanical drying process took approximately 36 h, during which, the water content decreased from 28.25% to 15.61%. In contrast, natural drying took about 20 days, which was significantly longer than mechanical drying. This disparity emphasizes the time difference between the two methods. Although natural drying does not require additional energy consumption, its prolonged drying period may negatively impact rice quality, particularly in high-humidity weather.
- Antioxidant enzyme activity: During the natural air-drying process, antioxidant enzyme activity initially increased and then decreased. In contrast, antioxidant enzyme activity during mechanical drying steadily decreased, suggesting that a reduction in enzyme activity in rice seeds indicates the onset of seed aging. As a result, the cells’ ability to remove peroxides diminished, ultimately leading to a decline in the activity of rice seeds.
- Toxin pollution: No toxins were detected in the samples collected during natural air-drying and mechanical drying or their content did not exceed the maximum limit.
- RVA characteristic spectrum: Table 8 also illustrates the differences in the gelatinization characteristics between the two drying methods. The pasting temperature and peak viscosity of the samples treated by natural drying were higher than those treated by mechanical drying, suggesting that natural drying may better preserve the native structure of rice starch, leading to improved gelatinization properties. As a result, natural drying may have more advantages in retaining the nutritional components and sensory characteristics of rice, which contributes to a softer and stickier texture in cooked rice. In contrast, mechanical drying may cause partial damage to the starch structure, resulting in lower pasting temperature and peak viscosity as well as potential losses in nutritional quality and sensory characteristics.
- Cost-effectiveness: Under mechanical drying, the cost per kilogram of rice was approximately CNY 0.4, while, under natural drying, it was about CNY 0.7. Compared to mechanical drying, natural drying is more costly.
4.2. Comprehensive Score Analysis of Rice Grains Under Different Drying Methods
5. Conclusions
Author Contributions
Funding
Data Availability Statement
Acknowledgments
Conflicts of Interest
References
- FAO; UNICEF; WFP; WHO. The State of Food Security and Nutrition in the World 2024—Financing to End Hunger, Food Insecurity and Malnutrition in All Its Forms; FAO: Rome, Italy, 2024. [Google Scholar]
- FAO; IFAD; UNICEF; WFP; WHO. The State of Food Security and Nutrition in the World 2023. Urbanization, Agrifood Systems Transformation and Healthy Diets Across the Rural–Urban Continuum; FAO: Rome, Italy, 2023. [Google Scholar]
- National Bureau of Statistics. Notice of the National Bureau of Statistics on the 2024 Grain Output Data. Available online: https://www.stats.gov.cn/sj/zxfb/202412/t20241213_1957744.html (accessed on 8 February 2025).
- Jing, Z. Study on Drying Properties and Kinetics of Paddy. Master’s Thesis, Hefei University of Technology, Hefei, China, 2018. [Google Scholar]
- Xiong, S.; Sun, W. A Review of the Effects of Different Drying Technologies on Rice Quality. Jiangsu Agric. Sci. 2016, 44, 18–21. [Google Scholar] [CrossRef]
- Huiming, Z. Research of Rice Drying Characteristics and Quality. Master’s Thesis, Northeast Agricultural University, Harbin, China, 2012. [Google Scholar]
- Hui, L. Drying and Storage: Key to Food Security. Economic Daily, 28 October 2021. [Google Scholar]
- Qu, Y.; Jun, Y.; Ruimin, L.; Zhongjie, Z. Development Status and Trend of Grain Drying Technology in China. Food Process. 2022, 47, 77–79. [Google Scholar]
- Muthayya, S.; Sugimoto, J.D.; Montgomery, S.; Maberly, G.F. An overview of global rice production, supply, trade, and consumption. Ann. New York Acad. Sci. 2014, 1324, 7–14. [Google Scholar] [CrossRef]
- Kabiru Ayobami, J.; Hashim, N.; Shamsudin, R.; Che Man, H.; Jahari, M.; Onwude, D. Recent Advances in the Drying Process of Grains. Food Eng. Rev. 2023, 15, 548–576. [Google Scholar] [CrossRef]
- Yihe, L. Research Progress of Rice Drying Technology. China Food Saf. Mag. 2023, 27, 159–161. [Google Scholar] [CrossRef]
- GB 5009.3-2016; National Food Safety Standard—Determination of Moisture in Foods. National Health Commission of the People’s Republic of China: Beijing, China, 2016.
- GB/T 20264-2006; Grain and Oilseed-Determination of Moisture Content-Twice Drying Method. Standardization Administration of China: Beijing, China, 2006.
- GB/T 6682-2008; National Medicine Group Chemical Reagent Co., l. Water for Analytical laboratory use—Specification and Test Methods. General Administration of Quality Supervision, Inspection and Quarantine of the People’s Republic of China: Beijing, China, 2008.
- Guodong, L. Research on the Selection of Joint Distribution Modes Based on Analytic Hierarchy Process Method. Logist. Sci.-Tech. 2020, 43, 45–49. [Google Scholar] [CrossRef]
- Yun, G. Effect of Hydroxysiderite on the Growth and Antioxidant Enzyme Activities of Maize and Rice. Master’s Thesis, Nanjing Agricultural University, Nanjing, China, 2018. [Google Scholar]
- Bao, J.-s. Accurate Measurement of Pasting Temperature by the Rapid Visco-Analyser: A Case Study Using Rice Flour. Rice Sci. 2008, 15, 69–72. [Google Scholar] [CrossRef]
- Balet, S.; Guelpa, A.; Fox, G.; Manley, M. Rapid Visco Analyser (RVA) as a Tool for Measuring Starch-Related Physiochemical Properties in Cereals: A Review. Food Anal. Methods 2019, 12, 2344–2360. [Google Scholar] [CrossRef]
- NY/T 1753-2009; Determination of Pasting Properties of Rice Flour: Rapid Visco Analyzer Method. Ministry of Agriculture, Planting Industry Management Department: Quezon City, Philippines, 2009.
- GB/T 24852-2010; Determination of Pasting Properties of Rice and Rice Flour: Rapid Visco Analyzer Method. National Standardization Technical Committee Agri: Beijing, China, 2010.
- Kim, D.J.; Oh, S.K.; Lee, J.H.; Yoon, M.R.; Choi, I.S.; Lee, D.H.; Kim, Y.G. Changes in Quality Properties of Brown Rice after Germination. Korean J. Food Sci. Technol. 2012, 44, 300–305. [Google Scholar] [CrossRef]
- Shafie, B.; Cheng, S.C.; Lee, H.H.; Yiu, P.H. Characterization and classification of whole-grain rice based on rapid visco analyzer (RVA) pasting profile. Int. Food Res. J. 2016, 23, 2138–2143. [Google Scholar]
- Wang, J.; Liu, H.-x.; Xu, T. The role of superoxide dismutase (SOD) in stress physiology and senescence physiology of plant. Plant Physiol. Commun. 1989, 1989, 1–7. [Google Scholar] [CrossRef]
- Saxena, P.; Selvaraj, K.; Khare, S.K.; Chaudhary, N. Superoxide dismutase as multipotent therapeutic antioxidant enzyme: Role in human diseases. Biotechnol. Lett. 2022, 44, 1–22. [Google Scholar] [CrossRef]
- Chaoqun, Z.; Wenxia, L.; Jingyi, H.; Dannan, F.; Limei, C.; Huini, X.; Kunzhi, L. Measuring the expression and activity of the CAT enzyme to determine Al resistance in soybean. Plant Physiol. Biochem. 2019, 144, 254–263. [Google Scholar] [CrossRef]
- Anjum, A.A.; Farooq, M.; Xiaoyu, X.; Xiaojian, L.; Ijaz, M.F. Antioxidant defense system and proline accumulation enables hot pepper to perform better under drought. Sci. Hortic. 2012, 140, 66–73. [Google Scholar] [CrossRef]
- Lu, Y.Z.; Wang, F.Y.; Luo, H.; He, W.W.; Li, D.J.; Bao, Y.H.; Zhang, Z.Y.; Zhou, C.S. Changes in phytochemical profiles, relevant enzyme activity and antioxidant capacity of different germinated maize varieties. Food Biosci. 2023, 56, 103410. [Google Scholar] [CrossRef]
- Habibi, F.; Madison, M.; Boakye, D.A.; Chang, Y.; Clavijo-Herrera, J.; Casorzo, G.; Sarkhosh, A.; Liu, T. Molecular mechanisms underlying postharvest physiology and metabolism of fruit and vegetables through multi-omics technologies. Sci. Hortic. 2024, 324, 112562. [Google Scholar] [CrossRef]
- Hui, L. Leveraging Technology for Safe Grain Storage. GuangMing Daily, 7 December 2014. [Google Scholar]
- Zatecka, E.; Ded, L.; Elzeinova, F.; Kubatova, A.; Dorosh, A.; Margaryan, H.; Dostalova, P.; Korenkova, V.; Hoskova, K.; Peknicova, J. Effect of zearalenone on reproductive parameters and expression of selected testicular genes in mice. Reprod. Toxicol. 2014, 45, 20–30. [Google Scholar] [CrossRef] [PubMed]
- Xin, S.; Rui, H.; Ge, C.; Ying, X.; Yuliang, H.; Yi, C. Detection Methods and Contamination Control of Deoxynivalenol in Wheat. Grain Oil Storage Technol. Commun. 2024, 40, 45–50. [Google Scholar]
- Kuntu Blankson, G.; Mill-Robertson, F.C. Aflatoxin contamination and exposure in processed cereal-based complementary foods for infants and young children in greater Accra, Ghana. Food Control 2015, 64, 212–217. [Google Scholar] [CrossRef]
- GB 2761-2017; National Food Safety Standard: Maximum Limits for Mycotoxins in Food. China Food and Drug Administration: Beijing, China, 2017.

| Relative Importance | Scale Value |
|---|---|
| Extremely important | 9 |
| Very important | 7 |
| Obviously important | 5 |
| Slightly important | 3 |
| Equal importance | 1 |
| Mean value | 2,4,6,8 |
| Exact inverse value | Reciprocal |
| (a) | |||
| Item | Quality Index | Safety Index | Drying Cost |
| Quality index | 1 | 3 | 5 |
| Safety index | 1/3 | 1 | 3 |
| Drying cost | 1/5 | 1/3 | 1 |
| (b) | |||
| Item | Moisture Content | Dry-basis 1000-Grain Weight | Antioxidant Enzyme Activity |
| Moisture content | 1 | 1/3 | 1/2 |
| Dry-basis 1000-grain weight | 3 | 1 | 2 |
| Antioxidant enzyme activity | 2 | 1/2 | 1 |
| Item | Proper Vector | Weight Value | Maximum Eigenvalue | CI Value |
|---|---|---|---|---|
| Quality index | 1.900 | 63.335% | 3.039 | 0.019 |
| Safety index | 0.781 | 26.050% | ||
| Drying cost | 0.318 | 10.616% | ||
| Consistency check | CR = 0.04 and the consistency test passed. | |||
| Moisture content | 0.550 | 16.342% | 3.009 | 0.005 |
| Dry-basis 1000-grain weight | 1.817 | 53.961% | ||
| Antioxidant enzyme activity | 1.000 | 29.696% | ||
| Consistency check | CR = 0.06 and the consistency test passed. | |||
| SOD | CAT | POD | |
|---|---|---|---|
| Before (U/g) | 10902.16 | 79.12 | 390.37 |
| After (U/g) | 10714.62 | 48.53 | 335.11 |
| Paste Temperature/°C | Peak Viscosity/cP | Minimum Viscosity/cP | Final Viscosity/cP | Collapse Value/cP | Subtraction Value/cP | |
|---|---|---|---|---|---|---|
| Before | 75.3 | 1238 | 943 | 2662 | 311 | 1719 |
| After | 90 | 1174 | 863 | 2523 | 295 | 1660 |
| Natural Drying | Mechanical Drying | ||
|---|---|---|---|
| Harvesting | Manually harvest CNY 360 per mu. | Harvester bales CNY 200 per mu. | Combine harvester CNY 150 per mu. (including harvesting, threshing, etc.) |
| Stacking CNY 40 per mu. | |||
| Threshing CNY 240 per mu. | |||
| Drying | No fees | Drying per ton CNY 160 (calculated by wet grain) | |
| Total | CNY 0.9/kg | 0.7 CNY/kg | 0.4 CNY/kg |
| Drying Methods | Comprehensive Score |
|---|---|
| Natural drying | 0.75 |
| Mechanical drying | 0.40 |
| Item | Natural Drying | Mechanical Drying | |
|---|---|---|---|
| Moisture content | Drop from 26.7% to 16.5% | Drop from 28.25% to 15.61% | |
| Drying time | About 20 days | About 36 h | |
| Antioxidant enzyme activity | The overall trend is to rise first and then decline | The overall trend is downward | |
| SOD enzyme activity (U/g) | 11,435.35-11,664.96-10,260.22 | 10,902.16-10,714.62 | |
| POD enzyme activity (U/g) | 224.94-296.99-214.04 | 390.37-335.11 | |
| CAT enzyme activity (U/g) | 78.47-130.89-60.10 | 79.12-48.53 | |
| Toxin contamination situation | Except for the samples collected on September 30th, no toxins were detected | No toxins were detected | |
| RVA characteristic profile | Paste temperature (°C) | 60.3-70-90.1 | 75.3-90 |
| Peak viscosity (cP) | 757-1400-1232 | 1238-1174 | |
| Minimum viscosity (cP) | 1143-812 | 943-863 | |
| Final viscosity (cP) | 3123-2023 | 2662-2523 | |
| Breakdown value (cP) | 124-447-211 | 311-295 | |
| Setback value (cP) | 2011-1425-1725 | 1719-1660 | |
| Cost (CNY/kg) | 0.7-0.9 | 0.4 | |
Disclaimer/Publisher’s Note: The statements, opinions and data contained in all publications are solely those of the individual author(s) and contributor(s) and not of MDPI and/or the editor(s). MDPI and/or the editor(s) disclaim responsibility for any injury to people or property resulting from any ideas, methods, instructions or products referred to in the content. |
© 2025 by the authors. Licensee MDPI, Basel, Switzerland. This article is an open access article distributed under the terms and conditions of the Creative Commons Attribution (CC BY) license (https://creativecommons.org/licenses/by/4.0/).
Share and Cite
Wang, Y.; Wu, W.; Xu, J.; Gao, M.; Wu, Z.; Wang, R.; Liu, H. Changes in Quality and Safety Indexes During Rice Harvest and Discussion on Drying Technology. Foods 2025, 14, 1225. https://doi.org/10.3390/foods14071225
Wang Y, Wu W, Xu J, Gao M, Wu Z, Wang R, Liu H. Changes in Quality and Safety Indexes During Rice Harvest and Discussion on Drying Technology. Foods. 2025; 14(7):1225. https://doi.org/10.3390/foods14071225
Chicago/Turabian StyleWang, Yujia, Wenfu Wu, Jie Xu, Ming Gao, Zidan Wu, Rui Wang, and Houqing Liu. 2025. "Changes in Quality and Safety Indexes During Rice Harvest and Discussion on Drying Technology" Foods 14, no. 7: 1225. https://doi.org/10.3390/foods14071225
APA StyleWang, Y., Wu, W., Xu, J., Gao, M., Wu, Z., Wang, R., & Liu, H. (2025). Changes in Quality and Safety Indexes During Rice Harvest and Discussion on Drying Technology. Foods, 14(7), 1225. https://doi.org/10.3390/foods14071225