Article

Characterization and Discrimination of Volatile Compounds of Donkey and Horse Meat Based on Gas Chromatography–Ion Mobility Spectrometry

School of Agriculture and Biology, School of Materials Science and Engineering, Liaocheng Research Institute of Donkey High-Efficiency Breeding and Ecological Feeding, Liaocheng University, Liaocheng 252000, China
*
Authors to whom correspondence should be addressed.
Foods 2025, 14(7), 1203; https://doi.org/10.3390/foods14071203
Submission received: 22 February 2025 / Revised: 20 March 2025 / Accepted: 24 March 2025 / Published: 29 March 2025
(This article belongs to the Section Meat)

Abstract

:
The production of high-quality specialty meats has emerged as a prominent research focus within the livestock industry, under the broader concept of big food. However, the composition and variances of volatile compounds (VOCs) in donkey meat (DM) and horse meat (HM) remain unclear, which complicates their effective identification. In the present study, the VOCs of DM and HM were analyzed using gas chromatography–ion mobility spectrometry (GC-IMS) in combination with a multivariate analysis. Our results indicate that a total of 39 VOCs were identified in both DM and HM. These VOCs were categorized into five groups: aldehydes (39.53%), ketones (28.89%), alcohols (28.89%), acids (6.98%), and furans (2.33%). Compared with HM, the concentration of aldehydes, ketones, and alcohols in DM is significantly higher. (p < 0.001). Additionally, 16 characteristic-flavor VOCs were identified in both types of meat, with notable compounds including oct-1-en-3-ol, 3-hexanone, and heptanol. Topography, fingerprinting, and multivariate analysis effectively differentiated the VOC profiles of DM and HM. Furthermore, the 28 differential VOCs identified in DM and HM were all significantly higher in DM than in HM. In summary, this study conducted a comprehensive analysis of the VOC composition and characteristic flavor compounds in DM and HM, highlighting key differential VOCs. These findings contribute valuable data for flavor regulation and offer technical support for detecting the adulteration of DM with HM. The difference in sensory quality between DM and HM needs further research.

1. Introduction

Meat has become a fundamental component of the human diet, being a rich source of high-quality protein, essential fatty acids, vitamins, and trace nutrients such as zinc, selenium, iron, and phosphorus [1]. With rising living standards, the demand for high-quality specialty meats has gained significant importance [2].
The adage “Dragon meat in the sky, donkey meat on the ground” reflects not only the palatability of donkey meat (DM), but also its unique nutritional profile [3]. DM is considered a luxury food due to its superior nutritional composition, including higher levels of protein, essential amino acids, and fatty acids, along with lower fat content, cholesterol, and caloric value [4]. However, DM remains relatively scarce and expensive in the marketplace, primarily due to factors such as the long growth cycle of donkeys, low population numbers, limited reproductive rates, and the availability of few high-quality breeds [5]. In contrast, horse populations are more abundant, with a wider variety of breeds and higher meat yield; however, HM is often characterized by coarser muscle fibers and a more pronounced, sour taste [6]. In recent years, incidents of DM adulteration have occurred periodically, typically involving the sale of HM as DM or the mixing of DM with HM for sale [7]. Consequently, there is an urgent need for reliable methods and techniques to differentiate DM from HM, which will be crucial for safeguarding the integrity of the donkey meat industry and supporting its sustainable development.
Freshness and sweetness are the characteristic flavors of DM [8], whereas HM exhibits a milder flavor with a slightly sour aftertaste [6]. These flavor differences can be attributed to variations in volatile organic compounds (VOCs) between DM and HM. Aldehydes, hydrocarbons, ketones, and alcohols are the primary VOCs present in both in DM and HM [9,10]. These compounds are produced using series of chemical reactions including Maillard reactions, lipid degradation, the thermal degradation of thiamine, and Maillard–lipid interactions [11]. Notably, approximately 90% of VOCs are produced through lipid degradation, with the remaining 10% originating from other reactions [10]. Lipids, which are a key component of meat nutrition [12], can be influenced by factors such as genetic selection, age at slaughter, geographical location, diet, and exercise [13]. Previous research has highlighted significant differences in lipid content and fatty acid composition between DM and HM [14]. Therefore, investigating the VOC profiles of DM and HM represents a promising approach to distinguish between these two types of meat.
The volatile flavor compounds produced in food are complex in composition, with relatively small molecular weights, low content, and instability. When extracting and analyzing the desired flavor compounds, appropriate methods should be selected. Gas chromatography–mass spectrometry (GC-MS) is particularly useful in food flavor analysis, but the complex preprocessing limits its application in rapid detection [15]. Gas chromatography–ion mobility spectrometry (GC-IMS) technology has become an emerging method for rapid detection of sample quality due to its speed, portability, and ease of operation [16,17]. GC-IMS has been successfully applied for food classification, freshness evaluation, spoilage detection, and the analysis of aroma changes during storage [13,18,19]. For example, significant differentiation of flavor volatiles from different parts of chicken slaughter and cutting processes was successfully achieved using GC-IMS and stoichiometry [20]. In this study, GC-IMS, combined with a multivariate analysis, was employed to investigate the composition and characteristic flavor compounds of VOCs in DM and HM, as well as to identify differences in their VOC profiles. The aim was to provide fundamental data for the flavor regulation of DM and HM and to offer technical support for detecting HM adulteration in DM.

2. Material and Methods

2.1. Ethical Statement, Sample Collection, and Processing

The experimental procedures were approved by the Animal Care and Use Committee of Liaocheng University (approval number: 2023022706). The experimental animals, consisting of 6 donkeys and 6 horses, were sourced from a local breeding farm in Liaocheng, Shandong. All animals were in good health and were managed and raised under identical conditions. They were of similar weight, about 2 years old, and were subjected to the same environmental conditions throughout the study. Following a 12 h fasting period in accordance with international guidelines (CAC/RCP41-1993 and ISO/TS34700:2016), the animals were transported to local slaughterhouses where they were humanely slaughtered. The longissimus dorsi muscles were subsequently collected, packaged, and rapidly frozen by immersion in liquid nitrogen. After transportation back to the laboratory, the samples were stored at −80 °C for subsequent GC-IMS testing.

2.2. GC-IMS Analysis of VOCs in DM and HM

A FlavourSpec (Flavourspec®-G.A.S. Dortmund, Germany Company) flavor analyzer equipped with capillary columns was used for the analysis of VOCs in DM and HM. The instrument was equipped with an automated sampling device, and 2.0 g of the meat sample was weighed accurately and placed in a 20 mL headspace glass vial with 0.5 μL internal standard substance of 2-methyl-3-heptanone (0.1 g/L) (Merck Life Science and Technology, Nantong, China Co., Ltd.). The sample was then incubated at 60 °C with continuous agitation at 500 rpm for 20 min. During the analysis, the carrier gas flow rate was initially set at 2 mL/min for the first 2 min. The flow rate was gradually increased to 100 mL/min over the next 6 min (from 2 to 8 min), followed by a further increase to 150 mL/min during the subsequent 12 min (from 8 to 20 min). The total duration of the process was approximately 20 min. Nitrogen gas with a purity >99.999% (Shandong, China Wanbang Gas Co.) was used as carrier and drift gases, with a flow rate set at 150 mL/min. The drift tube had a length of 9.8 cm, and the drift voltage was applied at 5 kV. Drift temperatures were maintained at 60 °C for the gas chromatographic separation and at 45 °C for ion mobility spectrometry analysis. Separation was carried out on a gas chromatograph equipped with an MXT-5 column (15 m × 0.53 mm × 1.0 µm). Positive ion mode was selected for ionization, with the ionization source energy set at 3 eV.

2.3. Identification of VOCs

A calibration curve for the retention time (RT) and retention index (RI) was established using a mixed standard of six ketones (2-butanone, 2-pentanone, 2-hexanone, 2-heptanone, 2-octanone, and 2-nonanone). The RIs of C4-C9 n-ketones (Sigma Aldrich (Shanghai) Trading Co., Ltd., Shanghai, China) obtained under the same experimental conditions were used to compare the RIs of VOCs. The RI and Dt of the standards from the NIST (National Institute of Standards and Technology, Gaithersburg, MD, United States) and GC-IMS database (G.A.S., Dortmund, Germany) were utilized to distinguish volatiles. Based on 2-methyl-3-heptanone internal standard, a semi-quantitative analysis was performed based on peak volume.
The formula for calculating odor activity values (OAV) is as follows:
OAVi = Ci/Ti × 100
Ci and Ti represent the absolute content and corresponding sensory thresholds of each VOCs, respectively. Flavors with OAV > 1 are considered characteristic flavor compounds.

2.4. Statistic Analysis

Each sample was analyzed in six sets of parallel trials, and the data on VOCs in DM and HM were analyzed for differences using SPSS 24.0 (SPSS Inc., Chicago, IL, USA). Differences between samples were analyzed using Tukey’s test. The data were presented as mean ± standard error of mean (SEM), and p < 0.05 was considered significantly different. The Reporter plugin and the Gallery Plot plugin were utilized to construct spectral and fingerprint representations, respectively. MetaboAnalyst 5.0 online software was used for principal component analysis (PCA), partial least squares discriminant analysis (PLS-DA), orthogonal partial least squares discriminant analysis (OPLS-DA), and heat map visualization. Differential volatiles were determined using variable importance in projection (VIP) > 1 and p < 0.05.

3. Results

3.1. VOC Profiles of DM and HM

As shown in Figure 1 and Table 1, a total of 43 VOCs (17 aldehydes, 9 ketones, 9 alcohols, 3 acids, 1 furan, and 4 unidentified) were detected in DM and HM, including 39.53% aldehydes, 20.93% ketones, 20.93% alcohols, 6.98% acids, 2.33% furans, and 9.30% unidentified. Among them, 39 VOCs were identified in both DM and HM (Figure 1a–c). Aldehydes, alcohols, and ketones were the main categories of VOCs in both DM and HM (Figure 1d). Notably, the concentrations of aldehydes, alcohols, and ketones in DM were significantly higher than those in HM (p < 0.001; Figure 1e).

3.2. Characteristic Flavors

As shown in Figure 2, a total of 16 characteristic volatile flavor compounds were identified based on an OAV > 1. These compounds include 3-hexanone, oct-1-en-3-ol, heptanol, octanal, 2-pentyl furan, benzaldehyde, 2-hexanone, pent-1-en-3-ol, hexanal, (E)-hept-2-enal, heptanal, n-hexanol, pentanal, 2-butanone, nonanal, and methyl isobutyl ketone. Notably, the OAVs of oct-1-en-3-ol, octanal, and 2-pentyl furan in DM were markedly higher than those measured in HM.

3.3. Difference in VOCs

As shown in Figure 3, significant differences in fingerprint features between DM and HM can be observed (Figure 3a). Moreover, several compounds, including pentanal, (E)-hept-2-enal, heptanal, 2-pentyl furan, n-hexanol, 2-heptanone, octanal, (E)-2-octenal, benzene acetaldehyde, oct-1-en-3-ol, pentan-1-ol, (E)-2-hexenal, ethyl isobutyl ketone, heptanol, nonanal, hexanoic acid, 4-hexanone, benzaldehyde, and 2-methyl-1-propanol, exhibited distinct signals between DM and HM, suggesting that these compounds contribute to the differentiation of the VOC fingerprint profiles of DM and HM (Figure 3b)

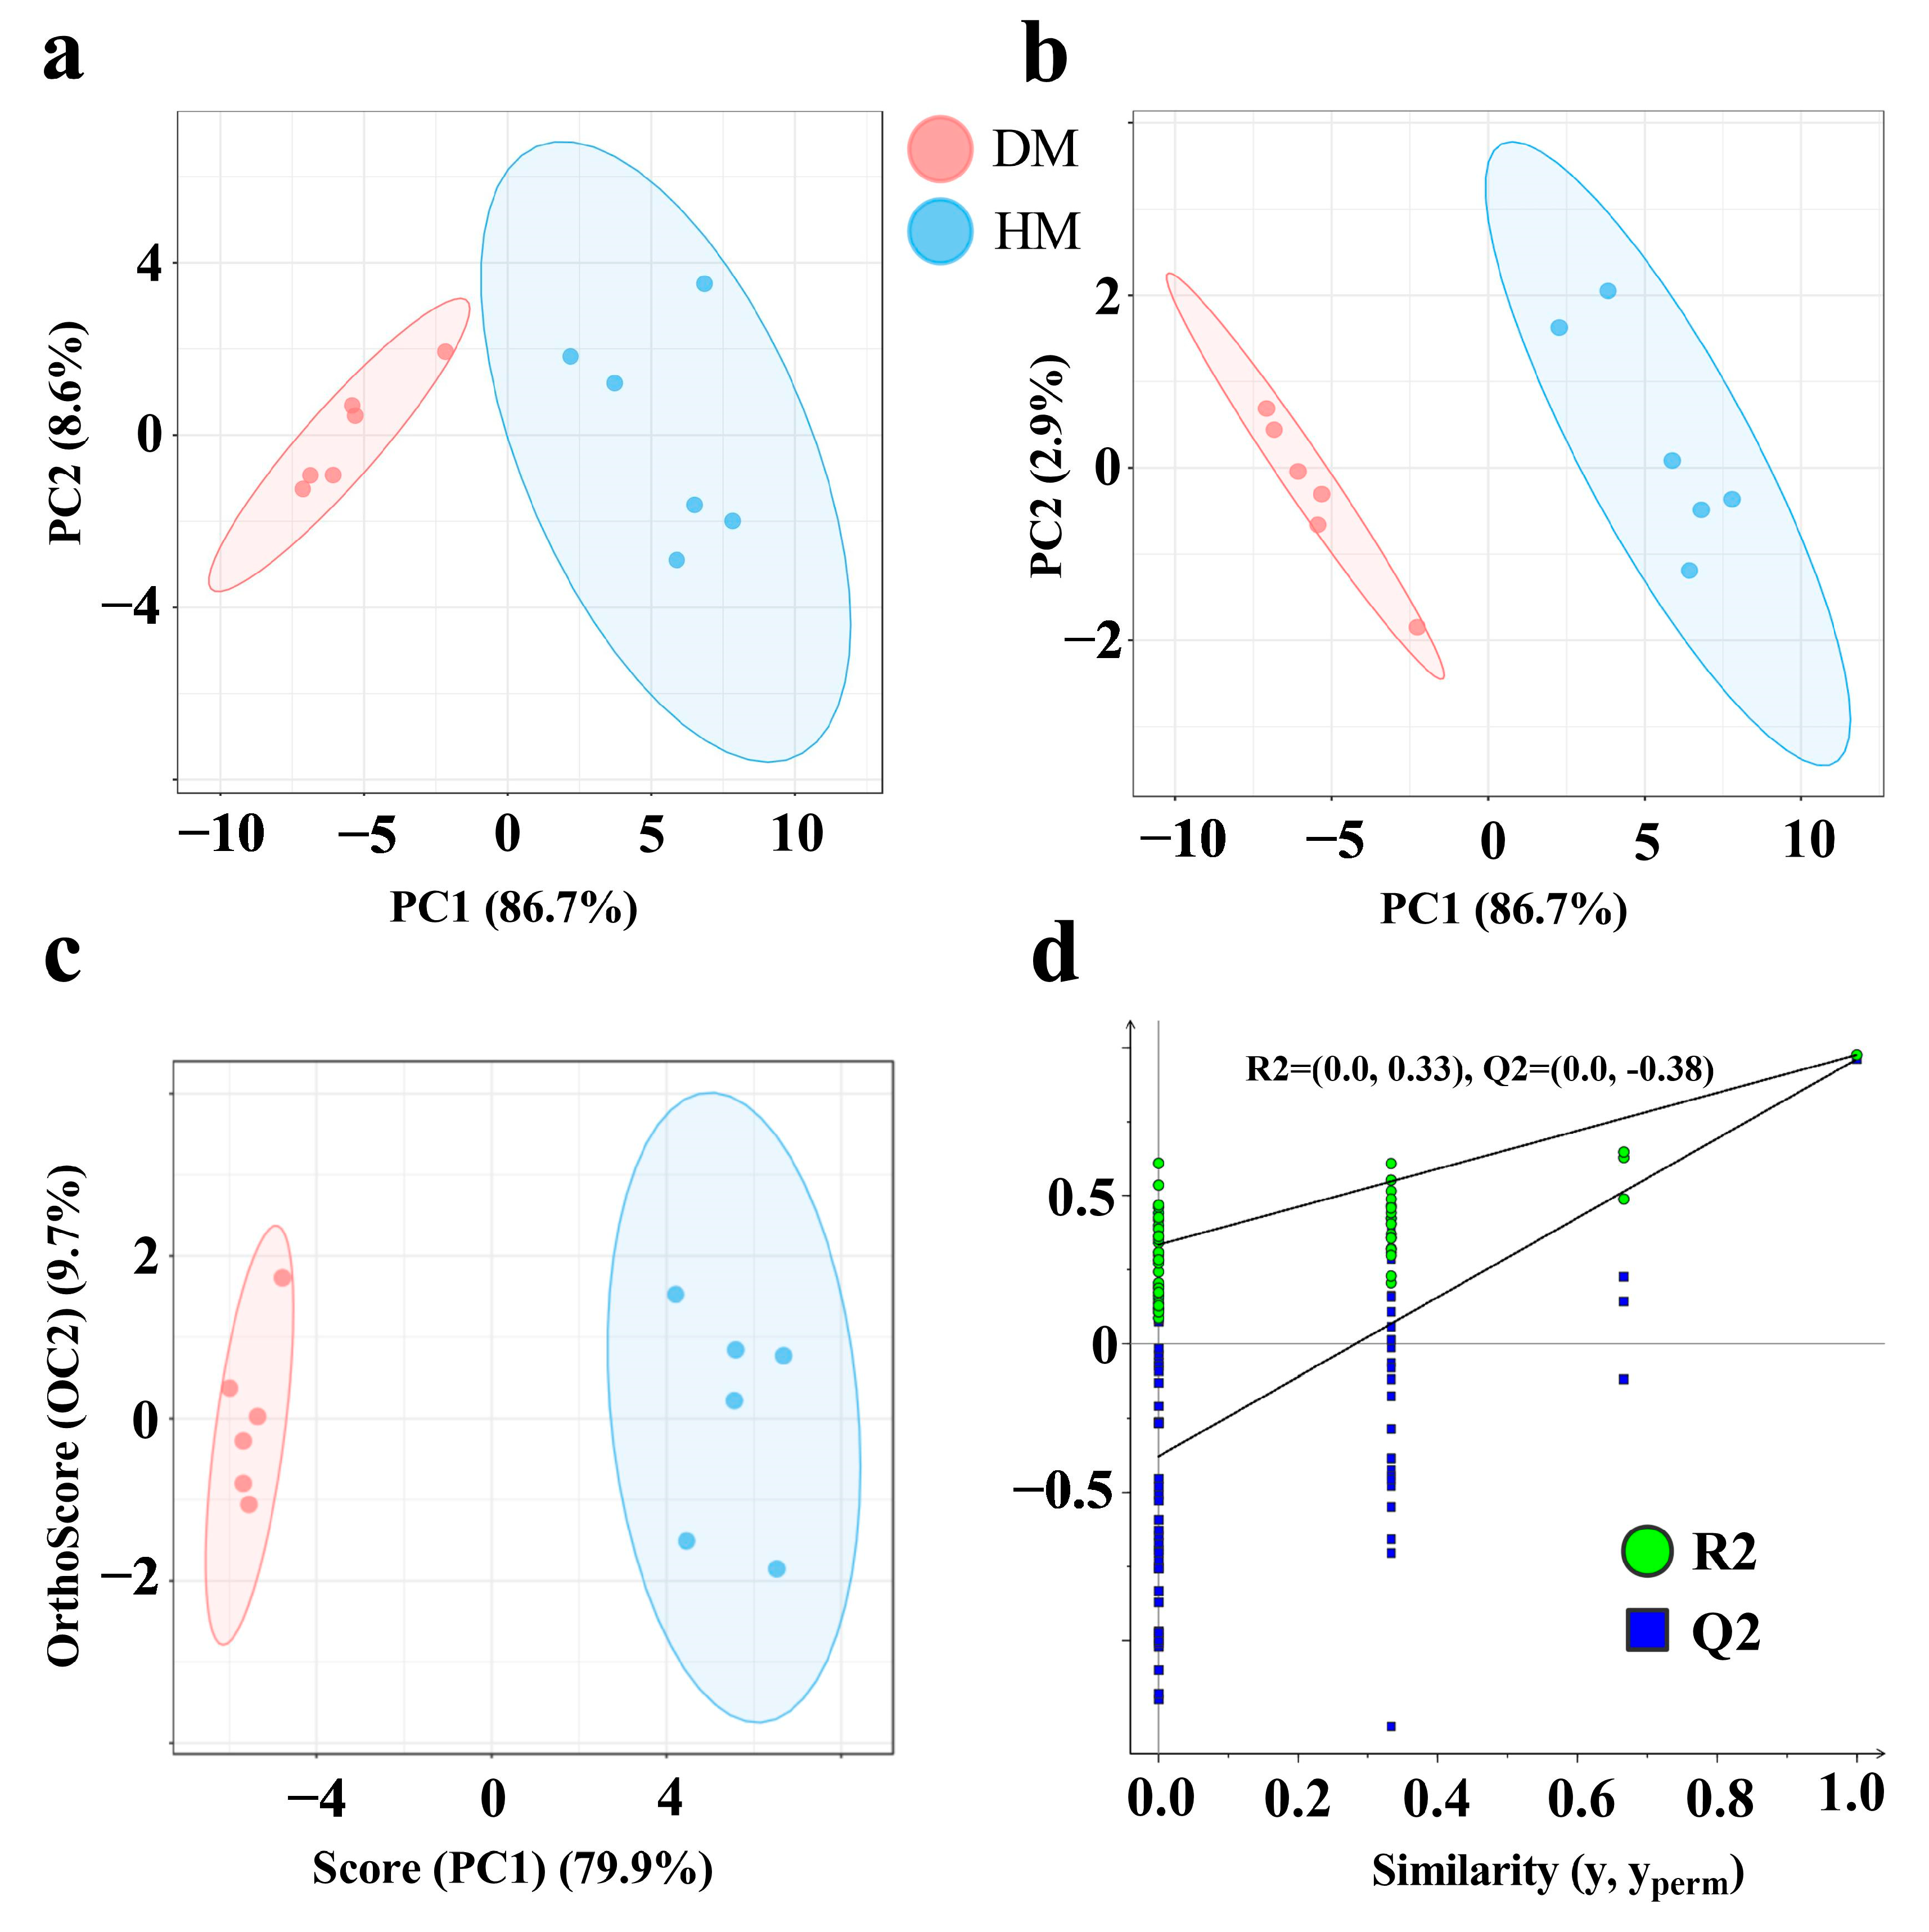
3.4. Multivariate Analysis of VOCs

As shown in Figure 4, PCA successfully differentiated meat samples based on their VOCs (Figure 4a). This differentiation coincided with the results obtained from PLS-DA and OPLS-DA (Figure 4b,c). The intercept values for R2 and Q2 were (0, 0.33) and (0, −0.38), respectively. Notably, all Q2 values were lower than the original Q2 value, which is located at the far-right of the plot, and the Q2 regression line intersected the vertical axis at a value below zero (Figure 4d). This indicates that the OPLS-DA model demonstrates strong robustness and reliability, with no evidence of overfitting. These findings suggest that the distinct differentiation between DM and HM samples based on VOCs is achievable using a multivariate analysis. As Table 2 shows, a total of 28 differentially VOCs were identified in DM and HM based on VIP > 1 and p < 0.001, which including five categories: 14 aldehydes, 8 alcohols, 4 ketones, 1 furan, and 1 acid. The levels of (E)-2-hexenal, (E)-2-octenal, (E)-hept-2-enal, 2-butanone, 2-hexanone, 2-heptanone, 2-methyl-1-propanol, 2-pentyl furan, heptanal, heptanol, hexanal, nonanal, octanal, pentanal, benzene acetaldehyde, hexanoic acid, n-hexanol, oct-1-en-3-ol, and pentan-1-ol were markedly higher in DM than those measured in HM (p < 0.001).

4. Discussion

In this study, GC-IMS coupled with a multivariate analysis was employed to characterize VOC profiles in both DM and HM. A total of 39 VOCs, categorized into five distinct groups, were identified in both DM and HM. In contrast, a previous study reported 109 and 122 VOCs in DM using GC-MS [21,22], representing a substantially higher number of VOCs than those detected in the current study. The GC-IMS used in this study exhibits high sensitivity in the low parts per billion by volume (ppbv) range, making it highly effective for quantifying low-abundance VOCs. In contrast, GC-MS is more adept at detecting a broader spectrum of VOCs, but generally exhibits lower sensitivity with regard to low-concentration compounds [23,24]. Thus, the differences in VOC detection between these two analytical techniques likely contribute to the observed variance in the number of identified compounds. Aldehydes were found to be the predominant class of VOCs in both DM and HM, which is in line with the findings reported in previous studies on VOC profiles in these types of meat [9,25]. Notably, the concentrations of aldehydes, alcohols, and ketones were generally higher in DM compared to HM. This is consistent with prior research indicating that these VOCs are typically more concentrated in DM than in pork, bovine, or sheep meat [26], further suggesting that VOC profiles may vary significantly across different species and breeds of meat.
The VOCs are released from the surface of meat and are therefore closely related to its various sensory characteristics [27]. The impact of flavor compounds on the overall sensory properties of meat is determined not only by their concentration, but also by their OAVs, which reflect the potency of these volatiles in influencing the food’s aroma [28]. Compounds with OAVs ≥ 1 are typically considered to have a significant impact on flavor [29]. In this study, a total of 16 VOCs with OAVs ≥ 1 were the characteristic VOCs in DM and HM, mainly including 3-hexanone, oct-1-en-3-ol, heptanol, octanal, and 2-pentyl furan. Characteristic VOCs were identified in DM, including hexanal, 1-octen-3-ol, (E,E)-2,4-nonadienal, nonanal, octanal, dodecanal, (E,E)-2,4-decadienal, heptanal, 2-pentyl-furan, (E)-2-octenal, and 5-methyl-2-hexanone [10]. Among these, oct-1-en-3-ol, octanal, and 2-pentyl furan were considered key characteristic VOCs in both DM and HM. Notably, which imparts a mushroom- and fruit-like aroma, is a common and distinctive flavor compound in spiced beef [30]. Previous studies have also identified octanal as a characteristic VOC, associated with green, citrus, and lemon-like flavors in soy-sauce-marinated beef as well as in frozen white and red meats [31,32]. The aroma of 2-pentyl furan has been described as reminiscent of green bean and butter in chicken and duck meat [33,34]. These findings suggest that mushroom, green, and butter-like flavors are prominent in both DM and HM. Further analysis revealed that oct-1-en-3-ol, octanal, and 2-pentyl furan exhibited significantly higher OAVs values in DM compared to HM, whereas 3-hexanone displayed the opposite trend, with higher OAVs in HM. These results validated the sensory observations that mushroom, green, and butter flavors were more pronounced in DM, while grape and wine-like flavors were more prominent in HM.
The use of GC-IMS in combination with spectroscopy and fingerprint recognition technology provides an effective and intuitive approach for differentiating between various samples based on their VOC profiles [35]. This technology has achieved proven efficacy in several areas, including the classification of meat products, detection of freshness, and identification of adulterated meat [36,37]. The integration of fingerprinting technology offers a macroscopic and visual method for analyzing and comparing subtle spectral differences in VOCs between samples [38]. The effects of dietary roughage on VOC profiles in donkey milk were characterized using GC-MS [39]. A comparative analysis of VOC distribution across different DM fractions was conducted via GC-IMS [40]. Our investigation revealed statistically significant divergence in VOC spectral signatures between DM and HM, corroborating previous findings that demonstrated distinct VOC profiles across various chicken breeds [41]. Specifically, the signals for pentanal, (E)-hept-2-enal, and heptanal were significantly stronger in DM compared to HM. To validate the accuracy of these findings, a multivariate analysis was employed to confirm the data and fingerprint profiles derived from GC-IMS, with a particular focus on the differential VOCs [42]. The PCA and PLS-DA have proven effective in distinguishing between meat species such as chicken, duck, pork, bovine, and sheep [43,44]. In our study, VOCs were successfully differentiated between DM and HM using PCA, PLS-DA, and OPLS-DA, aligning with previous findings for species differentiation in chicken, chevon, beef, and DM [45]. A total of 28 differentially VOCs were identified in DM and HM, including compounds such as (E)-2-hexenal, (E)-2-octenal, (E)-hept-2-enal, nonanal, and heptanal, which are consistent with the fingerprint analysis results. (E)-2-hexenal has become a key volatile compound for identifying different lamb breeds [46]. And the content of nonanal and (E)-2-octenal has become an important indicator for identifying whether duck meat is fresh [47]. Notably, (E)-2-octenal and nonanal concentrations were higher in DM compared to HM. These substances are recognized as oxidation products derived from linoleic acid, and previous studies have reported higher linoleic acid concentrations in DM than in HM [48,49,50]. Similarly, heptanal, a volatile oxidation product of polyunsaturated fatty acids, also showed higher concentrations in DM, in agreement with reports indicating higher PUFA content in DM relative to HM [14,51]. These findings align with a previous study indicating that the VOCs present in meat exhibit species-specific characteristics and are closely associated with the composition of fatty acids [47]. This study employed gas chromatography–ion mobility spectrometry (GC-IMS) coupled with a multivariate statistical analysis, which presents certain methodological limitations. Future research would benefit from integrating gas chromatography–olfactometry–mass spectrometry (GC-O-MS) with advanced machine learning algorithms to comprehensively characterize food flavor profiles. The synergistic application of machine learning techniques and flavor metabolomics (flavoromics) offers significant potential to elucidate the complex relationships between food flavor compounds, chemical composition, and sensory perception. This integrated approach would enable more accurate and objective evaluation of food flavor attributes, potentially establishing new paradigms in food flavor research and sensory science.

5. Conclusions

Our study employed GC-IMS integrated with multivariable statistical methods to examine the VOC profiles of DM and HM. The 39 VOCs were distinguished in DM and HM, classified into five primary categories; 16 characteristic flavor compounds were screened, mainly including 1-octen-3-ol, 3-hexanone, and heptanol. Among them, 28 distinct VOCs were detected as candidate biomarkers for differentiating DM and HM, mainly including (E)-2-hexenal, (E)-2-octenal, and (E)-hept-2-enal. Altogether, our results not only provide detailed volatile profiles for both meat types, but also highlight specific flavor compounds and key discriminatory VOCs, contributing to a deeper understanding of the flavor characteristics of DM and HM. The above results provide technical support for the adulteration and identification of DM.

Author Contributions

Y.Z.: Conceptualization, methodology, investigation, data curation, methodology, writing—original draft, review and editing. X.D., S.L. and M.S.: Formal analysis, Investigation, data curation, methodology. L.M., M.Z. and G.L.: Data curation, investigation, resources. M.Z.K.: Investigation, review and editing, data curation. C.W. and M.L.: Resources; visualization; funding acquisition; project administration. supervision, writing—original draft, review and editing, project administration. All authors have read and agreed to the published version of the manuscript.

Funding

This work was supported by National Key R&D Program of China (2022YFD1600103, 2023YFD1302004), the Shandong Provincial Natural Science Foundation (ZR2022QC130), the Shandong Province Modern Agricultural Technology System Donkey Industrial Innovation Team (SDAIT-27), the Support Program for Innovation and Technology in Universities of Shandong province (2023KJ354), and the Key R&D Program Project of Shandong Province (2021TZXD012).

Institutional Review Board Statement

The experimental procedures were approved by the Animal Care and Use Committee of Liaocheng University (approval number: 2023022706, approval date: 2023.02.27).

Informed Consent Statement

Not applicable.

Data Availability Statement

The original contributions presented in this study are included in the article. Further inquiries can be directed to the corresponding authors.

Conflicts of Interest

The authors declare no conflicts of interest.

References

  1. Stadnik, J. Nutritional value of meat and meat products and their role in human health. Nutrients 2024, 16, 1446. [Google Scholar] [CrossRef] [PubMed]
  2. Qiao, M.; Zhu, J.; Li, R.; Pan, J.; Xiao, R.; Wang, H.; Tang, K.H.D.; Zhang, Z. Spatiotemporal distribution, environmental risk and carbon emission reduction potential of livestock manure in Shaanxi Province, China. Front. Agric. Sci. Eng. 2024, 11, 381–396. [Google Scholar]
  3. Li, M.; Zhang, D.; Chai, W.; Zhu, M.; Wang, Y.; Liu, Y.; Wei, Q.; Fan, D.; Lv, M.; Jiang, X.; et al. Chemical and physical properties of meat from Dezhou black donkey. Food Sci. Technol. Res. 2022, 28, 87–94. [Google Scholar]
  4. Ivanković, A.; Šubara, G.; Bittante, G.; Šuran, E.; Amalfitano, N.; Aladrović, J.; Kelava Ugarković, N.; Pađen, L.; Pećina, M.; Konjačić, M. Potential of endangered local donkey breeds in meat and milk production. Animals 2023, 13, 2146. [Google Scholar] [CrossRef]
  5. Wang, D.; Wang, L.; Xue, C.; Han, Y.; Li, H.; Geng, J.; Jie, J. Detection of meat from horse, donkey and their hybrids (mule/hinny) by duplex real-time fluorescent PCR. PLoS ONE 2021, 15, e0237077. [Google Scholar] [CrossRef]
  6. Sujiwo, J.; Lee, S.; Kim, D.; Lee, H.; Oh, S.; Jung, Y.; Jang, A. Physicochemical features and volatile organic compounds of horse loin subjected to sous-vide cooking. Foods 2024, 13, 280. [Google Scholar] [CrossRef]
  7. Zhou, C.; Liu, L.; Xiang, J.; Fu, Q.; Wang, J.; Wang, K.; Sun, X.; Ai, L.; Xu, X.; Wang, J. Identification of horse, donkey and pig ingredients by species-specific ERA-based methods to assess the authenticity of meat products. Food Biosci. 2023, 53, 102827. [Google Scholar]
  8. Li, M.; Ren, W.; Chai, W.; Zhu, M.; Man, L.; Zhan, Y.; Qin, H.; Sun, M.; Liu, J.; Zhang, D. Comparing the profiles of raw and cooked donkey meat by metabonomics and lipidomics assessment. Front. Nutr. 2022, 9, 851761. [Google Scholar] [CrossRef] [PubMed]
  9. Beldarrain, L.R.; Morán, L.; Sentandreu, M.Á.; Barron, L.J.R.; Aldai, N. Effect of ageing time on the volatile compounds from cooked horse meat. Meat Sci. 2022, 184, 108692. [Google Scholar]
  10. Li, M.; Sun, L.; Du, X.; Ren, W.; Man, L.; Chai, W.; Zhu, M.; Liu, G.; Wang, C. Characterization of lipids and volatile compounds in boiled donkey meat by lipidomics and volatilomics. J. Food Sci. 2024, 89, 3445–3454. [Google Scholar]
  11. Sohail, A.; Al-Dalali, S.; Wang, J.; Xie, J.; Shakoor, A.; Asimi, S.; Shah, H.; Patil, P. Aroma compounds identified in cooked meat: A review. Food Res. Int. 2022, 157, 111385. [Google Scholar] [CrossRef] [PubMed]
  12. Listrat, A.; Lebret, B.; Louveau, I.; Astruc, T.; Bonnet, M.; Lefaucheur, L.; Picard, B.; Bugeon, J. How muscle structure and composition influence meat and flesh quality. Sci. World J. 2016, 2016, 3182746. [Google Scholar] [CrossRef] [PubMed]
  13. Li, M.; Zhu, M.; Chai, W.; Wang, Y.; Fan, D.; Lv, M.; Jiang, X.; Liu, Y.; Wei, Q.; Wang, C. Determination of lipid profiles of Dezhou donkey meat using an LC-MS-based lipidomics method. J. Food Sci. 2021, 86, 4511–4521. [Google Scholar] [CrossRef] [PubMed]
  14. Marino, R.; Della Malva, A.; Maggiolino, A.; De Palo, P.; D Angelo, F.; Lorenzo, J.M.; Sevi, A.; Albenzio, M. Nutritional profile of donkey and horse meat: Effect of muscle and aging time. Animals 2022, 12, 746. [Google Scholar] [CrossRef]
  15. Cai, D.; Li, X.; Liu, H.; Wen, L.; Di, Q. Machine learning and flavoromics-based research strategies for determining the characteristic flavor of food: A review. Trends Food Sci. Technol. 2024, 154, 104794. [Google Scholar] [CrossRef]
  16. Liu, D.; Bai, L.; Feng, X.; Chen, Y.P.; Zhang, D.; Yao, W.; Zhang, H.; Chen, G.; Liu, Y. Characterization of Jinhua ham aroma profiles in specific to aging time by gas chromatography-ion mobility spectrometry (GC-IMS). Meat Sci. 2020, 168, 108178. [Google Scholar] [CrossRef]
  17. Wang, S.; Chen, H.; Sun, B. Recent progress in food flavor analysis using gas chromatography–ion mobility spectrometry (GC–IMS). Food Chem. 2020, 315, 126158. [Google Scholar] [CrossRef]
  18. Chen, J.; Wang, W.; Jin, J.; Li, H.; Chen, F.; Fei, Y.; Wang, Y. Characterization of the flavor profile and dynamic changes in Chinese traditional fish sauce (Yu-lu) based on electronic nose, SPME-GC-MS and HS-GC-IMS. Food Res. Int. 2024, 192, 114772. [Google Scholar] [CrossRef]
  19. He, L.; Yang, H.; Lan, F.; Chen, R.; Jiang, P.; Jin, W. Use of GC-IMS and stoichiometry to characterize flavor volatiles in different parts of lueyang black chicken during slaughtering and cutting. Foods 2024, 13, 1885. [Google Scholar] [CrossRef]
  20. Maggiolino, A.; Lorenzo, J.M.; Centoducati, G.; Domínguez, R.; Dinardo, F.R.; Marino, R.; Malva, A.D.; Bragaglio, A.; De Palo, P. How volatile compounds, oxidative profile and sensory evaluation can change with vacuum aging in donkey meat. Animals 2020, 10, 2126. [Google Scholar] [CrossRef]
  21. Polidori, P.; Santini, G.; Klimanova, Y.; Zhang, J.; Vincenzetti, S. Effects of ageing on donkey meat chemical composition, fatty acid profile and volatile compounds. Foods 2022, 11, 821. [Google Scholar] [CrossRef] [PubMed]
  22. Zhang, K.; Zhang, C.; Gao, L.; Zhuang, H.; Feng, T.; Xu, G. Analysis of volatile flavor compounds of green wheat under different treatments by GC-MS and GC-IMS. Food Biochem. 2021, 46, e13875. [Google Scholar]
  23. Yan, J.; Chen, J.; Huang, Z.; He, L.; Wu, L.; Yu, L.; Zhu, W. Characterisation of the volatile compounds in nine varieties and three breeding selections of celery using GC–IMS and GC–MS. Food Chem. X 2024, 24, 101936. [Google Scholar] [PubMed]
  24. Man, L.; Ren, W.; Qin, H.; Sun, M.; Yuan, S.; Zhu, M.; Liu, G.; Wang, C.; Li, M. Characterization of the relationship between lipids and volatile compounds in donkey, bovine, and sheep meat by UHPLC–ESI–MS and SPME–GC–MS. Lebensm.-Wiss. Technol. 2023, 175, 114426. [Google Scholar]
  25. Li, X.; Amadou, I.; Zhou, G.; Qian, L.; Zhang, J.; Wang, D.; Cheng, X. Flavor Components Comparison between the Neck Meat of Donkey, Swine, Bovine, and Sheep. Food Sci. Anim. Resour. 2020, 40, 527–540. [Google Scholar]
  26. Ni, Q.; Amalfitano, N.; Biasioli, F.; Gallo, L.; Tagliapietra, F.; Bittante, G. Bibliometric review on the volatile organic compounds in meat. Foods 2022, 11, 3574. [Google Scholar] [CrossRef]
  27. Liu, H.; Hui, T.; Zheng, X.; Li, S.; Wei, X.; Li, P.; Zhang, D.; Wang, Z. Characterization of key lipids for binding and generating aroma compounds in roasted mutton by UPLC-ESI-MS/MS and Orbitrap Exploris GC. Food Chem. 2022, 374, 131723. [Google Scholar]
  28. Dein, M.; Moore, A.; Ricketts, C.; Huynh, C.; Munafo, J.P.J. Characterization of odorants in chardonnay marc skins. J. Agric. Food. Chem. 2021, 69, 12262–12269. [Google Scholar]
  29. Jiang, F.; Zhang, J.; Zhang, R.; Zhang, W. Effects of ultrasound-assisted vacuum tumbling on the flavor of spiced beef. Food Biosci. 2024, 58, 103652. [Google Scholar]
  30. Wang, J.; Yang, P.; Liu, J.; Yang, W.; Qiang, Y.; Jia, W.; Han, D.; Zhang, C.; Purcaro, G.; Fauconnier, M. Study of the flavor dissipation mechanism of soy-sauce-marinated beef using flavor matrices. Food Chem. 2024, 437, 137890. [Google Scholar]
  31. Yu, L.; Pang, Y.; Shen, G.; Bai, B.; Yang, Y.; Zeng, M. Identification and selection of volatile compounds derived from lipid oxidation as indicators for quality deterioration of frozen white meat and red meat using HS-SPME-GC–MS combined with OPLS-DA. Food Chem. 2025, 463, 141112. [Google Scholar] [PubMed]
  32. Weng, K.; Song, L.; Bao, Q.; Cao, Z.; Zhang, Y.; Zhang, Y.; Chen, G.; Xu, Q. Comparative characterization of key volatile compounds in slow- and fast-growing duck raw meat based on widely targeted metabolomics. Foods 2022, 11, 3975. [Google Scholar] [CrossRef] [PubMed]
  33. Zhao, W.; Tian, Y.; Wang, Y.; Du, J.; Chen, L.; Gu, T.; Song, M.; Lu, L.; Sun, C. Dietary effect of Dendrobium officinale leaves on chicken meat quality, fatty acid composition, and volatile compounds profile. Food Chem. X 2024, 22, 101330. [Google Scholar] [PubMed]
  34. Li, Y.; Yuan, L.; Liu, H.; Liu, H.; Zhou, Y.; Li, M.; Gao, R. Analysis of the changes of volatile flavor compounds in a traditional Chinese shrimp paste during fermentation based on electronic nose, SPME-GC-MS and HS-GC-IMS. Food Sci. Hum. Wellness 2023, 12, 173–182. [Google Scholar]
  35. Cavanna, D.; Zanardi, S.; Dall’Asta, C.; Suman, M. Ion mobility spectrometry coupled to gas chromatography: A rapid tool to assess eggs freshness. Food Chem. 2019, 271, 691–696. [Google Scholar]
  36. Yuan, J.; Li, H.; Cao, S.; Liu, Z.; Li, N.; Xu, D.; Mo, H.; Hu, L. Monitoring of volatile compounds of ready-to-eat kiwifruit using GC-IMS. Foods 2023, 12, 4394. [Google Scholar] [CrossRef]
  37. Zhang, L.; Shi, P.; Sun, J.; Xie, M.; Wang, H.; Shi, T.; Yu, M. Analysis of roasted peanuts based on GC–MS combined with GC–IMS. Food Sci. Nutr. 2024, 12, 1888–1901. [Google Scholar]
  38. Ren, W.; Sun, M.; Shi, X.; Wang, T.; Wang, Y.; Wang, X.; Huang, B.; Kou, X.; Liang, H.; Chen, Y.; et al. Effects of roughage on the lipid and volatile-organic-compound profiles of donkey milk. Foods 2023, 12, 2231. [Google Scholar] [CrossRef]
  39. Li, M.; Sun, M.; Ren, W.; Man, L.; Chai, W.; Liu, G.; Zhu, M.; Wang, C. Characterization of volatile compounds in donkey meat by gas chromatography-ion mobility spectrometry (GC-IMS) combined with chemometrics. Food Sci. Anim. Resour. 2024, 44, 165–177. [Google Scholar]
  40. Li, H.; Zhao, X.; Qin, S.; Li, J.; Tang, D.; Xi, B. GC-IMS and multivariate analyses of volatile organic components in different Chinese breeds of chickens. Heliyon 2024, 10, e29664. [Google Scholar]
  41. Li, H.; Xi, B.; Lin, S.; Tang, D.; Gao, Y.; Zhao, X.; Liang, J.; Yang, W.; Li, J. Volatile Flavor Analysis in Yak Meat: Effects of different breeds, feeding methods, and parts using GC-IMS and multivariate analyses. Foods 2024, 13, 3130. [Google Scholar] [CrossRef] [PubMed]
  42. Wang, Q.; Du, R.; Wang, Y.; Zhang, S.; Wang, L.; Wang, L. Characterization and differentiation of flavor profile of 12 air-dried yak meat products using GC–IMS and multivariate analysis. Foods 2024, 13, 2626. [Google Scholar] [CrossRef] [PubMed]
  43. Zhou, W.; Xia, L.; Huang, C.; Yang, J.; Shen, C.; Jiang, H.; Chu, Y. Rapid analysis and identification of meat species by laser-ablation electrospray mass spectrometry (LAESI-MS). Rapid Commun. Mass Spectrom. 2016, 30, 116–121. [Google Scholar] [CrossRef] [PubMed]
  44. Akhtar, M.T.; Samar, M.; Shami, A.A.; Mumtaz, M.W.; Mukhtar, H.; Tahir, A.; Shahzad-ul-Hussan, S.; Chaudhary, S.U.; Kaka, U. 1H-NMR-Based metabolomics: An integrated approach for the detection of the adulteration in chicken, chevon, beef and donkey meat. Molecules 2021, 26, 4643. [Google Scholar] [CrossRef]
  45. Zhang, C.; Zhang, H.; Liu, M.; Zhao, X.G.; Luo, H. Effect of breed on the volatile compound precursors and odor profile attributes of lamb meat. Foods 2020, 9, 1178. [Google Scholar] [CrossRef]
  46. Guo, Y.; Cao, Z.; Weng, K.; Zhang, Y.; Zhang, Y.; Chen, G.; Xu, Q. Effect of chilled storage period on the volatile organic compounds and bacterial community in goose meat. Food Chem. X 2024, 23, 101685. [Google Scholar] [CrossRef]
  47. Aroua, M.; Fehri, N.E.; Ben Said, S.; Quattrone, A.; Agradi, S.; Brecchia, G.; Balzaretti, C.M.; Mahouachi, M.; Castrica, M. The use of horse and donkey meat to enhance the quality of the traditional meat product (kaddid): Analysis of physico-chemical traits. Foods 2024, 13, 2974. [Google Scholar] [CrossRef]
  48. Li, P.; Zhao, W.; Liu, Y.; Zhang, A.; Liu, S.; Song, R.; Zhang, M.; Liu, J. Precursors of volatile organics in foxtail millet (Setaria italica) porridge: The relationship between volatile compounds and five fatty acids upon cooking. J. Cereal Sci. 2021, 100, 103253. [Google Scholar] [CrossRef]
  49. Varlet, V.; Prost, C.; Serot, T. Volatile aldehydes in smoked fish: Analysis methods, occurence and mechanisms of formation. Food Chem. 2007, 105, 1536–1556. [Google Scholar] [CrossRef]
  50. Kong, S.; Su, Y.; Li, Z.; Chi, X.; Huang, Y.; Zhang, J.; Ai, N. The hotspot of consumers complaints on infant formula: Exploring the relationship among volatile components, sensory evaluation, and aroma recombination and omission experiment. J. Food Compos. Anal. 2024, 134, 106555. [Google Scholar] [CrossRef]
  51. Wang, W.; Sun, B.; Hu, P.; Zhou, M.; Sun, S.; Du, P.; Ru, Y.; Suvorov, A.; Li, Y.; Liu, Y.; et al. Comparison of differential flavor metabolites in meat of lubei white goat, jining gray goat and boer goat. Metabolites 2019, 9, 176. [Google Scholar] [CrossRef]
Figure 1. Volatile compounds in donkey and horse meat. Quantity of volatile compounds (a). The quantity (b) and percentage (c) of volatile compounds types. The percentage (d) and concentration (e) of volatile compounds in donkey and horse meat. The data are expressed as mean ± standard error (n = 6), *** p < 0.001. DM, donkey meat. HM, horse meat.
Foods 14 01203 g001
Figure 2. Characteristics of volatile flavor compounds in donkey and horse meat. Red expresses a high content of the flavor compound in the pattern, while green expresses a low content of the flavor compounds in the pattern. * p < 0.05, ** p < 0.01, *** p < 0.001. n = 6, DM, donkey meat. HM, horse meat.
Foods 14 01203 g002
Figure 3. Differential volatile compounds in donkey and horse meat. Differential spectra (a) and fingerprint spectra (b) of volatile compounds. The color brightness of the signal peak is directly proportional to the concentration of the component, that is, the brighter the color, the higher the concentration of the component. n = 6, DM, donkey meat. HM, horse meat.
Foods 14 01203 g003
Figure 4. Multivariate analysis of volatile compounds in donkey and horse meat. Principal component analysis (PCA; (a)), partial least squares discriminant analysis (PLS-DA; (b)), and orthogonal partial least squares discriminant analysis (OPLS-DA; (c)) scoring charts; and the corresponding OPLS-DA validation diagram (d). n = 6, DM, donkey meat. HM, horse meat.
Foods 14 01203 g004
Table 1. Volatile compounds in donkey and horse meat.
CountCompoundCAS #FormulaMWRIRt [s]Dt [a.u.]
1Octanal-MC124130C8H16O128.201014.50603.171.42
2Octanal-DC124130C8H16O128.201014.50603.171.82
32-pentyl furanC3777693C9H14O138.20994.70573.841.25
4Oct-1-en-3-ol-MC3391864C8H16O128.20985.70553.451.16
5Oct-1-en-3-ol-DC3391864C8H16O128.20984.30550.471.60
6Unidentified 1unidentified*0.00989.70562.371.43
7HeptanolC53535334C7H16O116.20977.40535.601.40
8BenzaldehydeC100527C7H6O106.10963.50506.701.14
9(E)-hept-2-enal-MC18829555C7H12O112.20959.30498.201.25
10(E)-hept-2-enal-DC18829555C7H12O112.20959.50498.621.66
11Dihydro-2(3h)-furanoneC96480C4H6O286.10924.60433.931.08
12Heptanal-MC111717C7H14O114.20903.40398.661.34
13Heptanal-DC111717C7H14O114.20904.10399.801.69
142-heptanone-MC110430C7H14O114.20891.20379.891.27
152-heptanone-DC110430C7H14O114.20892.00381.021.62
16n-Hexanol-MC111273C6H14O102.20873.20355.421.33
17n-Hexanol-DC111273C6H14O102.20871.90353.721.64
18(E)-2-hexenal-MC6728263C6H10O98.10853.50330.401.18
19(E)-2-hexenal-DC6728263C6H10O98.10851.60328.121.51
20Hexanal-MC66251C6H12O100.20796.70267.821.27
21Hexanal-DC66251C6H12O100.20792.70263.841.55
222-HexanoneC591786C6H12O100.20782.10253.591.19
233-HexanoneC589388C6H12O100.20783.00254.451.17
24Pentan-1-ol-MC71410C5H12O88.10765.70237.811.26
25Pentan-1-ol-DC71410C5H12O88.10765.70237.811.52
263-hydroxybutan-2-oneC513860C4H8O288.10716.80196.371.07
27Propanoic acid-MC79094C3H6O274.10704.20186.961.11
28Propanoic acid-DC79094C3H6O274.10703.60186.511.27
29Unidentified 2unidentified*0.00687.10175.271.12
30Unidentified 3unidentified*0.00687.10175.271.32
31Pentanal-MC110623C5H10O86.10701.40184.921.20
32Pentanal-DC110623C5H10O86.10703.60186.501.42
332-methyl-1-propanolC78831C4H10O74.10646.50159.121.18
342-Butanone-MC78933C4H8O72.10591.00139.461.06
352-Butanone-DC78933C4H8O72.10587.30138.241.24
36NonanalC124196C9H18O142.201105.50749.041.49
37(E)-2-octenalC2548870C8H14O126.201068.50685.861.33
38Benzene acetaldehydeC122781C8H8O120.201044.60647.931.26
39Unidentified 4unidentified*0.00688.70175.971.36
40Pent-1-en-3-olC616251C5H10O86.10677.80171.440.94
41Methyl isobutyl ketoneC108101C6H12O100.20732.20208.621.17
42Hexanoic acidC142621C6H12O2116.20992.10567.771.31
43BenzaldehydeC100527C7H6O106.10963.60506.911.46
RI, retention indices. Rt, retention time. Dt, drift time. MW, molecular weight. #, registration number. *, unidentified.
Table 2. Differential volatile components in donkey and horse meat (μg/kg).
CountNameClassDMHMlog2FCp ValueVIP
1(E)-2-hexenal-DAldehyde1.47 ± 0.13 a0.48 ± 0.04 b1.610.00001.10
2(E)-2-hexenal-MAldehyde7.71 ± 0.72 a2.88 ± 0.29 b1.420.00011.06
3(E)-2-octenalAldehyde2.44 ± 0.26 a0.48 ± 0.04 b2.330.00001.14
4(E)-hept-2-enal-DAldehyde6.96 ± 0.69 a1.01 ± 0.08 b2.790.00001.15
5(E)-hept-2-enal-MAldehyde26.39 ± 2.27 a4.66 ± 0.75 b2.500.00001.14
62-Butanone-DKetone10.50 ± 1.11 a4.28 ± 0.43 b1.300.00011.07
72-HexanoneKetone5.02 ± 0.35 a2.48 ± 0.17 b1.020.00001.08
82-heptanone-DKetone12.92 ± 1.50 a1.40 ± 0.32 b3.210.00001.14
92-heptanone-MKetone19.91 ± 1.66 a5.99 ± 0.87 b1.730.00001.11
102-methyl-1-propanolAlcohol29.76 ± 2.73 a10.93 ± 0.79 b1.450.00001.09
112-pentyl furanFuran12.67 ± 1.74 a2.03 ± 0.40 b2.640.00001.12
12Heptanal-DAldehyde18.61 ± 1.74 a1.85 ± 0.37 b3.330.00001.16
13Heptanal-MAldehyde20.27 ± 1.36 a5.75 ± 0.93 b1.820.00001.12
14HeptanolAlcohol3.98 ± 0.29 a1.18 ± 0.07 b1.760.00001.13
15Hexanal-DAldehyde229.16 ± 15.15 a79.20 ± 11.79 b1.530.00001.11
16NonanalAldehyde5.19 ± 0.43 a1.86 ± 0.13 b1.480.00001.11
17Octanal-DAldehyde4.30 ± 0.38 a1.08 ± 0.09 b2.000.00001.12
18Octanal-MAldehyde11.72 ± 0.83 a3.54 ± 0.31 b1.730.00001.14
19Pentanal-DAldehyde49.83 ± 3.92 a3.27 ± 0.88 b3.930.00001.16
20Pentanal-MAldehyde39.27 ± 2.57 a9.12 ± 2.23 b2.110.00081.10
21Benzene acetaldehydeAldehyde2.76 ± 0.28 a0.46 ± 0.06 b2.580.00001.14
22Hexanoic acidAcid3.30 ± 0.37 a1.22 ± 0.14 b1.430.00021.04
23n-Hexanol-DAlcohol17.59 ± 0.80 a2.11 ± 0.42 b3.060.00001.16
24n-Hexanol-MAlcohol35.83 ± 2.07 a10.98 ± 1.54 b1.710.00001.13
25Oct-1-en-3-ol-DAlcohol19.55 ± 1.78 a3.94 ± 0.73 b2.310.00001.12
26Oct-1-en-3-ol-MAlcohol74.50 ± 5.48 a25.44 ± 3.56 b1.550.00001.11
27Pentan-1-ol-DAlcohol78.63 ± 7.00 a13.68 ± 2.51 b2.520.00001.14
28Pentan-1-ol-MAlcohol74.70 ± 4.74 a37.70 ± 3.31 b0.990.00011.07
29Unidentified 1Unidentified44.91 ± 3.88 a14.83 ± 2.44 b1.600.00011.09
30Unidentified 4Unidentified28.76 ± 2.30 a8.15 ± 0.76 b1.820.00001.14
a,b: Values of a and b with different letters in the same row indicate significant differences. VIP, variable importance in projection. DM, donkey meat. HM, horse meat. FC in log2FC, i.e., fold change, indicates the ratio of expression between two samples (groups).
Disclaimer/Publisher’s Note: The statements, opinions and data contained in all publications are solely those of the individual author(s) and contributor(s) and not of MDPI and/or the editor(s). MDPI and/or the editor(s) disclaim responsibility for any injury to people or property resulting from any ideas, methods, instructions or products referred to in the content.

