
Enhanced Bioactive Coffee Cherry: Infusion of Submerged-Fermented Green Coffee Beans via Vacuum Impregnation

 , , , ,
  ,
,  and
and 
Abstract
1. Introduction
2. Materials and Methods
2.1. Green Coffee Beans and Chemicals
2.2. Collection of Microbial Culture
2.3. Preparation of Starters
2.4. Submerged Fermentation
2.5. Optimization of Submerged Fermentation
2.6. Ultrasonic-Assisted Treatment of Coffee Cherry
2.7. Vacuum Impregnation
2.8. The Measurements of Microbial Growth and pH
2.9. TPC Determination
2.10. Determination of Antioxidant Activities
2.10.1. ABTS Assay
2.10.2. DPPH Radical Scavenging Assay
2.10.3. FRAP Assay
2.11. Water-Holding Capacity (WHC) of Coffee Cherry
2.12. Hardness Texture of Coffee Cherry
2.13. Scanning Electron Microscopy (SEM) of Coffee Cherry
2.14. Chlorogenic Acid Determination
2.15. Statistical Analysis
3. Results and Discussion
3.1. Microbial Count and pH
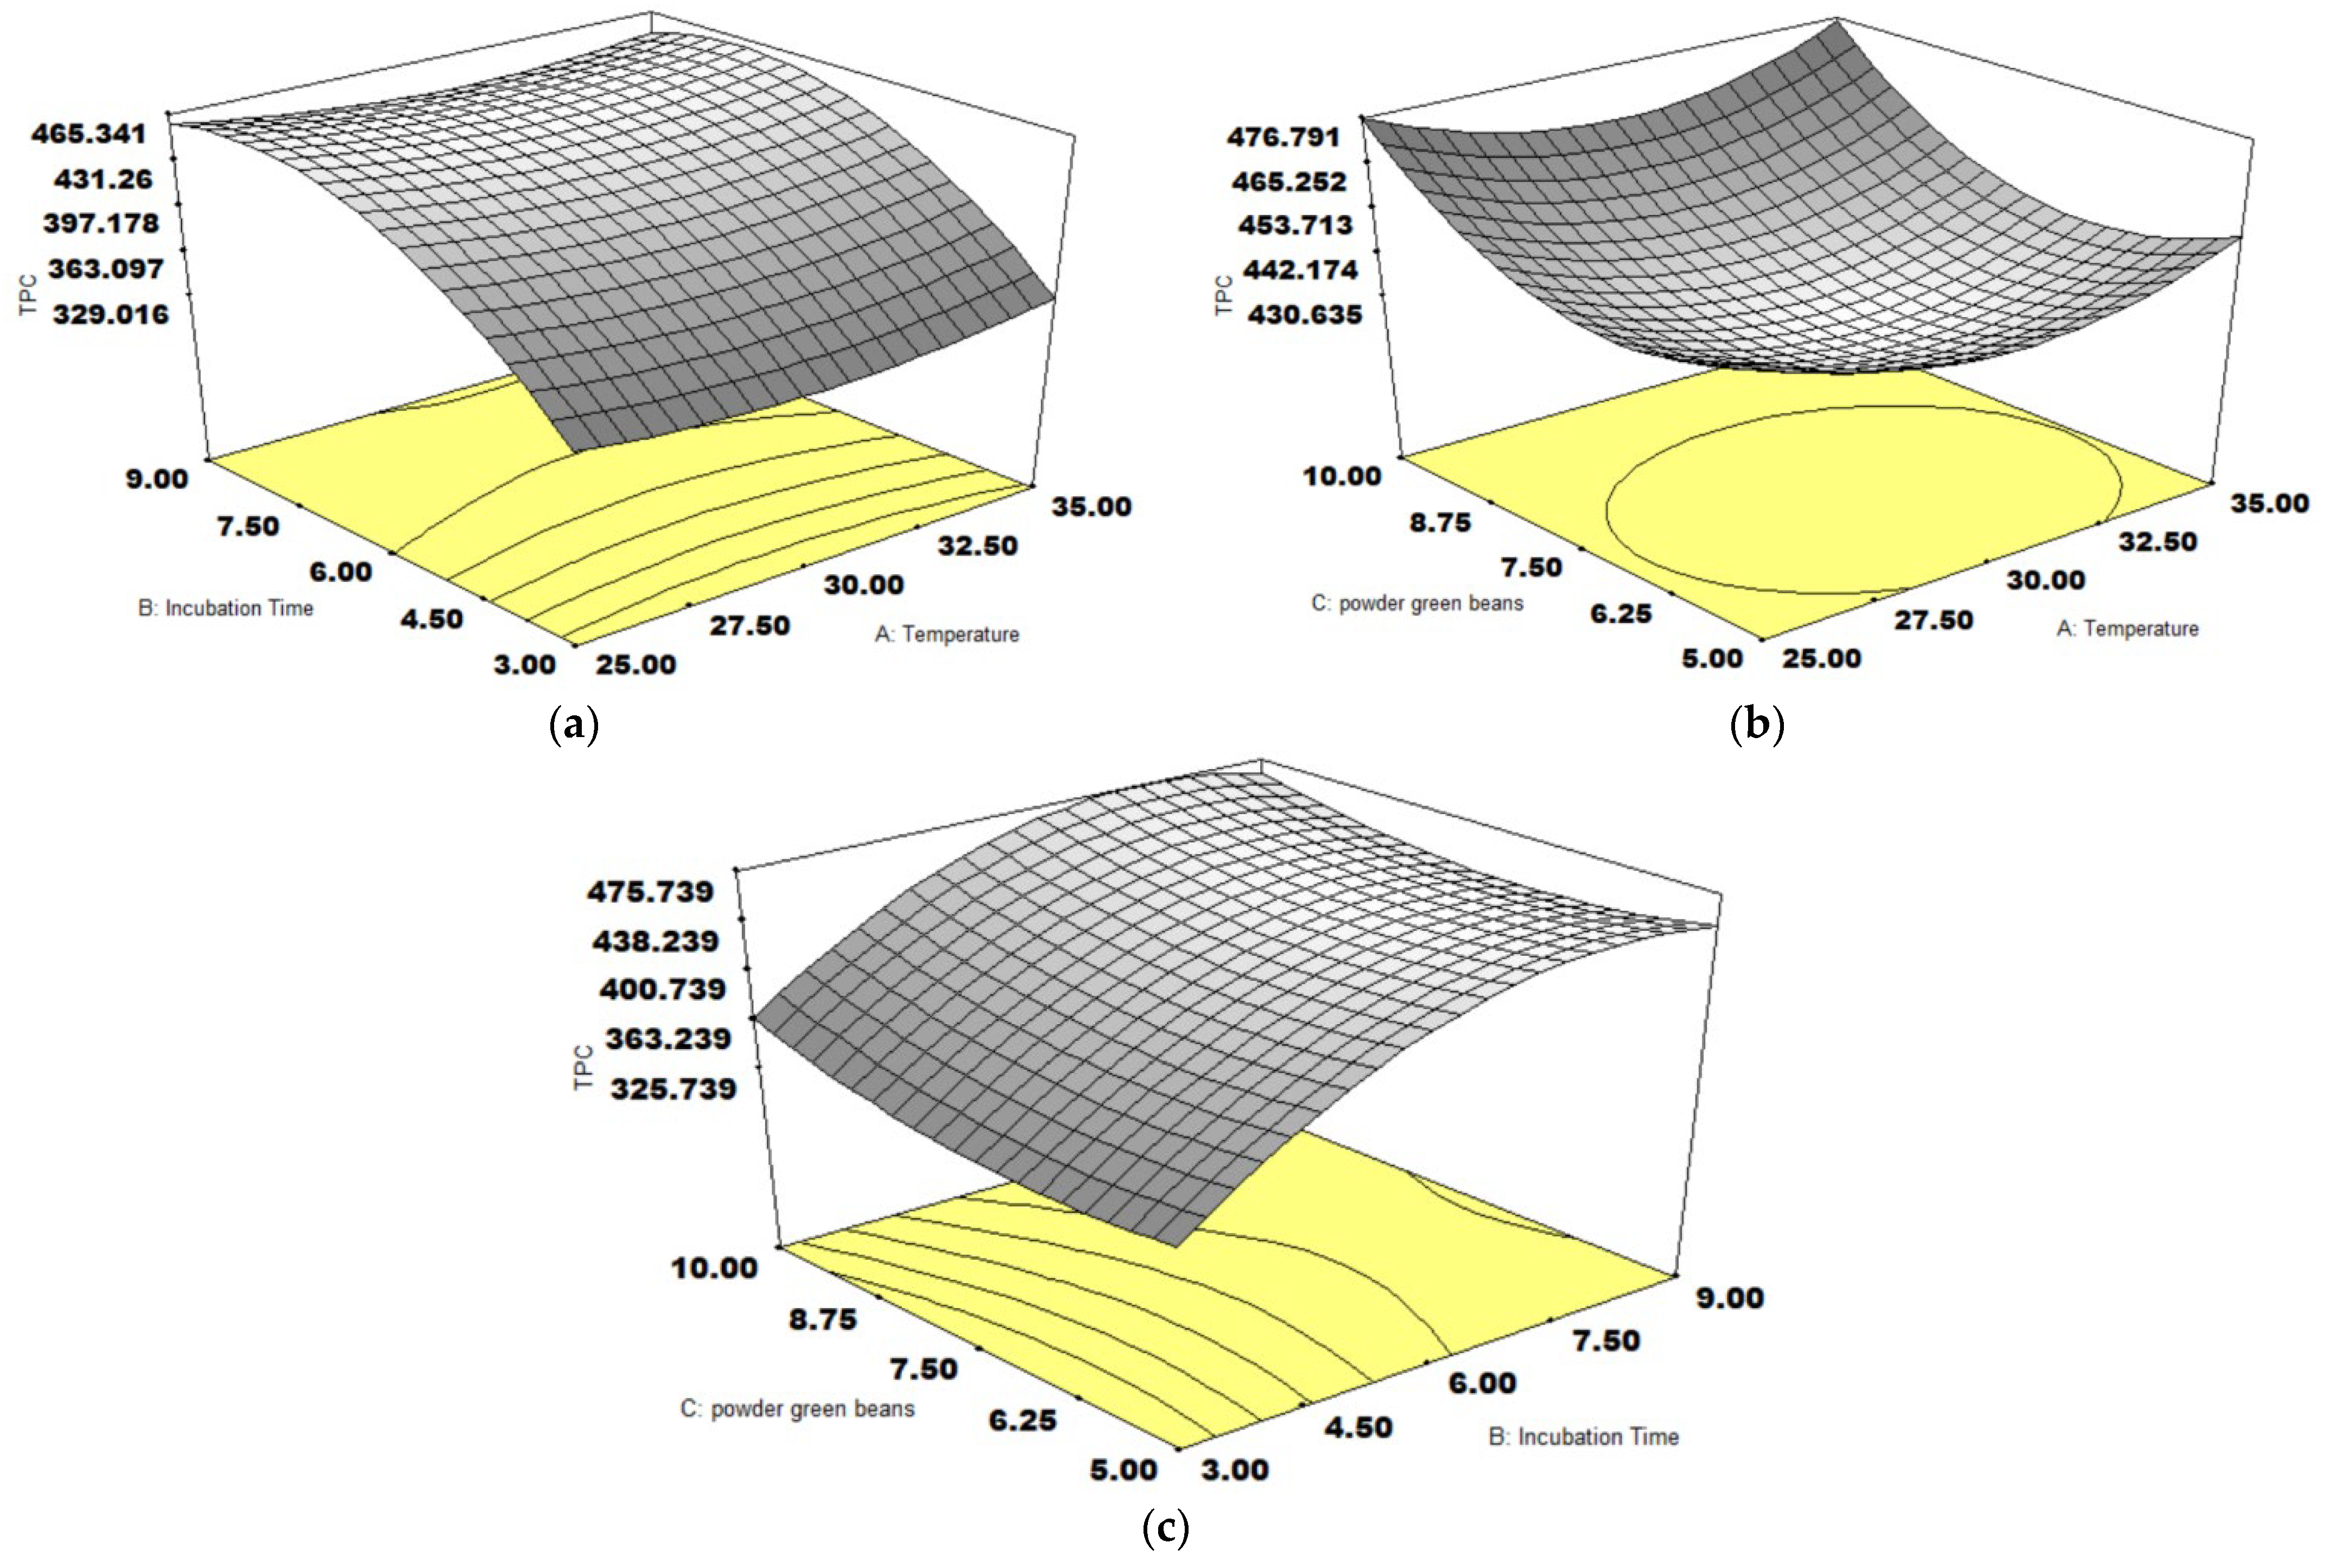
3.2. TPC Content
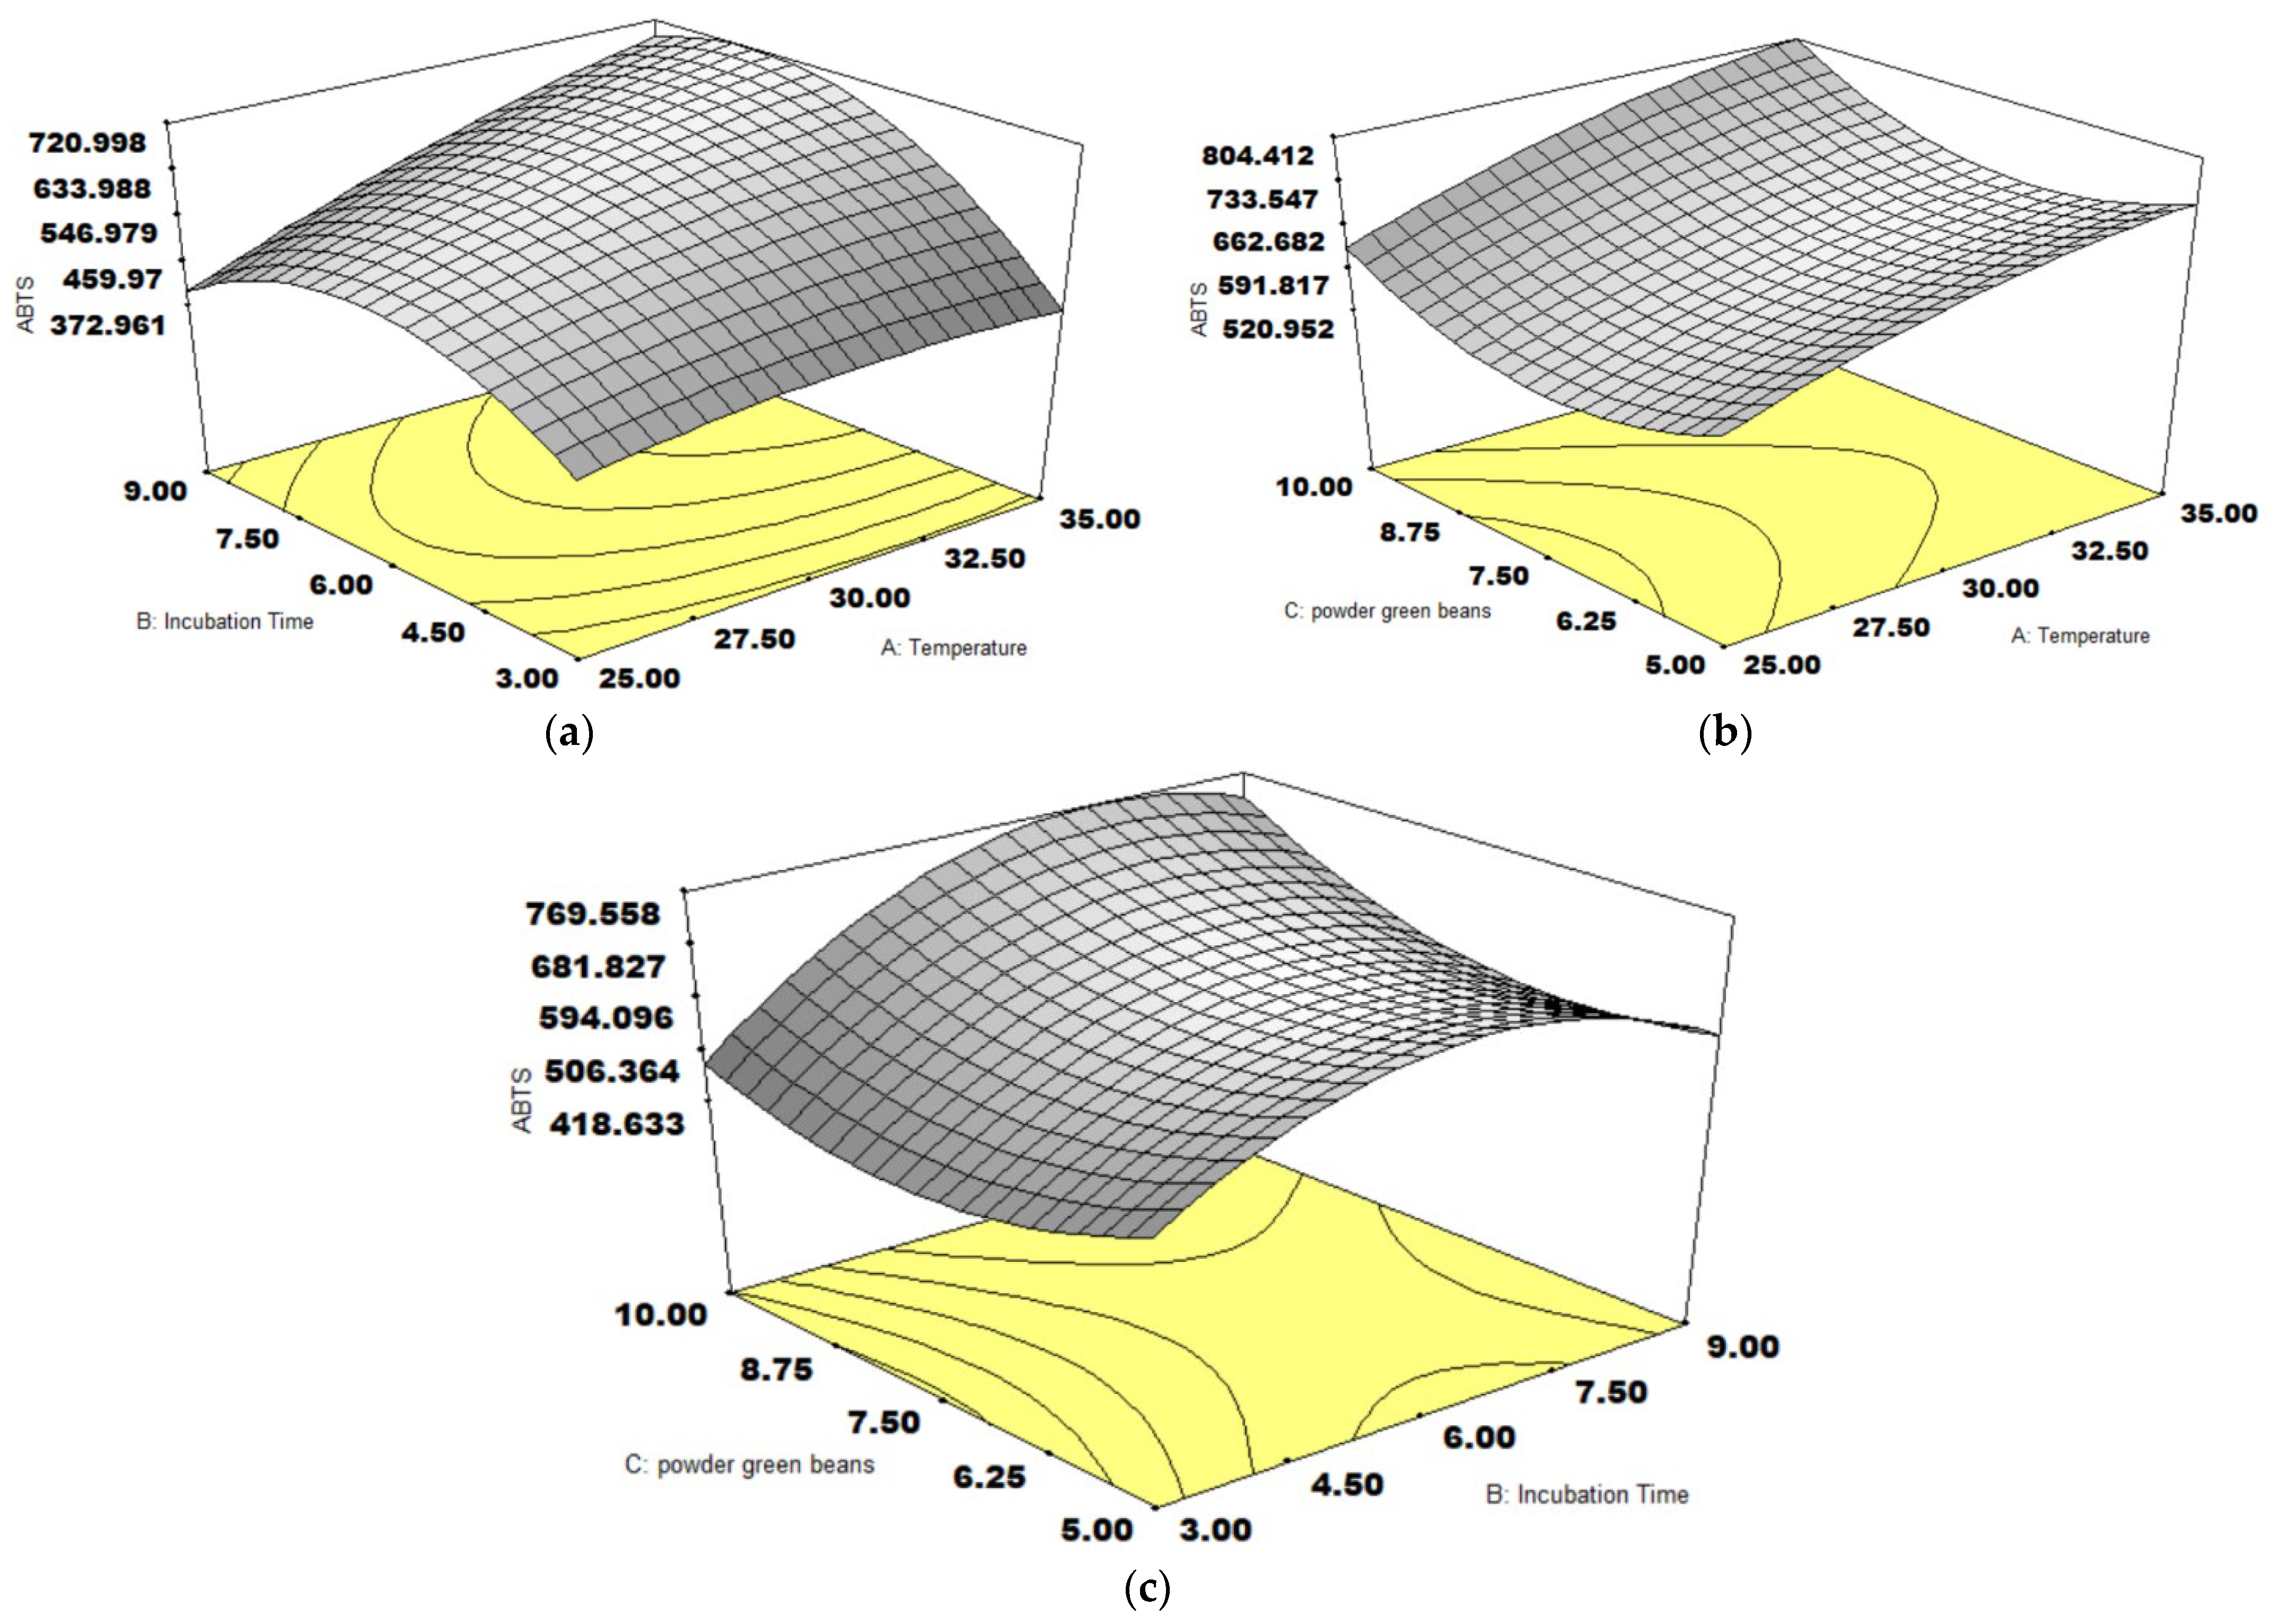
3.3. ABTS Activity
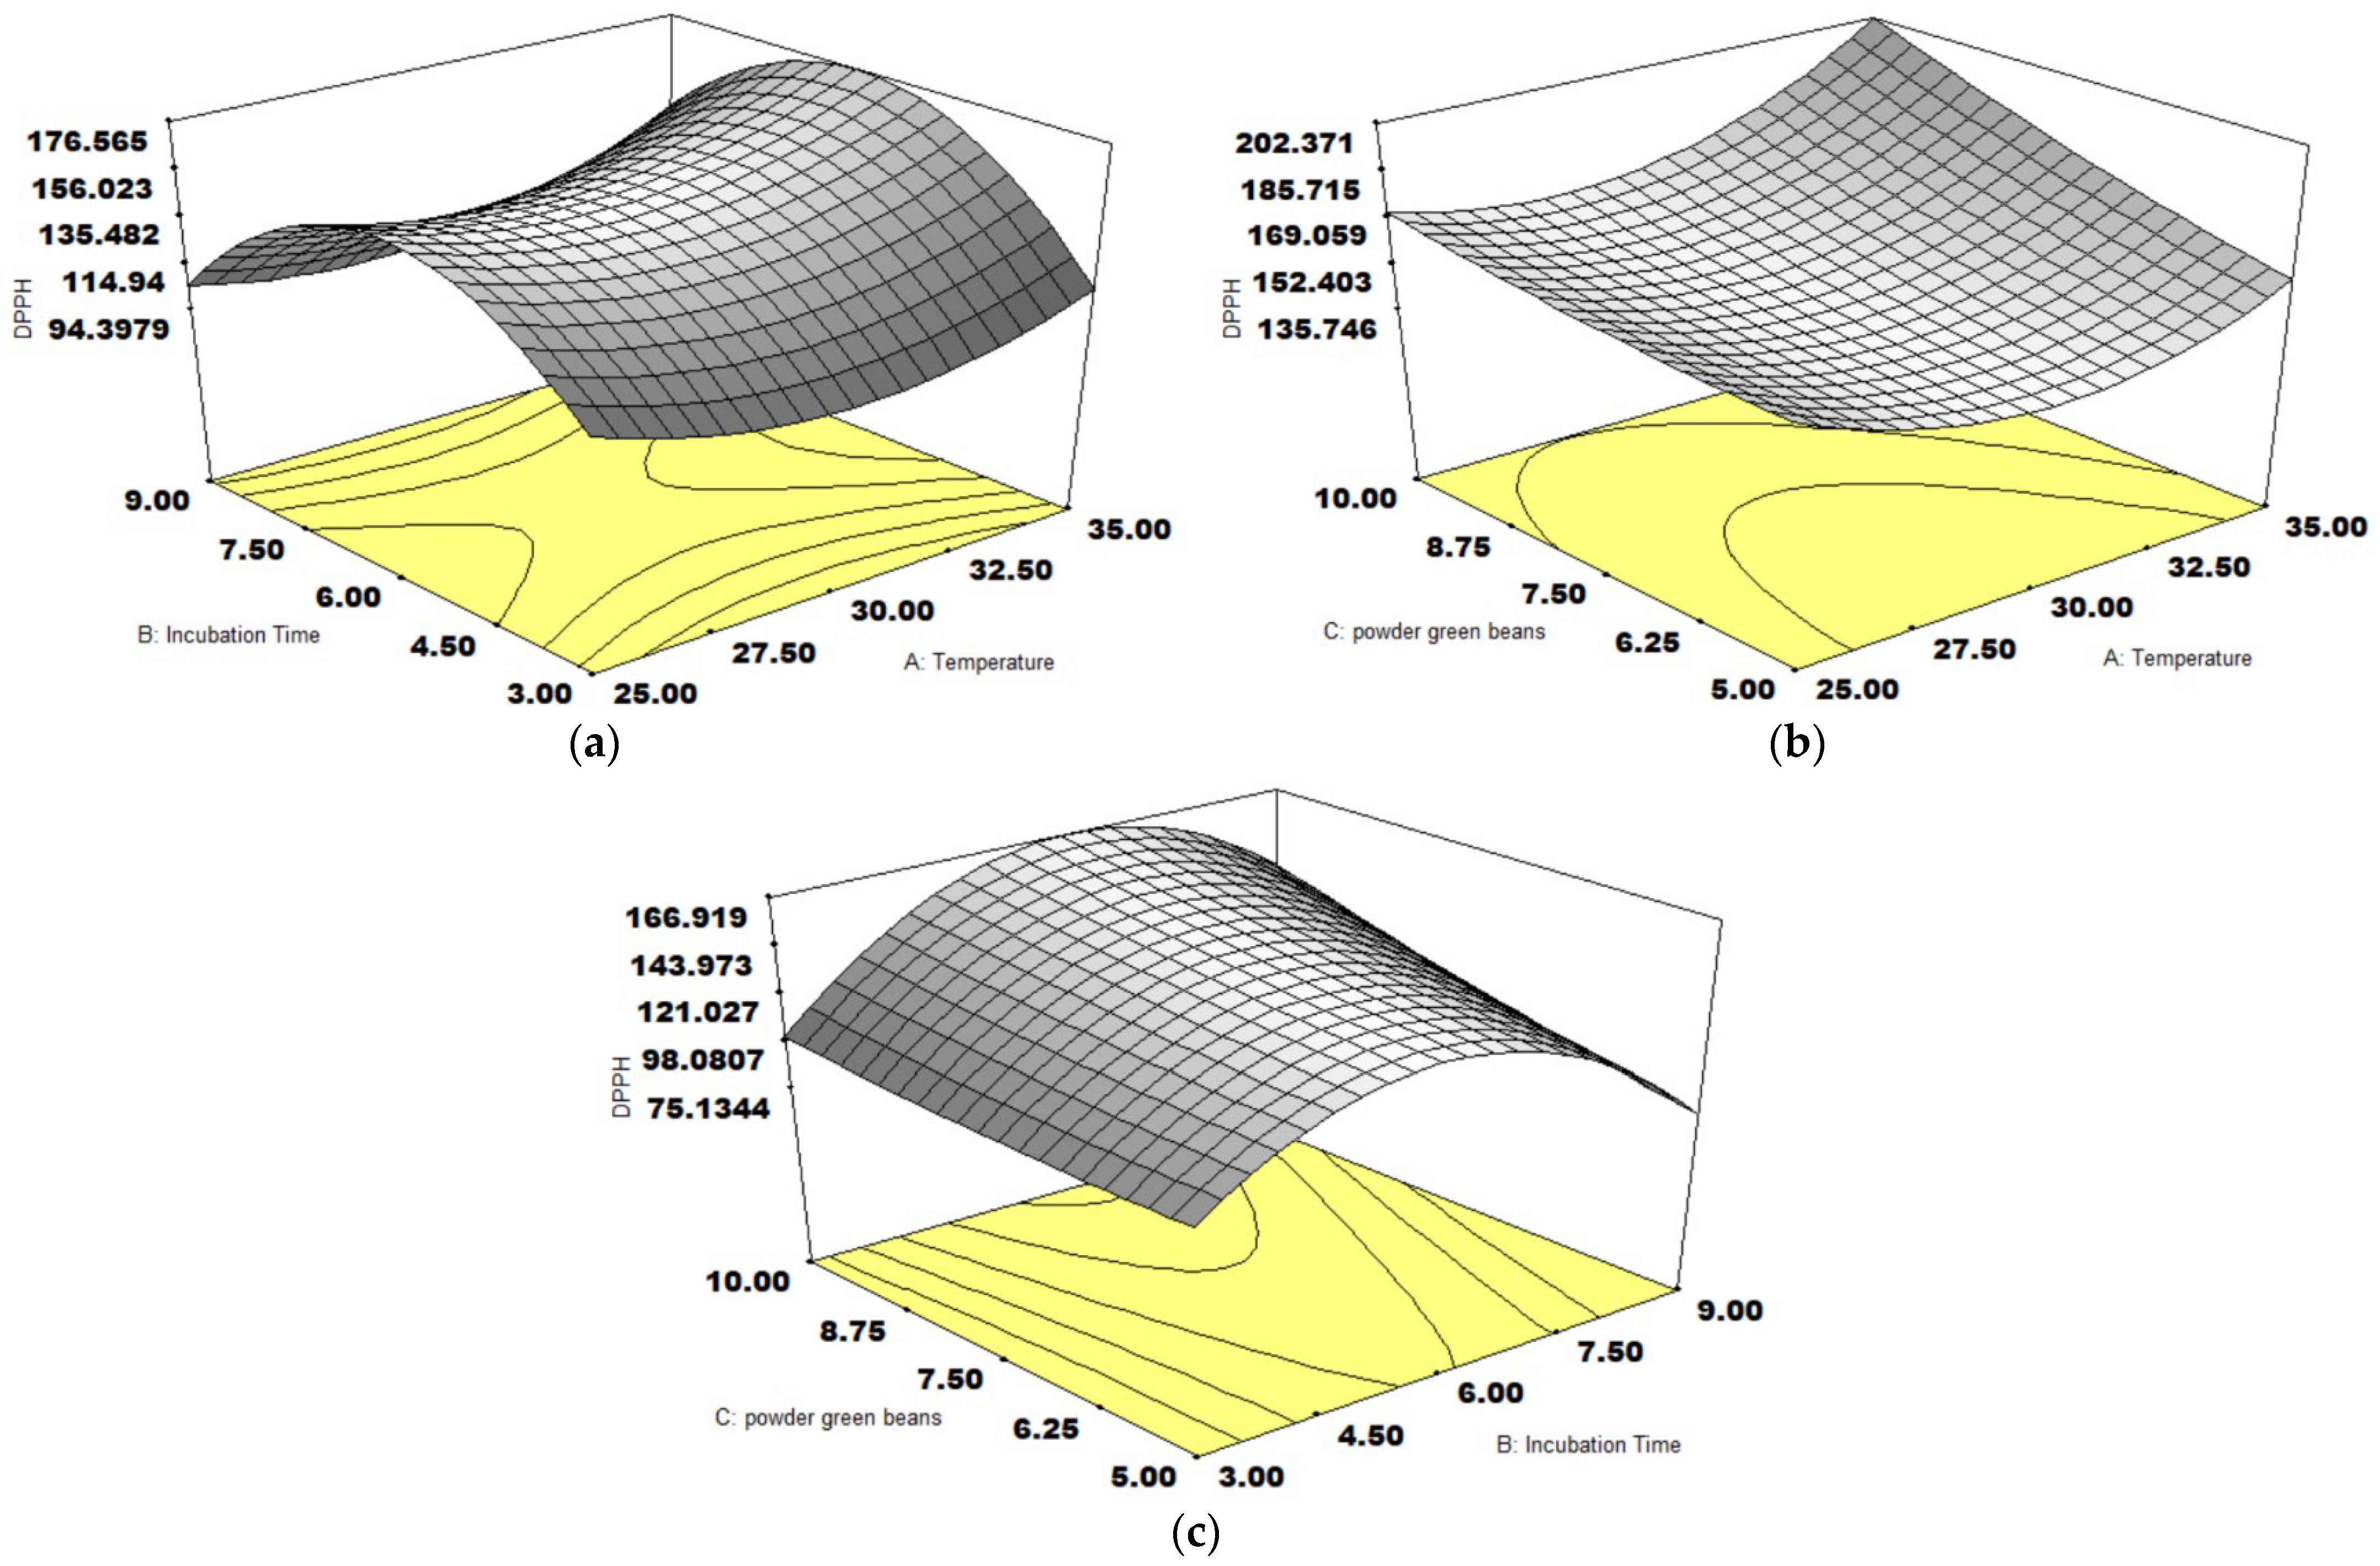
3.4. DPPH Activity
3.5. FRAP Activity
3.6. Non-Targeted Metabolites
3.7. Physical Properties of Ultrasonic-Treated Cherry Coffee
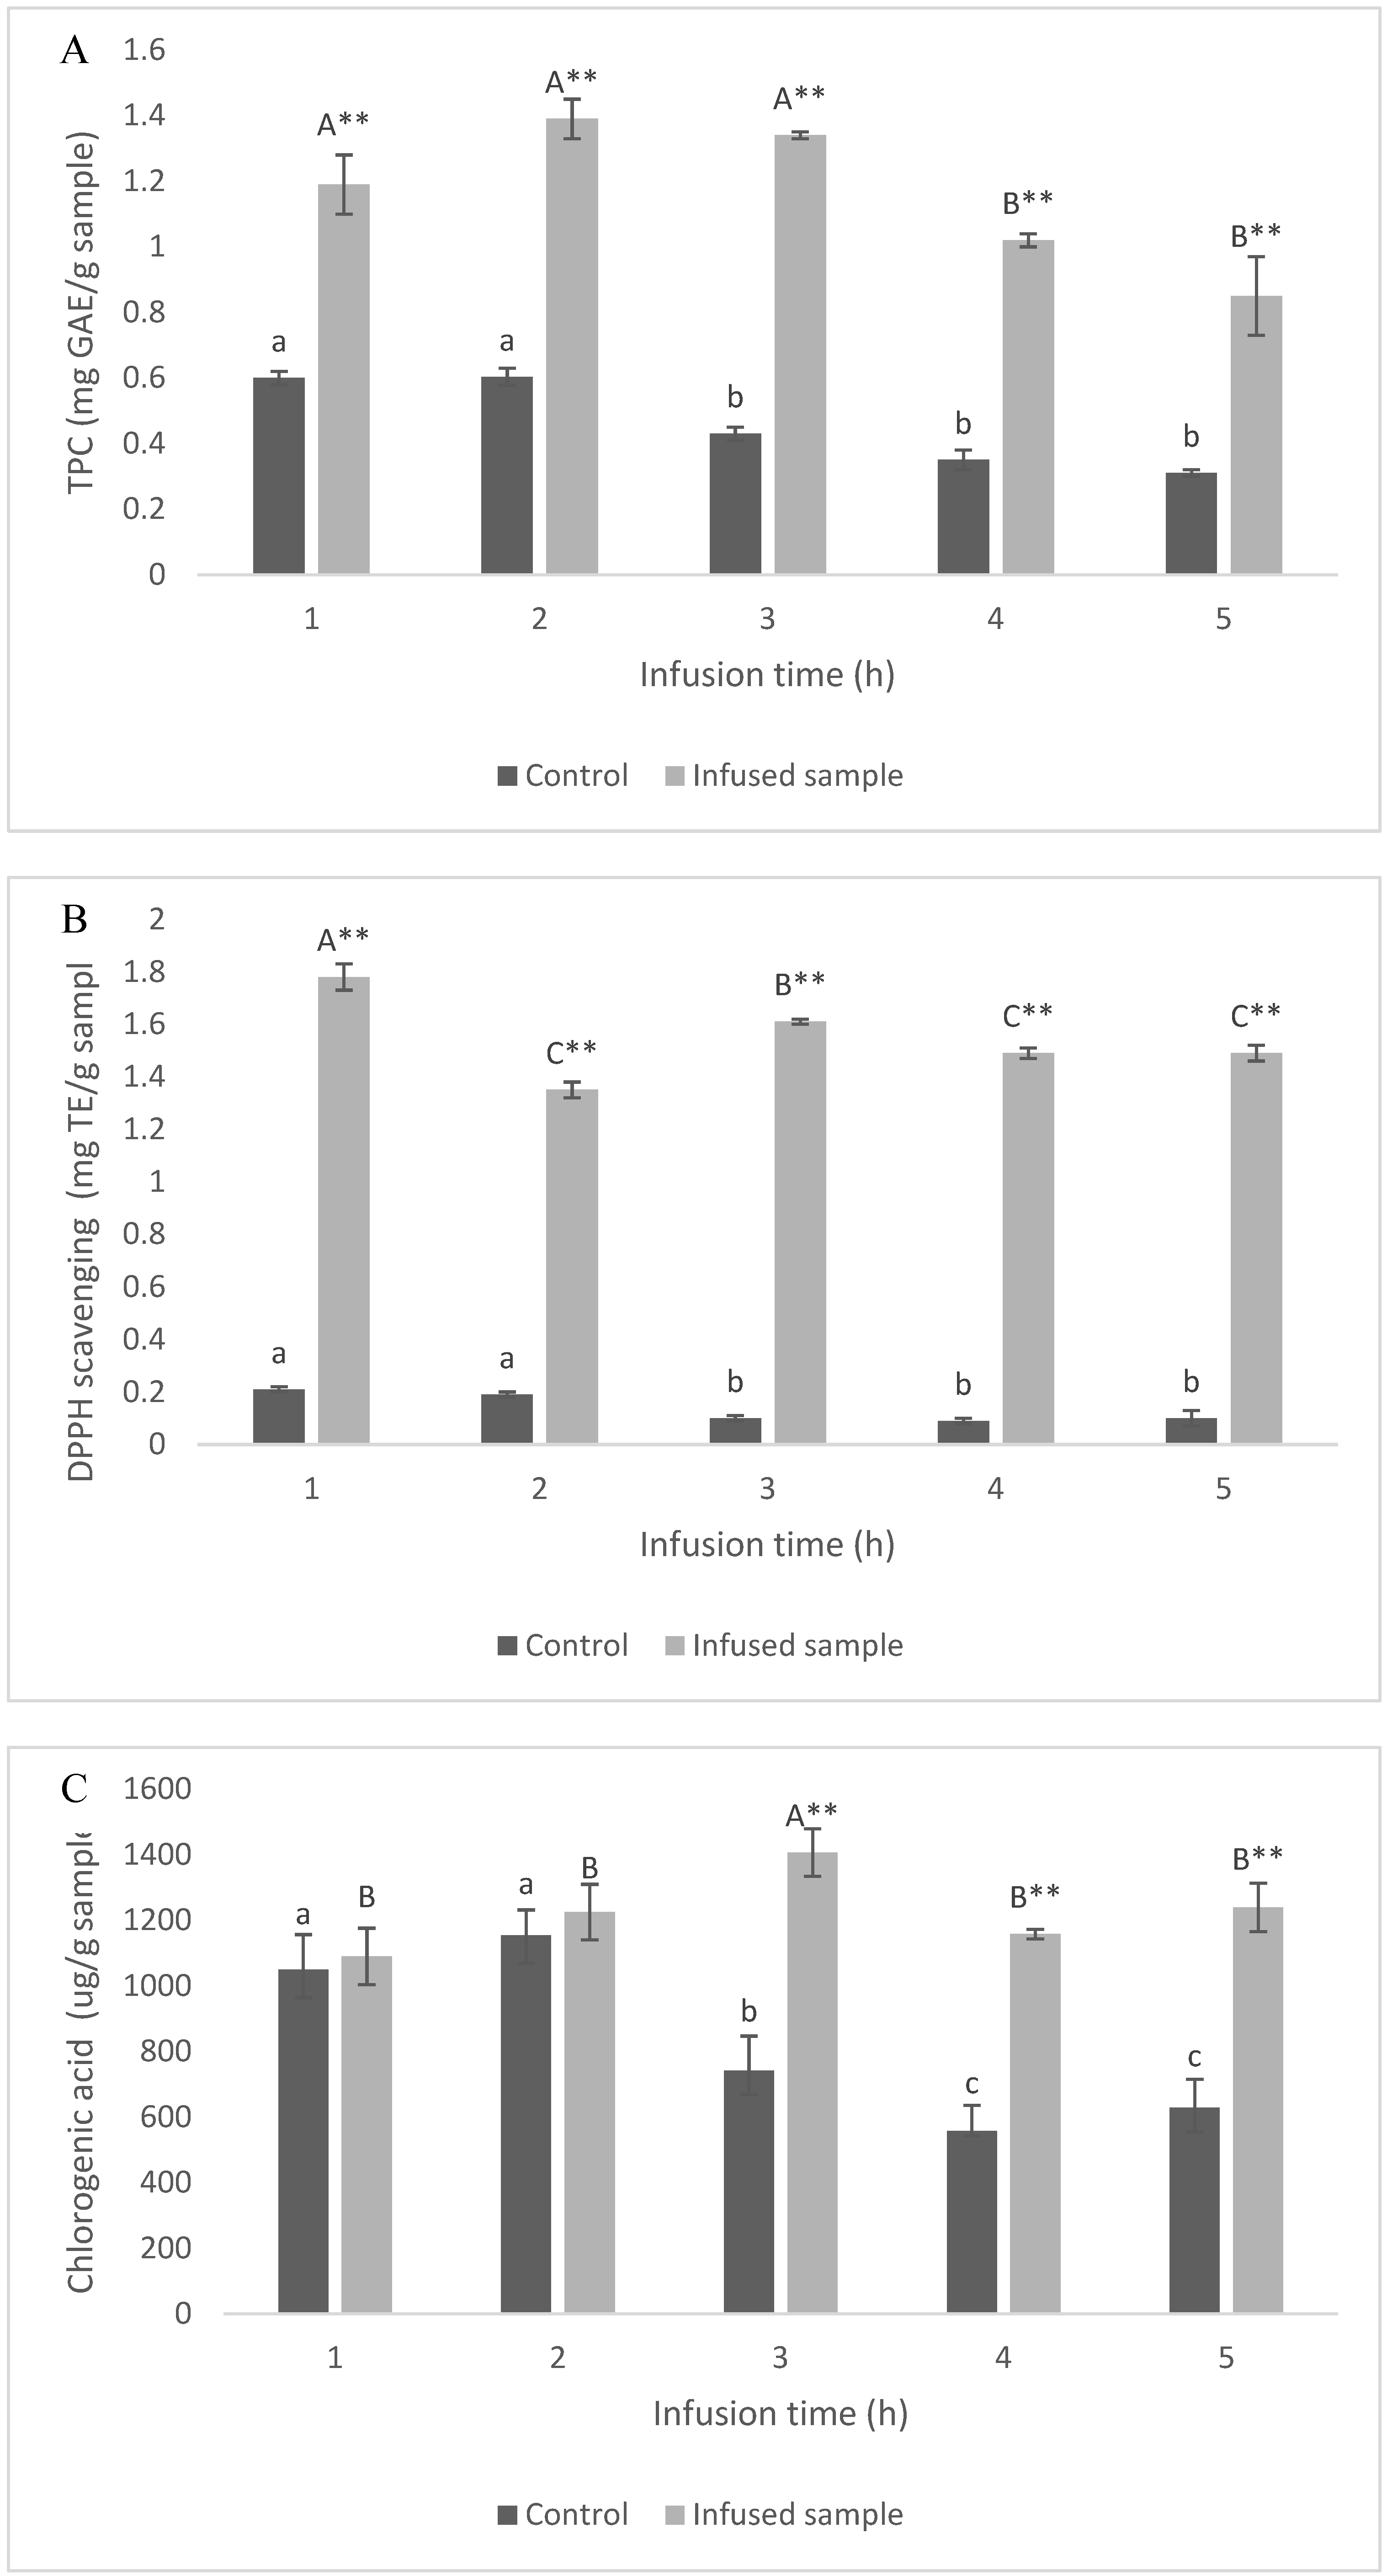
3.8. Vacuum Impregnation
4. Conclusions
Supplementary Materials
Author Contributions
Funding
Institutional Review Board Statement
Informed Consent Statement
Data Availability Statement
Conflicts of Interest
References
- Erskine, E.; Gültekin Subaşı, B.s.r.; Vahapoglu, B.; Capanoglu, E. Coffee phenolics and their interaction with other food phenolics: Antagonistic and synergistic effects. ACS Omega 2022, 7, 1595–1601. [Google Scholar]
- Mostofsky, E.; Rice, M.S.; Levitan, E.B.; Mittleman, M.A. Habitual coffee consumption and risk of heart failure: A dose-response meta-analysis. Circ. Heart Fail. 2012, 5, 401–405. [Google Scholar]
- Reis, C.E.; Dórea, J.G.; da Costa, T.H. Effects of coffee consumption on glucose metabolism: A systematic review of clinical trials. J. Tradit. Complement. Med. 2019, 9, 184–191. [Google Scholar]
- Ferreira, L.J.C.; de Souza Gomes, M.; de Oliveira, L.M.; Santos, L.D. Coffee fermentation process: A review. Food Res. Int. 2023, 169, 112793. [Google Scholar]
- de Melo Pereira, G.V.; da Silva Vale, A.; de Carvalho Neto, D.P.; Muynarsk, E.S.; Soccol, V.T.; Soccol, C.R. Lactic acid bacteria: What coffee industry should know? Curr. Opin. Food Sci. 2020, 31, 1–8. [Google Scholar] [CrossRef]
- Lee, L.W.; Cheong, M.W.; Curran, P.; Yu, B.; Liu, S.Q. Coffee fermentation and flavor–An intricate and delicate relationship. Food Chem. 2015, 185, 182–191. [Google Scholar] [CrossRef] [PubMed]
- Ludwig, I.A.; Clifford, M.N.; Lean, M.E.; Ashihara, H.; Crozier, A. Coffee: Biochemistry and potential impact on health. Food Funct. 2014, 5, 1695–1717. [Google Scholar]
- Dziki, D.; Gawlik-Dziki, U.; Pecio, Ł.; Różyło, R.; Świeca, M.; Krzykowski, A.; Rudy, S. Ground green coffee beans as a functional food supplement–Preliminary study. LWT-Food Sci. Technol. 2015, 63, 691–699. [Google Scholar]
- Espíndola, K.M.M.; Ferreira, R.G.; Narvaez, L.E.M.; Silva Rosario, A.C.R.; Da Silva, A.H.M.; Silva, A.G.B.; Vieira, A.P.O.; Monteiro, M.C. Chemical and pharmacological aspects of caffeic acid and its activity in hepatocarcinoma. Front. Oncol. 2019, 9, 541. [Google Scholar]
- Toledo, P.R.; Pezza, L.; Pezza, H.R.; Toci, A.T. Relationship between the different aspects related to coffee quality and their volatile compounds. Compr. Rev. Food Sci. Food Saf. 2016, 15, 705–719. [Google Scholar] [PubMed]
- Wang, C.; Sun, J.; Lassabliere, B.; Yu, B.; Zhao, F.; Zhao, F.; Chen, Y.; Liu, S.Q. Potential of lactic acid bacteria to modulate coffee volatiles and effect of glucose supplementation: Fermentation of green coffee beans and impact of coffee roasting. J. Sci. Food Agric. 2019, 99, 409–420. [Google Scholar] [PubMed]
- Martinez, S.J.; Bressani, A.P.P.; Dias, D.R.; Simão, J.B.P.; Schwan, R.F. Effect of bacterial and yeast starters on the formation of volatile and organic acid compounds in coffee beans and selection of flavors markers precursors during wet fermentation. Front. Microbiol. 2019, 10, 459024. [Google Scholar]
- Zhang, S.J.; De Bruyn, F.; Pothakos, V.; Contreras, G.F.; Cai, Z.; Moccand, C.; Weckx, S.; De Vuyst, L. Influence of various processing parameters on the microbial community dynamics, metabolomic profiles, and cup quality during wet coffee processing. Front. Microbiol. 2019, 10, 2621. [Google Scholar]
- Lee, L.W.; Cheong, M.W.; Curran, P.; Yu, B.; Liu, S.Q. Modulation of coffee aroma via the fermentation of green coffee beans with Rhizopus oligosporus: I. Green coffee. Food Chem. 2016, 211, 916–924. [Google Scholar]
- Lee, L.W.; Tay, G.Y.; Cheong, M.W.; Curran, P.; Yu, B.; Liu, S.Q. Modulation of the volatile and non-volatile profiles of coffee fermented with Yarrowia lipolytica: I. Green coffee. LWT 2017, 77, 225–232. [Google Scholar]
- Therdtatha, P.; Jareontanahun, N.; Chaisuwan, W.; Yakul, K.; Paemanee, A.; Manassa, A.; Moukamnerd, C.; Phimolsiripol, Y.; Sommano, S.R.; Seesuriyachan, P. Production of functional Arabica and Robusta green coffee beans: Optimization of fermentation with microbial cocktails to improve antioxidant activity and metabolomic profiles. Biocatal. Agric. Biotechnol. 2023, 53, 102869. [Google Scholar]
- Chavan, P.; Sharma, P.; Sharma, S.R.; Mittal, T.C.; Jaiswal, A.K. Application of high-intensity ultrasound to improve food processing efficiency: A review. Foods 2022, 11, 122. [Google Scholar] [CrossRef]
- Akhoundzadeh Yamchi, A.; Yeganeh, R.; Kouchakzadeh, A. Effect of ultrasonic pretreatment on drying kinetics and physio-mechanical characteristics of peach slices. J. Food Process Eng. 2022, 45, 14053. [Google Scholar]
- Singleton, V.L.; Orthofer, R.; Lamuela-Raventós, R.M. [14] Analysis of total phenols and other oxidation substrates and antioxidants by means of folin-ciocalteu reagent. In Methods in Enzymology; Elsevier: Amsterdam, The Netherlands, 1999; Volume 299, pp. 152–178. [Google Scholar]
- Marc, F.; Davin, A.; Deglene-Benbrahim, L.; Ferrand, C.; Baccaunaud, M.; Fritsch, P. Méthodes d’évaluation du potentiel antioxydant dans les aliments. Médecine/Sciences 2004, 20, 458–463. [Google Scholar]
- Arulpriya, P.; Lalitha, P.; Hemalatha, S. Antioxidant activities of the extracts of the aerial roots of Pothos aurea (Linden ex Andre). Der Pharma Chem. 2010, 2, 84–89. [Google Scholar]
- Li, D.; Li, B.; Ma, Y.; Sun, X.; Lin, Y.; Meng, X. Polyphenols, anthocyanins, and flavonoids contents and the antioxidant capacity of various cultivars of highbush and half-high blueberries. J. Food Compos. Anal. 2017, 62, 84–93. [Google Scholar] [CrossRef]
- Ballesteros, L.F.; Teixeira, J.A.; Mussatto, S.I. Chemical, functional, and structural properties of spent coffee grounds and coffee silverskin. Food Bioprocess Technol. 2014, 7, 3493–3503. [Google Scholar] [CrossRef]
- Bae, H.M.; Haile, M.; Kang, W.H. Evaluation of antioxidant, organic acid, and volatile compounds in coffee pulp wine fermented with native yeasts isolated from coffee cherries. Food Sci. Technol. Int. 2022, 28, 716–727. [Google Scholar] [CrossRef] [PubMed]
- Silva, C.F. Microbial activity during coffee fermentation. In Cocoa and Coffee Fermentations; Taylor & Francis Group: Abingdon, UK, 2014; pp. 368–423. [Google Scholar]
- Bressani, A.P.P.; Batista, N.N.; Ferreira, G.; Martinez, S.J.; Simão, J.B.P.; Dias, D.R.; Schwan, R.F. Characterization of bioactive, chemical, and sensory compounds from fermented coffees with different yeasts species. Food Res. Int. 2021, 150, 110755. [Google Scholar] [CrossRef]
- Silva, C.F.; Vilela, D.M.; de Souza Cordeiro, C.; Duarte, W.F.; Dias, D.R.; Schwan, R.F. Evaluation of a potential starter culture for enhance quality of coffee fermentation. World J. Microbiol. Biotechnol. 2013, 29, 235–247. [Google Scholar] [CrossRef]
- Myo, H.; Nantarat, N.; Khat-Udomkiri, N. Changes in bioactive compounds of coffee pulp through fermentation-based biotransformation using Lactobacillus plantarum TISTR 543 and its antioxidant activities. Fermentation 2021, 7, 292. [Google Scholar] [CrossRef]
- Amdoun, R.; Khelifi, L.; Khelifi-Slaoui, M.; Amroune, S.; Asch, M.; Assaf-Ducrocq, C.; Gontier, E. The desirability optimization methodology; a tool to predict two antagonist responses in biotechnological systems: Case of biomass growth and hyoscyamine content in elicited Datura starmonium hairy roots. Iran. J. Biotechnol. 2018, 16, e1339. [Google Scholar] [CrossRef]
- Filannino, P.; Bai, Y.; Di Cagno, R.; Gobbetti, M.; Gänzle, M.G. Metabolism of phenolic compounds by Lactobacillus spp. during fermentation of cherry juice and broccoli puree. Food Microbiol. 2015, 46, 272–279. [Google Scholar] [CrossRef]
- Li, Z.; Teng, J.; Lyu, Y.; Hu, X.; Zhao, Y.; Wang, M. Enhanced antioxidant activity for apple juice fermented with Lactobacillus plantarum ATCC14917. Molecules 2018, 24, 51. [Google Scholar] [CrossRef]
- Oktaviani, L.; Astuti, D.I.; Rosmiati, M.; Abduh, M.Y. Fermentation of coffee pulp using indigenous lactic acid bacteria with simultaneous aeration to produce cascara with a high antioxidant activity. Heliyon 2020, 6, e04462. [Google Scholar] [CrossRef]
- Liang, N.; Kitts, D.D. Antioxidant property of coffee components: Assessment of methods that define mechanisms of action. Molecules 2014, 19, 19180–19208. [Google Scholar] [CrossRef]
- Floegel, A.; Kim, D.-O.; Chung, S.-J.; Koo, S.I.; Chun, O.K. Comparison of ABTS/DPPH assays to measure antioxidant capacity in popular antioxidant-rich US foods. J. Food Compos. Anal. 2011, 24, 1043–1048. [Google Scholar]
- Wang, C.; Sun, J.; Lassabliere, B.; Yu, B.; Liu, S.Q. Coffee flavour modification through controlled fermentations of green coffee beans by Saccharomyces cerevisiae and Pichia kluyveri: Part I. Effects from individual yeasts. Food Res. Int. 2020, 136, 109588. [Google Scholar] [CrossRef] [PubMed]
- Yust, B.G.; Wilkinson, F.; Rao, N.Z. Variables affecting the extraction of antioxidants in cold and hot brew coffee: A review. Antioxidants 2023, 13, 29. [Google Scholar] [CrossRef]
- Lin, D.; Xiao, M.; Zhao, J.; Li, Z.; Xing, B.; Li, X.; Kong, M.; Li, L.; Zhang, Q.; Liu, Y.; et al. An Overview of Plant Phenolic Compounds and Their Importance in Human Nutrition and Management of Type 2 Diabetes. Molecules 2016, 21, 1374. [Google Scholar] [CrossRef]
- Meng, D.I.; Sommella, E.; Salviati, E.; Campiglia, P.; Ganguli, K.; Djebali, K.; Zhu, W.; Walker, W.A. Indole-3-lactic acid, a metabolite of tryptophan, secreted by Bifidobacterium longum subspecies infantis is anti-inflammatory in the immature intestine. Pediatr. Res. 2020, 88, 209–217. [Google Scholar] [CrossRef]
- Sun, W.; Shahrajabian, M.H. Therapeutic Potential of Phenolic Compounds in Medicinal Plants-Natural Health Products for Human Health. Molecules 2023, 28, 1845. [Google Scholar] [CrossRef]
- Zhou, L.; Wang, L.; Ding, S.; Liu, D. Impact of ultrasound-assisted processing on food structure and functionality: A review. Critical Reviews in Food Science and Nutrition 2020, 60, 3182–3198. [Google Scholar]
- García-Pérez, J.V.; Cárcel, J.A.; Benedito, J.; Mulet, A. Ultrasonics and food processing: Recent advances and future perspectives. Trends Food Sci. Technol. 2019, 88, 373–386. [Google Scholar]
- Xue, H.; Tu, Y.; Zhang, G.; Xin, X.; Hu, H.; Qiu, W.; Ruan, D.; Zhao, Y. Mechanism of ultrasound and tea polyphenol assisted ultrasound modification of egg white protein gel. Ultrasonics Sonochemistry 2021, 81, 105857. [Google Scholar] [CrossRef]
- Chen, H.; Gao, J.; Zhang, M.; Adhikari, B. Effect of ultrasonic treatment on hydration and quality properties of plant-based food materials. Food Chem. 2018, 240, 1134–1142. [Google Scholar]
- Jambrak, A.R.; Mason, T.J.; Lelas, V.; Herceg, Z.; Herceg, I.L. Effects of ultrasound treatment on physicochemical properties of food products. Ultrasonics Sonochemistry 2020, 63, 104930. [Google Scholar]
- Jadhav, H.B.; Annapure, U.S. Influence of high-intensity ultrasound processing on microstructure and quality parameters of plant-based foods. Ultrasonics Sonochemistry 2021, 74, 105575. [Google Scholar]
- Panayampadan, A.S.; Alam, M.S.; Aslam, R.; Kaur, J. Vacuum impregnation process and its potential in modifying sensory, physicochemical and nutritive characteristics of food products. Food Eng. Rev. 2022, 14, 229–256. [Google Scholar] [CrossRef]
- Mierzwa, D.; Szadzińska, J.; Gapiński, B.; Radziejewska-Kubzdela, E.; Biegańska-Marecik, R. Assessment of ultrasound-assisted vacuum impregnation as a method for modifying cranberries’ quality. Ultrasonics Sonochemistry 2022, 89, 106117. [Google Scholar]
- Durán-Castañeda, A.C.; González-Moya, S.; Sánchez-Burgos, J.A.; Sáyago-Ayerdi, S.G.; Zamora-Gasga, V.M. Applications of vacuum impregnation as a technology to incorporate functional components in vegetal matrices. Food Chem. Adv. 2024, 4, 100579. [Google Scholar]
- Santarelli, V.; Neri, L.; Moscetti, R.; Di Mattia, C.D.; Sacchetti, G.; Massantini, R.; Pittia, P. Combined use of blanching and vacuum impregnation with trehalose and green tea extract as pre-treatment to improve the quality and stability of frozen carrots. Food Bioprocess Technol. 2021, 14, 1326–1340. [Google Scholar]
- Zhao, W.; Yu, D.; Xia, W. Vacuum impregnation of chitosan coating combined with water-soluble polyphenol extracts on sensory, physical state, microbiota composition and quality of refrigerated grass carp slices. Int. J. Biol. Macromol. 2021, 193, 847–855. [Google Scholar]


| Temperature (°C) | Incubation Time (Days) | Coffee Weight (g) | TPC (µmol GAE/100 g) | ABTS (µmol TE/g) | DPPH (µmol TE/g) | FRAP (µmol TE/g) | |
|---|---|---|---|---|---|---|---|
| Predicted Optimal condition | 35 | 7.21 | 10 | 486.17 | 851.049 | 202.969 | 430.775 |
| Experimental validation | 35 | 7.21 | 10 | 480.25 ± 2.68 | 725.71 ± 0.71 | 164.15 ± 2.40 | 443.60 ± 8.19 |
| Predicted error (%) | - | - | - | −1.2 | −14.7 | −19.1 | 3.0 |
Disclaimer/Publisher’s Note: The statements, opinions and data contained in all publications are solely those of the individual author(s) and contributor(s) and not of MDPI and/or the editor(s). MDPI and/or the editor(s) disclaim responsibility for any injury to people or property resulting from any ideas, methods, instructions or products referred to in the content. |
© 2025 by the authors. Licensee MDPI, Basel, Switzerland. This article is an open access article distributed under the terms and conditions of the Creative Commons Attribution (CC BY) license (https://creativecommons.org/licenses/by/4.0/).
Share and Cite
Tangjaidee, P.; Braspaiboon, S.; Singhadechachai, N.; Phongthai, S.; Therdtatha, P.; Rachtanapun, P.; Sommano, S.R.; Seesuriyachan, P. Enhanced Bioactive Coffee Cherry: Infusion of Submerged-Fermented Green Coffee Beans via Vacuum Impregnation. Foods 2025, 14, 1165. https://doi.org/10.3390/foods14071165
Tangjaidee P, Braspaiboon S, Singhadechachai N, Phongthai S, Therdtatha P, Rachtanapun P, Sommano SR, Seesuriyachan P. Enhanced Bioactive Coffee Cherry: Infusion of Submerged-Fermented Green Coffee Beans via Vacuum Impregnation. Foods. 2025; 14(7):1165. https://doi.org/10.3390/foods14071165
Chicago/Turabian StyleTangjaidee, Pipat, Sukan Braspaiboon, Naphatsawan Singhadechachai, Suphat Phongthai, Phatthanaphong Therdtatha, Pornchai Rachtanapun, Sarana Rose Sommano, and Phisit Seesuriyachan. 2025. "Enhanced Bioactive Coffee Cherry: Infusion of Submerged-Fermented Green Coffee Beans via Vacuum Impregnation" Foods 14, no. 7: 1165. https://doi.org/10.3390/foods14071165
APA StyleTangjaidee, P., Braspaiboon, S., Singhadechachai, N., Phongthai, S., Therdtatha, P., Rachtanapun, P., Sommano, S. R., & Seesuriyachan, P. (2025). Enhanced Bioactive Coffee Cherry: Infusion of Submerged-Fermented Green Coffee Beans via Vacuum Impregnation. Foods, 14(7), 1165. https://doi.org/10.3390/foods14071165