1. Introduction
Pork serves as a valuable source of protein, fats, carbohydrates, and essential trace elements for human nutrition [
1]. However, improper storage practices can lead to microbial contamination and oxidative rancidity of lipids in pork products [
2]. Traditional preservation methods, such as curing, air-drying, or modern freezing techniques, not only influence the flavor profile but also impact the safety of pork consumption [
3]. Consequently, there is an urgent need to develop advanced preservation technologies to address these critical issues. The microencapsulation of plant EOs is thus gaining increasing attention as an environmentally friendly method to improve the quality of meat products.
Essential oils (EOs) are natural preservatives that do not have negative environmental impacts. They possess both antibacterial and antioxidant properties. Allyl isothiocyanate (AITC), an active compound found in cruciferous vegetables such as oilseed rape and kale, is a broad-spectrum bacteriostatic agent that inhibits the growth of bacteria and fungi [
4], including
Salmonella Typhimurium,
Listeria monocytogenes Scott A,
Escherichia coli O157:H7,
Pseudomonas aeruginosa,
P. fragi,
Proteus vulgaris,
Staphylococcus aureus, and
Micrococcus luteus [
5]. In 1985, mustard oil was marketed in Japan as a preservative for soy sauce. This suggests that as early as 1985, mustard oil was already being used as a preservative in food products. This fact not only strongly attests to its safety but also provides a solid foundation for the feasibility of the present study. Eugenol has demonstrated a strong inhibitory effect against bacteria such as
Lactobacillus,
Streptococcus lactis,
Salmonella Typhimurium,
Staphylococcus and fungi such as
Candida albicans, as well as exhibiting antioxidant activity [
5,
6]. Thymol has bacteriostatic properties against both Gram-positive (
Staphylococcus aureus) and Gram-negative (
Escherichia coli and
Pseudomonas aeruginosa) bacteria [
7], and it can serve as a natural alternative to synthetic fungicides [
8]. Additionally, a study showed that thymol significantly inhibited the formation of both primary (peroxide value) and secondary (TBA and thymol glycoside) oxidation products in mayonnaise, making it a promising natural antioxidant [
9]. Cuminal inhibits the growth of
Escherichia coli and
Listeria monocytogenes [
10], with higher concentrations of cuminal exhibiting stronger antioxidant effects [
11]. The antioxidant activity of plant EOs is primarily attributed to the presence of phenolic acids (such as gallic acid and protocatechuic acid), phenolic diterpenes (such as hypoglic acid and dehydroagastol), flavonoids (such as quercetin and kaempferol), and volatile oils (such as eugenol, thymol, etc.) as their active components.
Most EOs are derived from aromatic plants, and they are characterized by their distinctive odors and high volatility. As such, their encapsulation alters their physicochemical properties, such as solubility and volatility, which in turn controls their release rate and extends the duration of their activity. Spray drying is a well-established technique for microencapsulation, widely used in the food industry due to its low cost and effective encapsulation performance. The selection of wall materials is crucial in the preparation of microcapsules (mps) by spray drying. Common wall materials such as gum arabic (GA), maltodextrin, and cyclodextrin are frequently used either alone or in combination to enhance the encapsulation efficiency [
12,
13]. Cyclodextrins were first discovered by Villers in 1891, and their structure was elucidated by Frendenberg and French in 1935 [
14]. Cyclodextrin molecules have a hydrophilic outer ring, a hydrophobic inner ring, and a 3D cavity. They can encapsulate various compounds to form inclusion complexes [
15]. Among the three types of cyclodextrins α-, β-, and γ-cyclodextrins, β-cyclodextrin (β-CD) has the highest degree of crystallinity.
To achieve the combined benefits of bacteriostatic, antioxidant, and sensory enhancement, the use of composite plant essential oil microcapsule (CEO mps) is considered a viable solution. Traditionally, CEO mps are prepared by mixing various active ingredients as core materials and encapsulating them. However, due to the limited space within the microcapsule, incorporating multiple types of EOs poses a challenge. This limitation reduces the quantity of each EO that can be encapsulated, potentially affecting its efficacy. To address this issue, a novel microencapsulated structure was designed in this study, using gum arabic and β-CD as wall materials. The uniqueness of these wall materials lies in the embedding of AITC molecules within the cavity of each β-CD molecule, forming inclusion complexes. In this configuration, AITC primarily exerts bacterial inhibitory effects, while a composite of three plant EOs—eugenol, thymol, and cuminal—serves as the core material, providing antioxidant and additional antibacterial effects. Upon application, AITC is released from the outer wall of the mps, while the CEO is gradually released from the core, ensuring optimal antioxidant and bacteriostatic effects. It is noteworthy that the use of an AITC&β-CD inclusion complex as a wall material in mps has not been previously reported. Our experimental results demonstrate that mps with this structure exhibit significant preservation effects and show promising potential for practical applications.
2. Materials and Methods
2.1. Materials
Qualified chilled fresh pork [the part of the animal used was pork tenderloin (M. psoas major), free of bone, visible connective tissue, and external fat] was purchased from Dahongmen Meat Tiantongyuan Store, Changping District, Beijing, China and stored under refrigeration at 4 ± 1 °C. Eugenol (99.9%), cuminal (99.8%), thymol (99.8%), gum arabic (GA) powder, and β-cyclodextrin (β-CD, ≥99.0%) were obtained from Maclean’s (Shanghai, China). Allyl isothiocyanate (AITC, ≥95%) and 2-thiobarbituric acid (98.0%) were purchased from Sigma-Aldrich (St. Louis, MO, USA), while trichloroacetic acid (TCA) was sourced from Tianjin Guangfu Fine Chemical Research Institute (Tianjin, China). Anhydrous ethanol, n-hexane, and other organic solvents were of analytical grade and purchased from Beijing Chemical Industry Co., Ltd. (Beijing, China).
2.2. Preparation of AITC & β-CD Inclusion Complexes
An electronic balance was used to accurately weigh 4.00 g of β-CD into a beaker, to which 100 mL of deionized water was added. The beaker was then placed in a constant-temperature magnetic stirrer, and the solution was stirred under a water bath at 60 °C and 500 rpm. Once all the β-CD had dissolved, the solution was removed and cooled to 45 °C, where it remained clear and transparent. Concurrently, 4 mL of allyl isothiocyanate (AITC) and 4 mL of anhydrous ethanol were added to the same beaker using a pipette, ensuring thorough dissolution of the AITC in ethanol. The resulting AITC–ethanol solution was slowly and uniformly added to the β-CD solution using a burette, while stirring continuously at 900 rpm for 4 h. During this process, the solution gradually became turbid, indicating the formation of the β-CD-AITC inclusion complex. The solution was then filtered, and the filter cake was washed alternately with anhydrous ethanol and deionized water at 45 °C to remove any unassociated AITC and β-CD. The resulting white AITC & β-CD inclusion solid was then dried under vacuum at 60 °C for 12 h to obtain the dried AITC & β-CD inclusion powder, which was subsequently used as the wall material for the CEO mps. After measurement, in AITC&β-CD, the content of AITC was 72.97 μL/g. In order to obtain a larger amount of AITC and β-CD at one time, the amounts of the required experimental materials can be proportionally increased according to the needs during the experimental process.
2.3. Preparation of CEO Mps
A total of 50.00 g of AITC & β-CD inclusion powder was accurately weighed using an electronic balance, along with an equal mass of gum arabic (GA) powder, which were both placed into the same beaker to serve as the wall material. The total required mass of core material was calculated to be 10.00 g, based on the mass ratio of core material to wall material (1:10). According to the total content of the wall material and the core material (23%), and the moisture content (77%), the required amount of deionized water was calculated to be 368.30 g. The measured deionized water was added to the beaker containing the wall material powder. Next, 2.40 g of Tween-80, at a 0.5% mass ratio, was added to the mixture, and the solution was stirred well with a magnetic stirrer at 550 rpm at room temperature to prepare the wall material solution. To make up for the limitations of AITC in terms of its antioxidant capacity, we introduced three essential oils. Through the comparative experiment on the antioxidant effects of single plant essential oils and compound plant essential oils, as well as the proportion optimization experiment, we finally determined the mass ratio of eugenol, cuminal, and thymol to be 2:2:1. Eugenol (4.00 g), cuminal (4.00 g), and thymol (2.00 g) were weighed according to the mass ratio of 2:2:1 and added to a separate beaker. The mixture was stirred with a glass rod to obtain the composite essential oil (CEO), which was then poured into the beaker containing the wall material solution. The mixture was homogenized at 800 rpm for 6 min using a homogenizer (Model 3000, DREMEL, Mexico City, Mexico) to obtain a homogeneous and stable emulsion. The microencapsulated emulsion was then spray-dried using a spray dryer (SD-BASIC, Labplant, Hunmanby, NY, UK). The spray dryer was set with an inlet air temperature of 180 °C and an outlet air temperature of 80 °C. Once the device reached the set temperature and stabilized, the peristaltic pump was activated, with the flow rate set to 15 mL/min. The emulsion was spray-dried, and the resulting composite EO microcapsule powder was collected and stored in a sealed bag under refrigeration for subsequent experiments. After measurement, in the CEO mps, the content of eugenol was 83.59 μL/g, the content of cuminal was 83.59 μL/g, and the content of thymol was 71.65 μL/g. The amounts of the required experimental materials can be proportionally increased according to need during the experimental process.
2.4. Determination of AITC & β-CD Inclusion Characterization
2.4.1. Determination of Nuclear Magnetic Resonance (NMR) Hydrogen Spectra of Inclusions
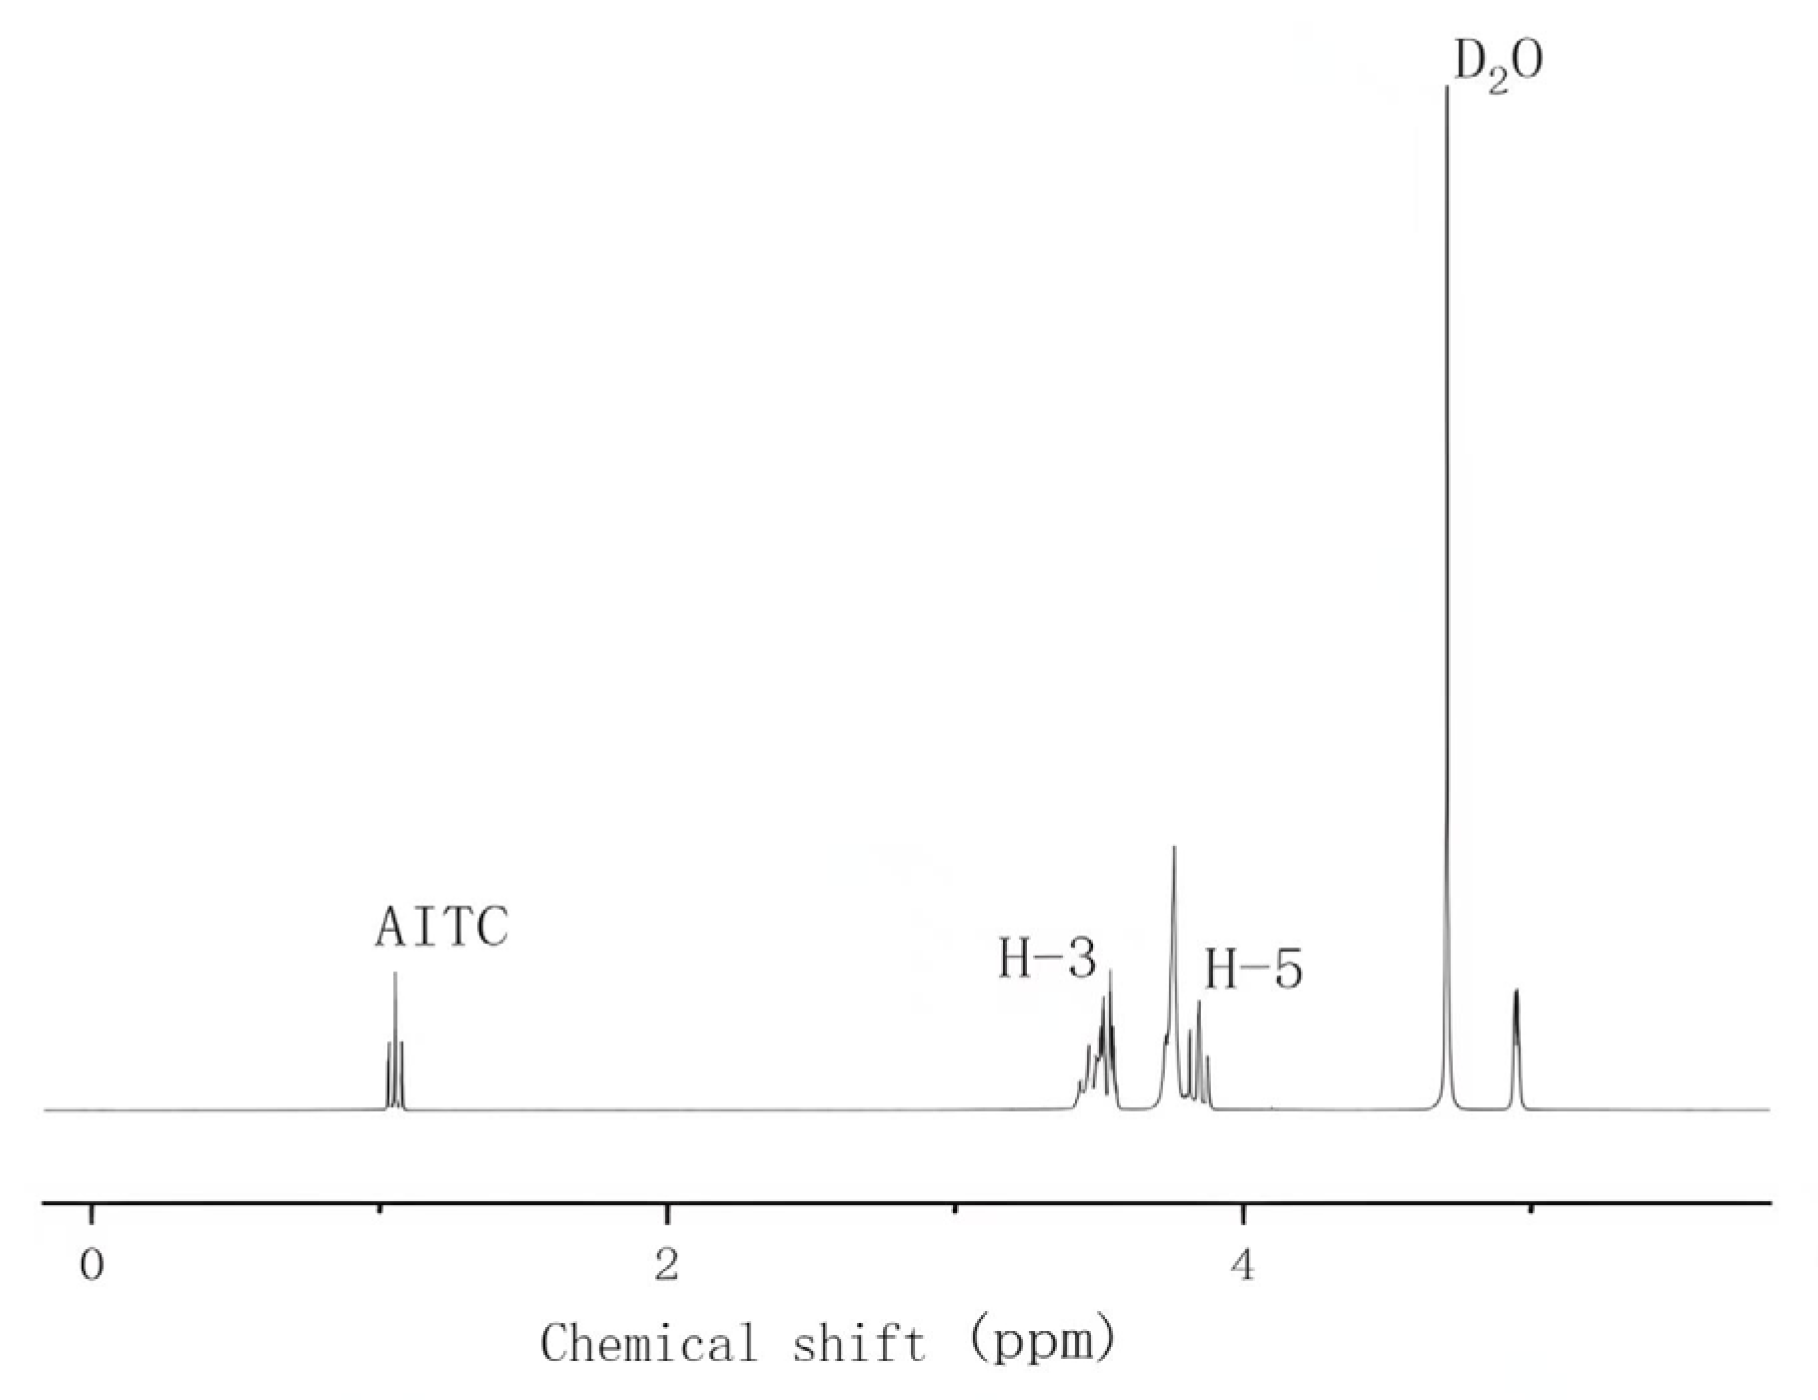
Five milligrams of β-CD or AITC & β-CD inclusion complexes were dissolved in 0.5 mL of deuterated water (D2O). The samples were then analyzed using a 1H NMR spectrometer (NW30VFE, Bruker, Karlsruhe, Germany) to determine the chemical shifts of the H-3 and H-5 peaks in β-CD. The ratio of the area of the H-3 peak to the area of the AITC peak was also calculated. Chemical shifts were referenced to the residual solvent peaks, and all values were reported in parts per million (ppm).
2.4.2. Determination of Inclusion Infrared Spectra (FTIR)
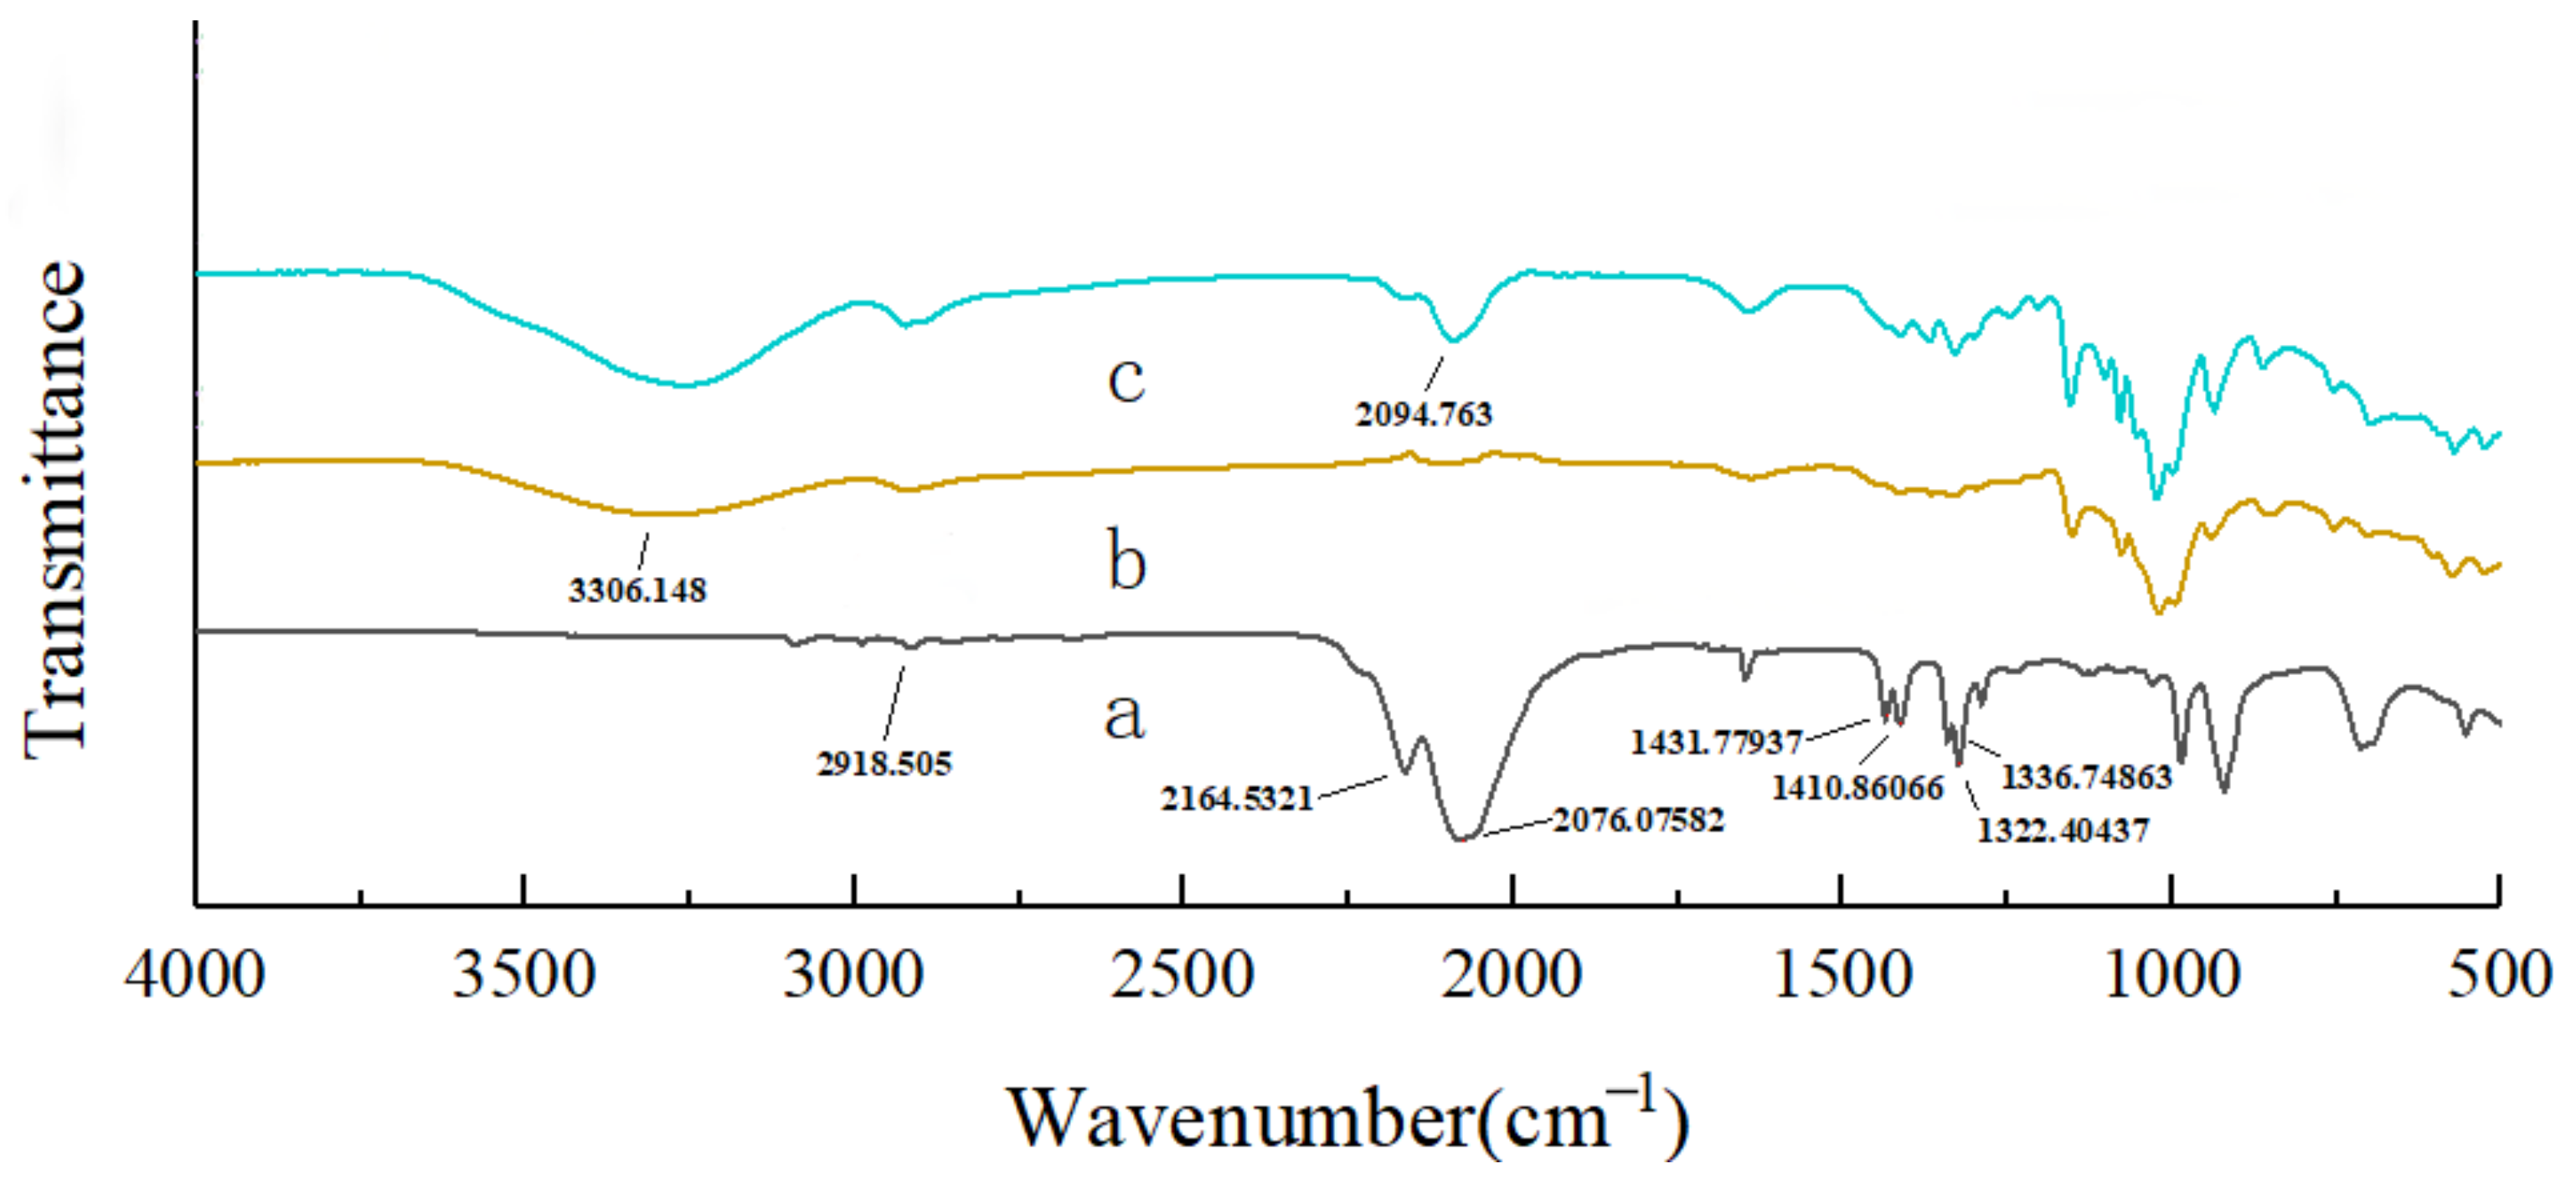
The molecular structures and chemical compositions of the β-CD and AITC & β-CD inclusion complexes were analyzed using an infrared spectrometer (Carry 630, Agilent Technologies Inc., Santa Clara, CA, USA). It was determined by using a Fourier Transform Infrared Spectrometer in the transmission mode. The analytical parameters were set with a resolution of 16 cm−1, 64 scans, and a scanning range from 4000 cm−1 to 500 cm−1. The AITC, β-CD, and AITC & β-CD samples were separately placed in the optical path and scanned for their infrared spectra.
2.4.3. Determination of Encapsulation Constant
The encapsulation constant serves to quantitatively characterize the binding strength between the host and the guest during the formation of inclusion complexes. It mirrors the degree of difficulty in the formation of inclusion complexes and is customarily denoted by “K”. Its calculation method typically involves leveraging the stoichiometric relationships of the equilibrium reaction, in conjunction with thermodynamic data such as enthalpy change and entropy change, for the computation. The determination of the inclusion constant was carried out at five different temperatures: 20 °C, 25 °C, 30 °C, 35 °C, and 40 °C. In cases where the AITC content is excessive, the encapsulation process between β-CD and AITC in solution will reach equilibrium, which can be described by the following equation:
The inclusion constant, i.e., the equilibrium constant, is given by
In the formula, “
a” represents the total concentration of β-CD, “
b” represents the total concentration of allyl isothiocyanate (AITC), and “
x” represents the concentration of the AITC & β-CD inclusion complex. If the initial concentration of AITC is denoted as “
S₀”, then when AITC is encapsulated by β-CD and its solubility increases, the total concentration of AITC in solution is given by “
b = S₀ + x”. This value is substituted into Equation (1), which leads to the equation
By further manipulation, Equation (2) can be simplified to obtain the equation
Based on the relationship in Equation (3), a compatibility curve is constructed by plotting the concentration of AITC against the concentration of β-CD. If the compatibility curve forms a straight line, it suggests a 1:1 encapsulation ratio between AITC and β-CD. The encapsulation constant can then be determined from the slope of this line, as represented in the equation
2.4.4. Determination of Thermodynamic Parameters of the Encapsulation Process
Using the van’t Hoff isothermal equation
and the Gibbs free energy equation
, a functional relationship among the Gibbs free energy change (Δ
G), enthalpy change (Δ
H), and entropy change (Δ
S) can be derived:
Here, “R” represents the gas constant, with a standard value of approximately 8.314 J/(mol∙K), and “T” refers to the absolute temperature.
From the equation, it is evident that there is a linear relationship between 1/T and lnK. By performing linear regression on the equilibrium constants and temperatures of the AITC and β-CD inclusion process, the thermodynamic parameters ΔH, ΔS, and ΔG of the inclusion process can be calculated from the slopes and intercepts of the resulting straight lines. Based on this data, the thermodynamic behavior of the process can be derived.
2.5. Characterization of CEO Mps
2.5.1. Determination of Infrared Spectra (FTIR) of Mps
The molecular structures and chemical compositions of the compounds were analyzed using an infrared spectrometer (Carry 630, Agilent, Agilent Technologies Inc., Santa Clara, CA, USA). It was determined by using a Fourier Transform Infrared Spectrometer in the transmission mode. The analytical parameters were set to a resolution of 16 cm−1, 64 scans, and a scanning range from 4000 cm−1 to 500 cm−1. CEO mps, β-CD, gum arabic (GA), eugenol, thymol, cuminal, and AITC compounds were placed separately in the optical path and scanned.
2.5.2. Characterization of Mps by Scanning Electron Microscopy (SEM)
The morphology of the microcapsules was observed using a high-resolution scanning electron microscope with field emission (COXEM EM-30PLUS, COXEM Corporation, Daejeon, Republic of Korea). The microcapsules were deposited on a silicon plate in the wet state and subsequently freeze-dried. The silicon plate containing the microcapsules and other materials was attached to a short brass tube using double-sided tape. A thin layer of gold was sprayed onto the samples, which were then examined using the scanning electron microscope.
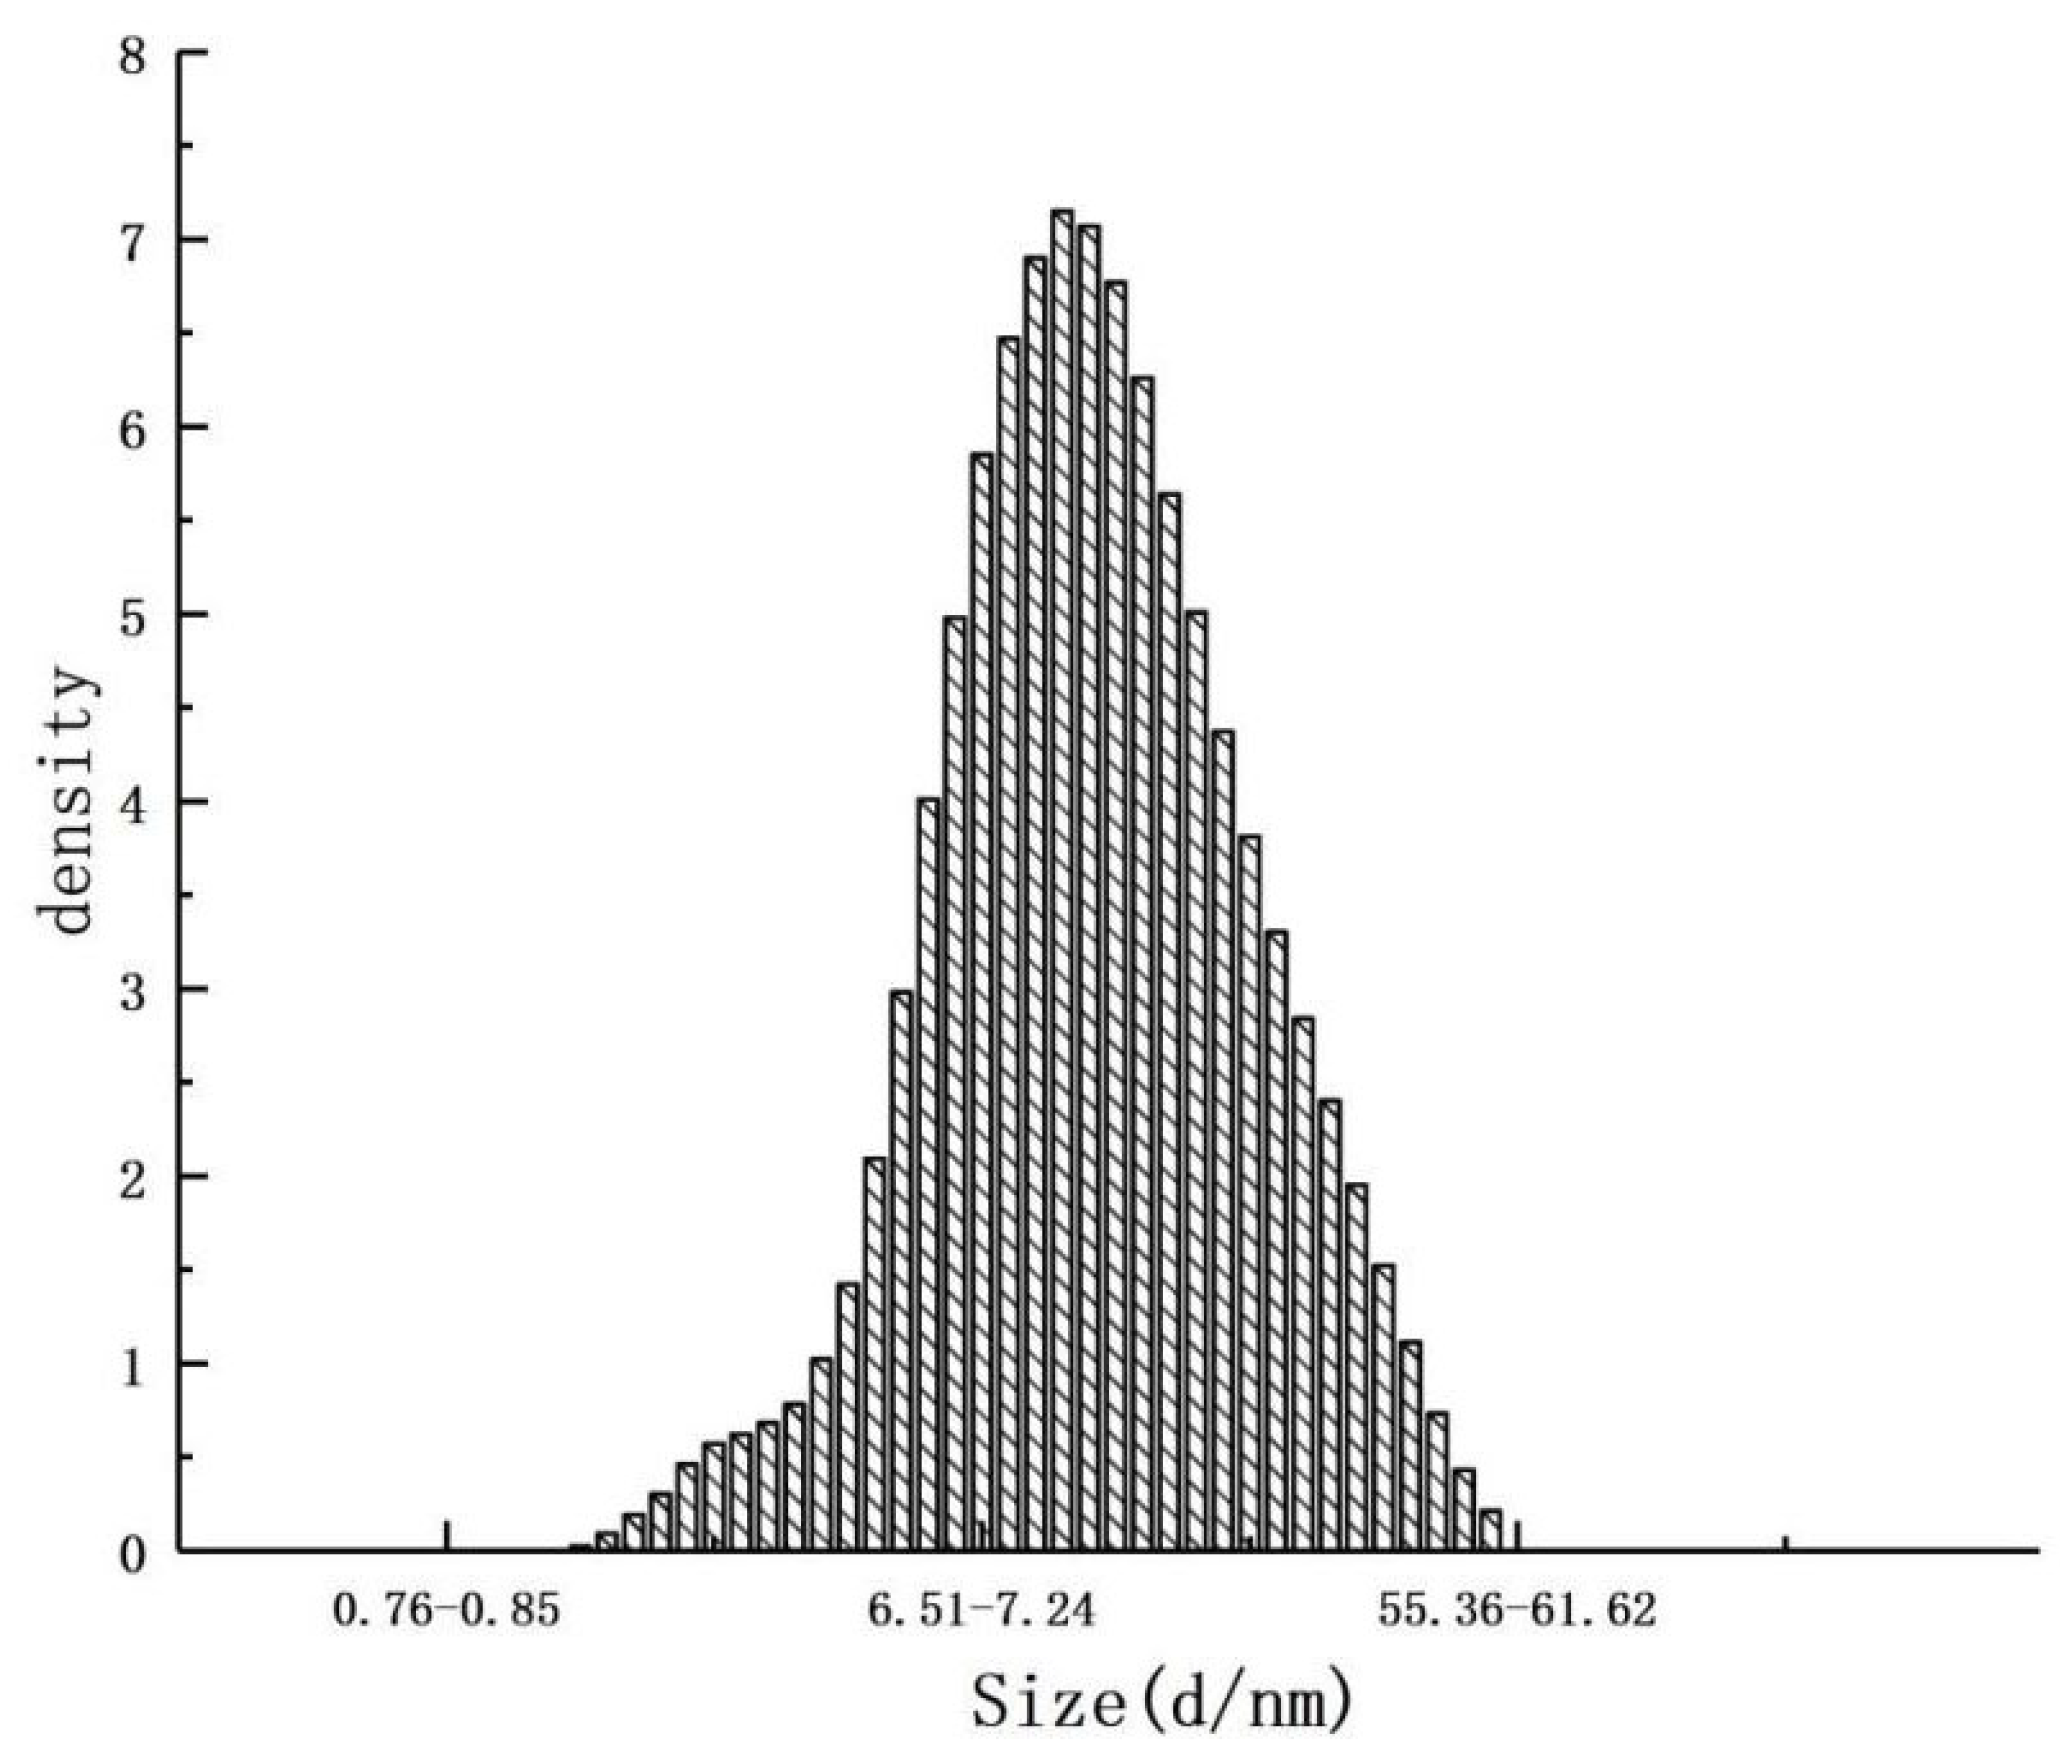
2.5.3. Determination of Microcapsule Size Distribution
The particle size distribution of the microcapsules was measured using a laser particle size analyzer (BT-9300H, Shandong Nexter Analytical Instruments Co., Ltd., Jinan, Shandong, China). The microcapsules were thoroughly mixed, and a portion was randomly selected and added to a beaker containing a specific concentration of petroleum ether. The beaker was sonicated for 1 min to ensure proper dispersion. The resulting solution was then transferred to a specialized cuvette for laser particle size scanning.
2.6. Gas Chromatography–Mass Spectrometry (GC/MS) Analysis
(1) Instrument Configuration
The substances within CEO mps, as well as their release rates, were analyzed using a GC/MS system [
16]. The samples were dissolved in hexane for analysis, employing an Agilent GC/MS instrument, which included a G6501-CTC autosampler, an Agilent 7890 gas chromatograph, an Agilent 5975C mass spectrometer detector (equipped with an electron bombardment ionization source), and an Agilent DB-5MS capillary column (30 m × 0.250 mm).
(2) Chromatographic Conditions
The column temperature was initially set at 40 °C for 8 min, then ramped to 210 °C at a rate of 25 °C per min, and maintained at 210 °C for an additional 5 min. The column chamber was held at 40 °C, with helium used as the carrier gas at a flow rate of 1 mL/min. The split ratio was set at 30:1. The inlet temperature was maintained at 200 °C, while the detector temperature was set to 280 °C. A solvent delay of 4 min was applied for compound identification.
(3) Mass Spectrometry Conditions
The analysis was performed using an Electron Ionization (EI) ion source. The ion source temperature was set to 270 °C, and the interface temperature was also maintained at 270 °C. The ionization voltage was 70 eV, with an emission current of 6 μA and an electron multiplication voltage of 900 V.
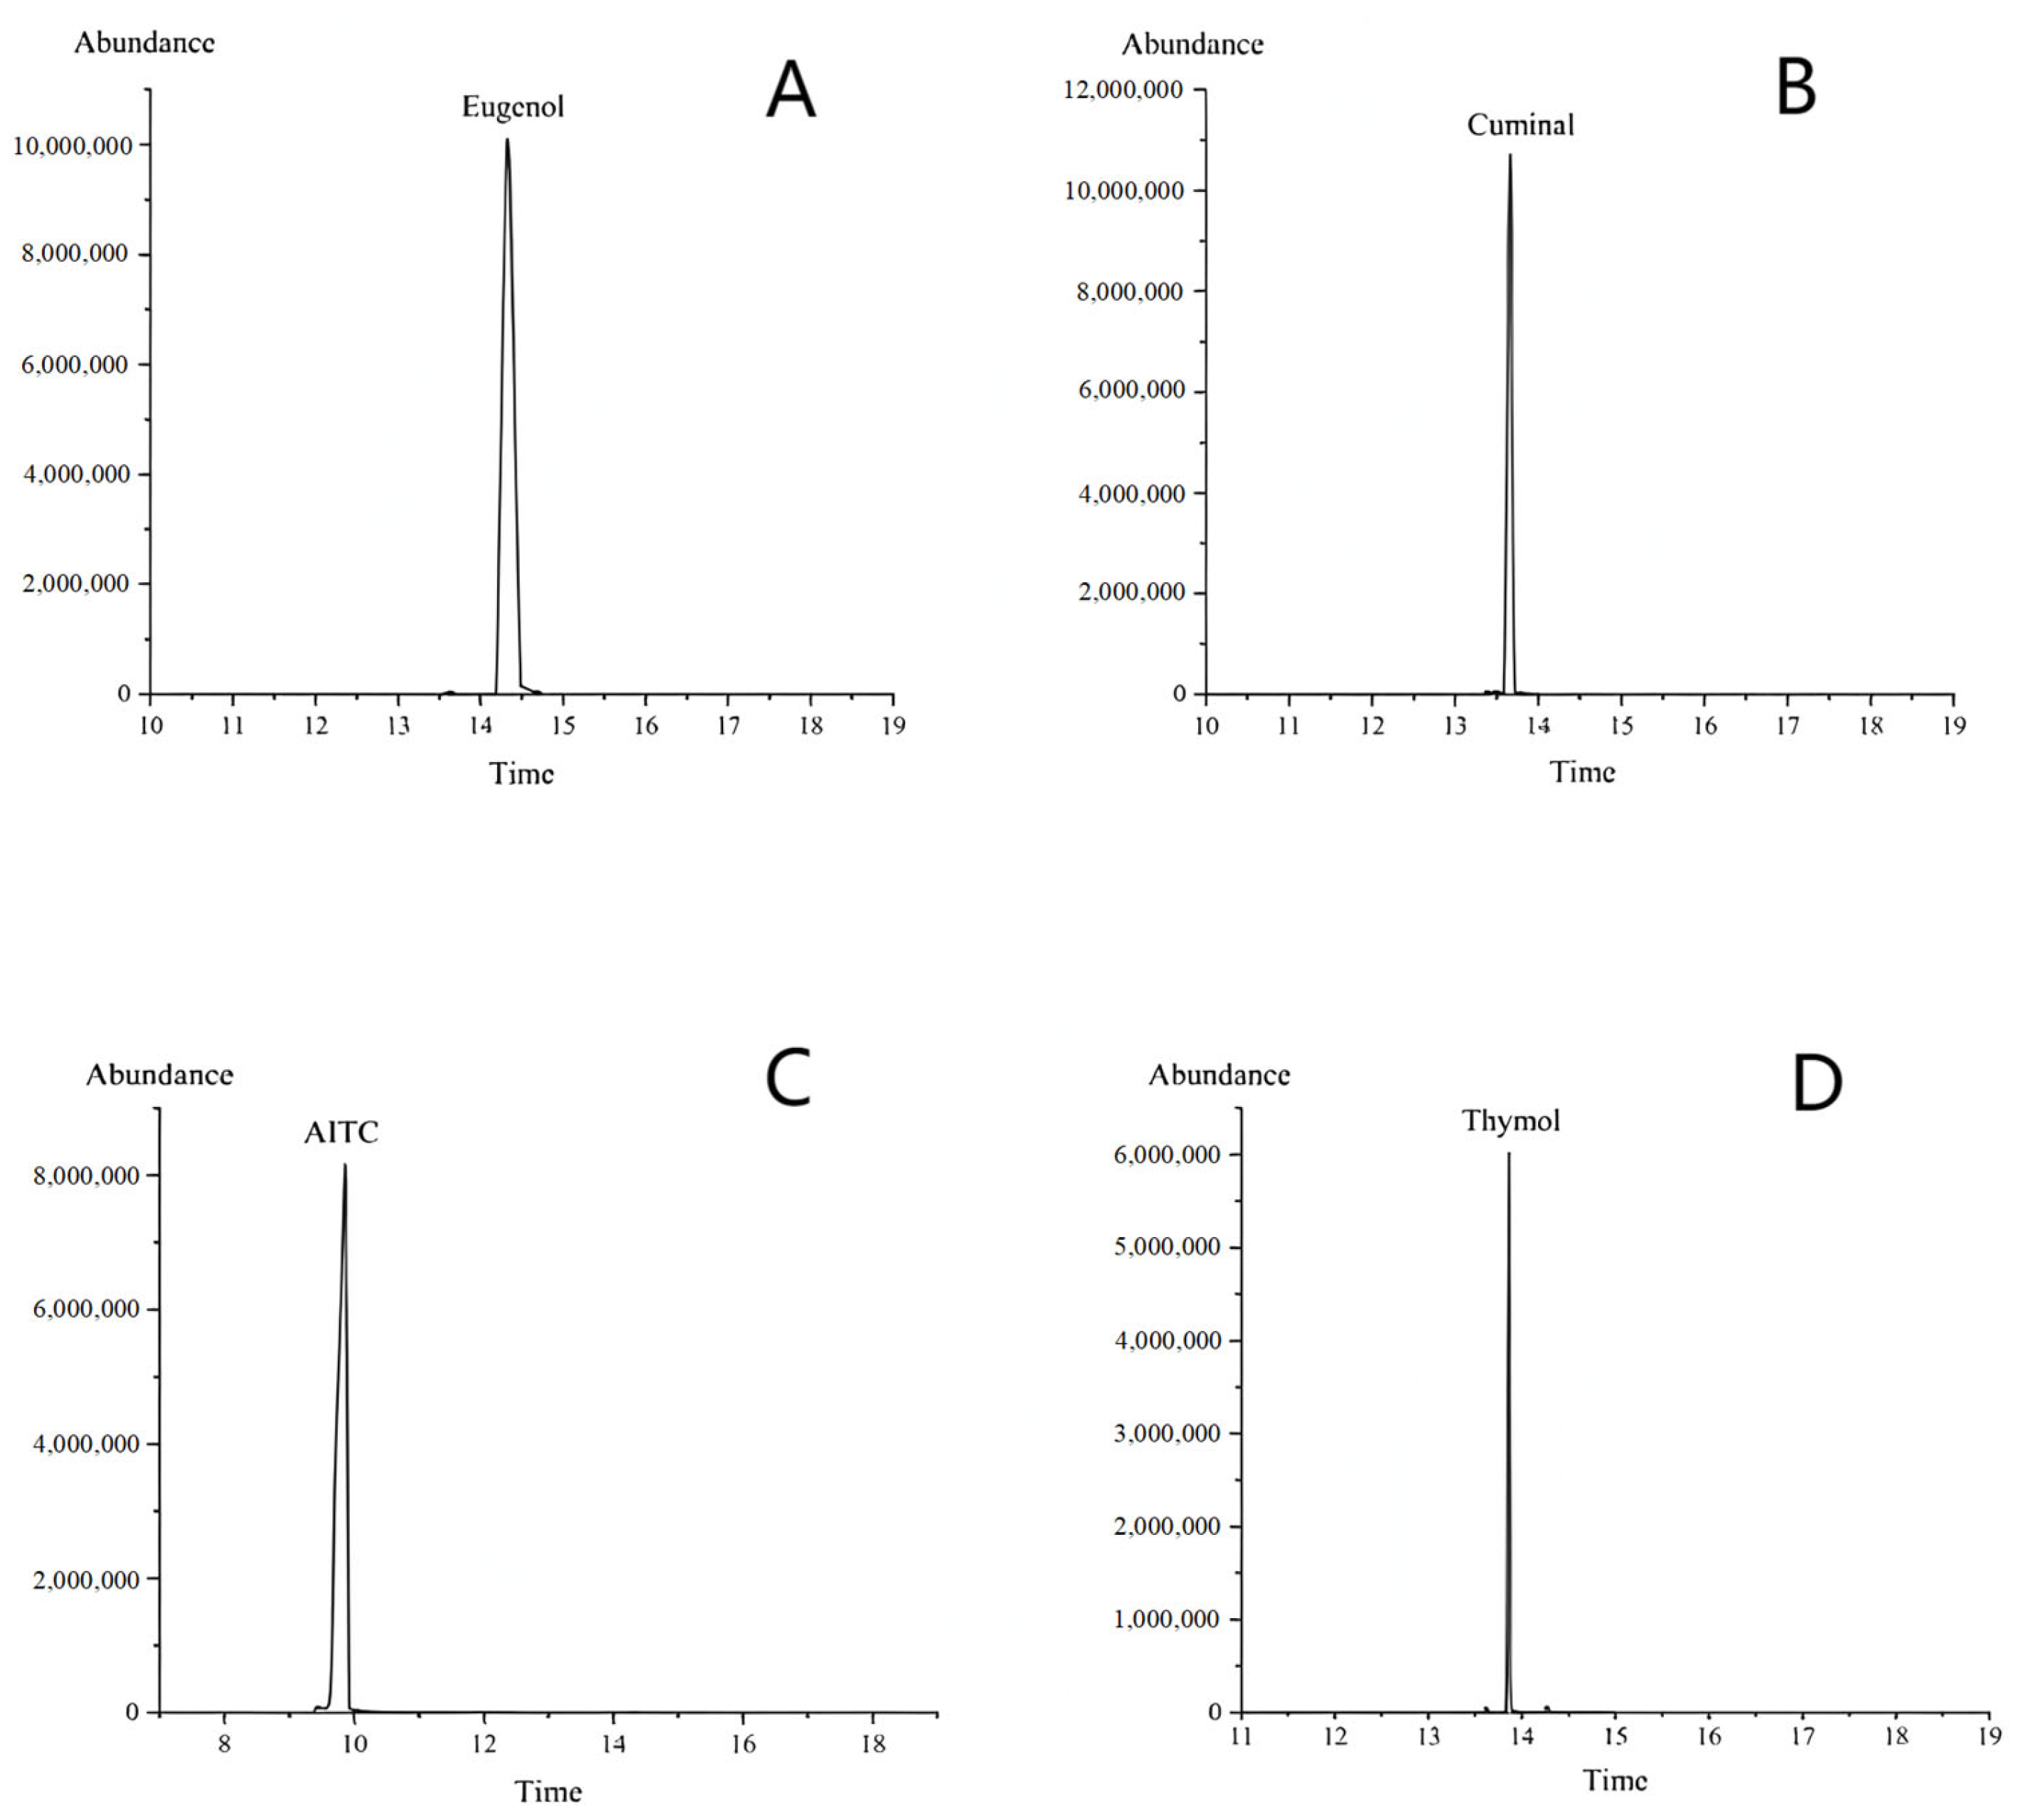
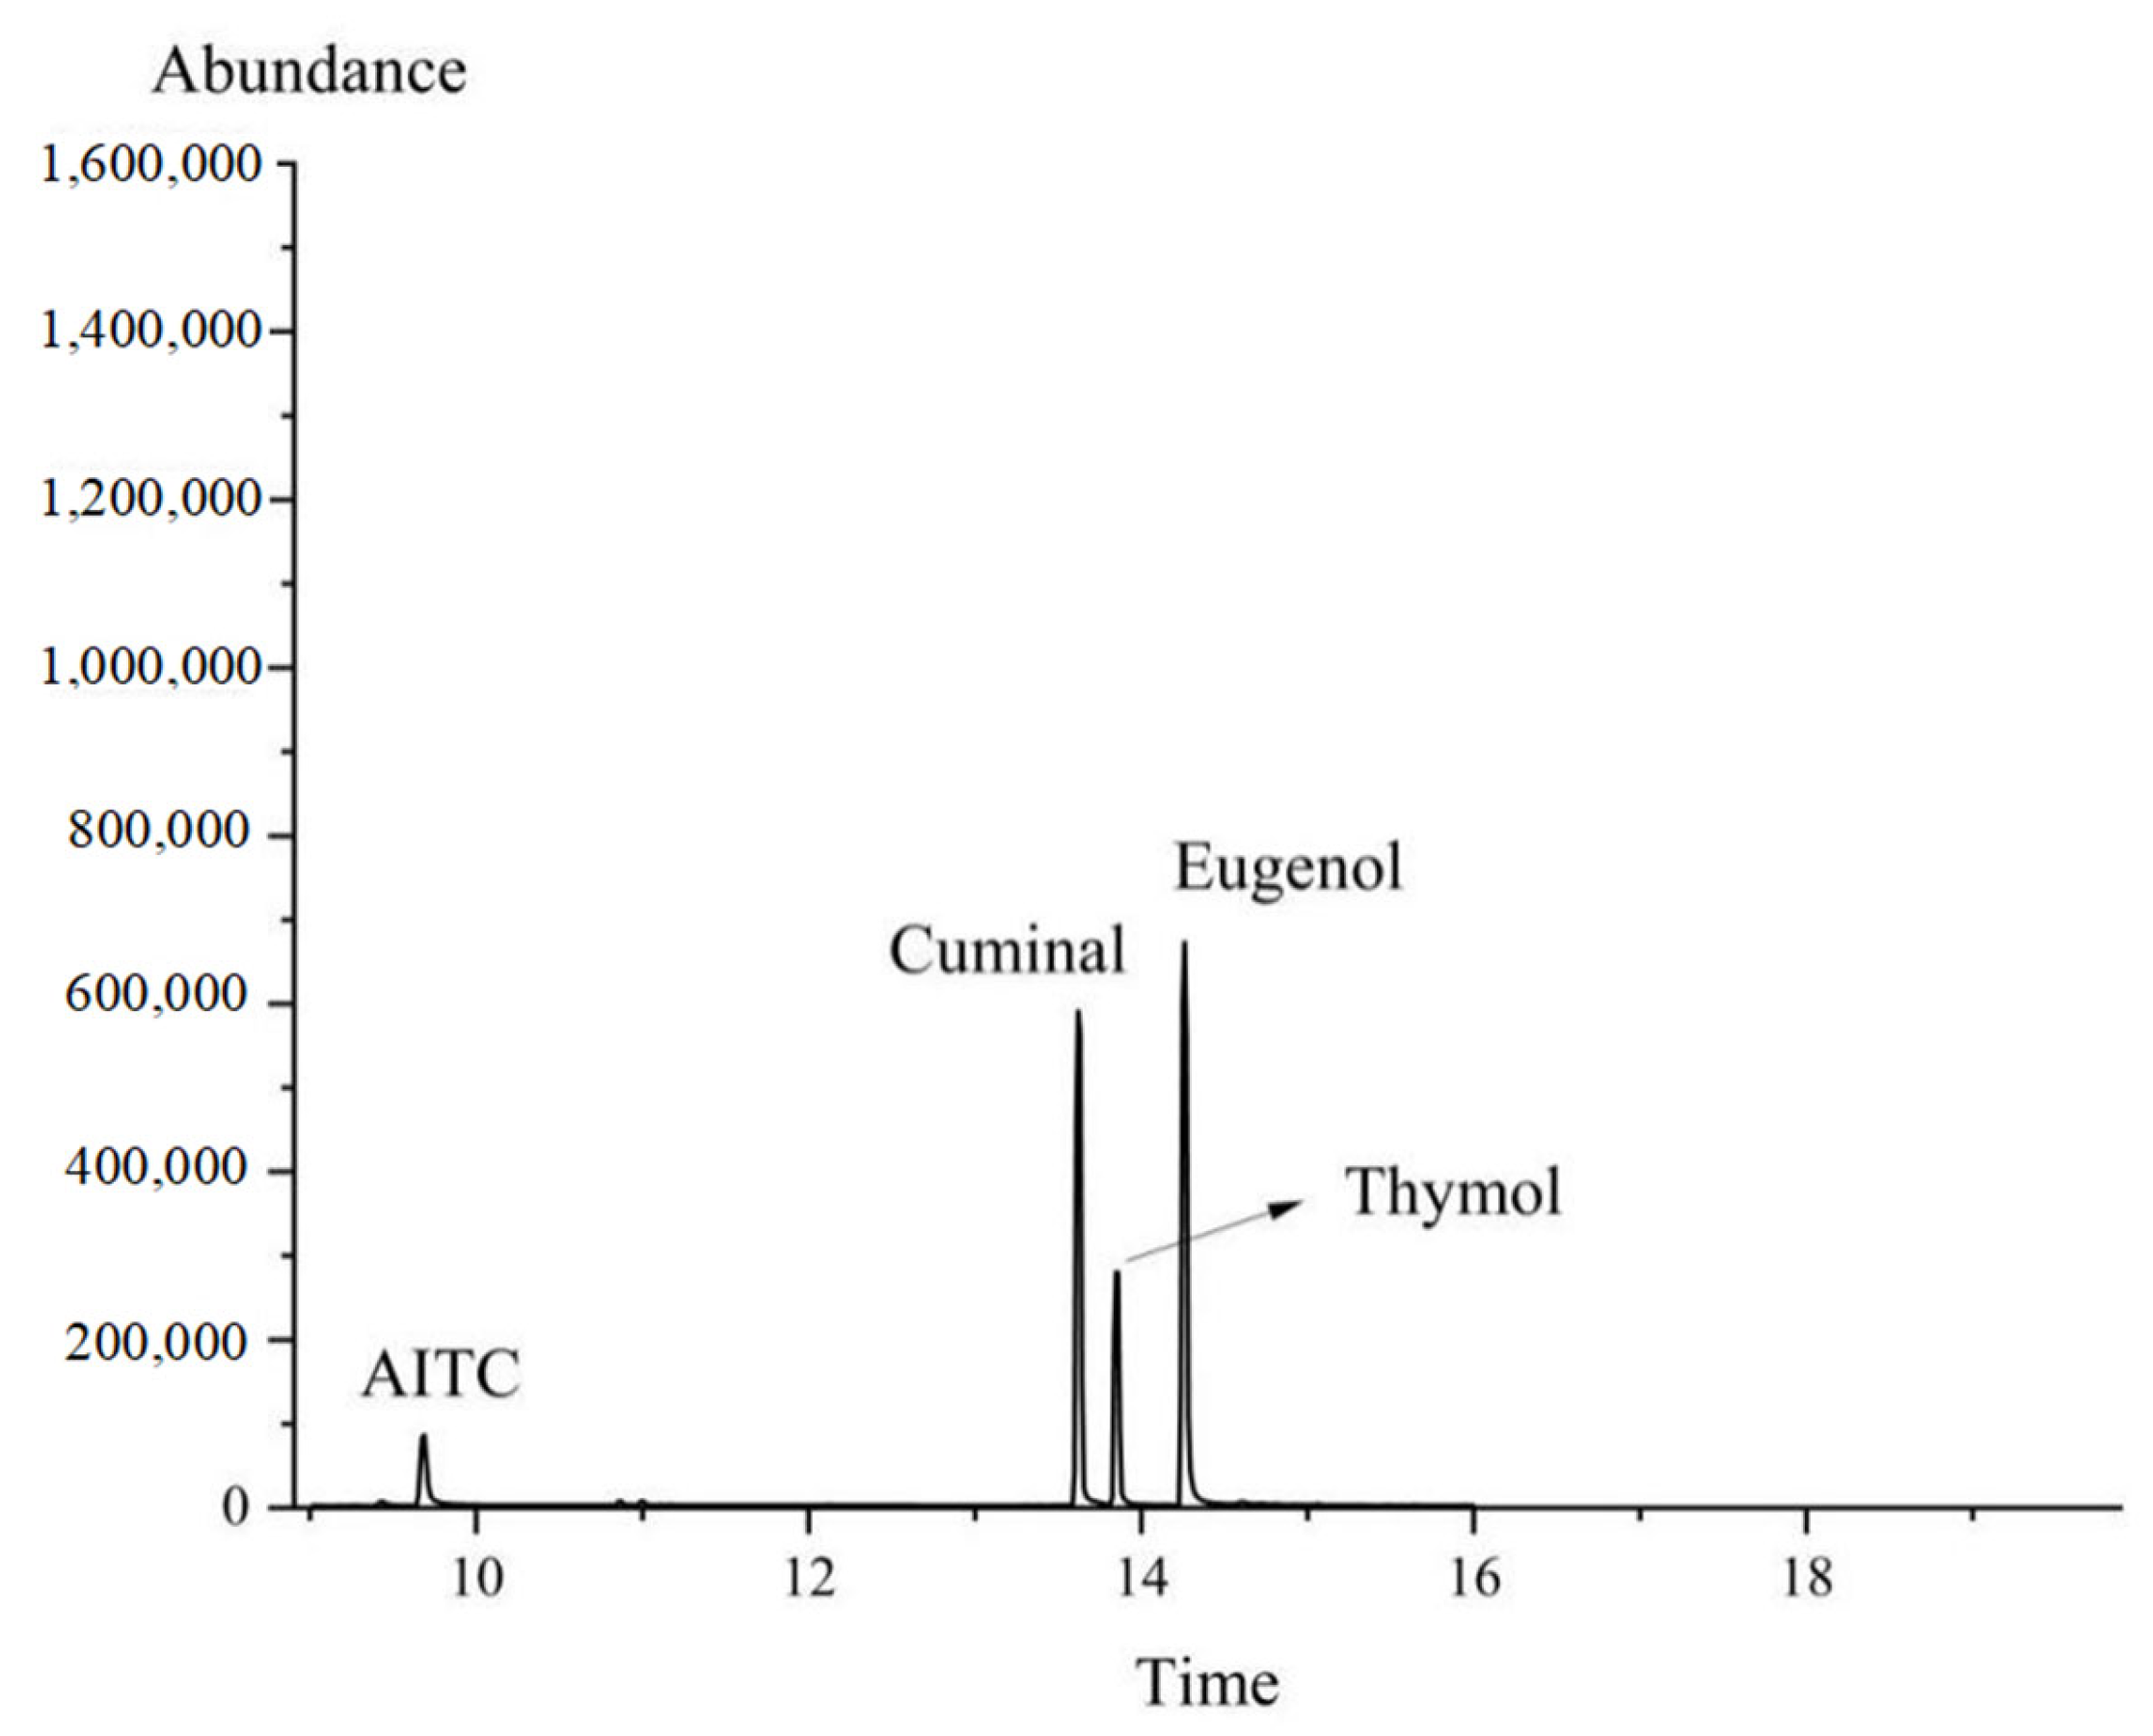
The retention times of the different substances were observed to vary: the retention time of the eugenol standard was 14.34 min (
Figure 1A), that of the cuminal standard was 13.65 min (
Figure 1B), the retention time of the AITC standard was 9.72 min (
Figure 1C), and the retention time of the thymol standard was 13.82 min (
Figure 1D).
(4) Determination of Standard Curves
Equal volumes (200, 400, 600, 800, 1000 µL) of AITC, eugenol, thymol, and cuminal were accurately transferred into five separate 10 mL volumetric flasks using a pipette. Each flask was filled to volume with n-hexane to prepare standard solutions of EO with concentrations of 20.00, 40.00, 60.00, 80.00, and 100.00 µL/mL. Two milliliters of each standard solution were transferred to capped sample bottles. Each solution was analyzed by GC/MS, and standard curves were constructed.
AITC standard curve: y = 52,856x + 6.0 × 10⁶, R2 = 0.9993
Eugenol standard curve: y = 1154.6x + 1.0 × 10⁷, R2 = 0.9994
Thymol standard curve: y = 662.23x + 1.7 × 10⁵, R2 = 0.9991
Cuminal Standard curve: y = 2,188,100x + 1.2 × 10⁷, R2 = 0.999
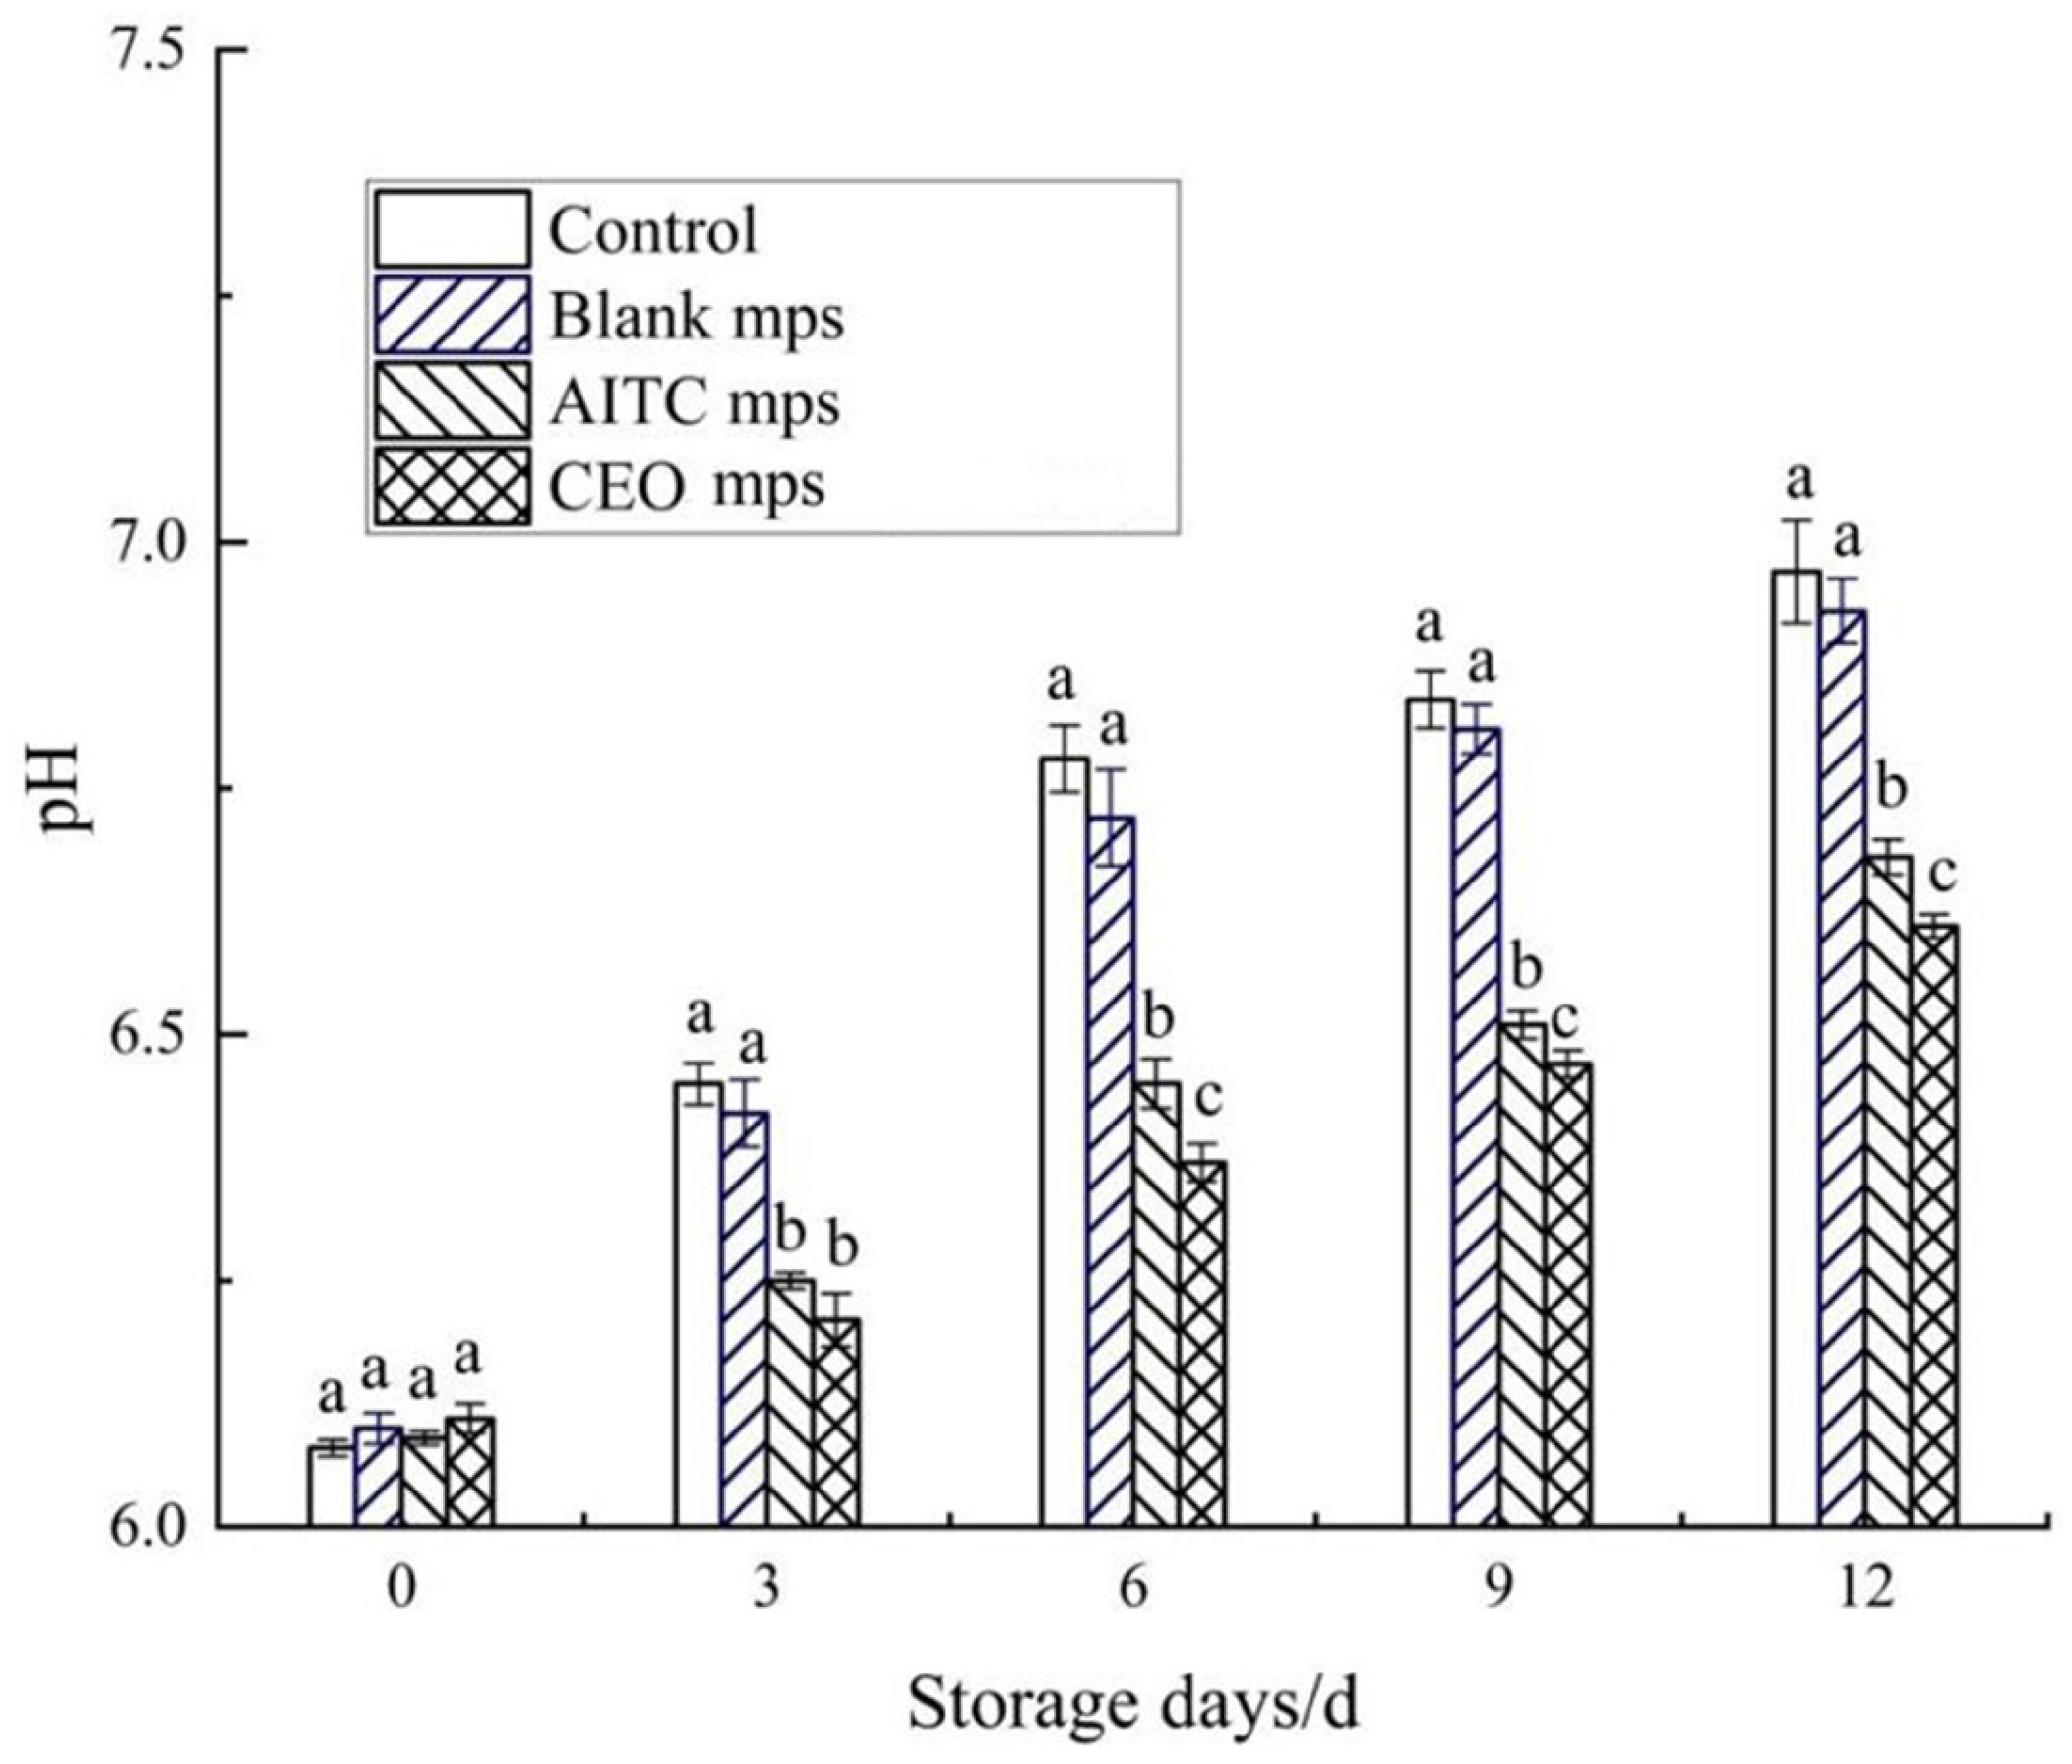
2.7. Application of CEO Mps in Chilled Pork Preservation
2.7.1. Experimental Design for Meat Sample Preparation and Preservation
All knives, cutting boards, and ziplock bags were sterilized with 75% alcohol and exposed to ultraviolet (UV) light for 20 min. The CEO mps, AITC mps, and blank mps were also exposed to UV light for 30 min prior to treatment. Chilled pork was then cut into approximately 50 g cubes and randomly divided into four treatment groups. Samples were collected from each group every 3 days, with three pieces of chilled pork taken from each group on each sampling day [
16]. The mps were packed into small pockets (6 cm length, 3 cm width, non-woven fabric). The treatments were as follows: (1) blank: chilled pork; (2) chilled pork + blank microencapsulation package; (3) chilled pork + 0.6% (
w/
w) AITC microencapsulation package; and (4) chilled pork + 0.6% (
w/
w) CEO microencapsulation package [
17]. The sealing line of the slow-release packets was compressed with a sealing strip from a polyethylene self-sealing bag, ensuring the packet hung from the top of the bag to avoid direct contact with the chilled pork. Each sample was packaged individually. The four treatment groups were stored at 0–4 °C and sampled at 0, 3, 6, 9, and 12 days. Statistical analysis of significance was based on comparisons between groups at each sampling time.
2.7.2. pH Measurement
To prepare the samples, 10 g of chilled pork was mixed with 90 mL of distilled water and homogenized for 20 min. The mixture was then centrifuged at 6000 rpm for 10 min, and the supernatant was collected. The pH of the supernatant was measured three times using a pH meter (FE20, Mettler-Toledo International Inc., Greifensee, ZH, Switzerland).
2.7.3. Color Determination
The color of the samples was measured using a colorimeter (LS-175, Shenzhen Linshang Technology Co., Ltd., Shenzhen, China) with a 20 mm aperture. Before each measurement, a white tile was used for calibration. To ensure accurate readings, the samples were rotated 60° clockwise to eliminate any aperture between the meat sample and the measuring head. Five measurements were taken for each sample. The color measurements were expressed using the CIE LAB (L*, a*, b*) color scale, where L* represents brightness, a* indicates redness, and b* indicates yellowness.
2.7.4. Thiobarbituric Acid Reactive Substances (TBARSs)
Lipid oxidation was assessed using the TBARS method as described by Fan et al. [
18]. Ten grams of ground meat were homogenized with 50 mL of 7.5% trichloroacetic acid (TCA) containing 0.1% ethylenediaminetetraacetic acid. The mixture was shaken for 30 min and then filtered. Five milliliters of the filtrate were mixed with an equal volume of 2-thiobarbituric acid (TBA) (0.02 mol/L). The resulting mixture was heated at 100 °C for 40 min, cooled for 1 h to room temperature, and then centrifuged at 6000 rpm for 5 min. Five milliliters of chloroform were added to the supernatant, which was then shaken well. After dispensing, the absorbance of the supernatant was measured at A532 nm and A600 nm. Blank controls consisted of 5 mL TBA and 5 mL TCA. The TBARS content was calculated using the following formula and expressed as mg malondialdehyde (MDA) per kg of meat:
where
A532 is the absorbance value at 532 nm wavelength,
A600 is the absorbance value at 600 nm wavelength, “
V” is the volume of the supernatant (mL), and “
M” is the molar mass of malondialdehyde (72.6 g/mol).
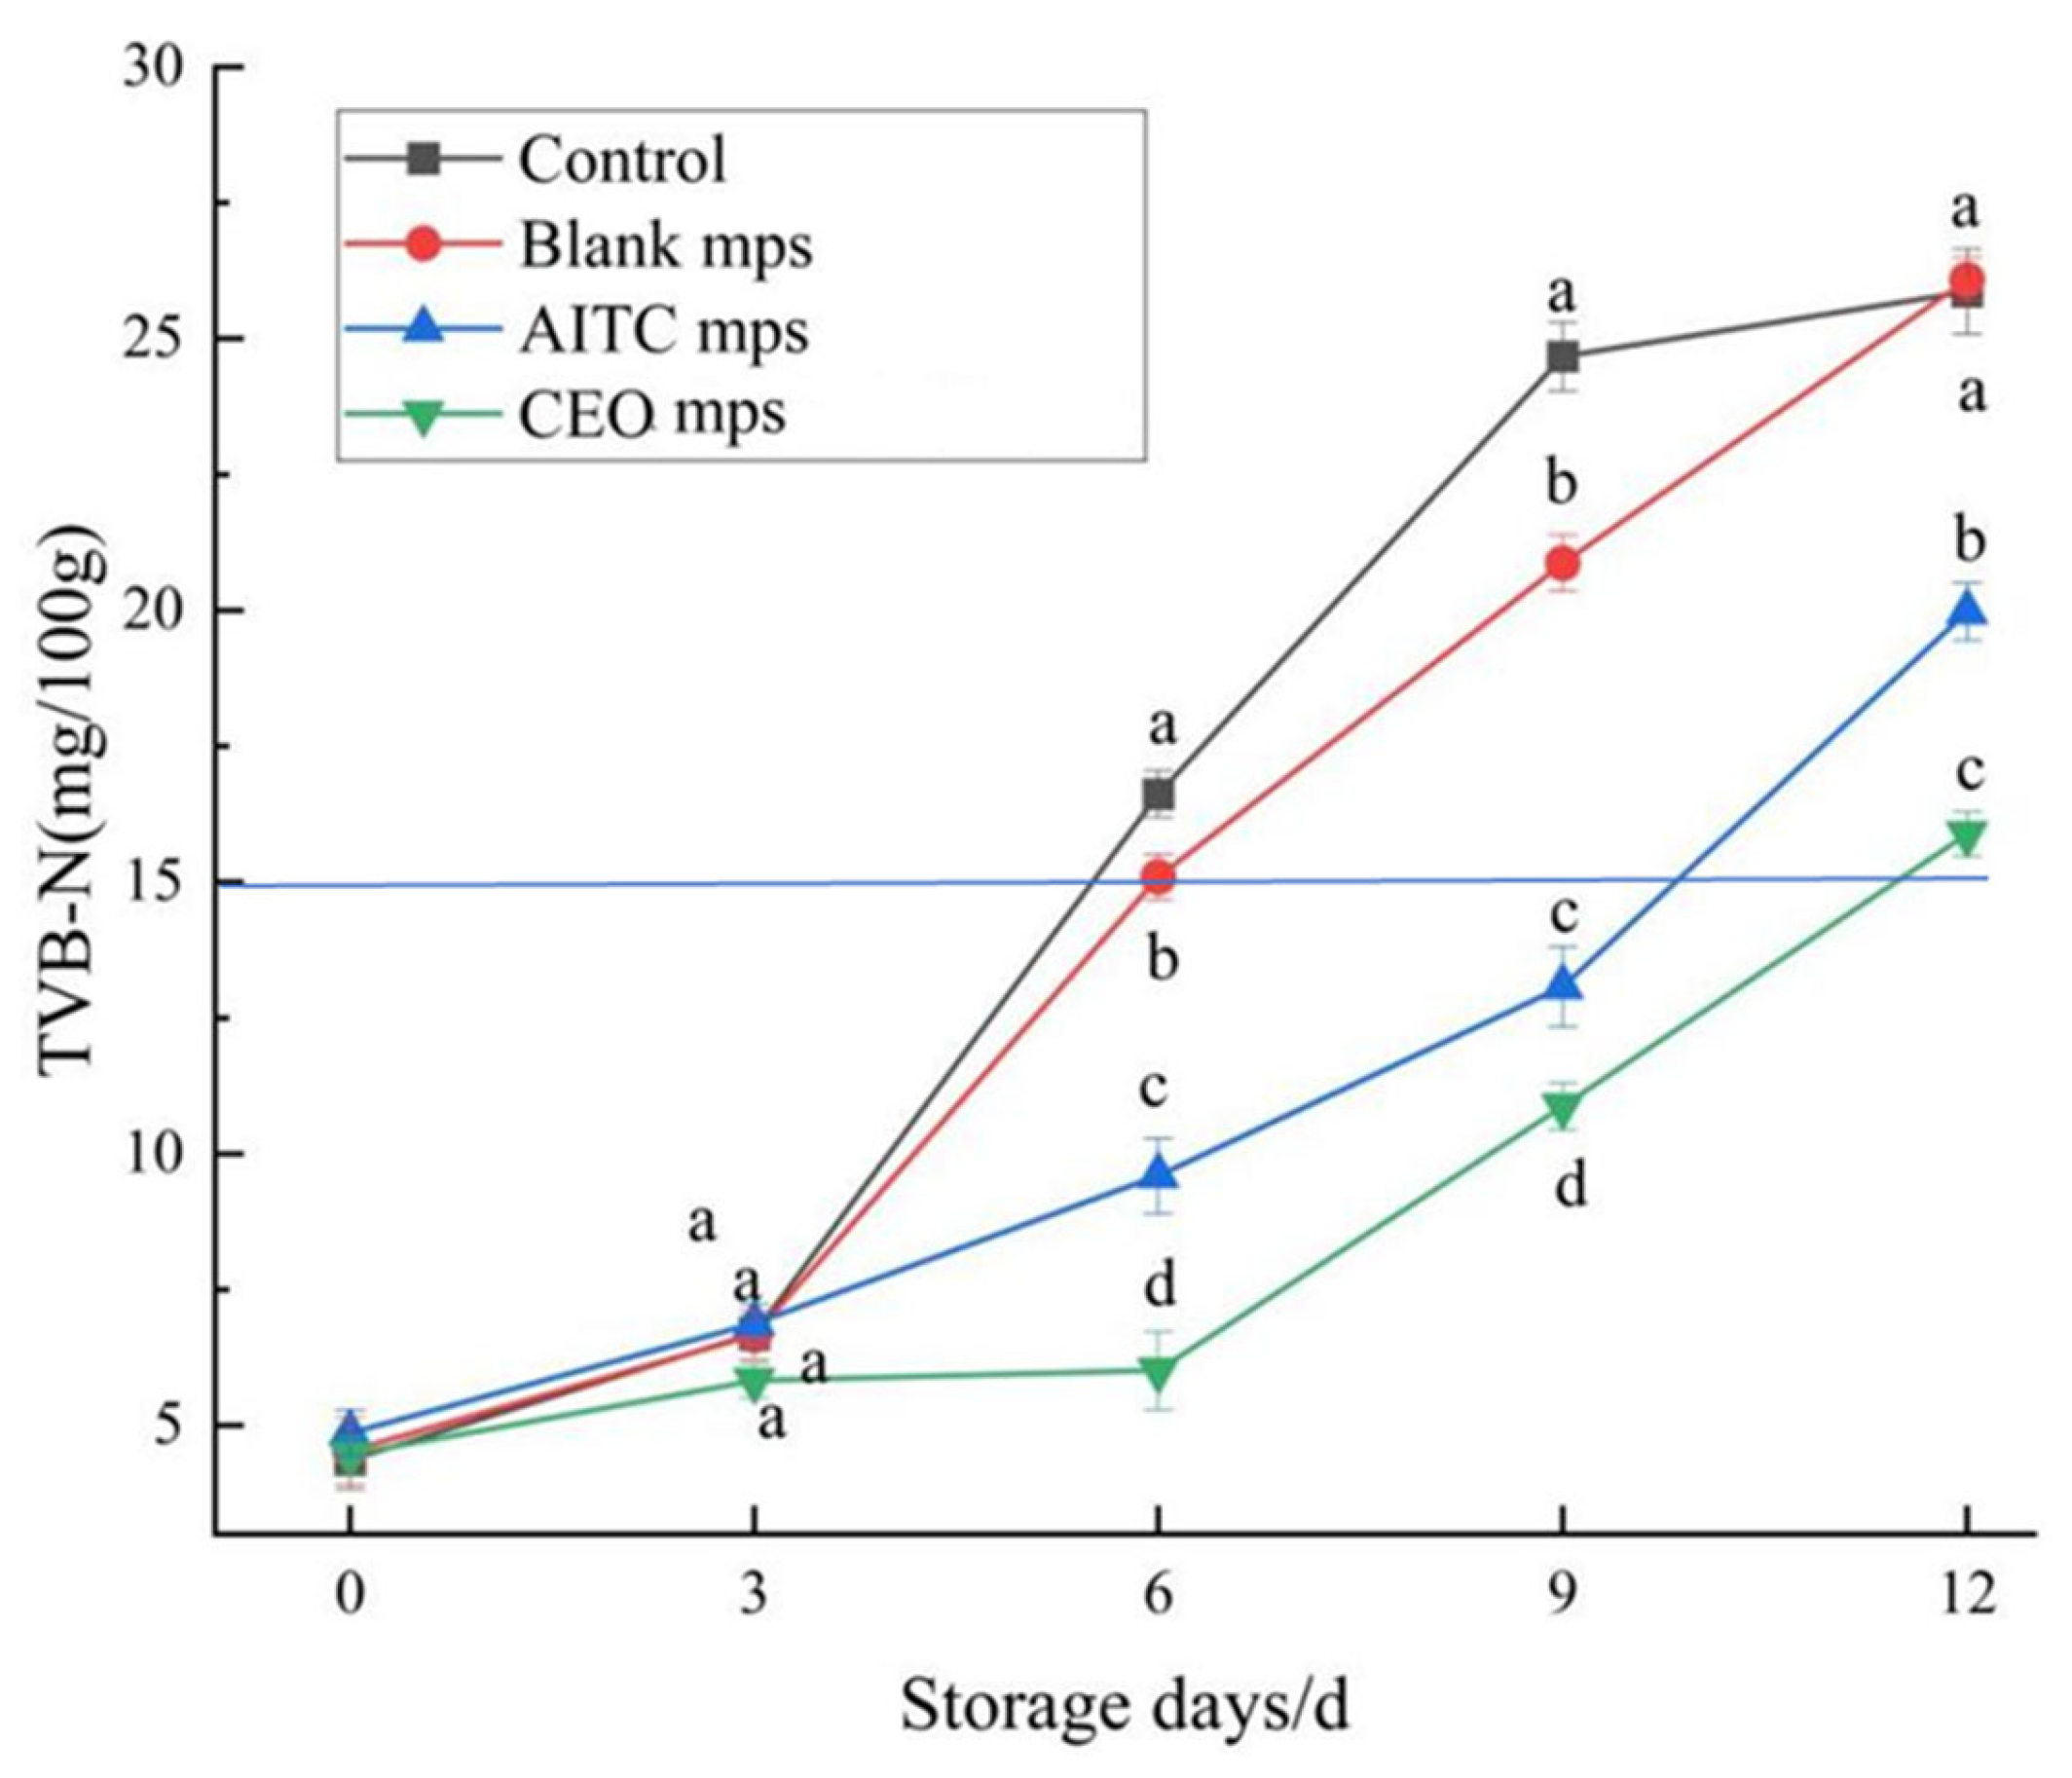
2.7.5. Total Volatile Base Nitrogen (TVB-N)
Initially, 10 g of minced meat was homogenized in 75 mL of deionized water and left to stand for 30 min prior to filtration. The resultant filtrate was combined with 1 g of magnesium oxide (used as a catalyst) in a digestion tube and immediately distilled using an automatic Kjeldahl nitrogen analyzer (K1100, Haineng Future Technology Group Co., Ltd, Shandong, Jinan, China). The distillate was subsequently titrated with 0.1 M HCl. The volatile saline nitrogen content (X) of the samples was calculated using the following formula:
where: “
H” represents the content in mg/100 g or mg/100 mL; “
V1 ”denotes the volume of hydrochloric acid or sulfuric acid standard titration solution consumed by the test solution (mL); “
V2” denotes the volume of hydrochloric acid or sulfuric acid standard titration solution consumed by the reagent blank (mL); “
c” signifies the concentration of hydrochloric acid or sulfuric acid standard titration solution (mol/L); “
m” represents the mass of the meat (g).
2.7.6. Measurement Methods of Water Loss Rate
The initial mass of each piece of chilled pork and the associated ziplock bag was measured. Each day, the chilled pork was removed from the ziplock bag and left to dry in a ventilated area for 30 s. Subsequently, the total mass of the ziplock bag and the chilled pork sample was recorded. The water loss rate was calculated using the following formula:
where: “
M” represents the initial mass of the chilled pork (g); “
m” represents the initial mass of the ziplock bag (g); “
W” denotes the total mass of the ziplock bag and the chilled pork sample (g).
2.7.7. Measurement Methods of Total Colony Count
The experimental procedure followed the method outlined in Ref. [
19]. For the homogenization of the pork samples, 10 g of chilled pork was combined with 90 mL of sterile water and homogenized for 3 min. A 10-fold serial dilution of the homogenate was then prepared. A 100 μL aliquot of the diluted homogenate was spread onto an agar plate and incubated at 37 °C for 48 h for total bacterial count (TBC) determination.
2.8. Statistical Analysis
All experiments and measurements were performed in triplicate, and the results are expressed as mean ± standard deviation (SD). Data were processed and visualized using Origin 2017 and Microsoft Excel spreadsheet software. Statistical analyses were conducted using SPSS version 26.0 (SPSS Inc., Chicago, IL, USA). Significant differences were determined using the least significant difference (LSD) test at the 5% significance level (p < 0.05).
4. Conclusions
In this study, a novel microencapsulation system was designed to effectively extend the shelf life of chilled pork while maintaining its quality in terms of pH, color, TBARSs, TVB-N, water loss rate, and total colony counts throughout the storage period. Building on previous research [
5], this microcapsule featured a more complex structure and composition. While AITC is known for its excellent bacteriostatic activity, it lacks significant antioxidant properties. Therefore, three plant essential oil (EO) components—eugenol, cuminal, and thymol—were incorporated into the formulation to enhance antioxidant activity and synergistically improve bacterial inhibition with AITC. Through the comparative experiment on the antioxidant effects of single plant essential oils and compound plant essential oils, as well as the proportion optimization experiment, we finally determined the mass ratio of eugenol, cuminal, and thymol to be 2:2:1, with it providing the best combination of antioxidant and bacteriostatic effects.
To ensure the effectiveness of the microencapsulation system in prolonging the shelf life of chilled pork, AITC and the EOs were encapsulated within a β-CD inclusion complex, with the CEO (eugenol–cuminal–thymol) mixture encapsulated using the AITC & β-CD inclusion compound and GA as the wall material to form microcapsules. The resulting microcapsules allowed AITC to remain available for stable release without occupying the internal space, thus facilitating the encapsulation of additional plant EOs. Characterization and evaluation of the microcapsules demonstrated that the size and morphology of the microcapsules were ideal, and the CEO microcapsules prepared with the AITC&β-CD inclusion and GA mixture effectively controlled the release of the core materials. Furthermore, AITC encapsulated in β-CD ensured its stability and sustained release, exerting its bacteriostatic effect over time. The CEO microcapsules effectively extended the shelf life of chilled pork by approximately 12 days and exhibited a strong preservation effect.
The CEO microcapsules developed in this study offer promising potential as a natural preservative for extending the shelf life and improving the quality of refrigerated fresh pork. Additionally, the AITC&β-CD inclusion complex used as the microencapsulation wall material provides a novel approach to microencapsulation design, which could be applied in other fields as well.


