
Advances in the Identification Methods of Food-Medicine Homologous Herbal Materials

 ,
,
Abstract
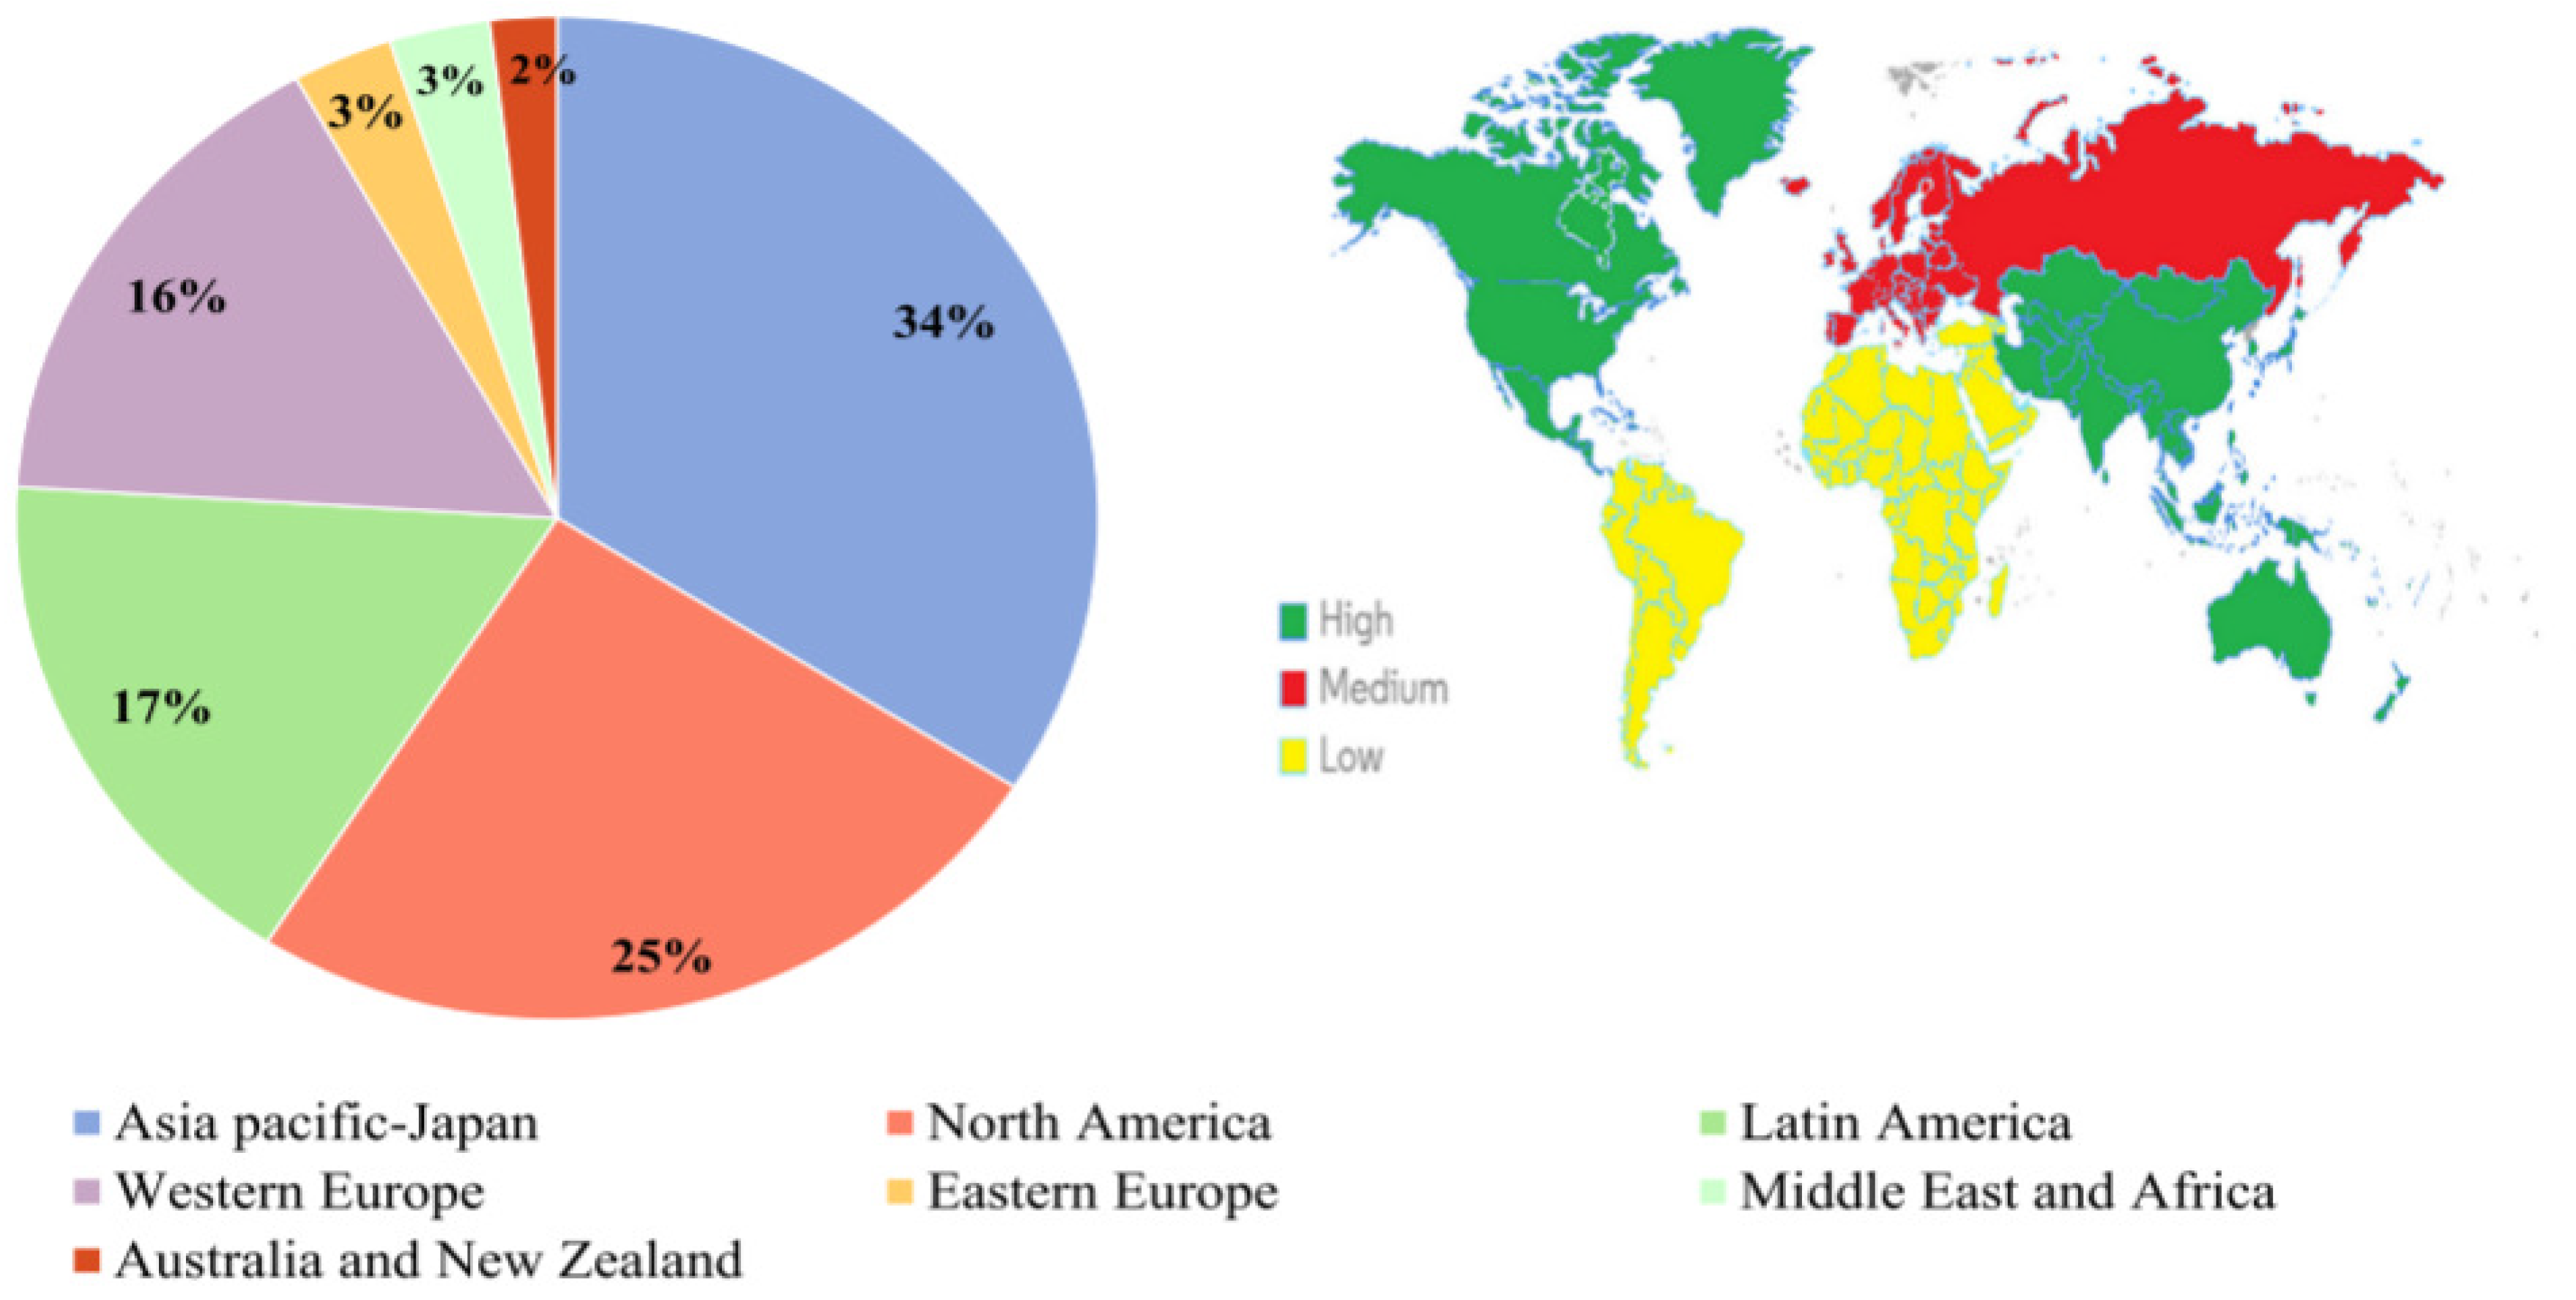
1. Introduction
2. Traditional Identification Methods for Food-Medicine Homologous Herbal Materials
2.1. Morphological Identification Method
2.2. Microscopic Identification Method
2.3. Physicochemical Identification Method
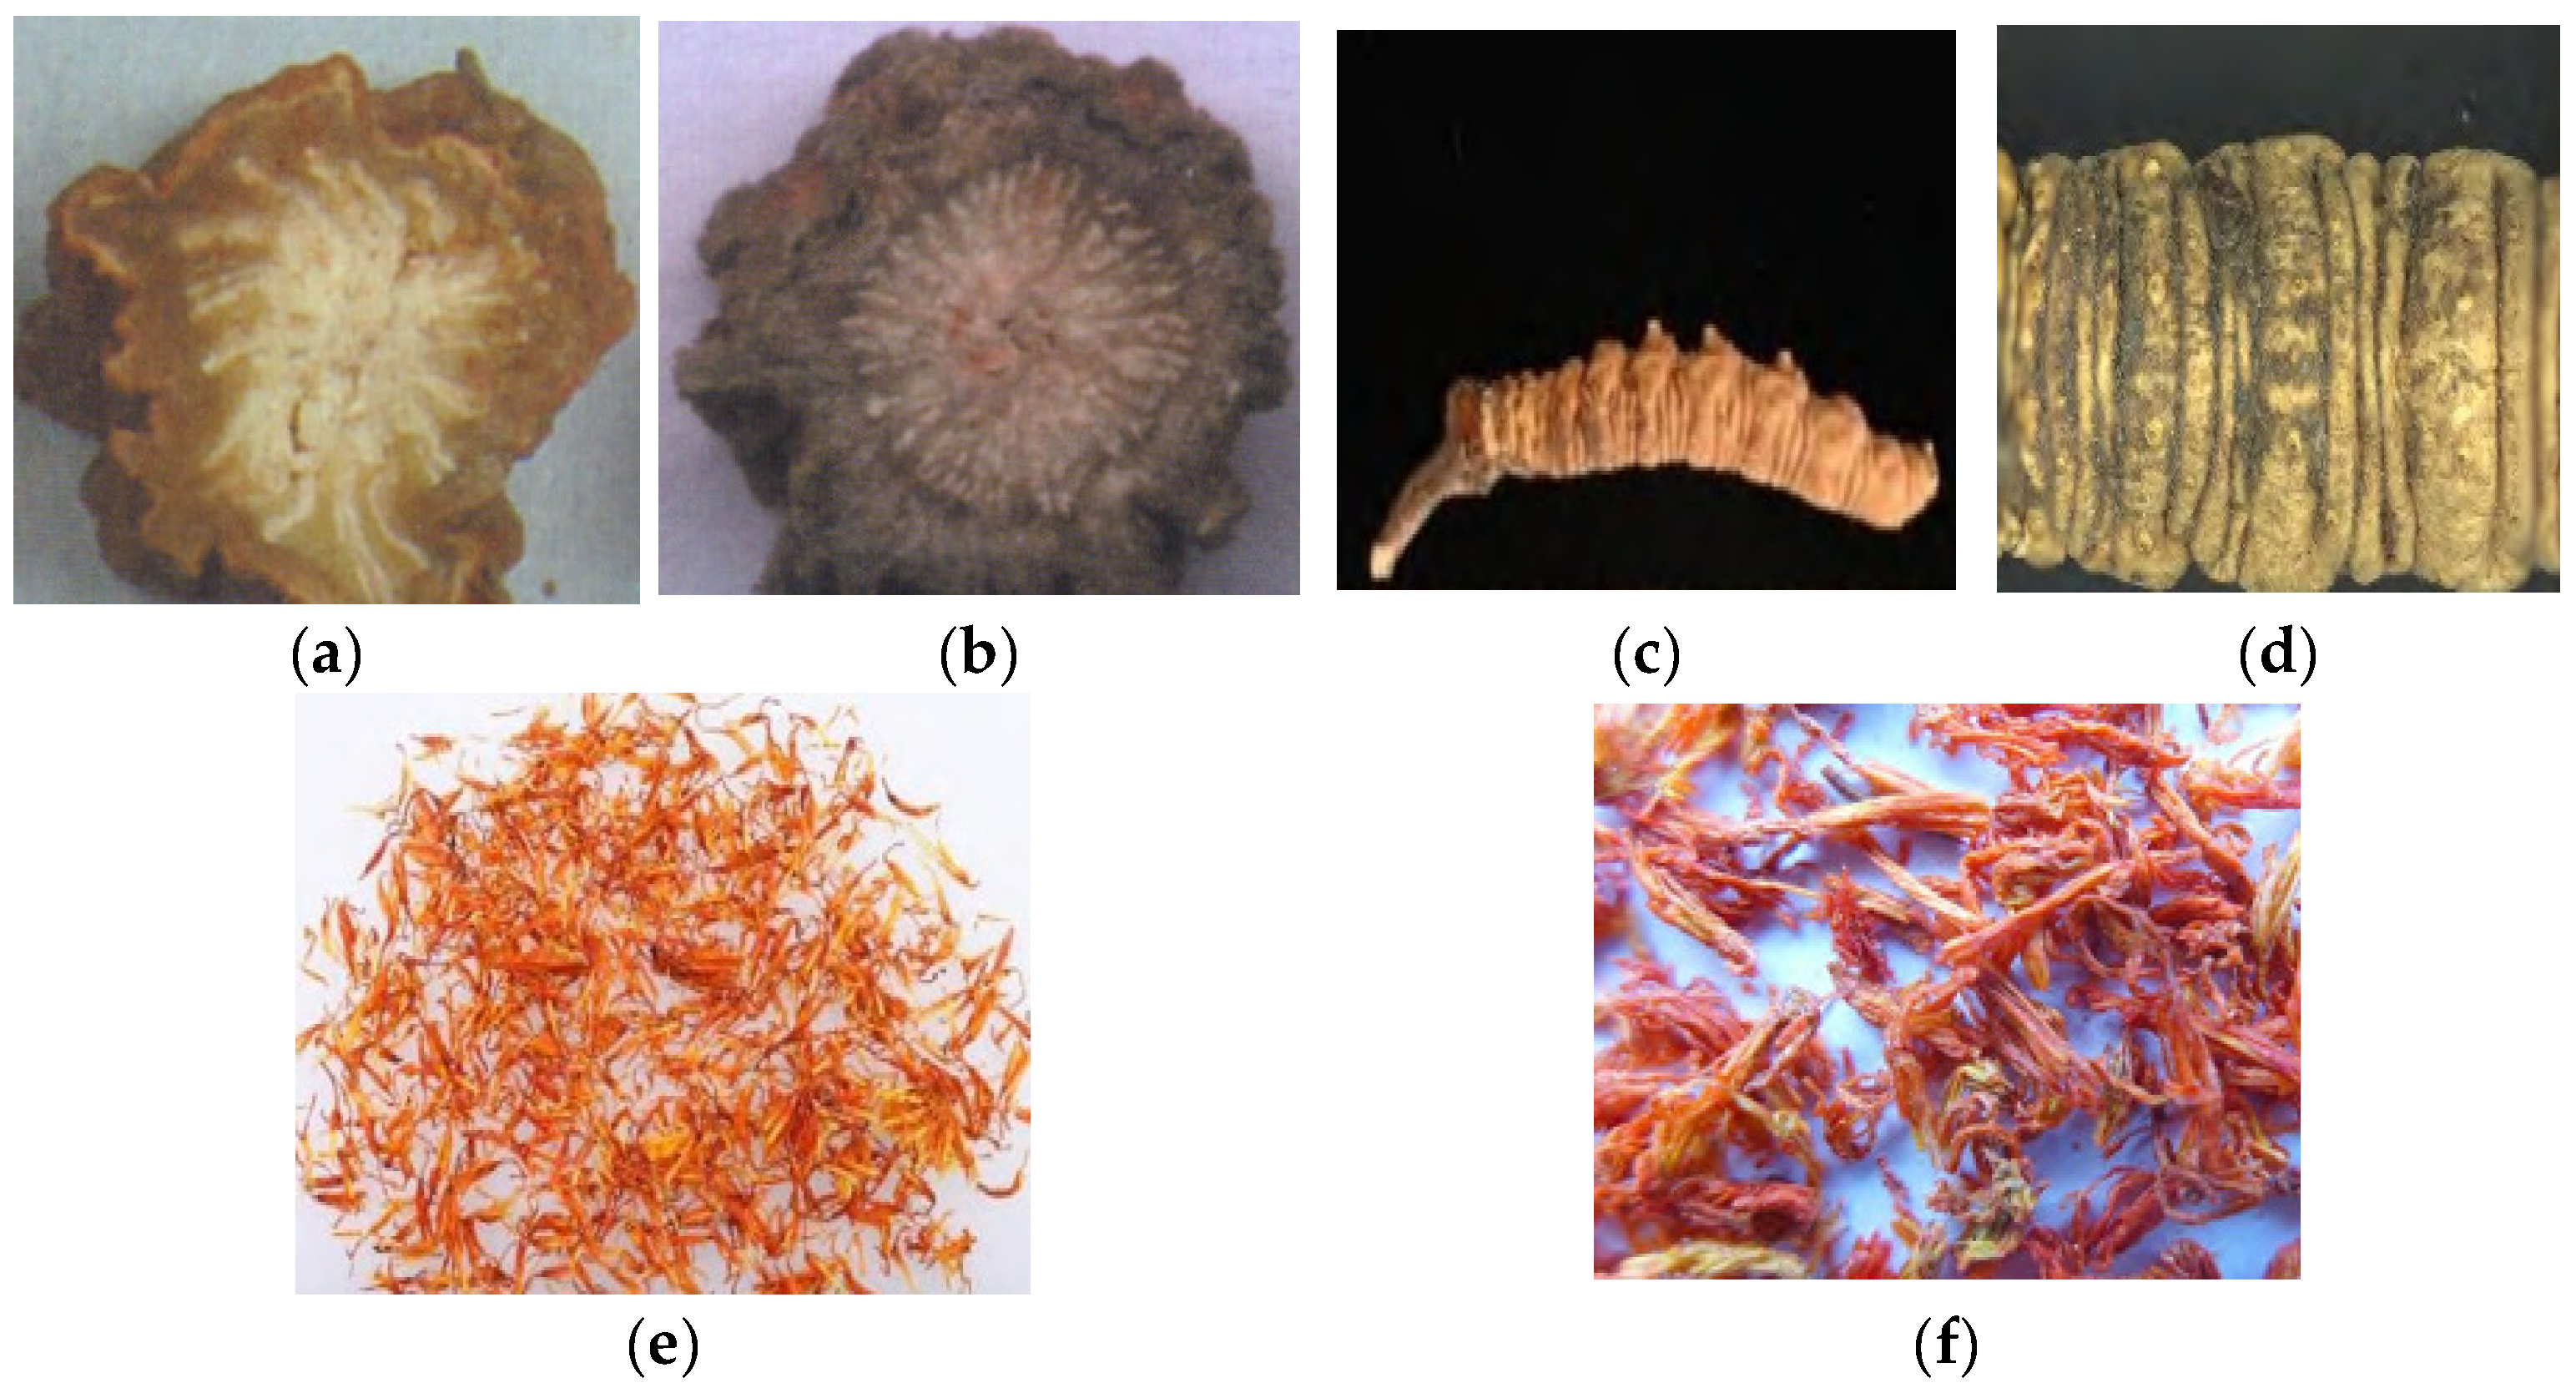
2.4. Microcharacteristic Identification Method
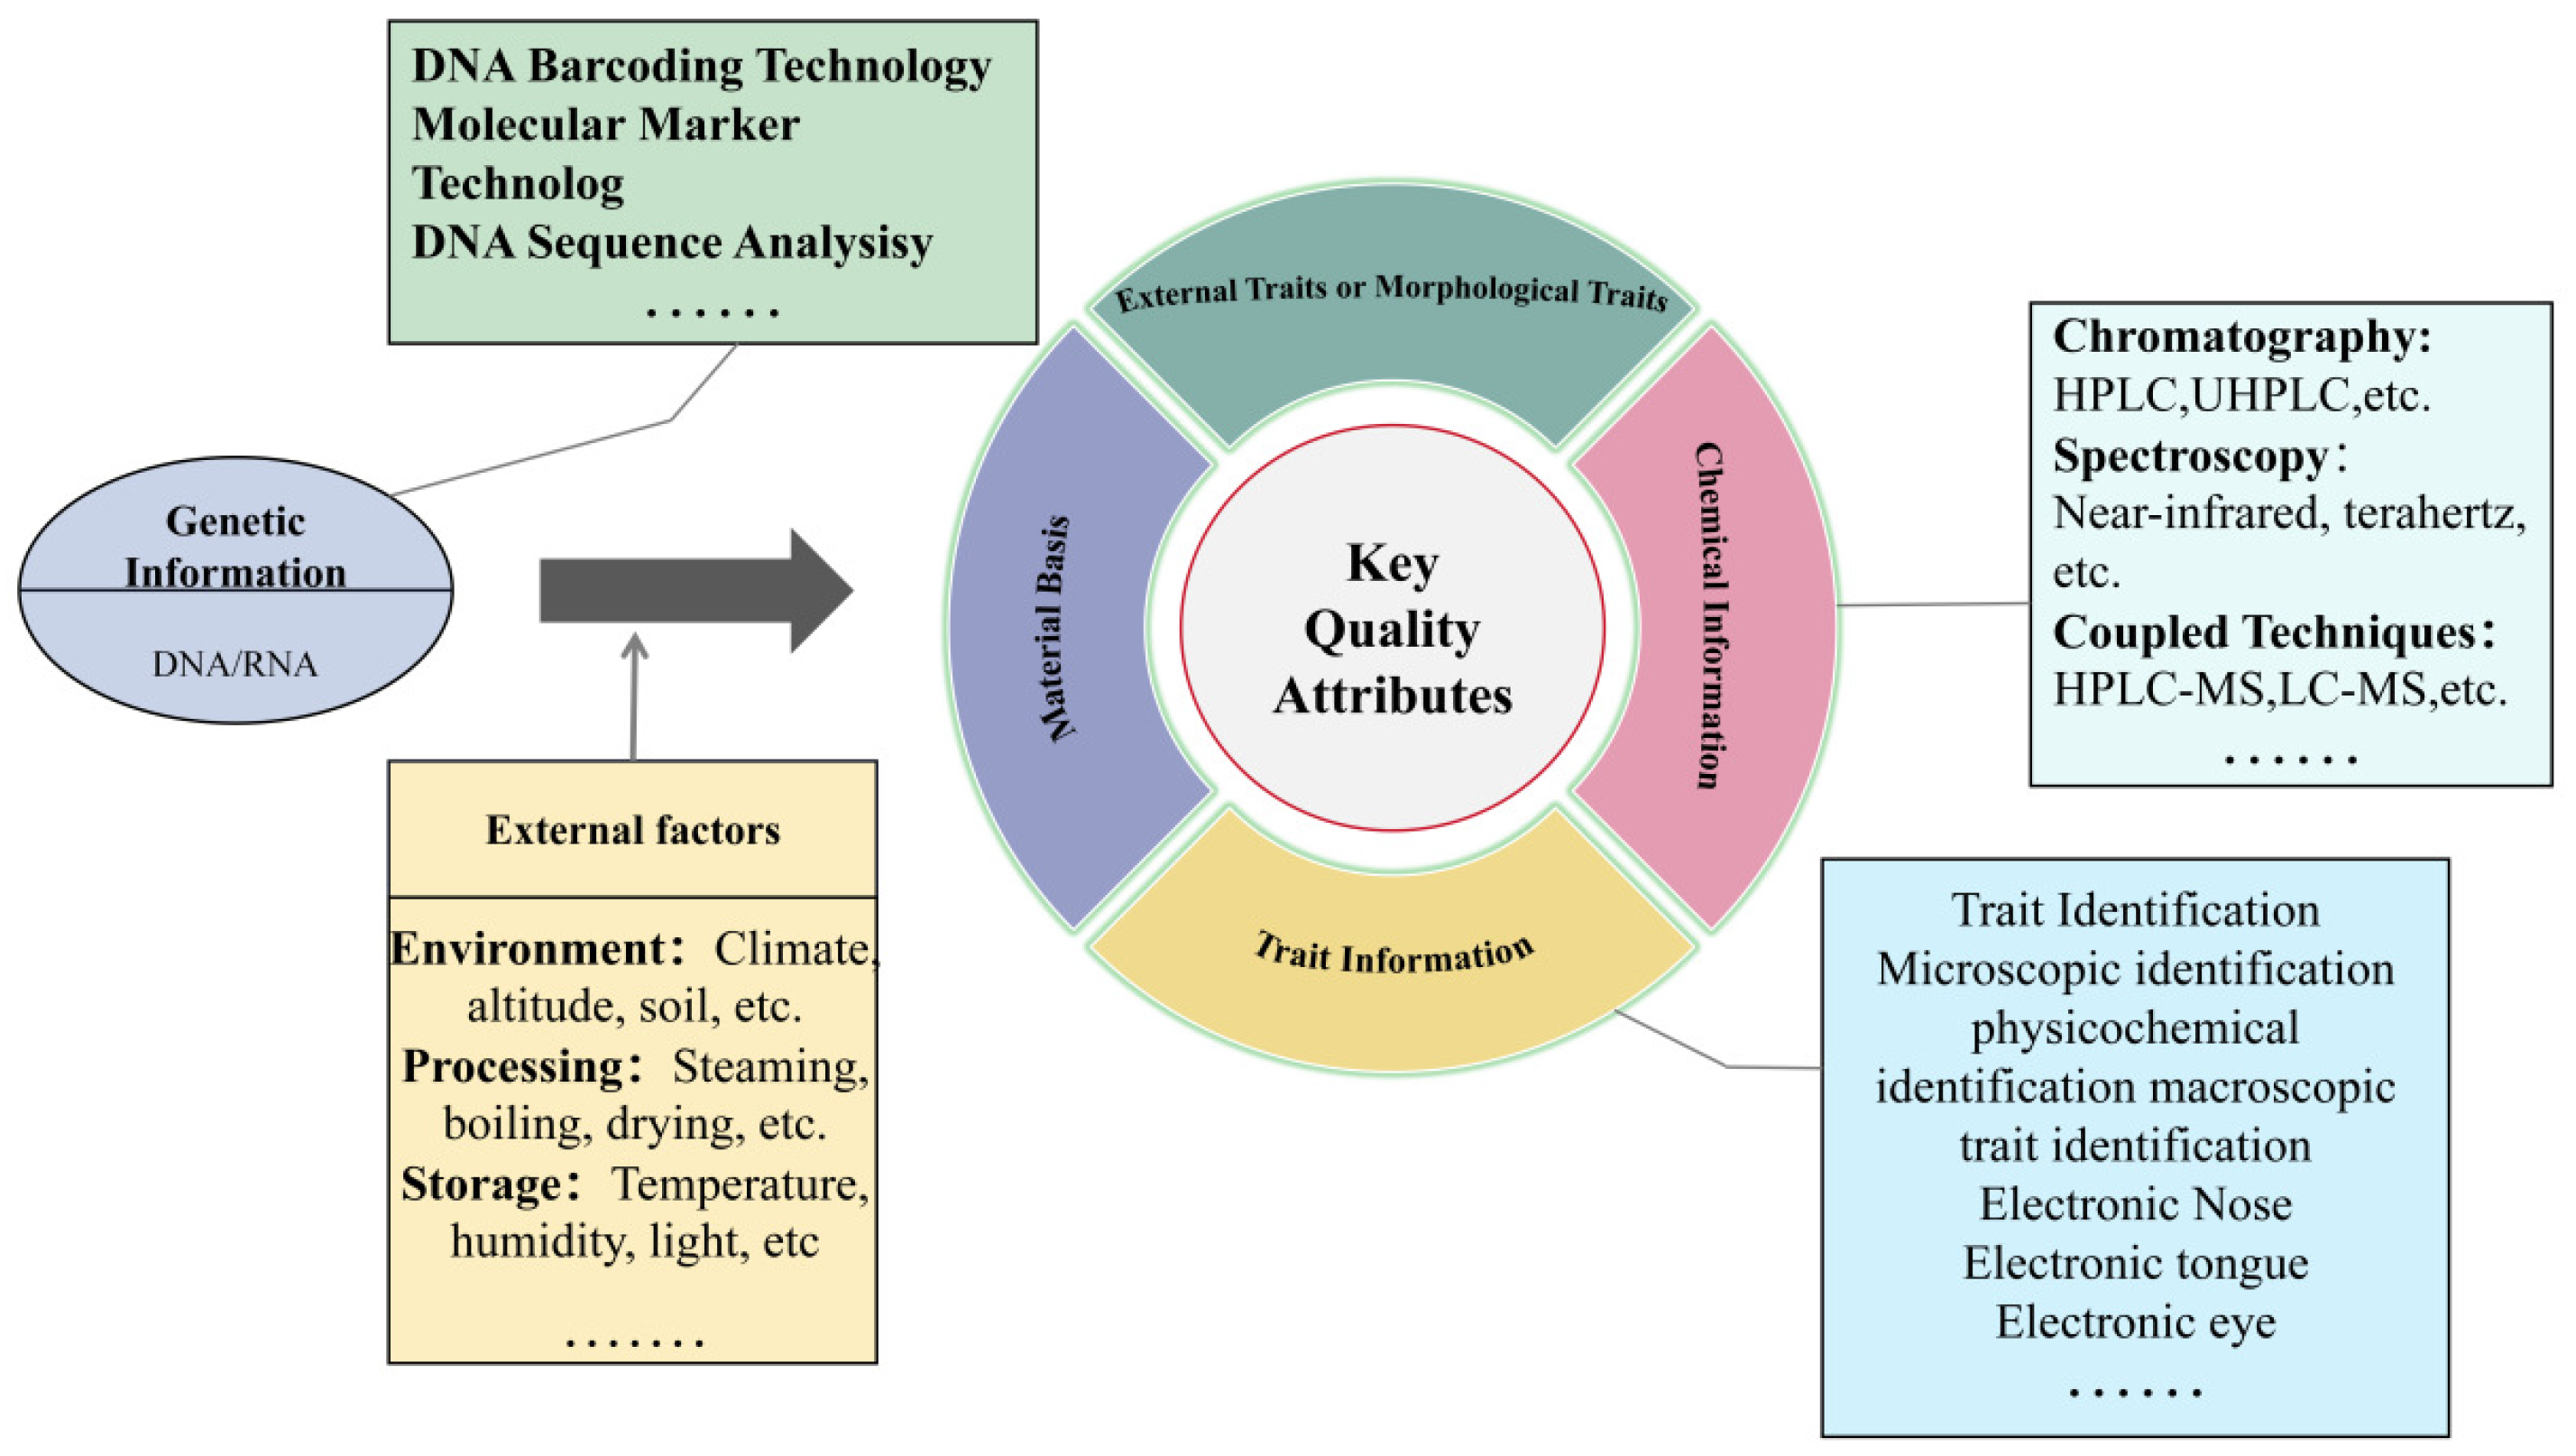
3. Modern Identification Methods for Food-Medicine Homologous Herbal Materials
3.1. Chemical Analysis Methods
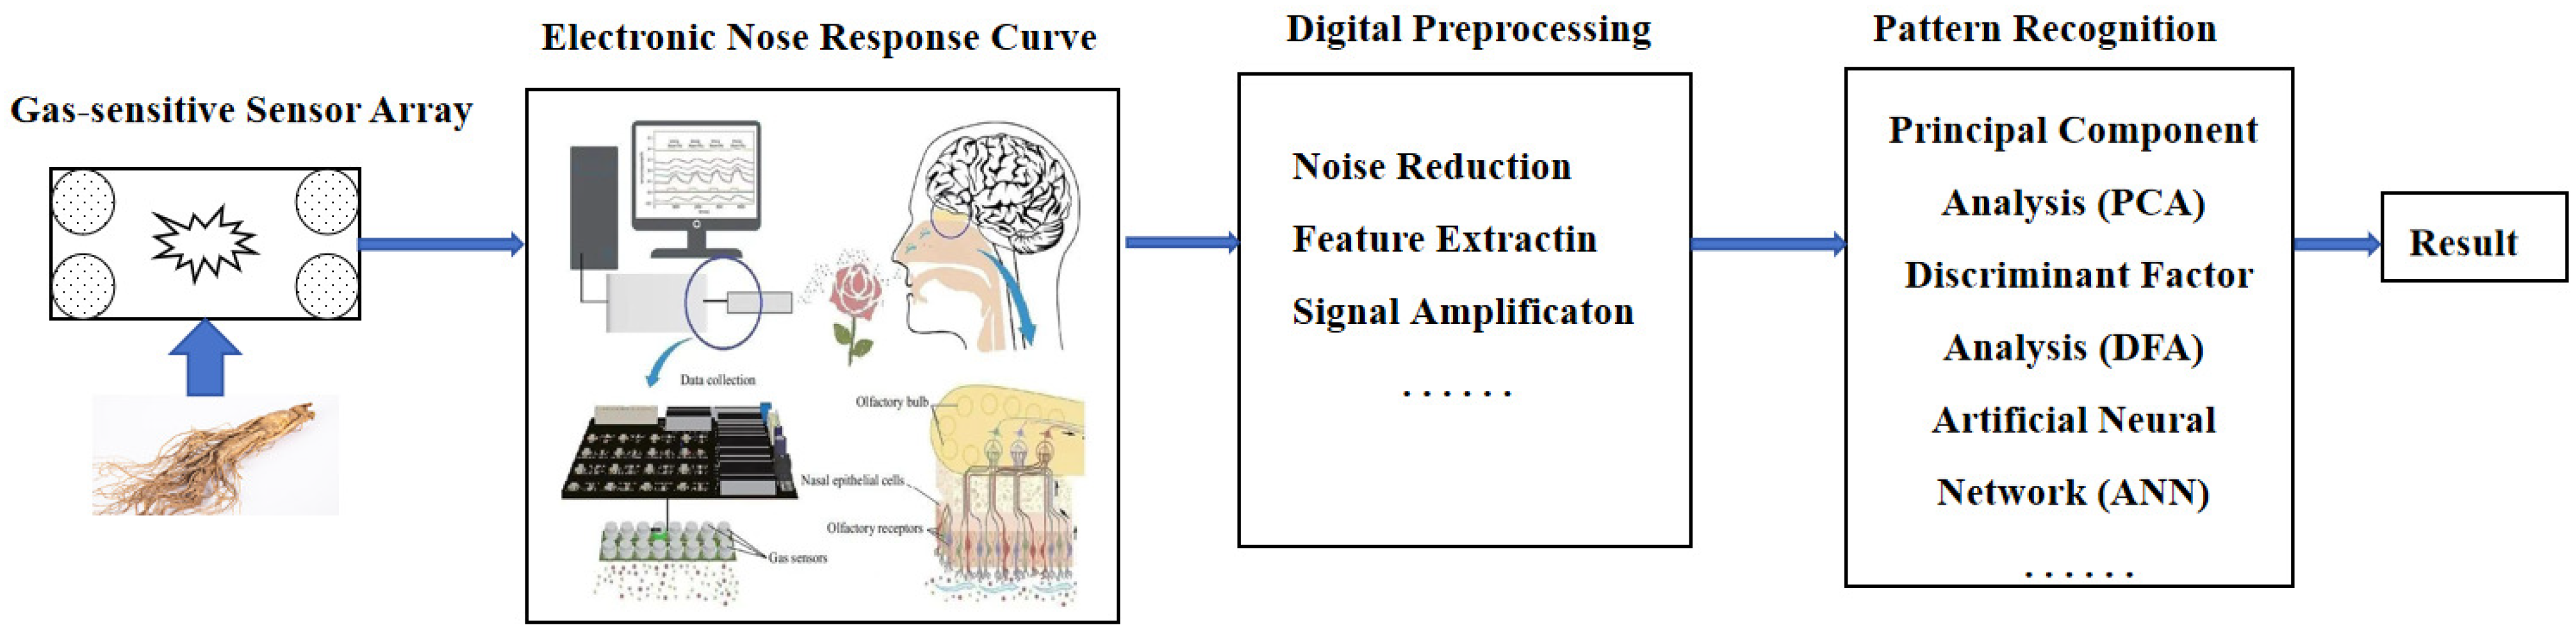
3.1.1. Biomimetic Recognition Method
3.1.2. Chromatographic Methods
3.1.3. Mass Spectrometry
3.1.4. Chromatography–Mass Spectrometry Coupling
3.2. Spectroscopic Methods
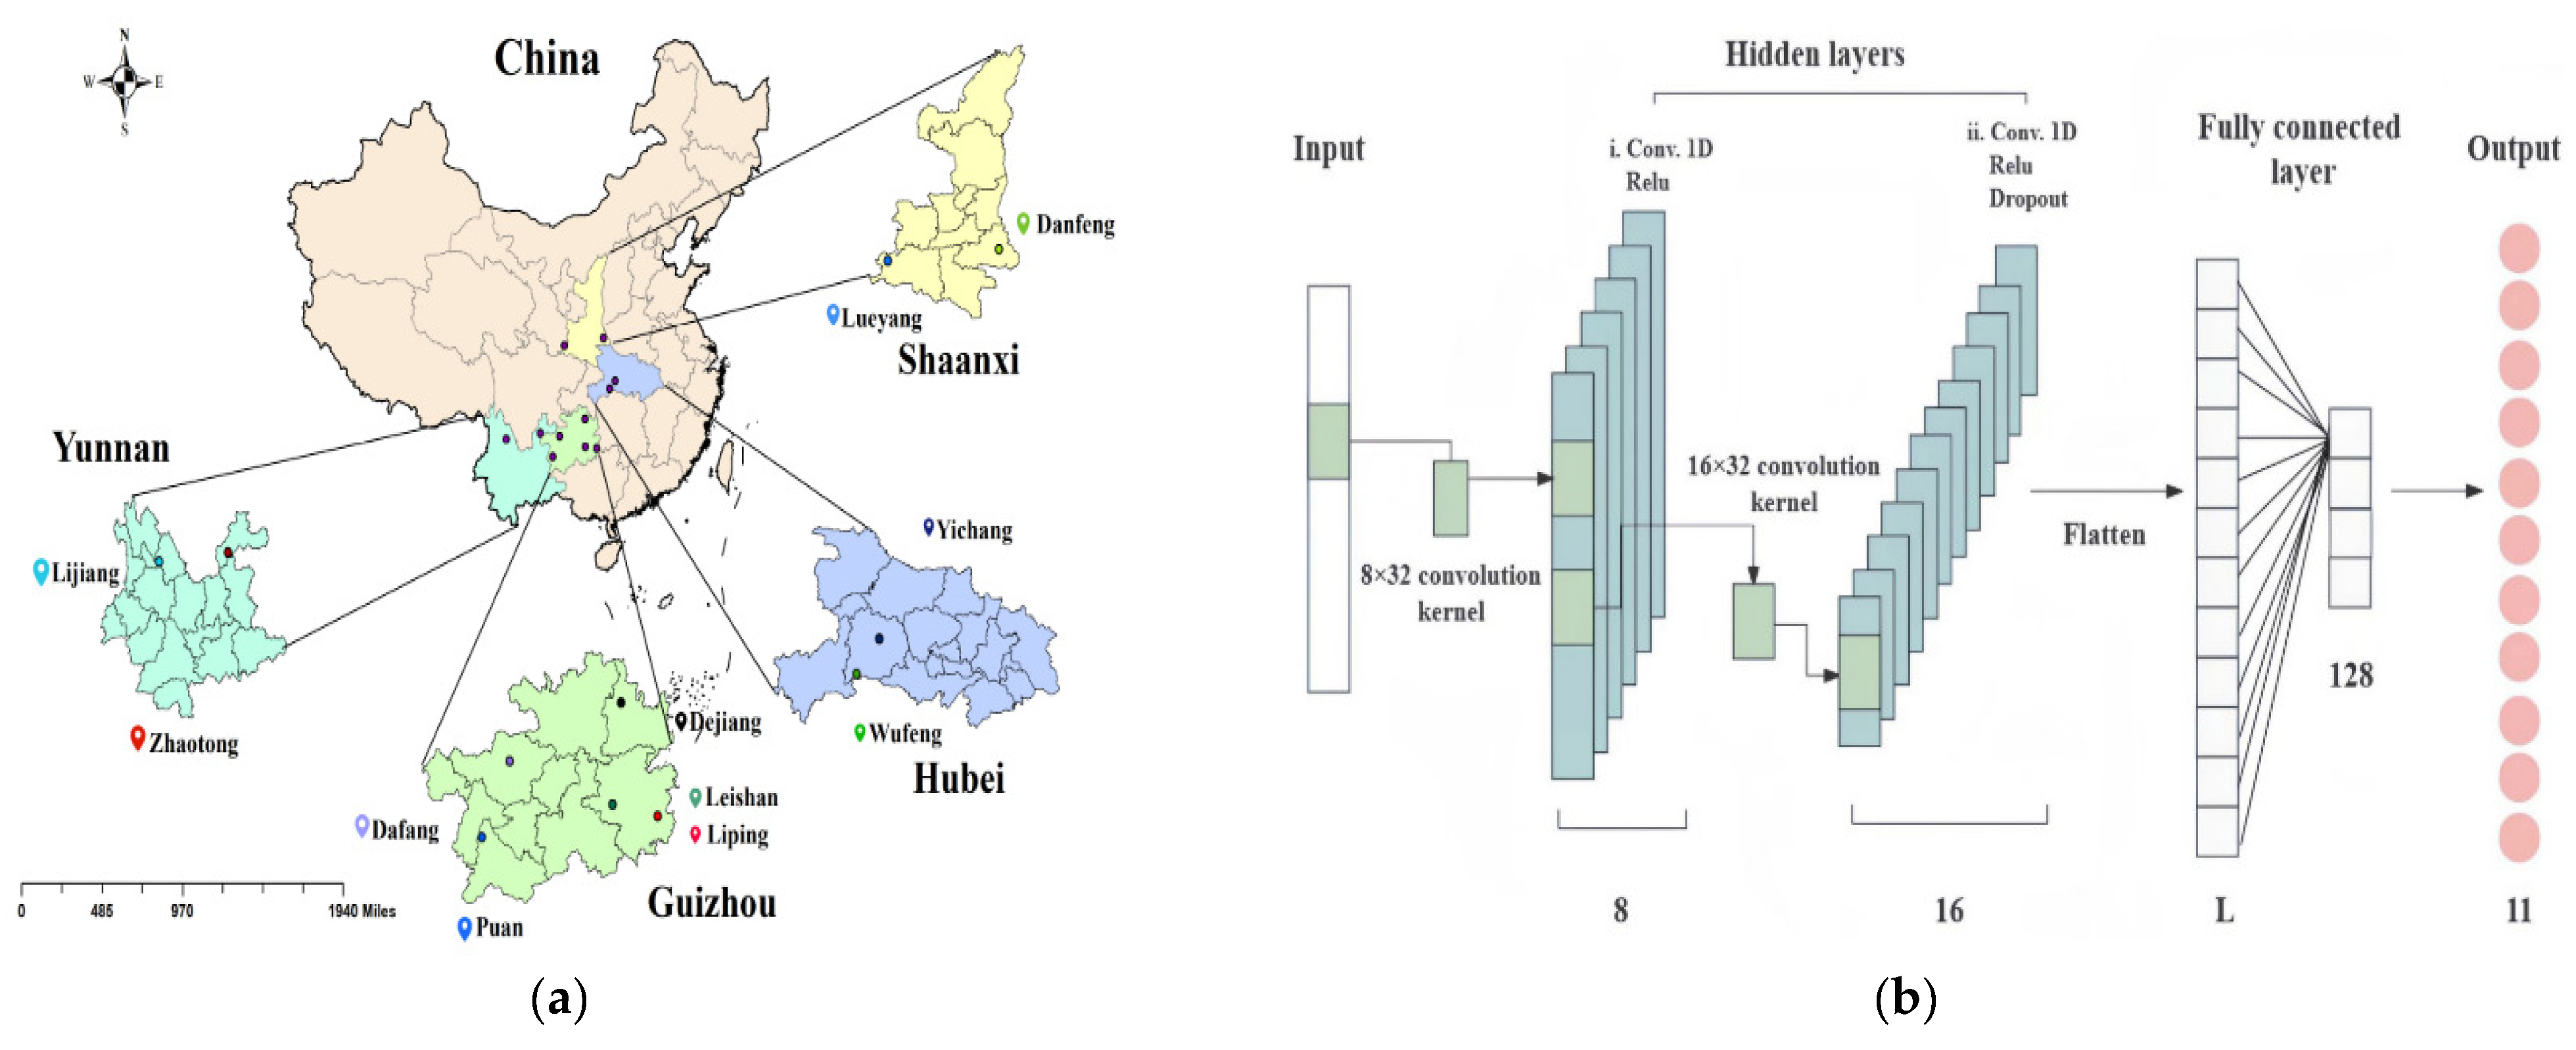
3.2.1. Near-Infrared Spectroscopy
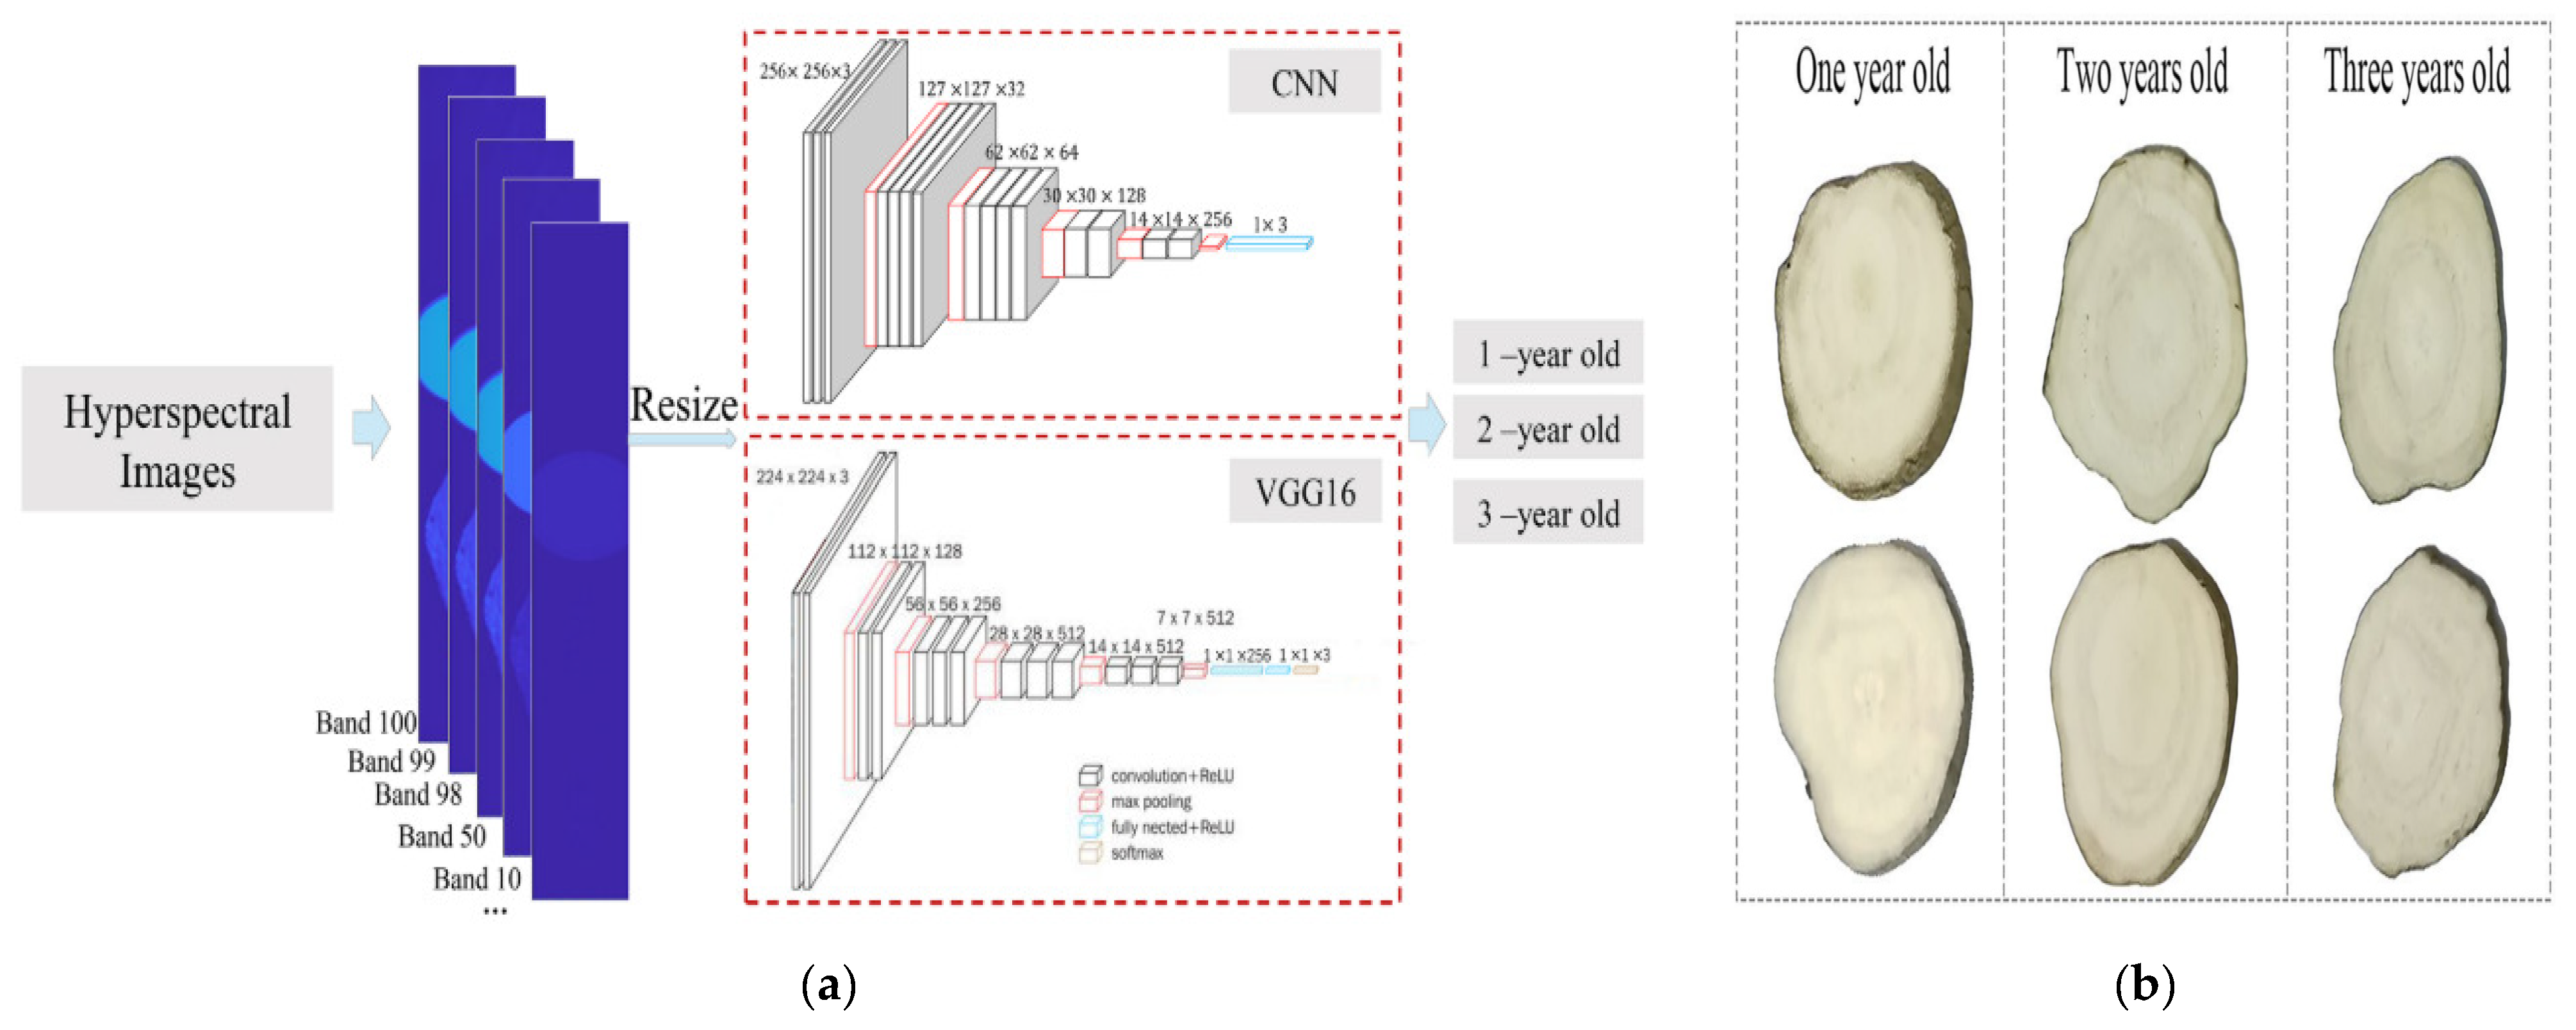
3.2.2. Hyperspectral Imaging
3.2.3. Terahertz Spectroscopy
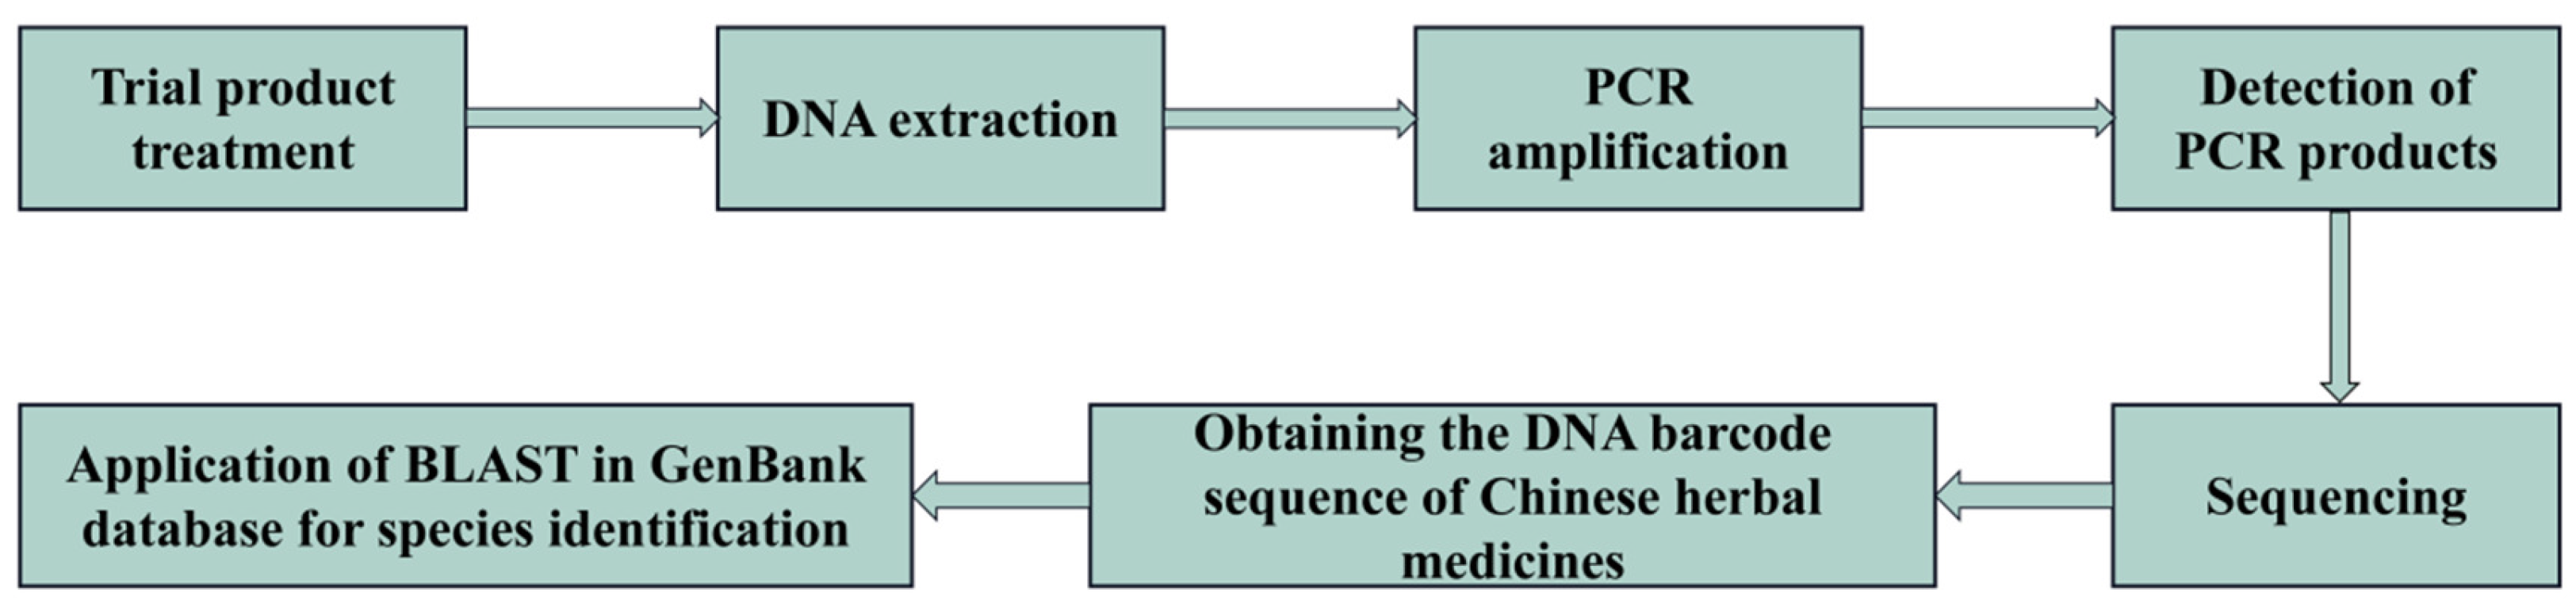
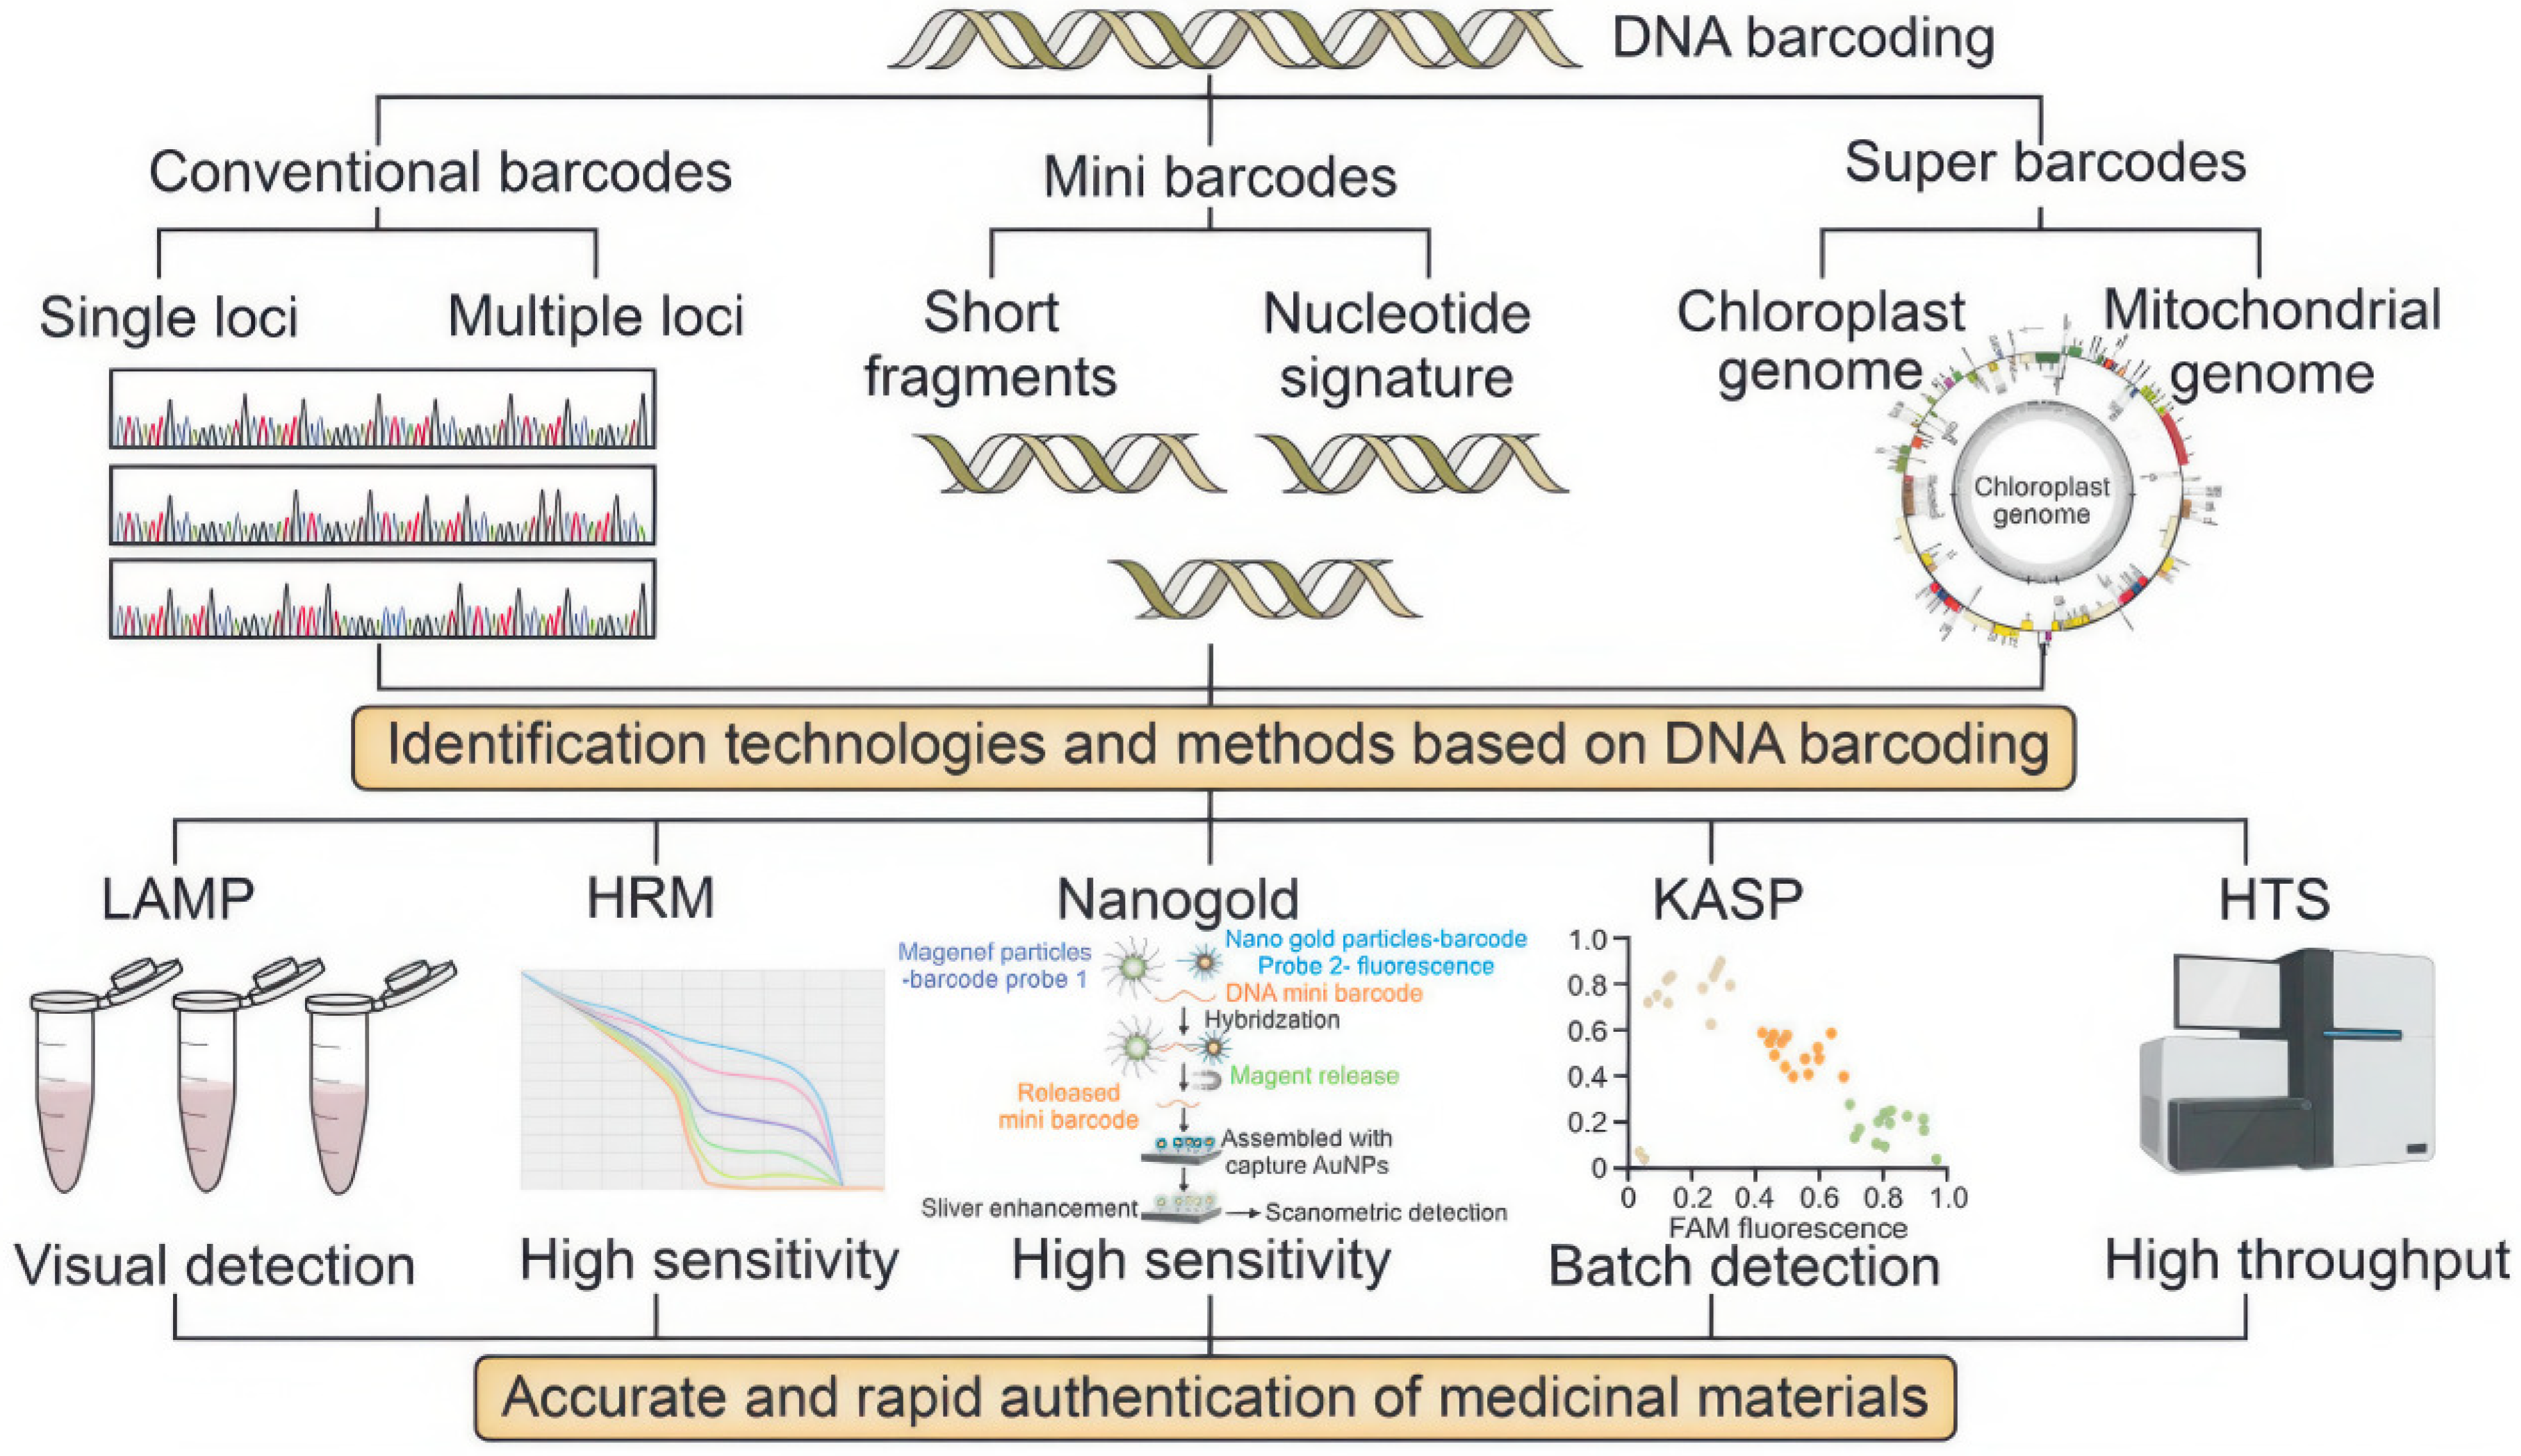
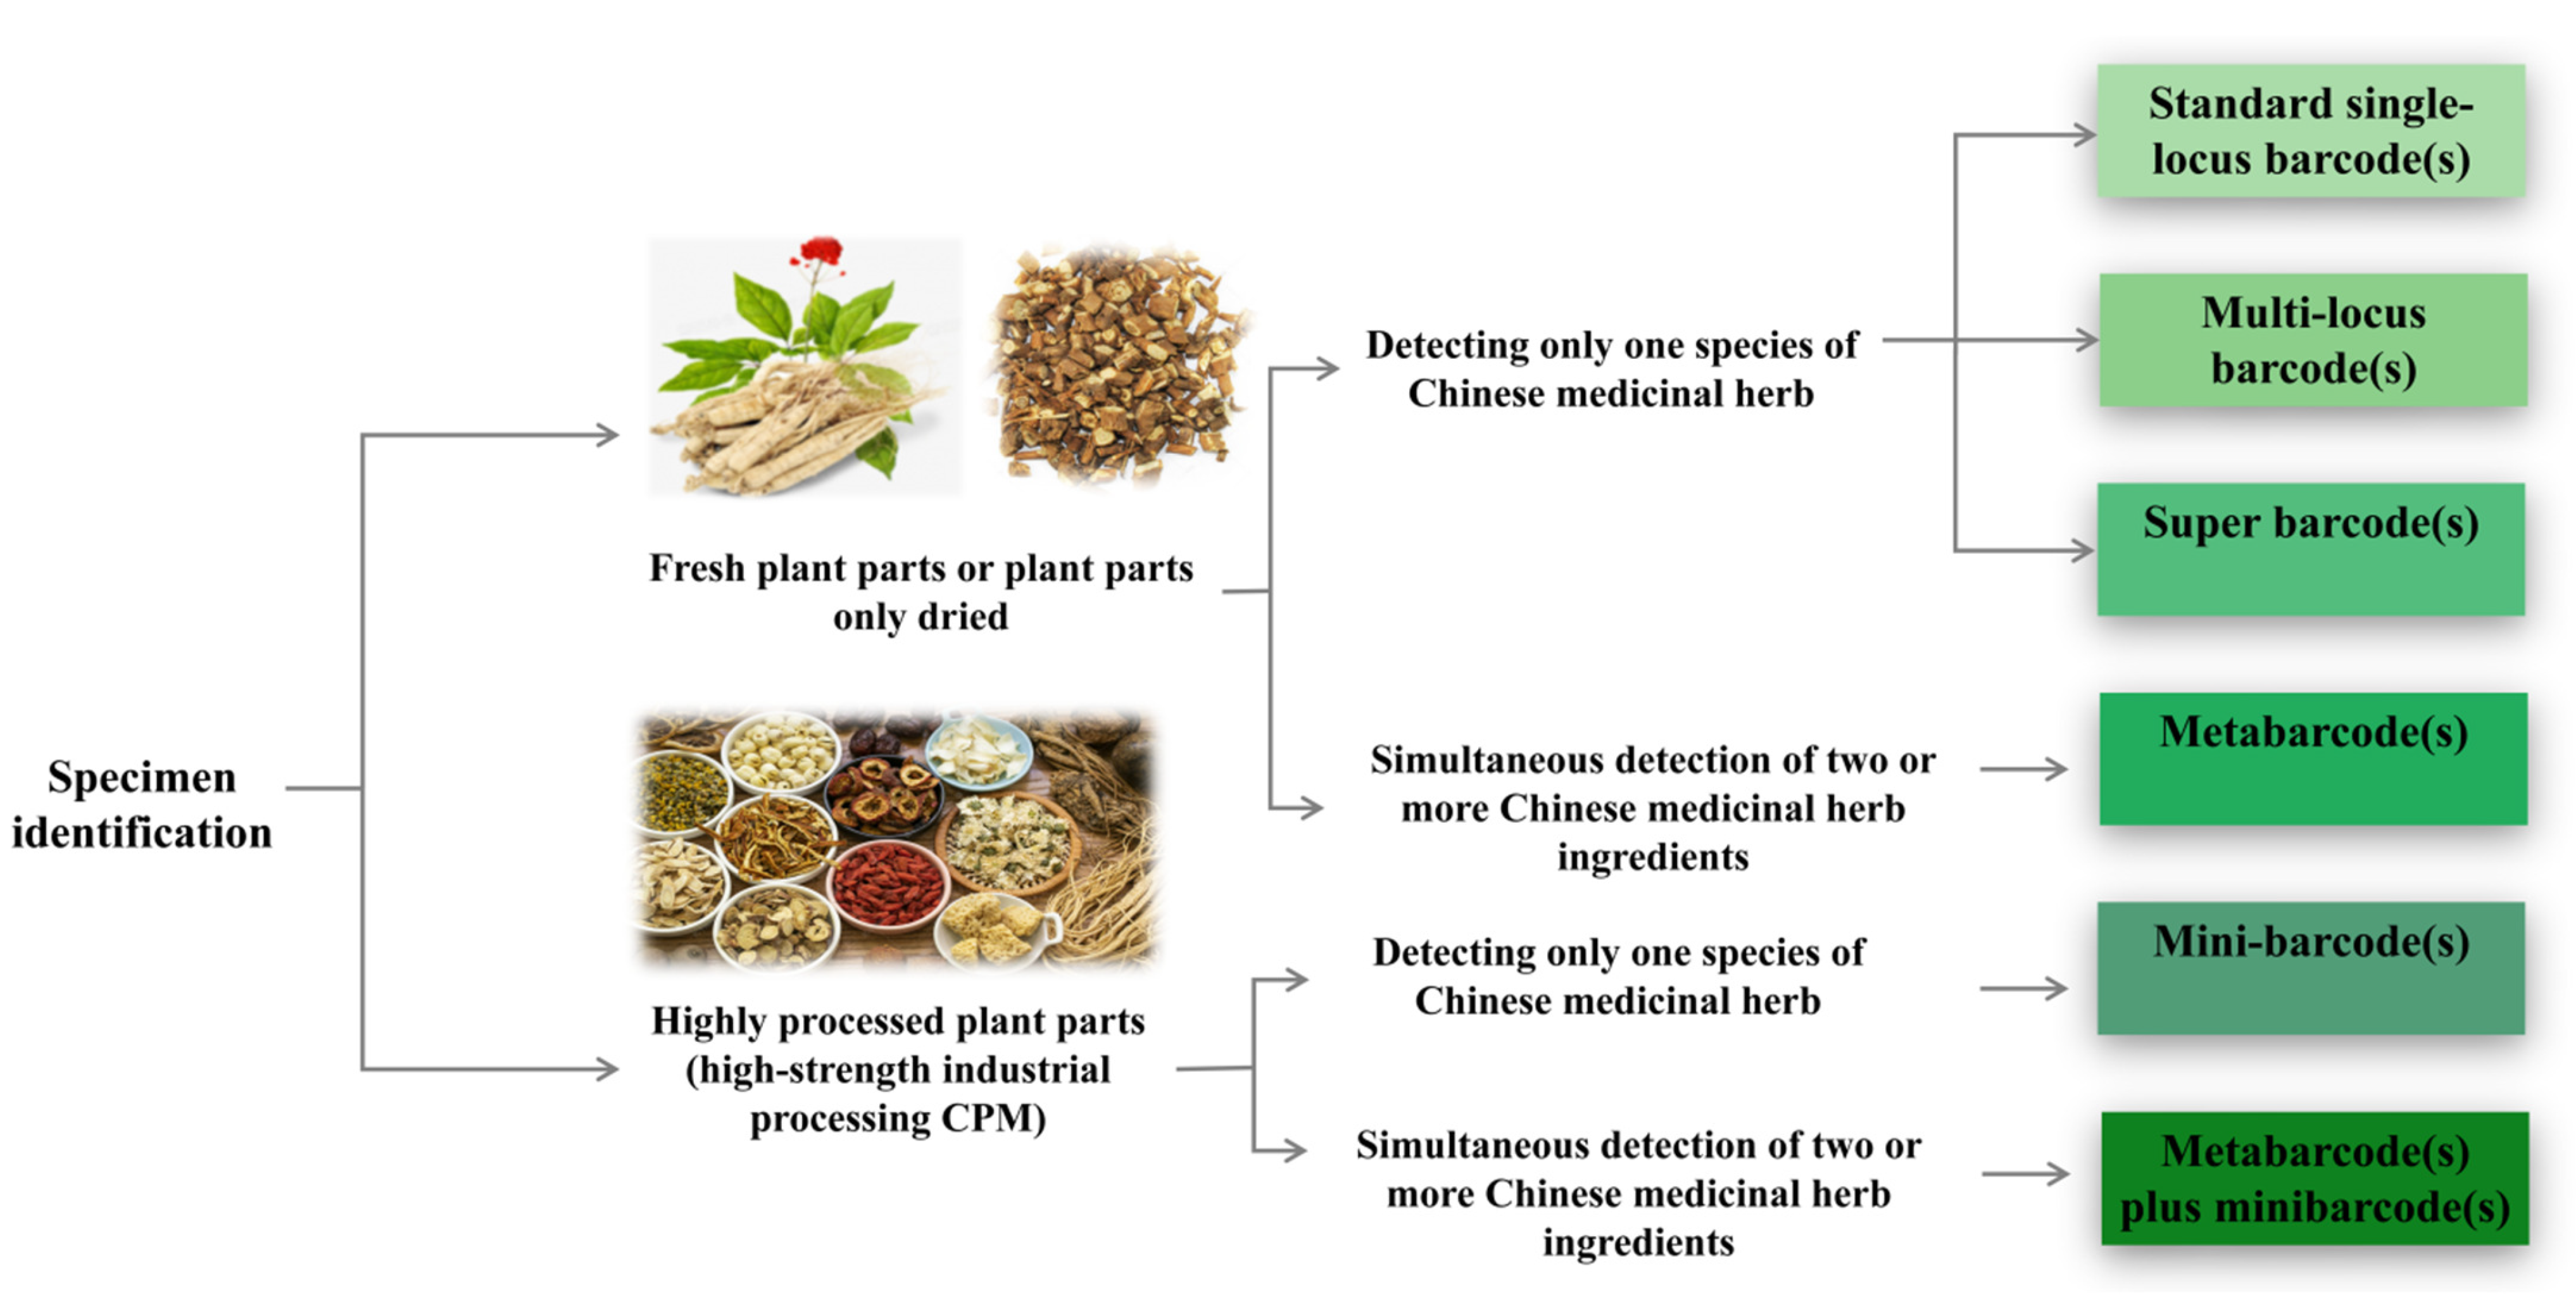
3.3. Methods for DNA Barcoding Identification
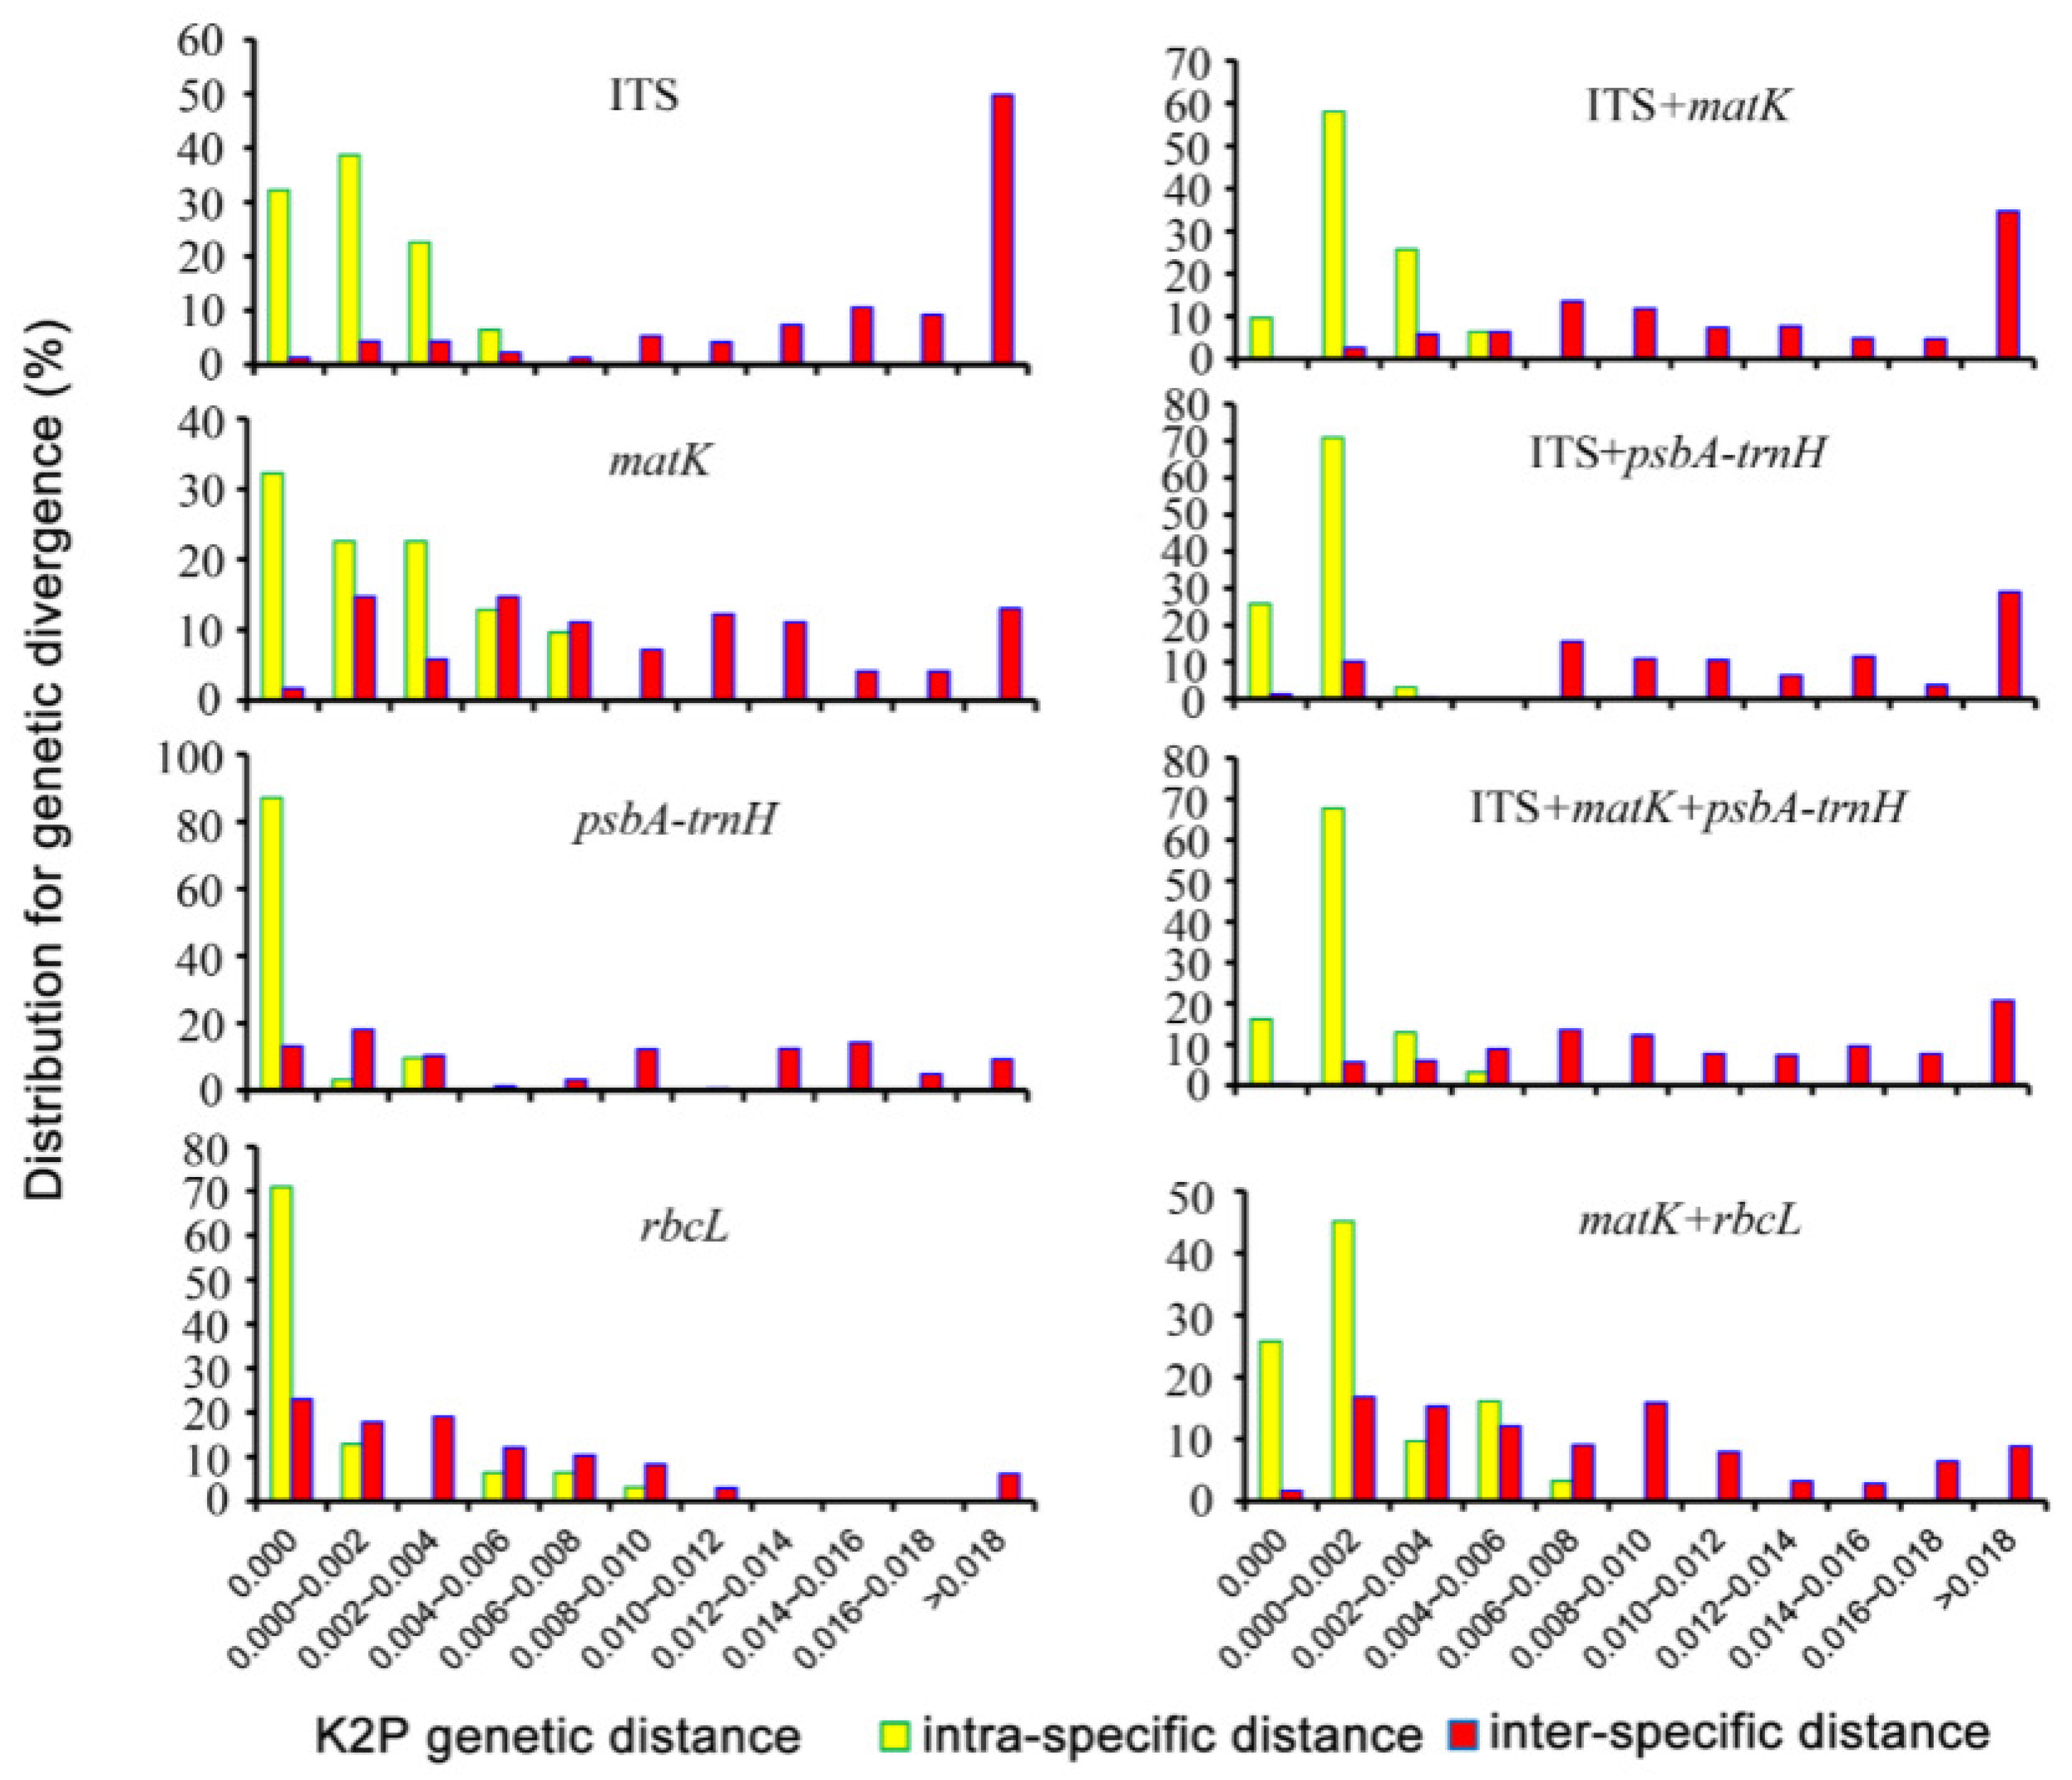
3.3.1. Ribosomal DNA Barcoding
3.3.2. Chloroplast DNA Barcoding
3.3.3. Micro DNA Barcoding
3.3.4. Super Barcoding and Metabarcoding
3.3.5. DNA Barcode Combination Method
4. Problems and Prospects
4.1. Existing Problems
- (1)
- Insufficient Datasets and Standardization Affecting Comprehensive Analysis of Medicinal Materials.
- (2)
- Multiple Factors Constrain the Improvement of Identification Accuracy.
- (3)
- Equipment Cost and Portability Limit the Scope of Application.
4.2. Outlook
- (1)
- Construction of Standardized Datasets for Comprehensive Analysis of Traditional Chinese Medicinal Materials.
- (2)
- Optimizing Multidimensional Factors for Improved Identification Accuracy.
- (3)
- Development of Low-Cost, Portable, and Real-Time Detection Devices.
5. Conclusions
Author Contributions
Funding
Institutional Review Board Statement
Informed Consent Statement
Data Availability Statement
Conflicts of Interest
Abbreviations
| SVM | Support Vector Machine |
| LDA | Linear Discriminant Analysis |
| TLC | Thin Layer Chromatography |
| HPLC | High-Performance Liquid Chromatography |
| HPLC–ELSD | High Performance Liquid Chromatography–Evaporative Light Scattering Detector |
| HPTLC | High-Performance Thin-Layer Chromatography |
| ICP-MS/MS | Inductively Coupled Plasma Tandem Mass Spectrometry |
| LC–MS | Liquid Chromatography–Mass Spectrometry |
| HCA | Hierarchical Clustering Analysis |
| CAMS | Clustering Algorithm based on Multi-Scale |
| SFA–MS | Sequential Forward Selection–Mass Spectrometry |
| NIR | Near-Infrared Spectroscopy |
| FT–NIR | Fourier Transform–Near-Infrared Spectroscopy |
| GA–PLS | Genetic Algorithm–Partial Least Squares |
| SNV | Standard Normal Variate |
| Vis–NIR | Visible–Near-Infrared Spectroscopy |
| HSI | Hyper spectral imaging |
| THz | Terahertz |
| THz–TDS | Terahertz Time–Domain Spectroscopy |
| OPLS-DA | Orthogonal Partial Least Squares-Discriminant Analysis |
| CNN | Convolutional Neural Network |
| PLSR | Partial Least Squares Regression |
| RF | Random Forest |
| ResNet | Residual Network |
| LAWOA | Lévy flight trajectory-based Whale Optimization Algorithm |
| matK | Megakaryocyte Associated Tyrosine Kinase |
| rbcL | Ribulose-1,5-bisphosphate carboxylase/oxygenase large subunit |
| ITS | Internal Transcribed Spacer |
| PCR | Polymerase Chain Reaction |
| K2P | Kimura 2-parameter distance |
| SNP | Single Nucleotide Polymorphism |
| HRM | High-resolution melting |
References
- Zhong, H.; Tang, Z.-Q.; Li, Y.-F.; Wang, M.; Sun, W.-Y.; He, R.-R. The evolution and significance of medicine and food homology. Acupunct. Herb. Med. 2024, 4, 19–35. [Google Scholar] [CrossRef]
- Hou, Y.; Jiang, J.-G. Origin and concept of medicine food homology and its application in modern functional foods. Food Funct. 2013, 4, 1727–1741. [Google Scholar] [CrossRef] [PubMed]
- Liu, Y.; Lu, C.; Zhou, J.; Zhou, F.; Gui, A.; Chu, H.; Shao, Q. Chrysanthemum morifolium as a traditional herb: A review of historical development, classification, phytochemistry, pharmacology and application. J. Ethnopharmacol. 2024, 330, 118198. [Google Scholar] [CrossRef]
- Tian, T.; Ko, C.-N.; Luo, W.; Li, D.; Yang, C. The anti-aging mechanism of ginsenosides with medicine and food homology. Food Funct. 2023, 14, 9123–9136. [Google Scholar] [CrossRef]
- Zuo, W.-F.; Pang, Q.; Yao, L.-P.; Zhang, Y.; Peng, C.; Huang, W.; Han, B. Gut microbiota: A magical multifunctional target regulated by medicine food homology species. J. Adv. Res. 2023, 52, 151–170. [Google Scholar] [CrossRef]
- Chen, L.-H.; Shan, Y.-H.; Guan, Y.-M.; Dong, H.-H.; Jiang, J.-A.; Liang, M.; Ma, Y.-N.; Zhang, Y.; Huang, T.-S. Research Progress on the Effect of Medicinal and Edible Substances on Improving Gastrointestinal Tract Function. Sci. Technol. Food Ind. 2023, 44, 480–487. [Google Scholar] [CrossRef]
- Pei, R.; Liu, X.; Bolling, B. Flavonoids and gut health. Curr. Opin. Biotechnol. 2020, 61, 153–159. [Google Scholar] [CrossRef]
- Li, B.; Lu, C.; Liu, Y.; Wang, X.; Fu, H.; Li, C.; Sun, M.; Zhang, Y.; Li, M. Antihypertensive effect and mechanism of the traditional recipe of medicine food homology (Buyang Huanwu Decoction) in China: Meta analysis and network pharmacological exploration. Heliyon 2024, 10, e23474. [Google Scholar] [CrossRef]
- Gong, X.; Ji, M.; Xu, J.; Zhang, C.; Li, M. Hypoglycemic effects of bioactive ingredients from medicine food homology and medicinal health food species used in China. Crit. Rev. Food Sci. Nutr. 2020, 60, 2303–2326. [Google Scholar] [CrossRef]
- Dong, X.; Cai, Y.; Liao, H.; Wang, Y.; Chen, Z.; Zhou, Y.; Wu, J.; Luo, Y.; Sheng, F.; Zhou, Z.; et al. Biological transformation of medicine and food homology hawthorn with Monascus ruber to enhance lipid-lowering function. Food Biosci. 2024, 58, 103825. [Google Scholar] [CrossRef]
- Jin, L.; Zhang, M.; Fang, S.; Xu, Q. Study on Lowering Uric Acid Effect and Component Analysis of Drug Food Homologous Compound Based on Zebrafish Model. Sci. Technol. Food Ind. 2023, 44, 410–416. [Google Scholar]
- Ma, A.; Zou, F.; Zhang, R.; Zhao, X. The effects and underlying mechanisms of medicine and food homologous flowers on the prevention and treatment of related diseases. J. Food Biochem. 2022, 46, e14430. [Google Scholar] [CrossRef] [PubMed]
- Kopustinskiene, D.M.; Jakstas, V.; Savickas, A.; Bernatoniene, J. Flavonoids as Anticancer Agents. Nutrients 2020, 12, 457. [Google Scholar] [CrossRef] [PubMed]
- Yang, Z.; Wang, H.; Qi, G.; Chen, G.; Cao, C.; Wang, S. Antimicrobial effects of a compound solution of three medicine food homology plants. Food Biosci. 2022, 49, 101845. [Google Scholar] [CrossRef]
- Pan, D.; Gong, X.; Wang, X.; Li, M. Role of Active Components of Medicinal Food in the Regulation of Angiogenesis. Front. Pharmacol. 2021, 11, 594050. [Google Scholar] [CrossRef]
- Sánchez, M.; Romero, M.; Gómez-Guzmán, M.; Tamargo, J.; Pérez-Vizcaino, F.; Duarte, J. Cardiovascular Effects of Flavonoids. Curr. Med. Chem. 2019, 26, 6991–7034. [Google Scholar] [CrossRef]
- Jiang, J.; Ou, H.; Chen, R.; Lu, H.; Zhou, L.; Yang, Z. The Ethnopharmacological, Phytochemical, and Pharmacological Review of Euryale ferox Salisb.: A Chinese Medicine Food Homology. Molecules 2023, 28, 4399. [Google Scholar] [CrossRef]
- Xiang, Q.; Zhang, G.-T.; Lu, R.-Q.; Tang, J.-W.; He, S.-Q.; Min, C.; Geng, J.-Z. Research Progress on the Alleviation of Alcoholic Liver Injury Based on Bibliometric Analysis of Medicinal and Food Homologous Substances. Sci. Technol. Food Ind. 2024, 45, 1–11. [Google Scholar] [CrossRef]
- Spence, C. Ginger: The pungent spice. Int. J. Gastron. Food Sci. 2023, 33, 100793. [Google Scholar] [CrossRef]
- Spence, C. Cinnamon: The historic spice, medicinal uses, and flavour chemistry. Int. J. Gastron. Food Sci. 2024, 35, 100858. [Google Scholar] [CrossRef]
- Wang, L.X.; Tan, S.W.; Wang, P.; Yan, H.Y.; Tian, H.L.; Zhan, P. Effects of Zanthoxylum bungeanum M. and Capsicum annuum L. oil on the formation of aroma characteristics of Jiao-ma chicken as evaluated by GC-MS and E-nose. Food Sci. Technol. 2022, 42, e56022. [Google Scholar] [CrossRef]
- Wang, L.Y.; Zhang, J.J.; Wang, C.; Wang, J.X.; Zhu, Y.L.; Wang, J.; Gao, X.M. Understanding and development strategy of health food containing Chinese materia medica. Chin. J. Chin. Mater. Medica 2016, 41, 3927–3930. [Google Scholar]
- Lam, M.; Hoshkhat, P.; Chamani, M.; Shahsavari, S.; Dorkoosh, F.A.; Rajabi, A.; Maniruzzaman, M.; Nokhodchi, A. In-depth multidisciplinary review of the usage, manufacturing, regulations & market of dietary supplements. J. Drug Deliv. Sci. Technol. 2021, 62, 102985. [Google Scholar]
- Zovi, A.; Vitiello, A.; Sabbatucci, M.; Musazzi, U.M.; Sagratini, G.; Cifani, C.; Vittori, S. Food supplements marketed worldwide: A comparative analysis between the European and the U.S. regulatory frameworks. J. Diet. Suppl. 2025, 22, 25–40. [Google Scholar] [CrossRef]
- Soare, I.; Zugravu, C.L.; Zugravu, G.A. Research on Consumer Perception Regarding Traditional Food Products of Romania. Foods 2023, 12, 2723. [Google Scholar] [CrossRef]
- Djaoudene, O.; Romano, A.; Bradai, Y.D.; Zebiri, F.; Ouchene, A.; Yousfi, Y.; Amrane-Abider, M.; Sahraoui-Remini, Y.; Madani, K. A Global Overview of Dietary Supplements: Regulation, Market Trends, Usage during the COVID-19 Pandemic, and Health Effects. Nutrients 2023, 15, 3320. [Google Scholar] [CrossRef]
- Hegazy, N.; Sayed, H.A.; Hasan, A.A.; Salem, M.R. Popularity of the Consumption of Dietary Supplements and its Associated Factors among Students in an Egyptian University: A Cross-sectional Study. Open Access Maced. J. Med. Sci. 2020, 8, 566–573. [Google Scholar] [CrossRef]
- Food Safety Standards and Monitoring and Evaluation Division. Available online: http://www.nhc.gov.cn/sps/s7890/202408/01f4b82eff294f4182102cf43e2e898e.shtml (accessed on 7 February 2025).
- Wang, T.; Yang, X.; Wang, D.; Jiao, Y.; Wang, Y.; Zhao, Y. Analysis of compositional carbohydrates in polysaccharides and foods by capillary zone electrophoresis. Carbohydr. Polym. 2012, 88, 754–762. [Google Scholar] [CrossRef]
- Zhang, Z.P. The Japanese Health Functional Food Market Approval System. Mod. Chin. Med. 2014, 16, 164–171. [Google Scholar]
- Li, R.S.; Li, H.B. Functions establishment of Chinese herbal medicine preparations as dietary supplements in US dietary supplement market. Chin. Tradit. Herb. Drugs 2016, 47, 862–864. [Google Scholar]
- Amidžić, M.; Banović Fuentes, J.; Banović, J.; Torović, L. Notifications and Health Consequences of Unauthorized Pharmaceuticals in Food Supplements. Pharmacy 2023, 11, 154. [Google Scholar] [CrossRef] [PubMed]
- Xue, H.; Wang, W.; Bian, J.; Gao, Y.; Hao, Z.; Tan, J. Recent advances in medicinal and edible homologous polysaccharides: Extraction, purification, structure, modification, and biological activities. Int. J. Biol. Macromol. 2022, 222, 1110–1126. [Google Scholar] [CrossRef] [PubMed]
- Gupta, R.; Srivastava, D.; Sahu, M.; Tiwari, S.; Ambasta, R.K.; Kumar, P. Artificial intelligence to deep learning: Machine intelligence approach for drug discovery. Mol. Divers. 2021, 25, 1315–1360. [Google Scholar] [CrossRef]
- Zheng, W. Identification of Characteristics in the Methods for Identifying Traditional Chinese Medicine. World Latest Med. Inf. 2019, 19, 141. [Google Scholar] [CrossRef]
- Mo, J.-X.; Jiang, C.; Zhang, X.-Y. Comparison of Volatile Oil Components and Microscopic Characteristics of Pogostemon cablin and Agastache rugosa. J. Chin. Med. Mater. 2009, 32, 1675–1680. [Google Scholar] [CrossRef]
- Bathaie, S.Z.; Mousavi, S.Z. New Applications and Mechanisms of Action of Saffron and its Important Ingredients. Crit. Rev. Food Sci. Nutr. 2010, 50, 761–786. [Google Scholar] [CrossRef]
- Cao, H.; Zhang, Y.; Li, P.; Komatsu, K. Authentication of Medicinal Materials by Polymerase Chain Reaction–Restriction Fragment Length Polymorphism. Chin. Pharm. J. 2022, 7, 171–197. [Google Scholar]
- Li, R.-Q.; Wu, C.; Xu, L.; Ma, Y.-C.; Chen, Y.; Chao, Z.-M. Quality Evaluation of Fritillariae Cirrhosae Bulbus Based on Traditional Character Analysis. China Pharm. J. 2020, 55, 14–18. [Google Scholar] [CrossRef]
- Li, X.B.; Jiang, W.W.; Zhang, G.H.; Deng, Z.Y.; Wang, S.; Tian, X.Z.; Guo, Q.S.; Yang, S.C. Research and utilization of precious Chinese medicine resources of Panax vietnamensis. Chin. Tradit. Herb. Drugs 2022, 53, 4568–4581. [Google Scholar]
- Chen, C.; Cheng, Y.; Zhang, F.; Yu, S.; Cui, X.; Wu, Y. A Comparative Analysis of Microbial Communities in the Rhizosphere Soil and Plant Roots of Healthy and Diseased Yuanyang Nanqi (Panax vietnamensis) with Root Rot. Agriculture 2024, 14, 719. [Google Scholar] [CrossRef]
- Cheng, Y.F.; Zhang, F.L.; Cui, X.M. Comparative Identification of Panax vietnamensis and Its Confusable Species. J. Chin. Med. Mater. 2023, 46, 62–66. [Google Scholar]
- Mao, W.-W.; Wan, X.-J.; Liu, H.-J.; Li, H.-J.; Li, P. Review and Applications of Microscopic Identification in Quality Standard of Chinese Herbal Medicines. World Sci. Technol. 2014, 16, 538–542. [Google Scholar]
- Huang, H.X.; Wang, D. Study on Exclusive and Stability of Characteristics of Microscope of Chinese Drug Powder. Prim. J. Chin. Mater. Medica 2000, 14, 3–5. [Google Scholar]
- World Health Organization. Quality Control Methods for Herbal Materials, Updated ed.; World Health Organization: Geneva, Switzerland, 2011; ISBN 978-92-4-150073-9. [Google Scholar]
- Gou, Z.-P.; Wan, D.-G. Identification of Plant Origins of Commercial Flos Lonicerae Processing in Sichuan and Chongqing by Scanning Electron Microscope. Lishizhen Med. Mater. Medica Res. 2008, 19, 2507–2508. [Google Scholar]
- Yan, H.; Shi, R.-B. Research on the Quality Control System of Dendrobium Officinale; Beijing University of Chinese Medicine: Beijing, China, 2015. [Google Scholar]
- Zhao, Y.; Man, Y.; Wen, J.; Guo, Y.; Lin, J. Advances in Imaging Plant Cell Walls. Trends Plant Sci. 2019, 24, 867–876. [Google Scholar] [CrossRef]
- DeVree, B.T.; Steiner, L.M.; Głazowska, S.; Ruhnow, F.; Herburger, K.; Persson, S.; Mravec, J. Current and future advances in fluorescence-based visualization of plant cell wall components and cell wall biosynthetic machineries. Biotechnol. Biofuels 2021, 14, 78. [Google Scholar] [CrossRef]
- Liu, L.; Liu, K.-J.; Kang, T.-G. Calcium oxalate crystals and their application in the microscopic identification of traditional Chinese medicine. J. Liaoning Univ. Tradit. Chin. Med. 2007, 9, 70–71. [Google Scholar] [CrossRef]
- Zhao, Z.; Shimomura, H.; Sashida, Y. Identification of Traditional Chinese Patent Medicines by a Polariscope (1) Polariscopic Characteristics of Starch Grains and Calcium Oxalate Crystals. Nat. Med. 1996, 50, 389–398. [Google Scholar]
- Liu, L.; Zhai, Y.; Kang, T. Exploration of Practical Teaching Methods in Traditional Chinese Medicine Authentication. J. Liaoning Univ. Tradit. Chin. Med. 2007, 9, 253–254. [Google Scholar]
- National Pharmacopoeia Commission of China. Chinese Pharmacopoeia; Chemical Industry Press: Beijing, China, 2005; Volume 1. [Google Scholar]
- Cui, H.B. My Experience with the “Flora of China” for Thirty Years. China Sci. Hist. 2008, 29, 73–89. [Google Scholar]
- Yu, Y.; Zhang, M.; Fang, S.Q. Extraction, Purification, and Separation of Alkaloids from Trigonella foenum-graecum. Master’s Thesis, Jilin Agricultural University, Changchun, China, 2012. [Google Scholar]
- Peng, A.-H.; Xi, Y.-Q.; Wu, M.-L.; Zou, F.-P.; Qiu, H.-O. Application of Fluorimetry in Pharmaceutical Analysis. J. Wuhan Inst. Technol. 2007, 29, 20–24. [Google Scholar]
- Li, Y. Fluorescence Analysis Methods for Chinese Herbal Medicine Cortex Fraxini and Its Active Components. Master’s Thesis, China University of Geosciences, Wuhan, China, 2007. [Google Scholar]
- Ding, Y. Comparative Identification of Papaya and Its Adulterants. Heilongjiang Med. J. 2007, 20, 410–416. [Google Scholar]
- Zhou, J.-L.; Yang, Q.-S. Microscopic Characteristics Identification of Chinese Materia Medica. J. Anhui TCM Coll. 2011, 30, 66–68. [Google Scholar]
- Chen, S.-L.; Guo, B.-L.; Zhang, G.-J.; Yan, Z.-Y.; Luo, G.-M.; Sun, S.-Q.; Wu, H.-Z.; Huang, L.-F.; Pang, X.-H.; Chen, J.-B. Advances of Studies on New Technology and Method for Identifying Traditional Chinese Medicinal Materials. Chin. J. Integr. Med. 2012, 37, 1043–1055. [Google Scholar]
- Ma, Y.-Y.; Lu, X.-L.; Zhai, M.; Yang, Y. Micromorphological comparative identification between several Chinese herbal medicines and their counterfeits. J. Adv. Res. 2012, 37, 1161–1164. [Google Scholar] [CrossRef]
- Yang, D.-F. Micromorphological identification method in the quality evaluation of traditional Chinese medicine. Spec. Econ. Anim. Plants 2024, 2, 167–174. [Google Scholar]
- Chang, X.; Chen, X.; Guo, Y.; Gong, P.; Pei, S.; Wang, D.; Wang, P.; Wang, M.; Chen, F. Advances in Chemical Composition, Extraction Techniques, Analytical Methods, and Biological Activity of Astragali Radix. Molecules 2022, 27, 1058. [Google Scholar] [CrossRef]
- Geraldes, C.F.G.C. Introduction to Infrared and Raman-Based Biomedical Molecular Imaging and Comparison with Other Modalities. Molecules 2020, 25, 5547. [Google Scholar] [CrossRef]
- Han, K.; Wang, M.; Zhang, L.; Wang, C. Application of Molecular Methods in the Identification of Ingredients in Chinese Herbal Medicines. Molecules 2018, 23, 2728. [Google Scholar] [CrossRef]
- Chen, S.; Yin, X.; Han, J.; Sun, W.; Yao, H.; Song, J.; Li, X. DNA barcoding in herbal medicine: Retrospective and prospective. J. Pharm. Anal. 2023, 13, 431–441. [Google Scholar] [CrossRef]
- Jin, C.-Y.; Cui, Y.; Wang, Y. The Electronic Nose (EN) and Its Recent Application in Many Fields. Sens. Actuators B 2010, 145, 6–10. [Google Scholar]
- Wu, L.; Zheng, D.; Zheng, B.; Lin, A.; Pan, J. Study of Zanthoxylum Bungeanum Varieties Discriminating Method by Electronic Nose Technology. Chin. J. Sens. Actuators 2013, 26, 1473–1476. [Google Scholar] [CrossRef]
- Gan, Y.; Yang, T.; Gu, W.; Guo, L.; Qiu, R.; Wang, S.; Zhang, Y.; Tang, M.; Yang, Z. Using HS-GC-MS and flash GC e-nose in combination with chemometric analysis and machine learning algorithms to identify the varieties, geographical origins and production modes of Atractylodes lancea. Ind. Crops Prod. 2024, 209, 117955. [Google Scholar] [CrossRef]
- Modzelewska-Kapituła, M.; Jun, S. The application of computer vision systems in meat science and industry—A review. Meat Sci. 2022, 192, 108904. [Google Scholar] [CrossRef] [PubMed]
- Wu, X.; Liang, X.; Wang, Y.; Wu, B.; Sun, J. Non-Destructive Techniques for the Analysis and Evaluation of Meat Quality and Safety: A Review. Foods 2022, 11, 3713. [Google Scholar] [CrossRef]
- Li, H.; Wang, P.-P.; Lin, Z.-Z.; Wang, Y.-L.; Gui, X.-J.; Fan, X.-H.; Dong, F.-Y.; Zhang, P.-P.; Li, X.-L.; Liu, R.-X. Identification of Bletilla striata and related decoction pieces: A data fusion method combining electronic nose, electronic tongue, electronic eye, and high-performance liquid chromatography data. Front. Chem. 2024, 11, 1342311. [Google Scholar] [CrossRef]
- Gui, X.-J.; Li, H.; Ma, R.; Tian, L.-Y.; Hou, F.-G.; Li, H.-Y.; Fan, X.-H.; Wang, Y.-L.; Yao, J.; Shi, J.-H.; et al. Authenticity and species identification of Fritillariae cirrhosae: A data fusion method combining electronic nose, electronic tongue, electronic eye and near infrared spectroscopy. Front. Chem. 2023, 11, 1179039. [Google Scholar] [CrossRef]
- Ma, S.; Li, Y.; Peng, Y. Spectroscopy and computer vision techniques fornoninvasive analysis of legumes: A review. Comput. Electron. Agric. 2023, 206, 107695. [Google Scholar] [CrossRef]
- Deng, S.; Tian, S. Progress and its Technique Background of the Electronic Tongue. J. Food Sci. Biotechnol. 2007, 26, 110–117. [Google Scholar]
- Hu, J.; Li, R.; Wang, P. Research on Artificial Gustatory System—Electronic Tongue. J. Sens. Technol. 2001, 2, 169–179. [Google Scholar]
- Yan, Y.-Z.; Zeng, Y. Study on the Characterization of Trace Elements and Heavy Metals in Lycium ruthenicum Murray and Establishing a Simple Method to Trace Their Geographical Origins. J. Adv. Res. 2023, 52, 151–170. [Google Scholar]
- Li, H.; Gui, X.; Wang, P.; Yue, Y.; Li, H.; Fan, X.; Li, X.; Liu, R. Research on rapid quality identification method of Panax notoginseng powder based on artificial intelligence sensory technology and multi-source information fusion technology. Food Chem. 2024, 440, 138210. [Google Scholar] [CrossRef] [PubMed]
- Fu, X.; Mervin, L.H.; Li, X.; Yu, H.; Li, J.; Mohamad Zobir, S.Z.; Zoufir, A.; Zhou, Y.; Song, Y.; Wang, Z.; et al. Toward Understanding the Cold, Hot, and Neutral Nature of Chinese Medicines Using in Silico Mode-of-Action Analysis. J. Chem. Inf. Model. 2017, 57, 468–483. [Google Scholar] [CrossRef]
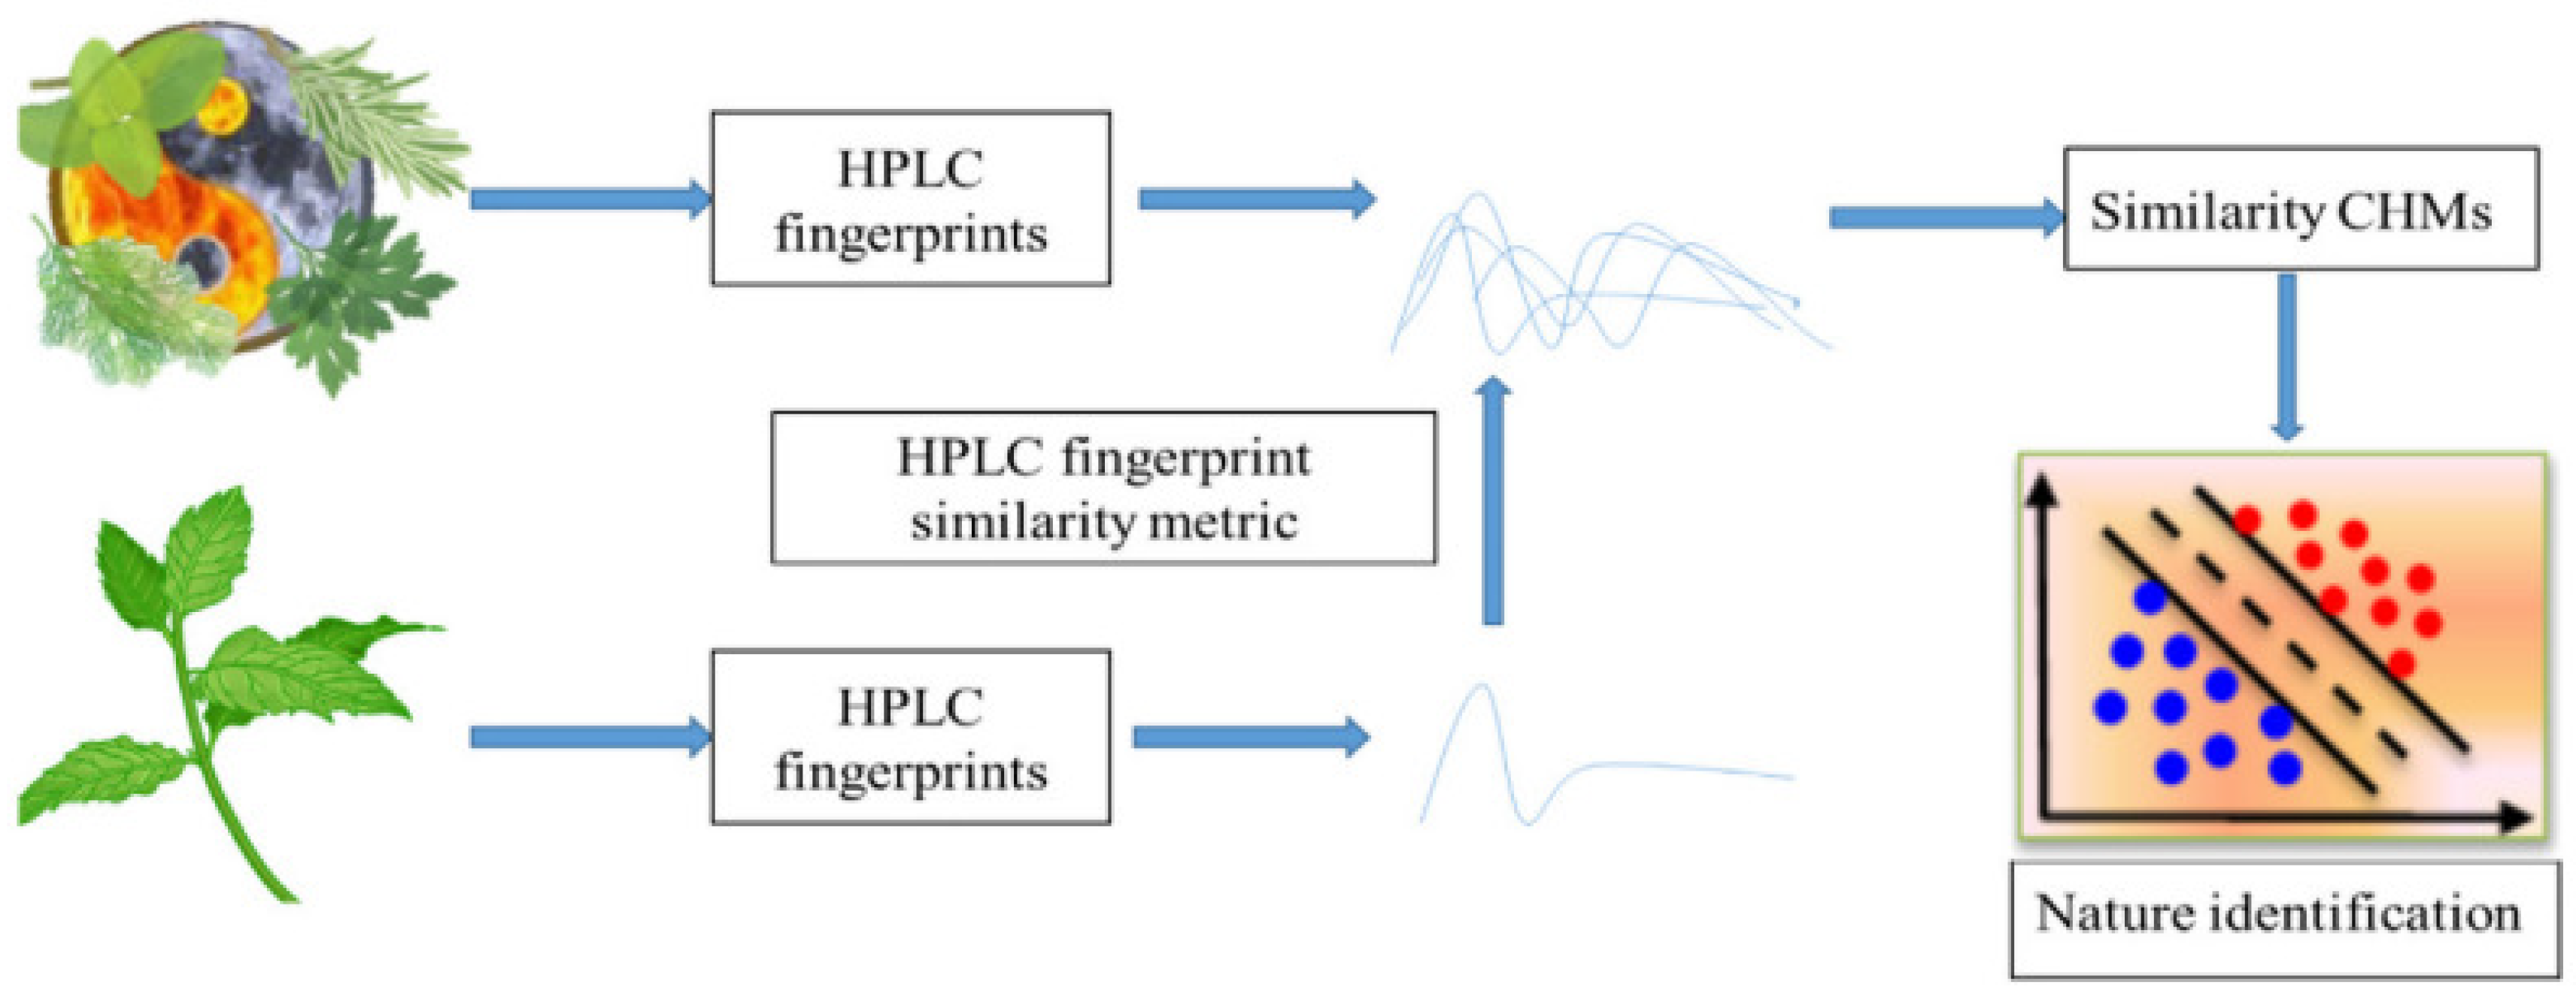
- Wei, G.; Jia, R.; Kong, Z.; Ji, C.; Wang, Z. Cold-hot nature identification of Chinese herbal medicines based on the similarity of HPLC fingerprints. Front. Chem. 2022, 10, 1002062. [Google Scholar] [CrossRef]
- Tian, R.-t.; Xie, P.-s.; Liu, H.-p. Evaluation of traditional Chinese herbal medicine: Chaihu (Bupleuri Radix) by both high-performance liquid chromatographic and high-performance thin-layer chromatographic fingerprint and chemometric analysis. J. Chromatogr. A 2009, 1216, 2150–2155. [Google Scholar] [CrossRef]
- Chen, J.; Shi, Y.-P.; Liu, J.-Y. Determination of noradrenaline and dopamine in Chinese herbal extracts from Portulaca oleracea L. by high-performance liquid chromatography. J. Chromatogr. A 2003, 1003, 127–132. [Google Scholar] [CrossRef]
- Karch, K.R.; Snyder, D.T.; Harvey, S.R.; Wysocki, V.H. Native Mass Spectrometry: Recent Progress and Remaining Challenges. Annu. Rev. Biophys. 2022, 51, 157–179. [Google Scholar] [CrossRef]
- Food Safety Standards and Monitoring and Evaluation Division. Available online: http://www.nhc.gov.cn/sps/s7891/201301/16482cd1dec04196a4037d86104dcca9.shtml (accessed on 7 February 2025).
- Fu, L.; Shi, S.-Y.; Chen, X.-Q. Accurate quantification of toxic elements in medicine food homologous plants using ICP-MS/MS. Food Chem. 2018, 245, 692–697. [Google Scholar] [CrossRef]
- Wang, Y.; Li, C.; Huang, L.; Liu, L.; Guo, Y.; Ma, L.; Liu, S. Rapid identification of traditional Chinese herbal medicine by direct analysis in real time (DART) mass spectrometry. Anal. Chim. Acta 2014, 845, 70–76. [Google Scholar] [CrossRef]
- Hu, X.-Y.; Yang, X.-Y.; Yao, J.-J.; Chen, X.; Du, J.-X.; Xin, J.; Zhang, B.; Chen, M. Research Progress of Technologies Used for Identification of Traditional Chinese Medicine on Scene. J. Pharm. Res. 2019, 38, 724–728. [Google Scholar] [CrossRef]
- Wu, W.-J.; Zhao, Z.-H.; Zhang, Y.; Zhou, W.-E.; Li, H.-N.; Zhang, C.-B.; Huang, Y.; Zhang, F. Research progress in LC-MS technology for the analysis of chemical composition from medicine and food dual purposes plants. J. Adv. Res. 2023, 52, 366–371. [Google Scholar] [CrossRef]
- Li, L.; Yu, Y.; Lu, D.; Chen, J.; Guo, J.; Liang, J.; Zhang, A.; Yang, Z. Bioassay-guided separation and identification of the anticancer composition from Curcuma longa L. by the combination strategy of methanol gradient countercurrent chromatography and ultra-high-performance liquid chromatography coupled with high-resolution mass spectrometry. J. Sep. Sci. 2022, 45, 4478–4490. [Google Scholar] [CrossRef] [PubMed]
- He, M.; Hong, L.; Zhou, Y. Multi-scale Gaussian/Haar wavelet strategies coupled with sub-window factor analysis for an accurate alignment in nontargeted metabolic profiling to enhance herbal origin discrimination capability. J. Sep. Sci. 2019, 42, 2003–2012. [Google Scholar] [CrossRef] [PubMed]
- Jia, L.; Wang, H.; Xu, X.; Wang, H.; Li, X.; Hu, Y.; Chen, B.; Liu, M.; Gao, X.; Li, H.; et al. An off-line three-dimensional liquid chromatography/Q-Orbitrap mass spectrometry approach enabling the discovery of 1561 potentially unknown ginsenosides from the flower buds of Panax ginseng, Panax quinquefolius and Panax notoginseng. J. Chromatogr. A 2022, 1675, 463177. [Google Scholar] [CrossRef]
- Gikas, E.; Koulakiotis, N.S.; Tsarbopoulos, A. Phytochemical Differentiation of Saffron (Crocus sativus L.) by High Resolution Mass Spectrometry Metabolomic Studies. Molecules 2021, 26, 2180. [Google Scholar] [CrossRef]
- Yoon, D.; Shin, W.-C.; Oh, S.-M.; Choi, B.-R.; Lee, D.Y. Integration of multiplatform metabolomics and multivariate analysis for geographical origin discrimination of Panax ginseng. Food Res. Int. 2022, 159, 111610. [Google Scholar] [CrossRef]
- Feng, K.; Wang, S.; Han, L.; Qian, Y.; Li, H.; Li, X.; Jia, L.; Hu, Y.; Wang, H.; Liu, M.; et al. Configuration of the ion exchange chromatography, hydrophilic interaction chromatography, and reversed-phase chromatography as off-line three-dimensional chromatography coupled with high-resolution quadrupole-Orbitrap mass spectrometry for the multicomponent characterization of Uncaria sessilifructus. J. Chromatogr. A 2021, 1649, 462237. [Google Scholar]
- Mustafa, A.M.; Angeloni, S.; Abouelenein, D.; Acquaticcia, L.; Xiao, J.; Sagratini, G.; Maggi, F.; Vittori, S.; Caprioli, G. A new HPLC-MS/MS method for the simultaneous determination of 36 polyphenols in blueberry, strawberry and their commercial products and determination of antioxidant activity. Food Chem. 2022, 367, 130743. [Google Scholar] [CrossRef]
- Stefanutto, P.-H.; Smolinska, A.; Focant, J.-F. Advanced chemometric and data handling tools for GC×GC-TOF-MS. Trends Anal. Chem. 2021, 139, 116251. [Google Scholar] [CrossRef]
- Medina, D.A.V.; Borsatto, J.V.B.; Maciel, E.V.S.; Lancas, F.M. Current role of modern chromatography and mass spectrometry in the analysis of mycotoxins in food. TrAC Trends Anal. Chem. 2021, 135, 116156. [Google Scholar] [CrossRef]
- Rohman, A.; Nugroho, A.; Lukitaningsih, E.; Sudjadi. Application of Vibrational Spectroscopy in Combination with Chemometrics Techniques for Authentication of Herbal Medicine. Appl. Spectrosc. Rev. 2014, 49, 603–613. [Google Scholar] [CrossRef]
- Liu, Y.; Xia, Z.; Yao, L.; Wu, Y.; Li, Y.; Zeng, S.; Li, H. Discriminating geographic origin of sesame oils and determining lignans by near-infrared spectroscopy combined with chemometric methods. J. Food Compos. Anal. 2019, 84, 103327. [Google Scholar] [CrossRef]
- Luypaert, J.; Massart, D.L.; Vander Heyden, Y. Near-infrared spectroscopy applications in pharmaceutical analysis. Talanta 2007, 72, 865–883. [Google Scholar] [CrossRef]
- Arslan, M.; Zou, X.; Hu, X.; Elrasheid Tahir, H.; Shi, J.; Khan, M.R.; Zareef, M. Near infrared spectroscopy coupled with chemometric algorithms for predicting chemical components in black goji berries (Lycium ruthenicum Murr.). J. Near Infrared Spectrosc. 2018, 26, 275–286. [Google Scholar] [CrossRef]
- Chen, H.; Lin, Z.; Tan, C. Fast discrimination of the geographical origins of notoginseng by near-infrared spectroscopy and chemometrics. J. Pharm. Biomed. Anal. 2018, 161, 239–245. [Google Scholar] [CrossRef]
- Ma, J.; Zhou, X.; Xie, B.; Wang, C.; Chen, J.; Zhu, Y.; Wang, H.; Ge, F.; Huang, F. Application for Identifying the Origin and Predicting the Physiologically Active Ingredient Contents of Gastrodia elata Blume Using Visible–Near-Infrared Spectroscopy Combined with Machine Learning. Foods 2023, 12, 4061. [Google Scholar] [CrossRef]
- Zhang, F.; Wang, C.; Pan, K.; Guo, Z.; Liu, J.; Xu, A.; Ma, H.; Pan, X. The Simultaneous Prediction of Soil Properties and Vegetation Coverage from Vis-NIR Hyperspectral Data with a One-Dimensional Convolutional Neural Network: A Laboratory Simulation Study. Remote Sens. 2022, 14, 397. [Google Scholar] [CrossRef]
- Mohammed Alsumaidaee, Y.; Yaw, C.; Koh, S.; Tiong, S.; Chen, C.; Yusaf, T.; Abdalla, A.; Ali, K.; Raj, A. Detection of Corona Faults in Switchgear by Using 1D-CNN, LSTM, and 1D-CNN-LSTM Methods. Sensors 2023, 23, 3108. [Google Scholar] [CrossRef]
- Kar, S.; Tudu, B.; Bag, A.K.; Bandyopadhyay, R. Application of Near-Infrared Spectroscopy for the Detection of Metanil Yellow in Turmeric Powder. Food Anal. Methods 2018, 11, 1291–1302. [Google Scholar] [CrossRef]
- Erkinbaev, C.; Henderson, K.; Paliwal, J. Discrimination of gluten-free oats from contaminants using near infrared hyperspectral imaging technique. Food Control 2017, 80, 197–203. [Google Scholar] [CrossRef]
- Lowe, A.; Harrison, N.; French, A.P. Hyperspectral image analysis techniques for the detection and classification of the early onset of plant disease and stress. Plant Methods 2017, 13, 80. [Google Scholar] [CrossRef] [PubMed]
- Karim, S.; Qadir, A.; Farooq, U.; Shakir, M.; Laghari, A.A. Hyperspectral Imaging: A Review and Trends towards Medical Imaging. Curr. Med. Imaging 2023, 19, 417–427. [Google Scholar] [CrossRef] [PubMed]
- Zhang, C.; Wu, W.; Zhou, L.; Cheng, H.; Ye, X.; He, Y. Developing deep learning based regression approaches for determination of chemical compositions in dry black goji berries (Lycium ruthenicum Murr.) using near-infrared hyperspectral imaging. Food Chem. 2020, 319, 126536. [Google Scholar] [CrossRef]
- Zhang, L.; Guan, Y.; Wang, N.; Ge, F.; Zhang, Y.; Zhao, Y. Identification of growth years for Puerariae Thomsonii Radix based on hyperspectral imaging technology and deep learning algorithm. Sci. Rep. 2023, 13, 14286. [Google Scholar] [CrossRef]
- Vermaak, I.; Viljoen, A.; Lindström, S.W. Hyperspectral imaging in the quality control of herbal medicines—The case of neurotoxic Japanese star anise. J. Pharm. Biomed. Anal. 2013, 75, 207–213. [Google Scholar] [CrossRef]
- Zou, L.; Li, H.; Ding, X.; Liu, Z.; He, D.; Kowah, J.A.H.; Wang, L.; Yuan, M.; Liu, X. A Review of The Application of Spectroscopy to Flavonoids from Medicine and Food Homology Materials. Molecules 2022, 27, 7766. [Google Scholar] [CrossRef]
- Huang, S.; Deng, H.; Wei, X.; Zhang, J. Progress in application of terahertz time-domain spectroscopy for pharmaceutical analyses. Front. Bioeng. Biotechnol. 2023, 11, 1219042. [Google Scholar] [CrossRef]
- Gezimati, M.; Singh, G. Advances in terahertz technology for cancer detection applications. Opt. Quantum Electron. 2022, 55, 151. [Google Scholar] [CrossRef]
- Shi, S.; Yuan, S.; Zhou, J.; Jiang, P. Terahertz technology and its applications in head and neck diseases. iScience 2023, 26, 107060. [Google Scholar] [CrossRef]
- Yang, Y.-Y.; Zhang, Y.; Zhao, J. Research Progress of Terahertz Technology in Crop Quality Detection. Appl. Laser 2024, 44, 366–371. [Google Scholar]
- Wu, J.-Z.; Li, X.-Q.; Sun, L.-J.; Liu, C.-L.; Sun, X.-R.; Yu, L. Advances in the Application of Terahertz Time-Domain Spectroscopy and Imaging Technology in Crop Quality Detection. Spectrosc. Spectr. Anal. 2022, 42, 358–367. [Google Scholar] [CrossRef]
- Abina, A.; Puc, U.; Jazbinšek, M.; Zidanšek, A. Analytical Gas Sensing in the Terahertz Spectral Range. Micromachines 2023, 14, 1987. [Google Scholar] [CrossRef]
- Pickwell, E.; Wallace, V.P. Biomedical applications of terahertz technology. J. Phys. D Appl. Phys. 2006, 39, R301. [Google Scholar] [CrossRef]
- Du, H.; Chen, W.; Lei, Y.; Li, F.; Li, H.; Deng, W.; Jiang, G. Discrimination of authenticity of Fritillariae Cirrhosae Bulbus based on terahertz spectroscopy and chemometric analysis. Microchem. J. 2021, 168, 106440. [Google Scholar] [CrossRef]
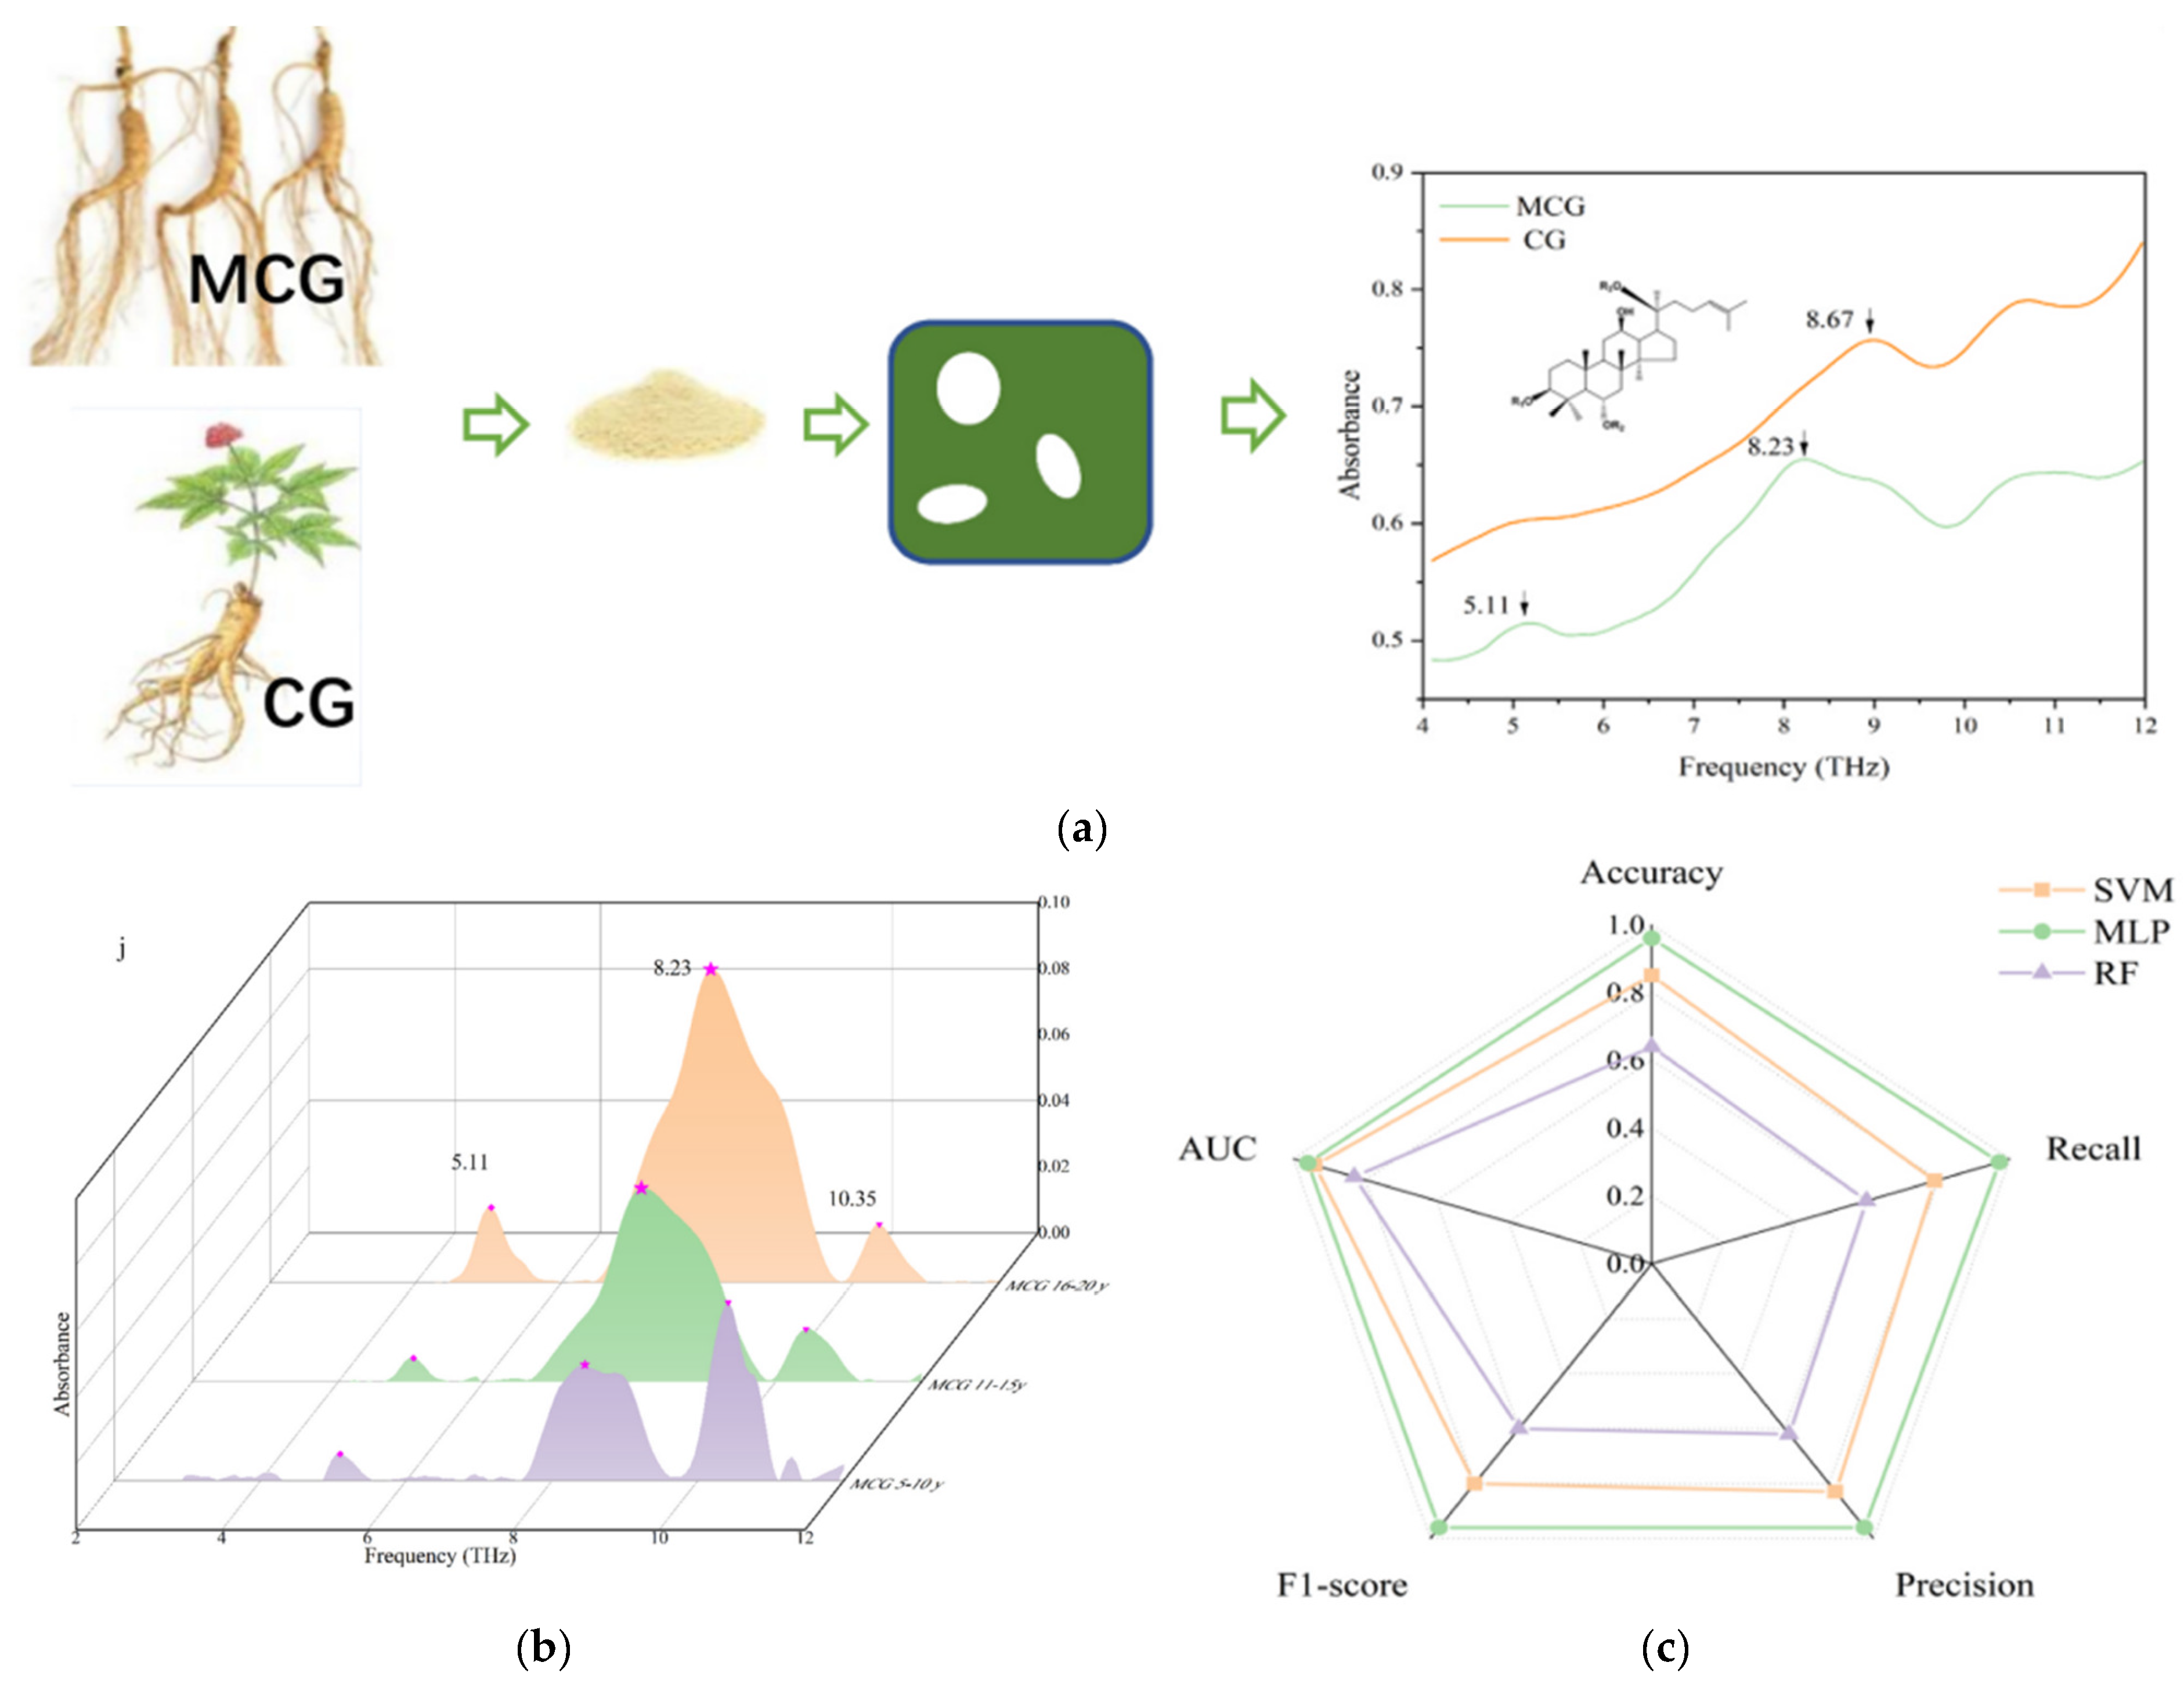
- Zhang, G.-M.; Hu, S.-Y.; Chen, G.; Huang, Q.; Gu, H.-Y.; Zheng, C.-W.; Peng, Y.; Xu, H.-X. Age identification of the root of Huanren mountain cultivated ginseng and differentiation with cultivated ginseng using terahertz spectroscopy. J. Food Compos. Anal. 2024, 125, 105790. [Google Scholar] [CrossRef]
- Li, Y.; Zhao, W.; Qian, M.; Wen, Z.; Bai, W.; Zeng, X.; Wang, H.; Xian, Y.; Dong, H. Recent advances in the authentication (geographical origins, varieties and aging time) of tangerine peel (Citri reticulatae pericarpium): A review. Food Chem. 2024, 442, 138531. [Google Scholar] [CrossRef]
- He, M.-X.; Guo, S.; Qin, R.; Liu, J.-Z. Terahertz Spectroscopy of Chinese Traditional Medicines and Hierarchical Clustering Analysis. Chin. J. Spectrosc. Lab. 2013, 30, 1044–1048. [Google Scholar]
- Yin, M.; Wang, J.; Huang, H.; Huang, Q.; Fu, Z.; Lu, Y. Analysis of Flavonoid Compounds by Terahertz Spectroscopy Combined with Chemometrics. ACS Omega 2020, 5, 18134–18141. [Google Scholar] [CrossRef]
- Yan, F.; Zhang, J.; Liu, C.-H.; Yu, Y. Principal Component Spectrum Analysis of Licorice Based on Terahertz Radiation. Infrared Technol. 2021, 43, 279–283. [Google Scholar]
- Kabir, M.H.; Guindo, M.L.; Chen, R.; Liu, F.; Luo, X.; Kong, W. Deep Learning Combined with Hyperspectral Imaging Technology for Variety Discrimination of Fritillaria thunbergii. Molecules 2022, 27, 6042. [Google Scholar] [CrossRef]
- Fatchurrahman, D.; Nosrati, M.; Amodio, M.L.; Chaudhry, M.M.A.; de Chiara, M.L.V.; Mastrandrea, L.; Colelli, G. Comparison Performance of Visible-NIR and Near-Infrared Hyperspectral Imaging for Prediction of Nutritional Quality of Goji Berry (Lycium barbarum L.). Foods 2021, 10, 1676. [Google Scholar] [CrossRef] [PubMed]
- Lei, X.-Q.; Wang, X.-L.; Li, G.; Fu, M.-H.; Zhang, X.-R.; Chen, F.-N. Rapid determination of seven components in Angelica sinensis based on near infrared spectroscopy. Chin. Tradit. Herb. Drugs 2019, 50, 3947–3954. [Google Scholar] [CrossRef]
- Wang, Y.; Tian, Z.-P.; Xie, J.-J.; Luo, Y.; Yao, J.; Shen, J. Rapid Determination of Polysaccharides in Cistanche tubulosa Using Near-Infrared Spectroscopy Combined with Machine Learning. J. AOAC Int. 2023, 106, 1118–1125. [Google Scholar] [CrossRef] [PubMed]
- He, G.; Lin, Q.; Yang, S.-B.; Wang, Y.-Z. A rapid identification based on FT-NIR spectroscopies and machine learning for drying temperatures of Amomum tsao-ko. J. Food Compos. Anal. 2023, 118, 105199. [Google Scholar] [CrossRef]
- Pan, S.; Zhang, H.; Li, Z.; Chen, T. Classification of Ginseng with different growth ages based on terahertz spectroscopy and machine learning algorithm. Optik 2021, 236, 166322. [Google Scholar] [CrossRef]
- Huang, L. Identification of the Origin and Content Analysis of Chinese Herbal Medicine Panax Notoginseng Based on Terahertz Time-Domain Spectroscopy; Xi’an University of Electronic Science and Technology: Xi’an, China, 2023. [Google Scholar]
- Yan, L.; Liu, C.; Qu, H.; Liu, W.; Zhang, Y.; Yang, J.; Zheng, L. Discrimination and Measurements of Three Flavonols with Similar Structure Using Terahertz Spectroscopy and Chemometrics. J. Infrared Millim. Terahertz Waves 2018, 39, 492–504. [Google Scholar] [CrossRef]
- Hebert, P.D.N.; Cywinska, A.; Ball, S.L.; deWaard, J.R. Biological identifications through DNA barcodes. Proc. R. Soc. B Biol. Sci. 2003, 270, 313–321. [Google Scholar] [CrossRef]
- Mishra, P.; Kumar, A.; Nagireddy, A.; Mani, D.N.; Shukla, A.K.; Tiwari, R.; Sundaresan, V. DNA barcoding: An efficient tool to overcome authentication challenges in the herbal market. Plant Biotechnol. J. 2016, 14, 8–21. [Google Scholar] [CrossRef]
- Han, J.; Pang, X.; Liao, B.; Yao, H.; Song, J.; Chen, S. An authenticity survey of herbal medicines from markets in China using DNA barcoding. Sci. Rep. 2016, 6, 18723. [Google Scholar] [CrossRef]
- Nehal, N.; Choudhary, B.; Nagpure, A.; Gupta, R.K. DNA barcoding: A modern age tool for detection of adulteration in food. Crit. Rev. Biotechnol. 2021, 41, 767–791. [Google Scholar] [CrossRef]
- Su, C.; Lin, Y.-X.; Wang, Q.; Hou, F.-J.; Zhang, L.-L.; Ma, D.-L.; Zheng, Y.-G.; Zheng, K.-Y. Morphological characteristics of leaves and DNA barcoding for identification of Mentha haplocalyx and its related species. Chin. Tradit. Herb. Drugs 2019, 50, 3667–3672. [Google Scholar] [CrossRef]
- Zheng, S.-H.; Shang, X.-P.; Zeng, Y.; Wang, J.-Y. Research on Identification of Two Plant Origins of Astragali Radix Based on Specific Molecular Marker Technology. Mod. Chin. Med. 2019, 21, 307–311. [Google Scholar]
- Li, L.; Josef, B.A.; Liu, B.; Zheng, S.; Huang, L.; Chen, S. Three-Dimensional Evaluation on Ecotypic Diversity of Traditional Chinese Medicine: A Case Study of Artemisia annua L. Front. Plant Sci. 2017, 8, 1225. [Google Scholar] [CrossRef] [PubMed]
- Chen, Z.; Gao, L.; Wang, H.; Feng, S. Molecular Identification and Phylogenetic Analysis of Cymbidium Species (Orchidaceae) Based on the Potential DNA Barcodes matK, rbcL, psbA-trnH, and Internal Transcribed Spacer. Agronomy 2024, 14, 933. [Google Scholar] [CrossRef]
- Chen, S.; Yao, H.; Han, J.; Liu, C.; Song, J.; Shi, L.; Zhu, Y.; Ma, X.; Gao, T.; Pang, X.; et al. Validation of the ITS2 Region as a Novel DNA Barcode for Identifying Medicinal Plant Species. PLoS ONE 2010, 5, e8613. [Google Scholar] [CrossRef] [PubMed]
- Yao, Q.; Zhu, X.; Han, M.; Chen, C.; Li, W.; Bai, H.; Ning, K. Decoding herbal materials of TCM preparations with the multi-barcode sequencing approach. Sci. Rep. 2022, 12, 5988. [Google Scholar] [CrossRef]
- Yu, J.-L.; Zhao, S.; Ren, M.-B.; Qian, Q.-N.; Pang, X.-H. Identification of Bupleurum chinense and B. longiradiatum based on ITS2 barcode. Zhongguo Zhong Yao Za Zhi 2014, 39, 2160–2163. [Google Scholar]
- Wang, X.; Liu, Y.; Wang, L.; Han, J.; Chen, S. A Nucleotide Signature for the Identification of Angelicae Sinensis Radix (Danggui) and Its Products. Sci. Rep. 2016, 6, 34940. [Google Scholar] [CrossRef]
- Gong, L.; Qiu, X.H.; Huang, J.; Xu, W.; Bai, J.Q.; Zhang, J.; Su, H.; Xu, C.M.; Huang, Z.H. Constructing a DNA barcode reference library for southern herbs in China: A resource for authentication of southern Chinese medicine. PLoS ONE 2018, 13, e0201240. [Google Scholar] [CrossRef]
- Li, X.; Yang, Y.; Henry, R.J.; Rossetto, M.; Wang, Y.; Chen, S. Plant DNA barcoding: From gene to genome. Biol. Rev. 2015, 90, 157–166. [Google Scholar] [CrossRef]
- Lu, M.-M.; Ci, X.-Q.; Yang, G.-P.; Li, J. DNA Barcoding of Subtropical Forest Trees: A Study from Ailao Mountains Nature Reserve, Yunnan, China. Plant Divers. Resour. 2013, 35, 733–741. [Google Scholar]
- Wang, X.-M.; Niu, X.-L.; Wei, N.; Ji, K.-P. ITS Sequence Used as DNA Barcode Applied in Chinese Herb Abrus cantoniensis. Genom. Appl. Biol. 2012, 31, 603–608. [Google Scholar] [CrossRef]
- Xin, T.; Li, R.; Lou, Q.; Lin, Y.; Liao, H.; Sun, W.; Guan, M.; Zhou, J.; Song, J. Application of DNA barcoding to the entire traditional Chinese medicine industrial chain: A case study of Rhei Radix et Rhizoma. Phytomedicine 2022, 105, 154375. [Google Scholar] [CrossRef]
- Yeo, D.; Srivathsan, A.; Meier, R. Longer is Not Always Better: Optimizing Barcode Length for Large-Scale Species Discovery and Identification. Syst. Biol. 2020, 69, 999–1015. [Google Scholar] [CrossRef]
- Song, M.; Dong, G.-Q.; Zhang, Y.-Q.; Liu, X.; Sun, W. Identification of processed Chinese medicinal materials using DNA mini-barcoding. Chin. J. Nat. Med. 2017, 15, 481–486. [Google Scholar] [CrossRef]
- Liu, Y.; Xiang, L.; Zhang, Y.; Lai, X.; Xiong, C.; Li, J.; Su, Y.; Sun, W.; Chen, S. DNA barcoding based identification of Hippophae species and authentication of commercial products by high resolution melting analysis. Food Chem. 2018, 242, 62–67. [Google Scholar] [CrossRef]
- Parveen, I.; Techen, N.; Khan, I.A. Identification of Species in the Aromatic Spice Family Apiaceae Using DNA Mini-barcodes. Planta Med. 2023, 85, 151–170. [Google Scholar] [CrossRef]
- Ahmed, S.S. DNA Barcoding in Plants and Animals: A Critical Review. Preprints 2022, 1–31. [Google Scholar] [CrossRef]
- Ruhsam, M.; Rai, H.S.; Mathews, S.; Ross, T.G.; Graham, S.W.; Raubeson, L.A.; Mei, W.; Thomas, P.I.; Gardner, M.F.; Ennos, R.A.; et al. Does complete plastid genome sequencing improve species discrimination and phylogenetic resolution in Araucaria? Mol. Ecol. Resour. 2015, 15, 1067–1078. [Google Scholar] [CrossRef]
- Zhang, N.; Erickson, D.L.; Ramachandran, P.; Ottesen, A.R.; Timme, R.E.; Funk, V.A.; Luo, Y.; Handy, S.M. An analysis of Echinacea chloroplast genomes: Implications for future botanical identification. Sci. Rep. 2017, 7, 216. [Google Scholar] [CrossRef] [PubMed]
- Yang, J.-B.; Yang, S.-X.; Li, H.-T.; Yang, J.; Li, D.-Z. Comparative Chloroplast Genomes of Camellia Species. PLoS ONE 2013, 8, e73053. [Google Scholar] [CrossRef] [PubMed]
- Kane, N.; Sveinsson, S.; Dempewolf, H.; Yang, J.Y.; Zhang, D.; Engels, J.M.M.; Cronk, Q. Ultra-barcoding in cacao (Theobroma spp.; Malvaceae) using whole chloroplast genomes and nuclear ribosomal DNA. Am. J. Bot. 2012, 99, 320–329. [Google Scholar] [CrossRef]
- Taberlet, P.; Coissac, E.; Pompanon, F.; Brochmann, C.; Willerslev, E. Towards next-generation biodiversity assessment using DNA metabarcoding. Mol. Ecol. 2012, 21, 2045–2050. [Google Scholar] [CrossRef] [PubMed]
- Raclariu, A.C.; Heinrich, M.; Ichim, M.C.; de Boer, H. Benefits and Limitations of DNA Barcoding and Metabarcoding in Herbal Product Authentication. Phytochem. Anal. 2018, 29, 123–128. [Google Scholar] [CrossRef] [PubMed]
- Chakraborty, A.; Aranishi, F.; Iwatsuki, Y. Polymerase chain reaction–restriction fragment length polymorphism analysis for species identification of hairtail fish fillets from supermarkets in Japan. Fish. Sci. 2007, 73, 197–201. [Google Scholar] [CrossRef]
- Urumarudappa, S.K.J.; Tungphatthong, C.; Prombutara, P.; Sukrong, S. DNA metabarcoding to unravel plant species composition in selected herbal medicines on the National List of Essential Medicines (NLEM) of Thailand. Sci. Rep. 2020, 10, 18259. [Google Scholar] [CrossRef]
- Dong, W.-P.; Xu, C.; Li, C.-H.; Sun, J.-H.; Zuo, Y.-J.; Shi, S.; Cheng, T.; Guo, J.; Zhou, S. ycf1, the Most Promising Plastid DNA Barcode of Land Plants. Sci. Rep. 2015, 5, 8348. [Google Scholar] [CrossRef]
- Yang, J.; Dong, L.-l.; Wei, G.-f.; Hu, H.-y.; Zhu, G.-w.; Zhang, J.; Chen, S.-l. Identification and quality analysis of Panax notoginseng and Panax vietnamensis var. fuscidicus through integrated DNA barcoding and HPLC. Chin. Herb. Med. 2018, 10, 177–183. [Google Scholar] [CrossRef]
- Shen, L.; Zhang, M.; Qiu, Y.; Yang, L.; Lu, Y.; Li, H.; Zhang, L.; Tang, F.; Wang, F.; Zhu, C.; et al. DNA barcoding combined with high-resolution melting analysis to discriminate rhubarb species and its traditional Chinese patent medicines. Front. Pharmacol. 2024, 15, 1371890. [Google Scholar] [CrossRef]
- Chen, S.; Pang, X.; Song, J.; Shi, L.; Yao, H.; Han, J.; Leon, C. A renaissance in herbal medicine identification: From morphology to DNA. Biotechnol. Adv. 2014, 32, 1237–1244. [Google Scholar] [CrossRef]
- Zhao, L.-L.; Feng, S.-J.; Tian, J.-Y.; Wei, A.-Z.; Yang, T.-X. Internal transcribed spacer 2 (ITS2) barcodes: A useful tool for identifying Chinese Zanthoxylum. Appl. Plant Sci. 2018, 6, e01157. [Google Scholar] [CrossRef] [PubMed]
- Zhu, S.; Li, Q.; Chen, S.; Wang, Y.; Zhou, L.; Zeng, C.; Dong, J. Phylogenetic analysis of Uncaria species based on internal transcribed spacer (ITS) region and ITS2 secondary structure. Pharm. Biol. 2018, 56, 548–558. [Google Scholar] [CrossRef] [PubMed]
- Minami, M.; Tanaka, R.; Mori, T.; Fujii, T.; Tsuchida, T. Identification of Angelica acutiloba, A. sinensis, and other Chinese medicinal Apiaceae plants by DNA barcoding. J. Nat. Med. 2024, 78, 792–798. [Google Scholar] [CrossRef] [PubMed]
- Li, Z.; Duan, B.; Zhou, Z.; Fang, H.; Yang, M.; Xia, C.; Zhou, Y.; Wang, J. Comparative analysis of medicinal plants Scutellaria baicalensis and common adulterants based on chloroplast genome sequencing. BMC Genom. 2024, 25, 39. [Google Scholar] [CrossRef]


| Image/Spectrum Acquisition Method | Herbal Medicine Name/Category | Method/Model | Result Analysis | Reference |
|---|---|---|---|---|
| Fritillaria Zhejiang | CNN, PCA, SVM, PLS-DA | The CNN model achieved accuracy rates of 98.88% on the training set and 88.89% on the test set, indicating the potential advantages of deep learning methods in hyperspectral data processing. | [127] | |
| Hyperspectral Imaging | Goji Berry | PLSR, PCA, IPLS | The PLSR model predicted Vitamin C in the NIR region with an R2 value of 0.91. For phenols, SSC, and TA, better predictions were obtained in the VIS–NIR region, with R2 values of 0.62, 0.94, and 0.84, respectively. | [128] |
| Angelica, Salvia miltiorrhiza | PLS, UPLC | Predicted values for most samples closely matched UPLC-measured values, with trends that were generally consistent, confirming the model’s reliability. | [129] | |
| Near-Infrared Spectroscopy | Cistanche | RF, PLS, PCR, SVM, SG, SNV, MSC | The RF model achieved a calibration set R2 of 0.9763 and a RMSE of 0.3527%. For the prediction set, the RF model yielded an R2 of 0.9230, RMSEP of 0.5130%, and an RPD of 3.33. | [130] |
| Amomum | PCA, PLS-DA, SVM, ResNet | The ResNet model based on synchronized 2D-COS images showed superior generalization and accuracy in identifying Amomum at different drying temperatures. | [131] | |
| Ginseng | SVM, GA, SPCS, PCA | Through 30 repeated experiments, the SPCS–SVM model maintained high accuracy, while the CS–SVM and GA–SVM models exhibited lower and more fluctuating accuracy. | [132] | |
| Terahertz Time-Domain Spectroscopy | Panax Notoginseng | SVM, LAWOA, 2DCOS, CARS, SVR | The LAWOA–SVM model effectively distinguished Panax Notoginseng from different origins, achieving over 98% accuracy. | [133] |
| Flavonoids | KNN, ELM, RF, PLSR, LS-SVM | In qualitative identification, the RF model achieved 100% CCR on the prediction set. In the quantitative model, the LS–SVM model showed better prediction results. | [134] |
| Herbal Medicine Name/Category | Barcode Markers Used | Reference |
|---|---|---|
| Ginseng, Vietnamese Ginseng Varieties | ITS2 | [166] |
| Different Species and Sources of Rhubarb | ITS2, psbA-trnH, rbcL | [167] |
| Fo-ti, Codonopsis | ITS2, psbA-trnH | [168] |
| 13 Varieties of Chinese Sichuan Pepper | ITS2, ETS, trnH-psbA | [169] |
| Goji Berry | ITS | [170] |
| Angelica, Chuanxiong, European Angelica | psbA-trnH, ITS | [171] |
| Scutellaria baicalensis and its Adulterants | matK, rpl32-trnL, ndhF-rpl32, trnL-trnF | [172] |
Disclaimer/Publisher’s Note: The statements, opinions and data contained in all publications are solely those of the individual author(s) and contributor(s) and not of MDPI and/or the editor(s). MDPI and/or the editor(s) disclaim responsibility for any injury to people or property resulting from any ideas, methods, instructions or products referred to in the content. |
© 2025 by the authors. Licensee MDPI, Basel, Switzerland. This article is an open access article distributed under the terms and conditions of the Creative Commons Attribution (CC BY) license (https://creativecommons.org/licenses/by/4.0/).
Share and Cite
Jiang, Y.; Wei, S.; Ge, H.; Zhang, Y.; Wang, H.; Wen, X.; Guo, C.; Wang, S.; Chen, Z.; Li, P. Advances in the Identification Methods of Food-Medicine Homologous Herbal Materials. Foods 2025, 14, 608. https://doi.org/10.3390/foods14040608
Jiang Y, Wei S, Ge H, Zhang Y, Wang H, Wen X, Guo C, Wang S, Chen Z, Li P. Advances in the Identification Methods of Food-Medicine Homologous Herbal Materials. Foods. 2025; 14(4):608. https://doi.org/10.3390/foods14040608
Chicago/Turabian StyleJiang, Yuying, Shilei Wei, Hongyi Ge, Yuan Zhang, Heng Wang, Xixi Wen, Chunyan Guo, Shun Wang, Zhikun Chen, and Peng Li. 2025. "Advances in the Identification Methods of Food-Medicine Homologous Herbal Materials" Foods 14, no. 4: 608. https://doi.org/10.3390/foods14040608
APA StyleJiang, Y., Wei, S., Ge, H., Zhang, Y., Wang, H., Wen, X., Guo, C., Wang, S., Chen, Z., & Li, P. (2025). Advances in the Identification Methods of Food-Medicine Homologous Herbal Materials. Foods, 14(4), 608. https://doi.org/10.3390/foods14040608